Article

A Life Cycle Assessment of HDPE Plastic Milk Bottle Waste Within Concrete Composites and Their Potential in Residential Building and Construction Applications

The Institute for Sustainable Industries and Liveable Cities, College of Sport, Health and Engineering, Victoria University, Melbourne, VIC 3011, Australia
Urban Sci. 2025, 9(4), 116; https://doi.org/10.3390/urbansci9040116
Submission received: 1 March 2025 / Revised: 26 March 2025 / Accepted: 3 April 2025 / Published: 7 April 2025

Abstract

Plastic waste management remains a significant global challenge, with limited recycling opportunities contributing to its status as one of the highest waste producers. In Australia, the recovery rate for plastic waste is 12.5%, resulting in a high percentage of plastics being landfilled. Common disposal methods, such as incineration and landfilling, are environmentally damaging, with incineration emitting harmful gases and landfilling causing contamination. Recycling, while preferable, faces difficulties due to contamination and infrastructure challenges. However, alternative solutions, such as integrating waste plastic into concrete, present an opportunity to both reduce plastic waste and enhance the economic value of recycled materials. This study evaluates the potential of waste plastic milk bottles (PMBs) in residential concrete by assessing their mechanical strength, environmental impact, and variability in greenhouse gas (GHG) emissions. This study demonstrated that replacing up to 10% of cement with silica fume-modified plastic milk bottle (SFPMB) waste granules maintained comparable compressive strength to traditional concrete. The addition of metakaolin to the SFPMB mix design (SFMKPMB) further improved the material’s strength by 28%. Life cycle assessment (LCA) results revealed reductions in global warming potential (GWP), human toxicity potential (HTP), and fossil depletion potential (FDP), with SFMKPMB showing the greatest environmental savings. A Monte Carlo simulation evaluated variability factors, revealing that additional transportation and energy requirements increased GHG emissions, though the SFMKPMB mix ultimately resulted in the lowest overall material GHG emissions. This study demonstrates the complexity of assessing “green” materials and highlights how material variability and energy use can influence the sustainability of waste-derived composites. Despite challenges, incorporating waste plastics into concrete offers a promising strategy for mitigating landfill waste and reducing environmental impacts, especially as renewable energy adoption increases.

1. Introduction

The management of plastic waste remains a major challenge worldwide. Plastic waste remains one of the highest waste contributors due to the lack of recycling opportunities [1]. While other waste materials, such as cardboard and cotton fabrics, contribute to waste issues, these materials are often sourced from sustainable materials, such as trees and plants [2,3]. The repurposing difficulties of waste plastics include contamination, various molecular structures, high costs, and lack of infrastructure [4]. This was shown in Australia, where plastic waste had the lowest recovery rate at 12.5% [5]. Moreover, between 2022–2023, Australia produced 3 million tons (Mt) of plastic waste. Although this number is significantly less than other waste materials such as metals (6 Mt), paper and cardboard (4.9 Mt), and construction waste (26.8 Mt), which had recovery rates of 90%, 56%, and 84%, respectively. Due to the low recovery rate of plastics, 87.5% of plastic resulted in landfill [5]. Currently, there are three primary methods for disposing of plastic waste: incineration, landfilling, and recycling. Incineration releases harmful gases, such as dioxins, which contaminate the air. Additionally, the residue from incineration often contains heavy metals, presenting serious environmental risks. Landfilling plastic waste takes up large areas of land and can cause ground and water contamination [6]. Among the various methods for managing waste plastics, converting them into useful products holds more promise. This approach not only reduces the need for virgin plastic but also enhances the economic value of waste. Additionally, it has been reported that recycling waste plastic by stabilizing it in concrete or creating useful products through secondary recycling results in lower environmental impacts compared to processes like pyrolysis and incineration [7,8].
In 2018, GHG emissions from plastic production reached 850 Mt of CO2, with projections estimating this will rise to 2.8 billion tonnes (Bt) by 2050 [9]. Global plastic waste generation hit 242 Mt in 2016, and this is expected to grow to 2.2 Bt by 2025 [10]. In the U.S., 35.7 Mt of plastic was generated in 2018, accounting for 12.2% of all municipal solid waste (MSW). A significant portion of this waste consisted of containers and packaging, such as bags, wraps, polyethylene terephthalate (PET) bottles, high-density polyethylene (HDPE) bottles, appliances, and furniture. That same year, 27 Mt of plastic waste ended up in landfills, making up 18.5% of the total MSW landfilled in the U.S. While the recycling rate for HDPE was 29.3%, less than 10% of overall plastic waste was recycled [11]. Plastic waste has severe environmental consequences, with around 150 million metric tons of plastic currently in the ocean, and this number grows annually. This pollution threatens marine life and ecosystems, costing approximately USD 13 billion every year [12]. Additionally, the breakdown of plastics results in microplastics, which are ingested by humans. Studies show that individuals consume between 39,000 and 52,000 microplastic particles annually, raising concerns about potential health risks [13]. As plastic production continues to rise, finding alternative methods to dispose of plastic waste in an environmentally safe way is becoming increasingly urgent.
Researchers have often focused on the utilisation of waste in building materials due to the construction sector creating an abundance of waste and high greenhouse gas (GHG) emissions [14,15]. Due to the high-volume use of concrete and its negative environmental impacts, this material has often been researched with novel materials [16]. Cement within concrete creates 5–8% of total carbon emissions (CO2) per year due to the high energy requirement when converting the raw material into a building product [17]. Cement is predominantly limestone, and the use of the material is not seen as sustainable due to the extraction of the raw material [18]. Therefore, research has aimed to reduce the requirement of cement by substituting it with alternative materials [19,20]. Industrial wastes, such as silica fume (SF), fly ash (FA), and ground blast furnace slag (GBFS), have been a heavy research focus due to their pozzolanic properties and ability to increase the mechanical strength of concrete [21,22,23,24]. Other materials, like metakaolin (MK), are considered a sustainable alternative because they require less energy to produce the final building product [25]. However, as green energy becomes more prevalent in the future, industrial wastes will become less available, thereby increasing demand and increasing costs. Therefore, research utilising common household wastes needs to be integrated with more materials to create a circular economic approach [26].
Kumar and Kumar [27] utilised recycled plastic waste HDPE as a coarse aggregate in concrete composite materials. Their research combined sand and rock dust with the melted waste to create the aggregate mix. Their findings revealed a lightweight aggregate alternative that improved crack propagation and compressive strength. It is important to note that the increase in the aggregate size increases the compressive strength. Lim et al. [28] demonstrated the use of HDPE, polypropylene (PP), polystyrene (PS), and PET within asphalt concrete. Their research exhibited improved moisture resistance, modulus of rupture, and abrasion performance when integrating the various plastic waste materials. This study highlights further use of the recycled materials to be used in both civil and residential construction. Moreover, researchers have integrated waste PET, PP, and HDPE within traditional brick systems [29]. The use of 35–45% of plastic waste within the novel bricks improved the compressive strength. However, scanning electron microscope images demonstrated cavities on the surface structure of PET bricks. This could result in an increase in porosity in the material, resulting in a less durable product. However, HDPE bricks demonstrated the highest mechanical strengths and lowest water absorption compared to PP and PET bricks. Novel materials have provided promising results within residential concrete slabs. Heweidak, Kafle, and Ameri [30] integrated basalt fibres within self-compacting geopolymer concrete. Their findings revealed a composite concrete slab that achieved a compressive strength of 32 MPa, exceeding common residential concrete slab requirements [31]. Youssf et al. [32], utilised crumb rubber waste in concrete for residential slab purposes. Their findings revealed the waste material concrete achieved 23.8 MPa at 28 days of ageing, which was 5.4 MPa lower than the control. However, the achieved strength can still be suitable for residential concrete purposes. It is important to note that achieving a high strength of concrete with waste material integration can be challenging without adding a significant amount of both cement and coarse aggregate. Therefore, when aiming to achieve a sustainable alternative to traditional concrete, the materials’ intended purpose must be maintained.
The current study aims to assess and quantitatively benchmark the environmental sustainability of partially substituting cement with HDPE waste plastic milk bottles (PMBs) in concrete. It is important to note that the use of alternate waste sources utilizing HDPE could also be used as a comparative analysis. Life cycle assessment (LCA) is a commonly used method to evaluate the environmental impacts, energy consumption, and potential emission reductions of products or processes throughout their lifecycle [33]. LCA results provide valuable insights that guide decision-making regarding policies and sustainable investment opportunities [34,35]. As the promotion of novel materials grows, it is crucial to benchmark their environmental benefits. However, while several LCA studies on concrete materials have been conducted [36,37,38,39], few have focused on integrating waste materials from the residential and commercial sectors, and none have explored the inclusion of PMB in concrete. To assess the environmental impact of residential-grade concrete, three strategies will be employed in this LCA. First, the optimal compressive strength of PMB-based concrete composites will be determined through modifications using silica fume and metakaolin matrices. Second, key LCA impact categories will be selected and measured. Lastly, a sensitivity analysis will be conducted to evaluate and reduce the variable factors in concrete production. This paper aims to demonstrate the feasibility of integrating waste plastic milk bottles into concrete and highlight its environmental impact when used as a construction material.

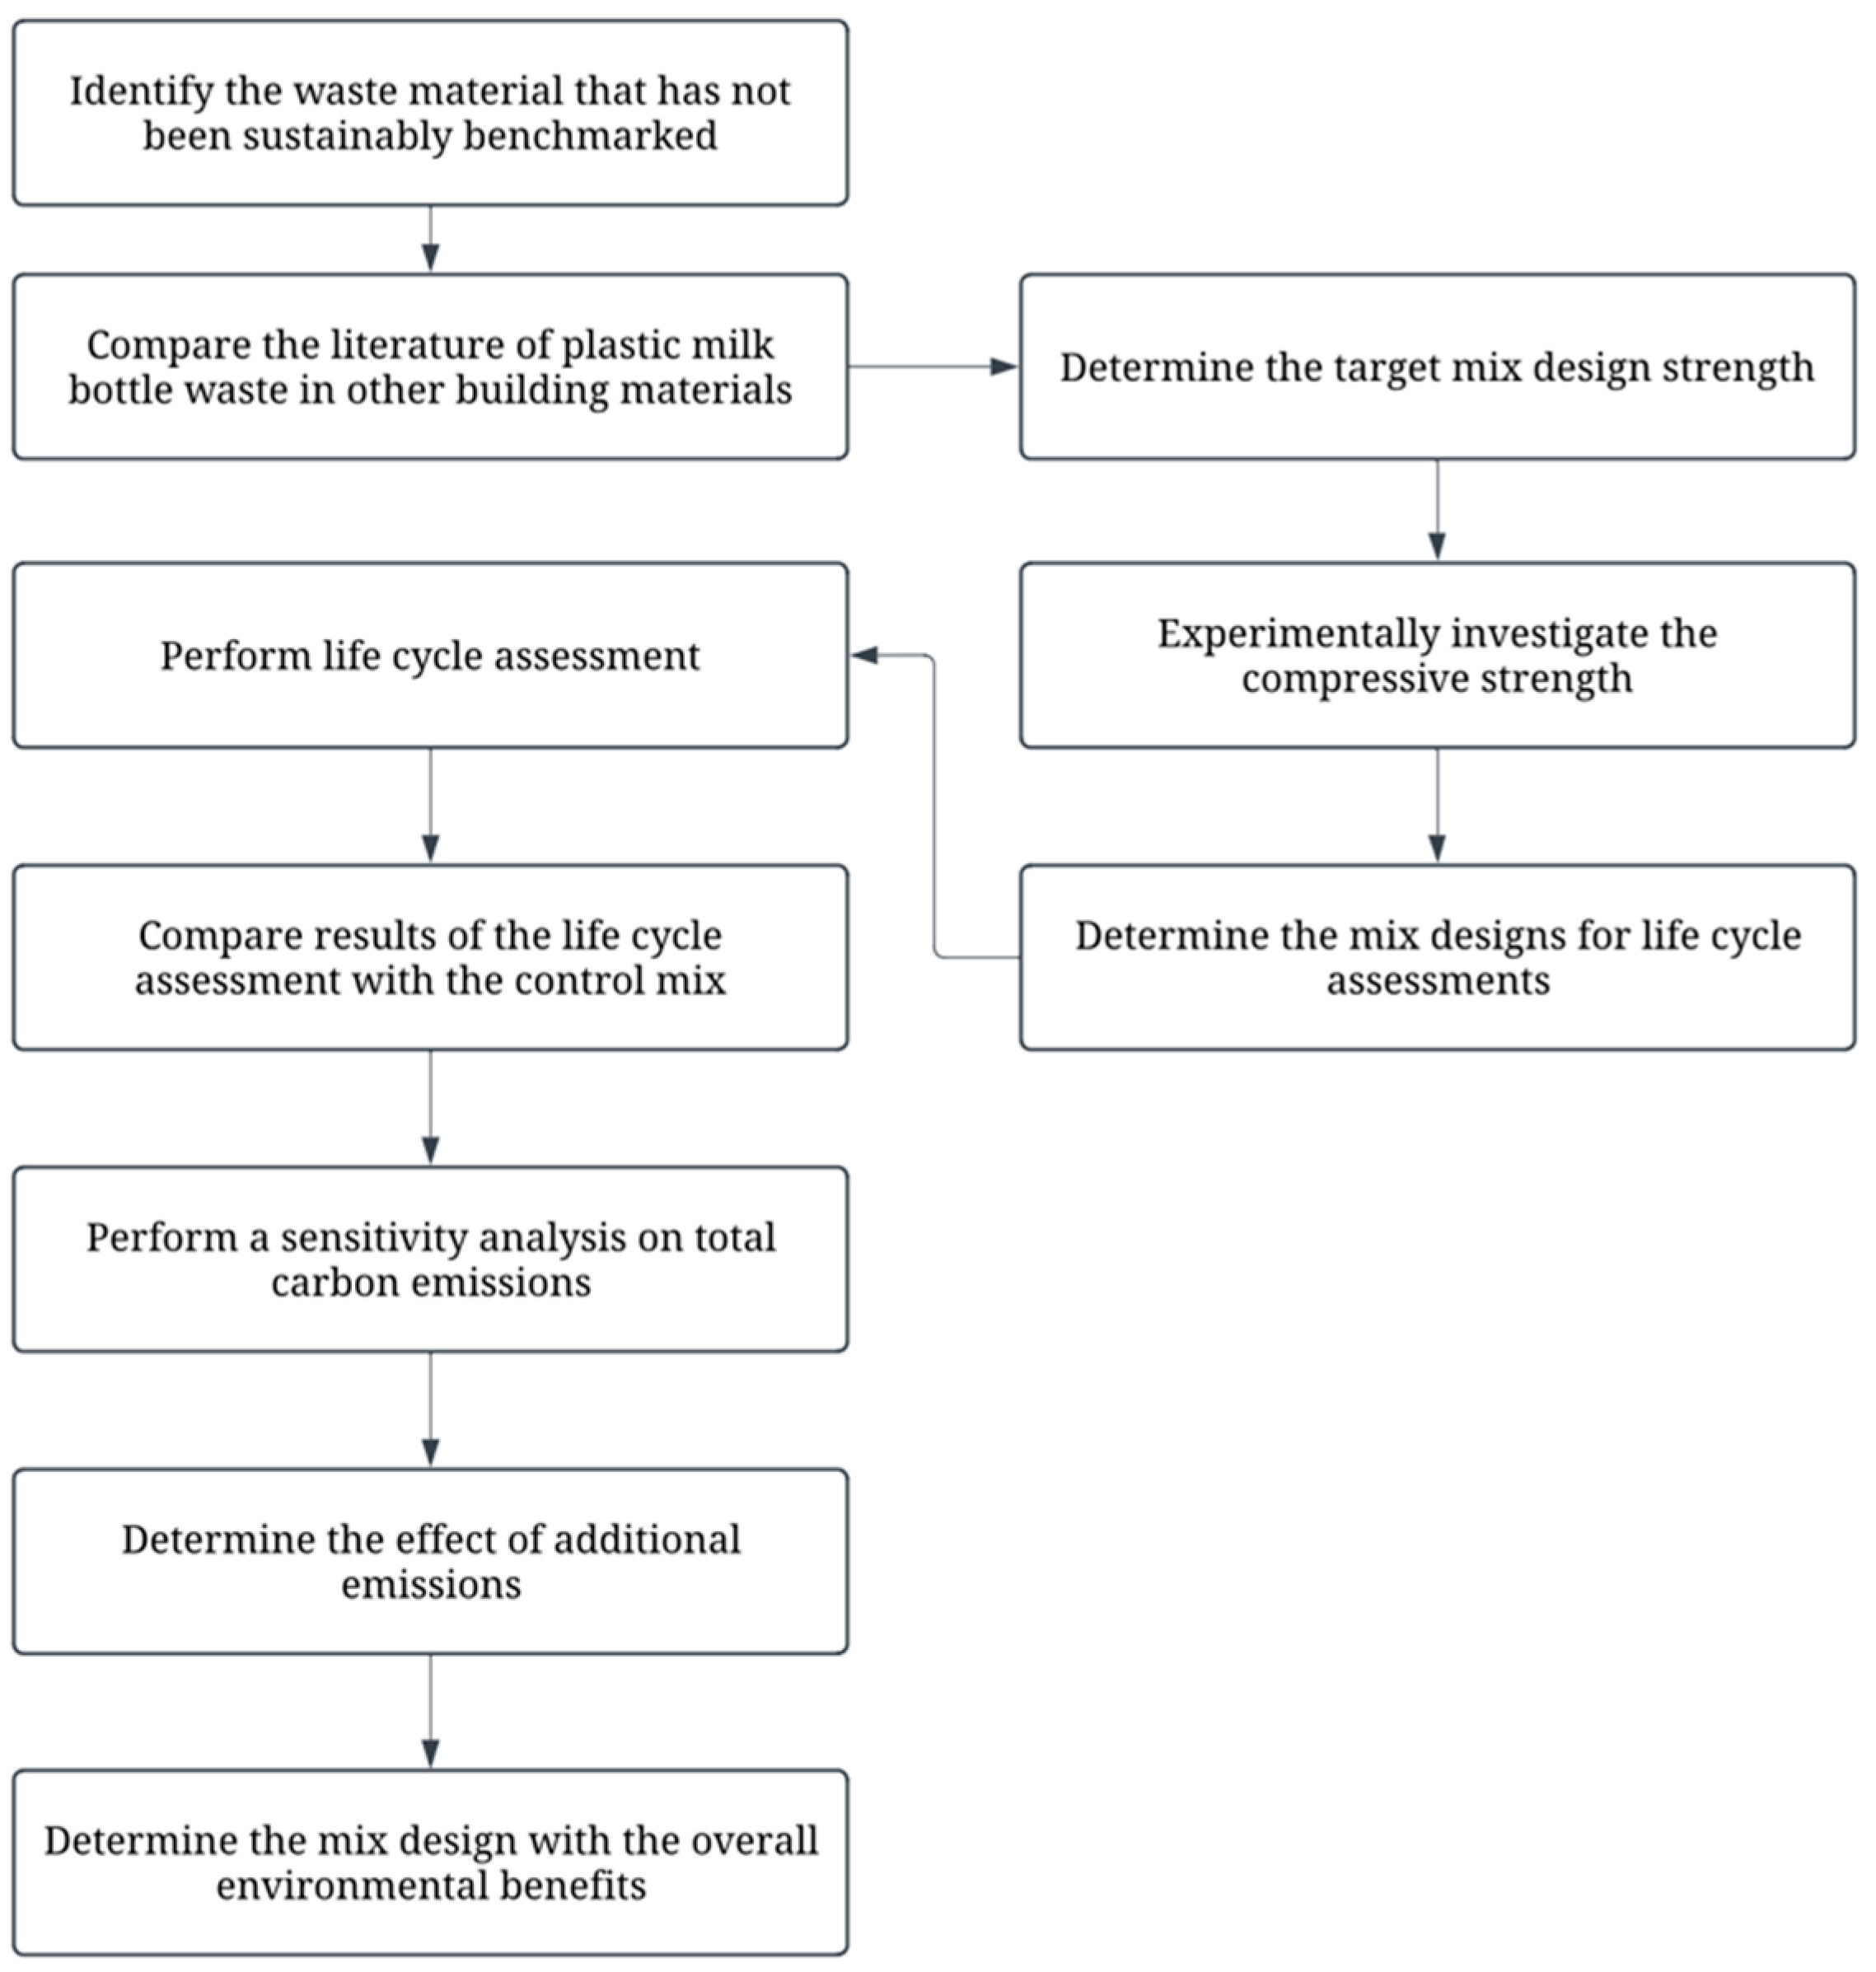
2. Research Methodology

This study aims to investigate the compressive strength properties of waste plastic milk bottle granules within a concrete composite system. The objective is to identify an optimal concrete composite mix design that can be assessed for its environmental performance. Additionally, a thorough sustainability analysis will be conducted to evaluate the impact of sensitivity factors on the overall system. Figure 1 illustrates the overall methodology system for this study.

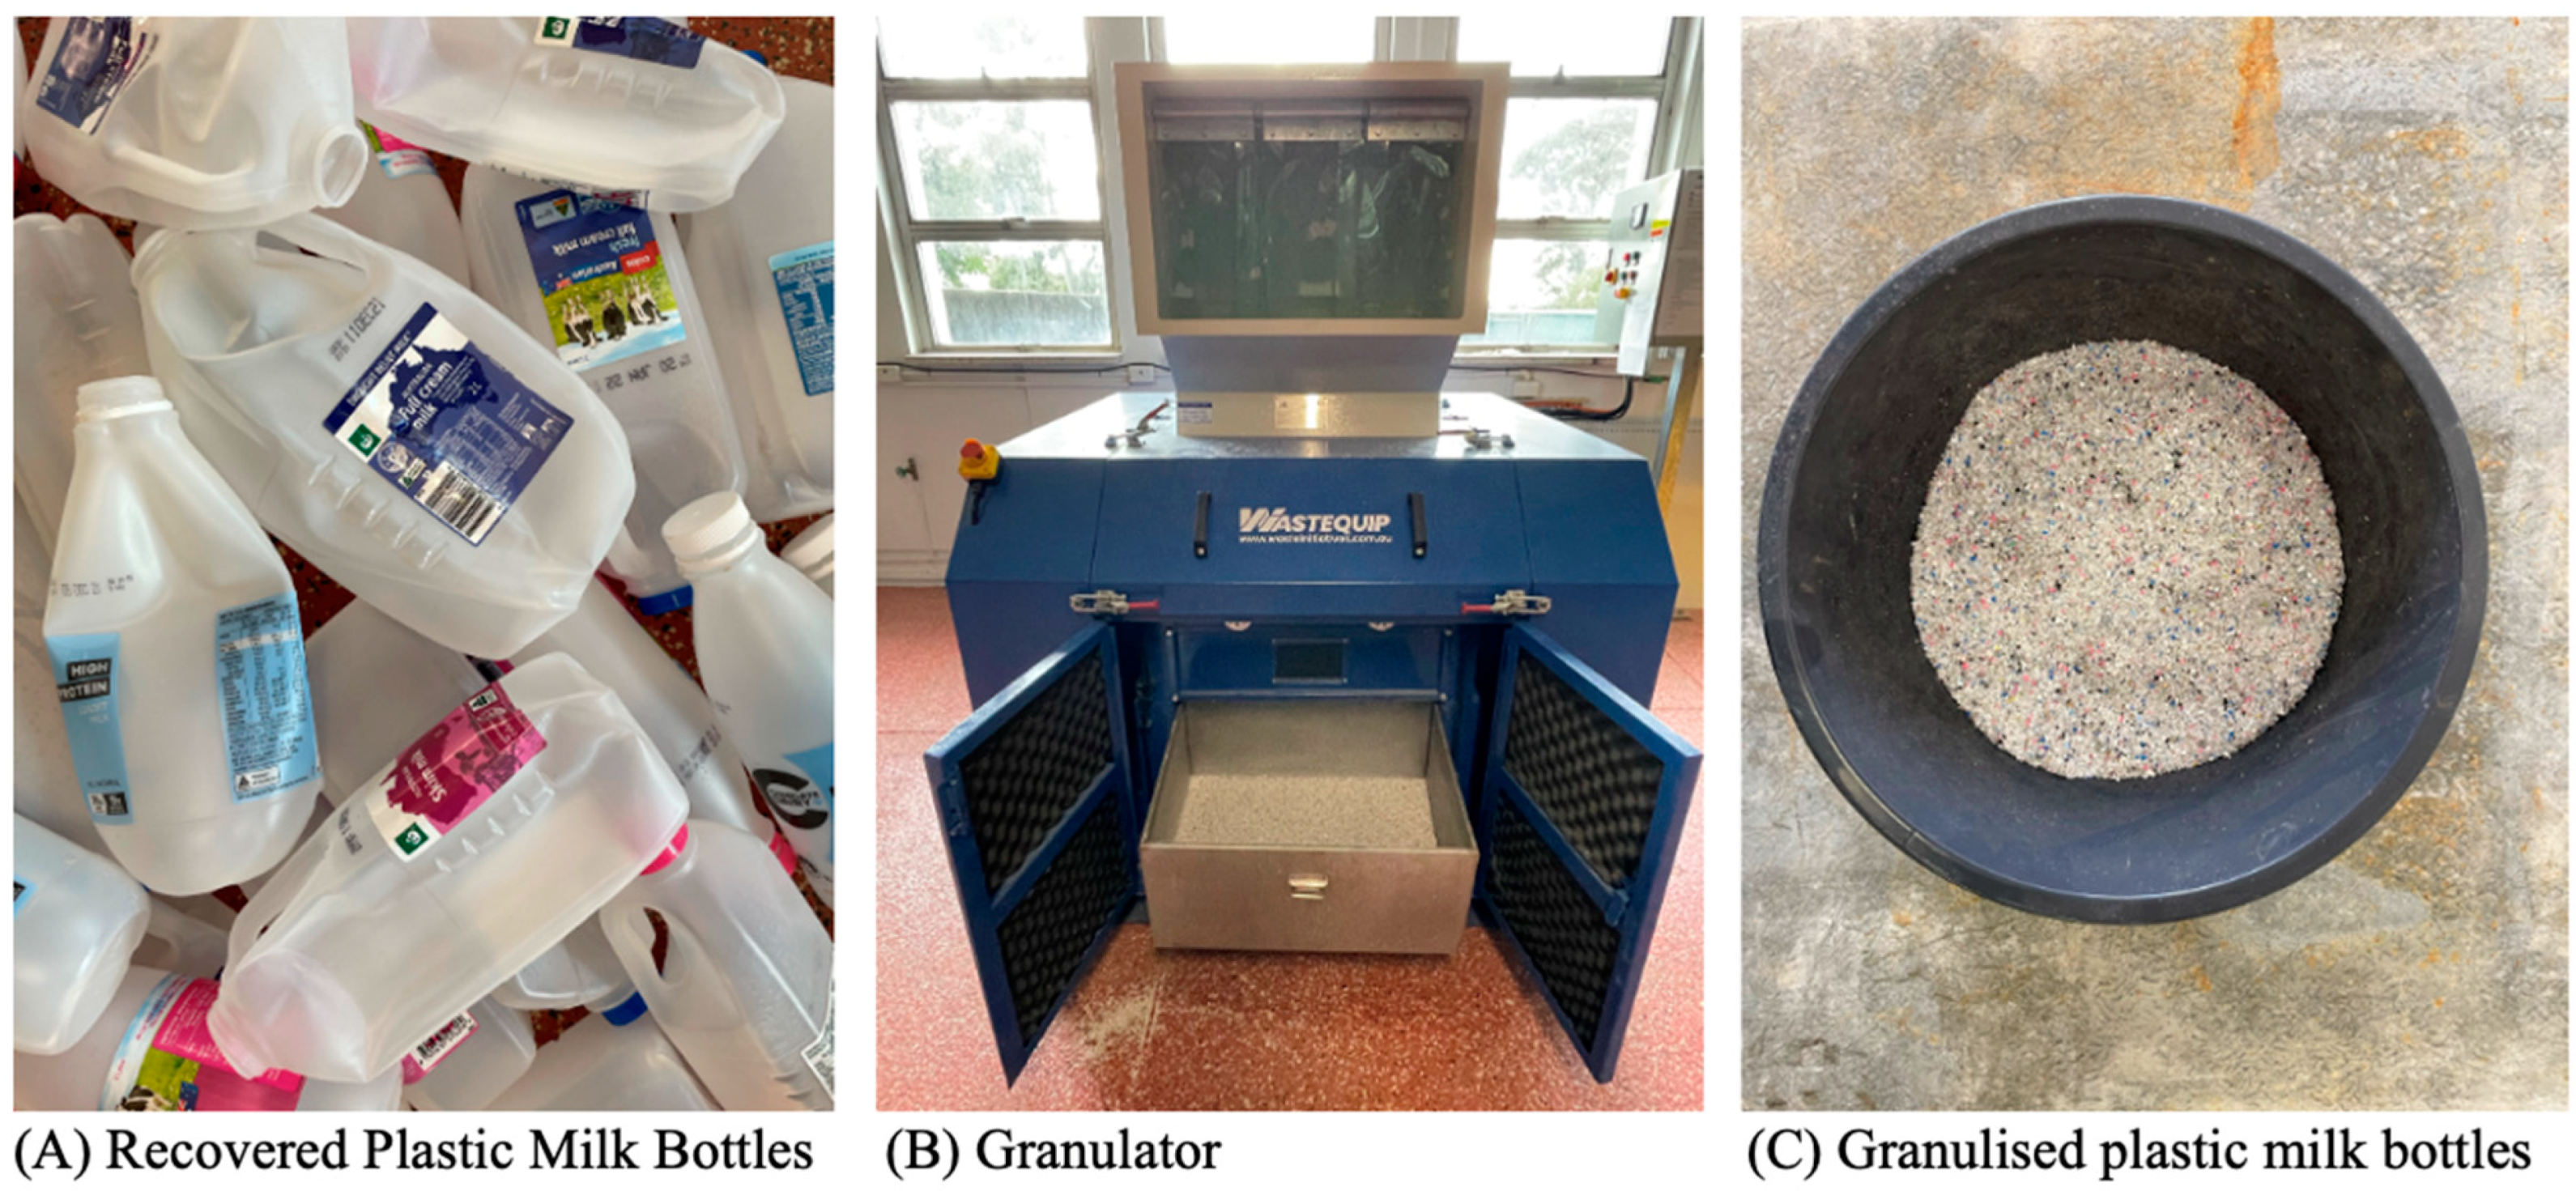
2.1. Materials and Mechanical Testing

Compressive strength testing was performed using the Matest C088-11 N Servo-Plus Evolution testing machine and the Cyber-Plus Evolution data acquisition system. This equipment was sourced from Matest innovative global manufacturer, Treviolo, Italy. The constituent materials were mixed with a mortar mixer, following the guidelines in AS/NZS 1012.2 [40]. Silica fume (SF) was applied to the plastic fibres as a modification method in compliance with AS/NZS 3582.3 [41]. Matrix modification using metakaolin (MK) was carried out according to ASTM C-618 [42] Class N specifications for natural pozzolans. Fine and coarse aggregates were sourced in accordance with AS/NZS 1141.5 [43] and AS/NZS 1141.6.2 [44], respectively. General-purpose cement was used in line with AS/NZS 3972 [45], and its composition is provided in Table 1. Regular potable water was used in all mix designs. All samples were prepared in a controlled laboratory environment in accordance with AS/NZS 1012.8.2 [46]. Figure 2 demonstrates the raw materials recycled for use within the granulator system, alongside the output from the granulator for concrete integration.

2.2. Life Cycle Assessment

To assess the environmental impacts of concrete made with the chosen waste material, a Life Cycle Assessment (LCA) approach was employed. This study used OpenLCA software MPL 2.0 alongside the Ecoinvent 3.4 database [47,48]. The LCA methodology followed in this study adhered to the guidelines outlined in ISO 14044 [49]. As per ISO 14044, the LCA process consists of four main stages: scope definition, inventory analysis, impact assessment, and interpretation.

2.2.1. Scope, Functional Unit, and System Boundary

Previous LCA studies have compared the environmental benefits of incorporating various waste materials into cementitious composites, highlighting their environmental impacts [50,51,52,53,54,55]. However, based on recent reviews, this study is the first to explore the environmental impacts of reusing HDPE milk bottle waste as a cement replacement in concrete. Consequently, this LCA focuses on identifying, comparing, and analysing the environmental impacts of producing concrete with milk bottle HDPE waste as a partial substitute for cement. The results aim to demonstrate the feasibility of diverting milk bottle waste from landfills and showcase the potential environmental benefits. All concrete mixes were produced at a laboratory scale to facilitate effective comparisons of the novel materials while minimizing unknown variables.
In this study, the functional unit for concrete was defined as 1 m3. This functional unit serves as a reference for the input and output data, providing a crucial measurement for interpreting the results [56]. This study adopted a cradle-to-gate system boundary, as illustrated in Figure 3, to comparatively evaluate the environmental impacts. The cradle-to-gate process encompasses the extraction, transportation, production, and distribution of the final concrete materials to the construction site. The maintenance, service life, and disposal of the different concrete mix designs were assumed to be identical and, thus, were excluded from the system boundary.

2.2.2. Life Cycle Inventory Analysis

A laboratory process was employed to successfully integrate plastic milk bottle waste into concrete composites [57]. The milk bottle waste used in this study was sourced from a locally available material recovery centre. The milk bottles underwent a transformation process to be used as a constituent material in concrete. The waste was converted into a granule material through a granulator machine. LCA was performed on four different mix designs to assess the environmental impacts for future use within residential construction applications.
The mix compositions are presented in Table 2. The samples included the control, PMB (raw plastic milk bottle), SFPMB (silica fume-modified plastic milk bottle), and SFMKPMB (silica fume-modified plastic milk bottle with metakaolin as a matrix modifier). It is important to note that surface modification was applied using silica fume (SF) on the plastic milk bottle granules, with a maximum loading of 2% of the total waste plastic content. This amount has been shown to be effective in enhancing waste material durability in highly alkaline environments [58]. Furthermore, the application of SF improves the mechanical strength of cementitious composites, reduces permeability, and helps prevent thermal cracking [59]. All waste plastic milk bottle specimens contained a 10% cement substitution. In addition to the waste plastic-modified concrete samples, matrix modification was applied using metakaolin at a 5% cement replacement rate on specimen SFMKPMB. Metakaolin is produced by heating kaolin clay between 600 and 850 °C, a process that converts the mineral kaolinite into metakaolin [60]. The use of metakaolin as a supplementary cementitious material (SCM) offers a sustainable alternative to cement, as it requires significantly less energy [61].
The energy requirements and sources for all constituent materials, such as fine aggregate, coarse aggregate, metakaolin, and general-purpose cement, are shown in Table 3. The concrete mix designs were based on a target compressive strength of 25 MPa. Additional energy and transportation requirements were needed for processing and integrating the milk bottle plastic waste. However, all other materials were assumed to be transported to a single batching plant for concrete production.

2.2.3. Life Cycle Impact Assessment

A Life Cycle Impact Assessment (LCIA) consists of three key elements: selecting impact categories, classifying those categories, and calculating the results for each category. This section quantifies the environmental impacts. The research adopts a problem-oriented approach, also known as the “midpoint method”. This method correlates to environmental categories that this study will identify, compare, and analyse. In line with current global environmental concerns, the following eight impact categories were chosen: Terrestrial Acidification Potential (TAP100 in kgSO2-eq), Global Warming Potential 100-years (GWP100 in kgCO2-eq), Terrestrial Ecotoxicity Potential 100-years (TETP100 in kg 1,4-DCB-eq), Marine Eutrophication Potential 100-years (MEP in kg-N-eq), Human Toxicity Potential 100-years (HTP100 in kg 1,4-DCB-eq), Ozone Depletion Potential 100-years (ODP100 in kg CFC-11-eq), Freshwater ecotoxicity 100-years (FETP100 in kg 1,4-DCB-eq), and Fossil Depletion 100-years (FDP in kg oil-eq). Normalization factors for each impact category are summarized in Table 4. The ReCiPe Hierarchist (h) Midpoint method was employed, which combines the Eco-Indicator 99 and CML baselines. OpenLCA software, using the Ecoinvent 3.4 database, was utilized to model material and energy flows within the system boundary considered.

2.2.4. Limitations and Assumptions

The scope and system boundaries of LCA studies are shaped by limitations and assumptions that align with the research scope and objectives. This study includes the following assumptions and limitations:
  • It was assumed that the lifespan of the custom mix designs is the same as that of the control mix.
  • This study did not account for end-of-life behaviours, assuming that all mix designs would have similar end-of-life considerations.
  • The supply of processed waste plastic milk bottles was assumed to be locally available in sufficient quantities.
  • In cases where emission inventories were unavailable, emission factors from published literature were used.
  • The conversion of waste plastic milk bottles into granule material was assumed to occur at the waste recovery centre.
  • An equal transportation distance of 21 km was assumed for delivering fine, coarse, and cement materials to the concrete batching plant.
  • The mortar mixer was assumed to consume 4 kWh to produce 1 cubic meter of concrete.
  • Conventional potable water treatment was assumed, with the corresponding emission inventories adopted from existing databases.

2.3. Sensitivity Analysis

A Monte Carlo (MC) simulation is a sampling method employed for uncertainty analysis of parameter variables, allowing for the assessment of their impact on the overall output [66]. This technique is applied within mathematical models to capture data variability in a system by utilizing probability distributions [67]. In the present study, the material transport and energy requirements for producing novel concrete composite materials are treated as uncertain. The primary objective is to evaluate the environmental impact of various mix designs; thus, the sensitivity analysis using the MC simulation is focused on the greenhouse gas (GHG) emissions generated. Table 5 provides the GHG emission factors for transportation and energy sources. For this study, the MC simulation utilizes a triangular probability distribution, which is a continuous probability distribution used to represent uncertain variables within a defined range. The distribution is termed “triangular” when plotted, and it is characterized by three parameters:
  • The minimum value;
  • The maximum value;
  • The most likely value.
The triangular probability distribution was selected for this study because the minimum and maximum values for energy consumption are known, and the simulation output provides the most likely value. This approach allows for the assessment of the potential range of outcomes and their associated probabilities, offering valuable insights into the behaviour of complex systems influenced by uncertain variables.

3. Results and Discussion

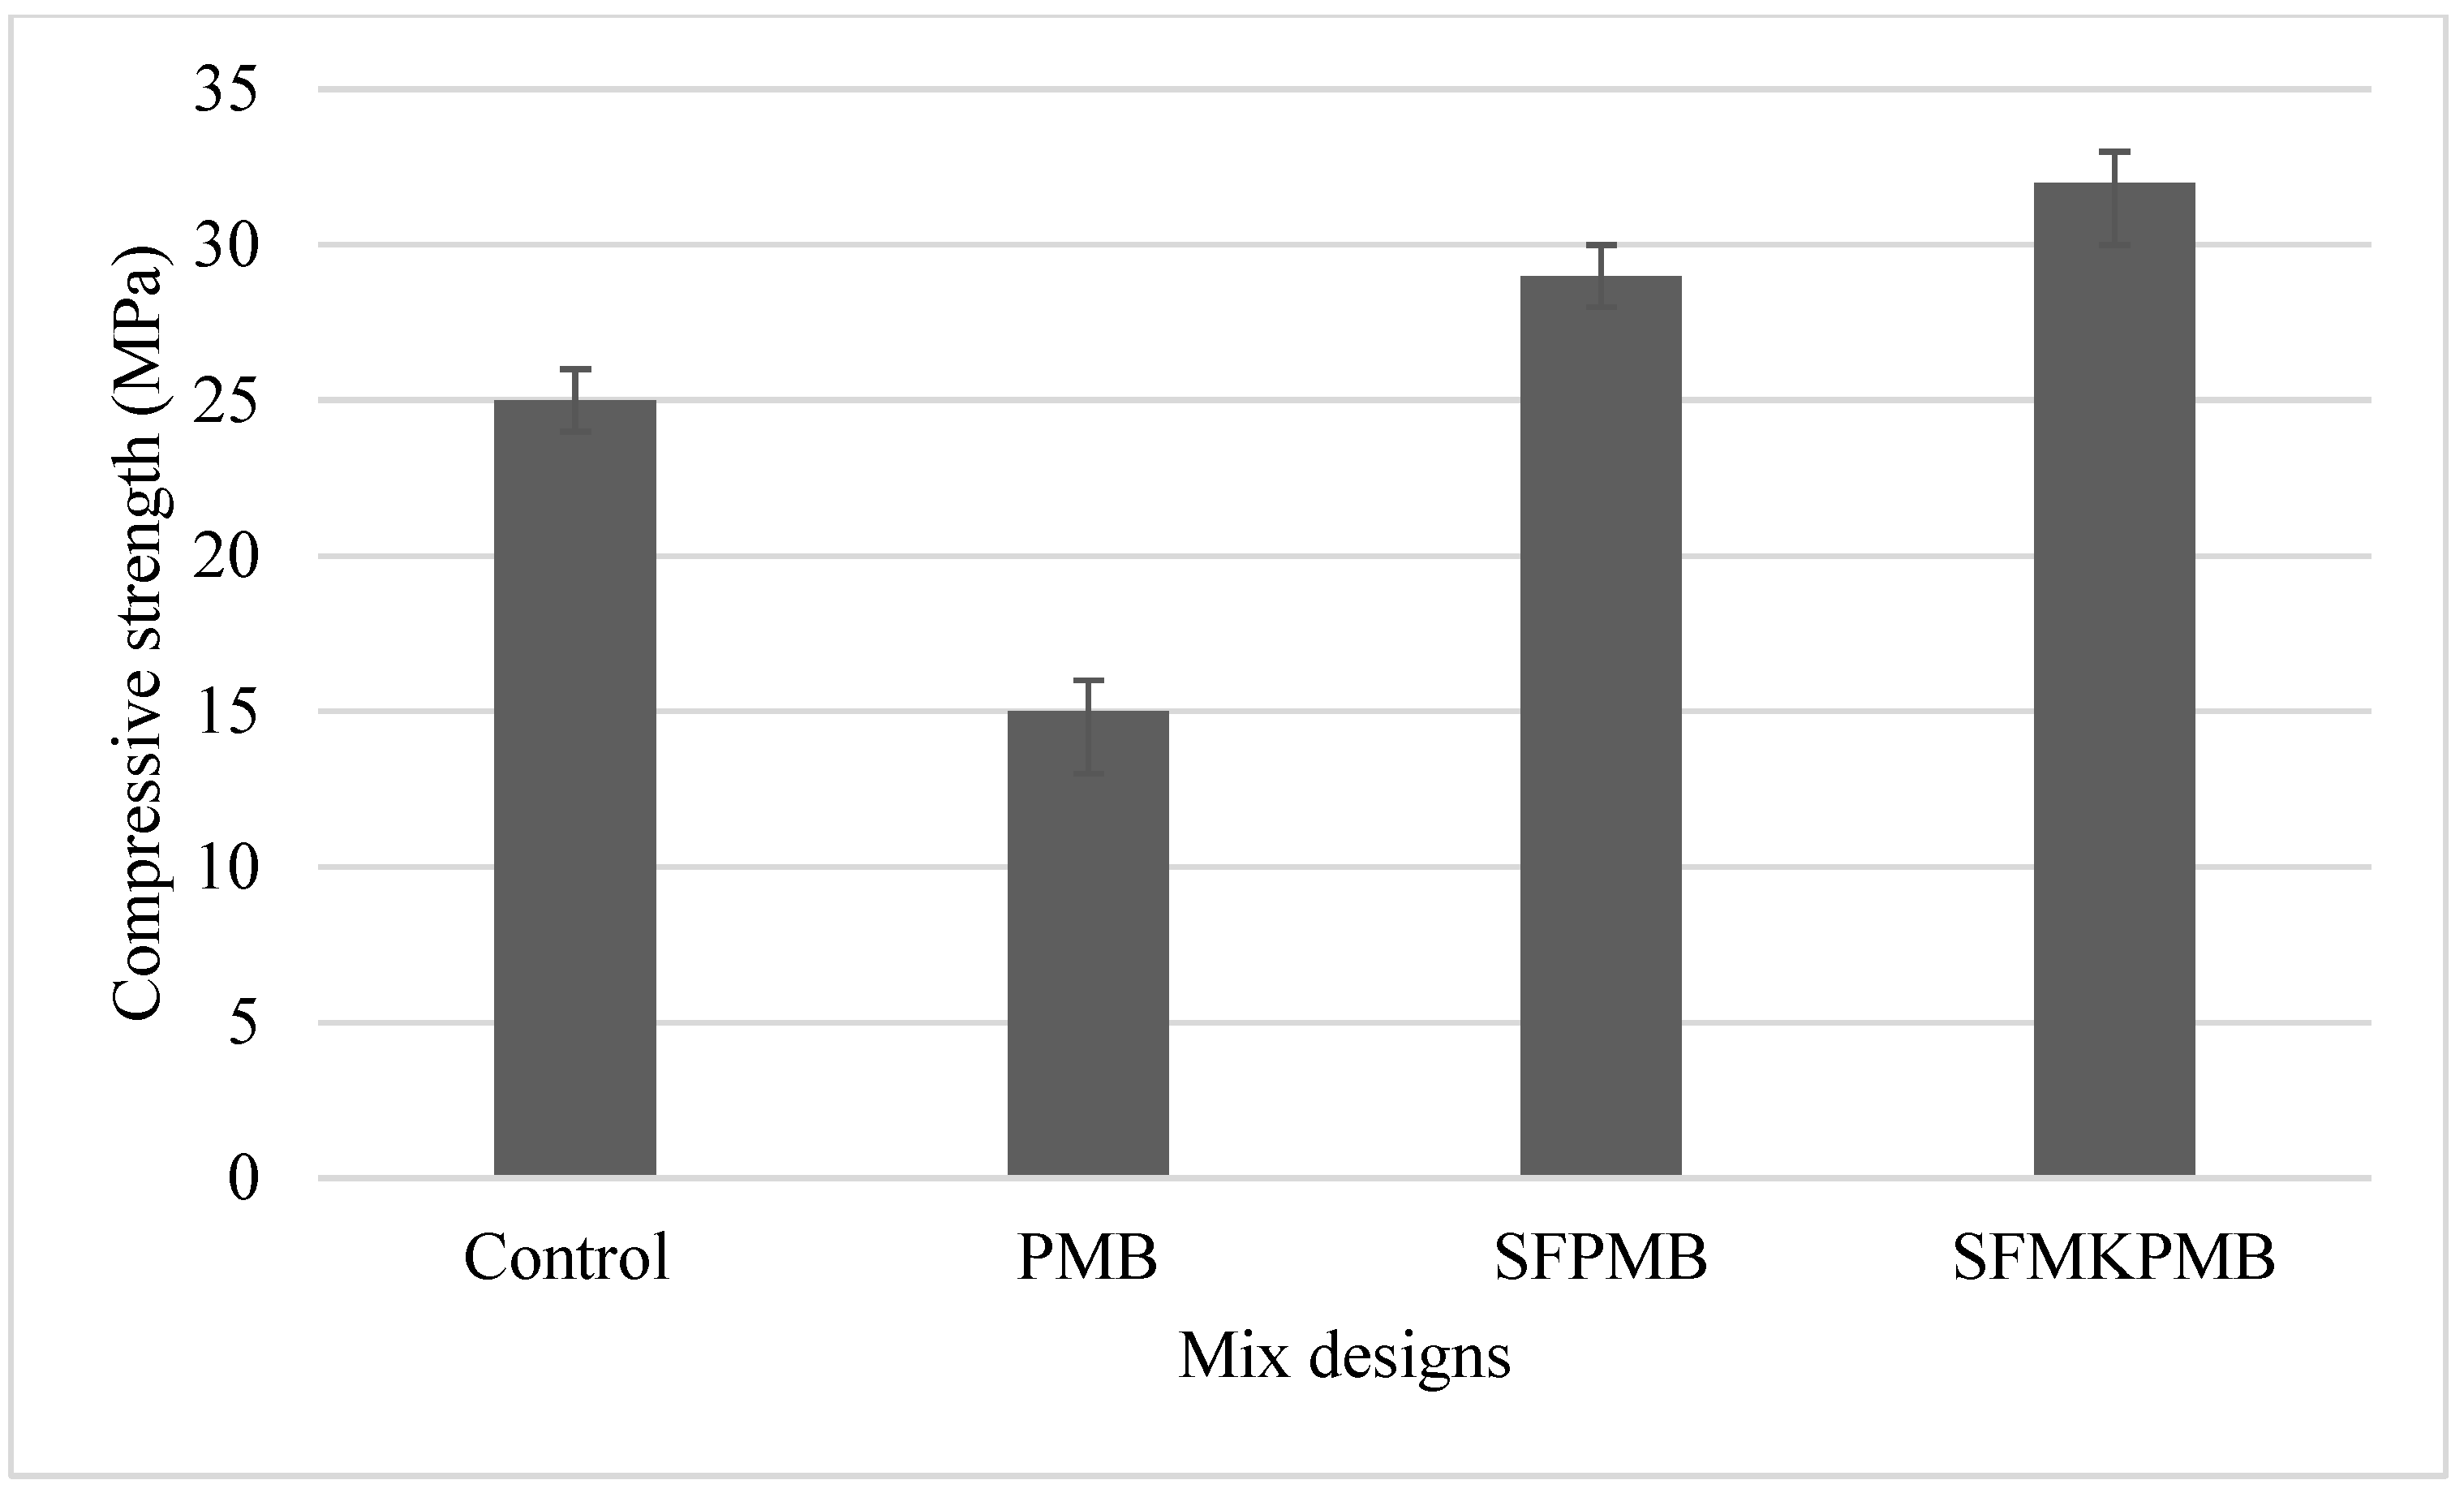
3.1. Mechanical Results

The composite material and the mechanical testing system are shown in Figure 4. The compressive strength results of the various mix designs are presented graphically in Figure 5, with the standard deviation indicated by error bars. Three composites were selected for analysis, as they achieved adequate compressive strength. The integration of the waste plastic granules did not compromise the workability of the composite. However, the results in Figure 5 show raw waste plastic milk bottles reduced the target compressive strength by 40%. Moreover, this was shown with the control achieving 25 MPa whilst PMB achieved 15 MPa. This can be attributed to the addition of non-cementitious materials creating additional voids in the concrete matrix, which has been shown to lower the mechanical strength under applied stress [88]. Despite this, the presence of SF on the granule wall consumes calcium hydroxide (Ca(OH)2), which helps mitigate potential degradation [89]. This reaction has been shown to enhance the compressive strength of the composite, allowing the two samples, SFPMB and SFMKPMB, to reach strengths of 29 MPa and 32 MPa at 28 days, respectively. Moreover, SFMKPMB achieved a 28% increase in compressive strength in comparison to the control. This can be attributed to the integration of both SF and MK as a matrix modification technique [90]. Moreover, the integration of MK has been shown to reduce the porosity of composite materials thereby, enhancing the mechanical integration of bespoke materials. The achieved strength of the composites shown in Figure 5 was deemed suitable for residential concrete applications, making them appropriate for further comparison in a life cycle assessment (LCA).

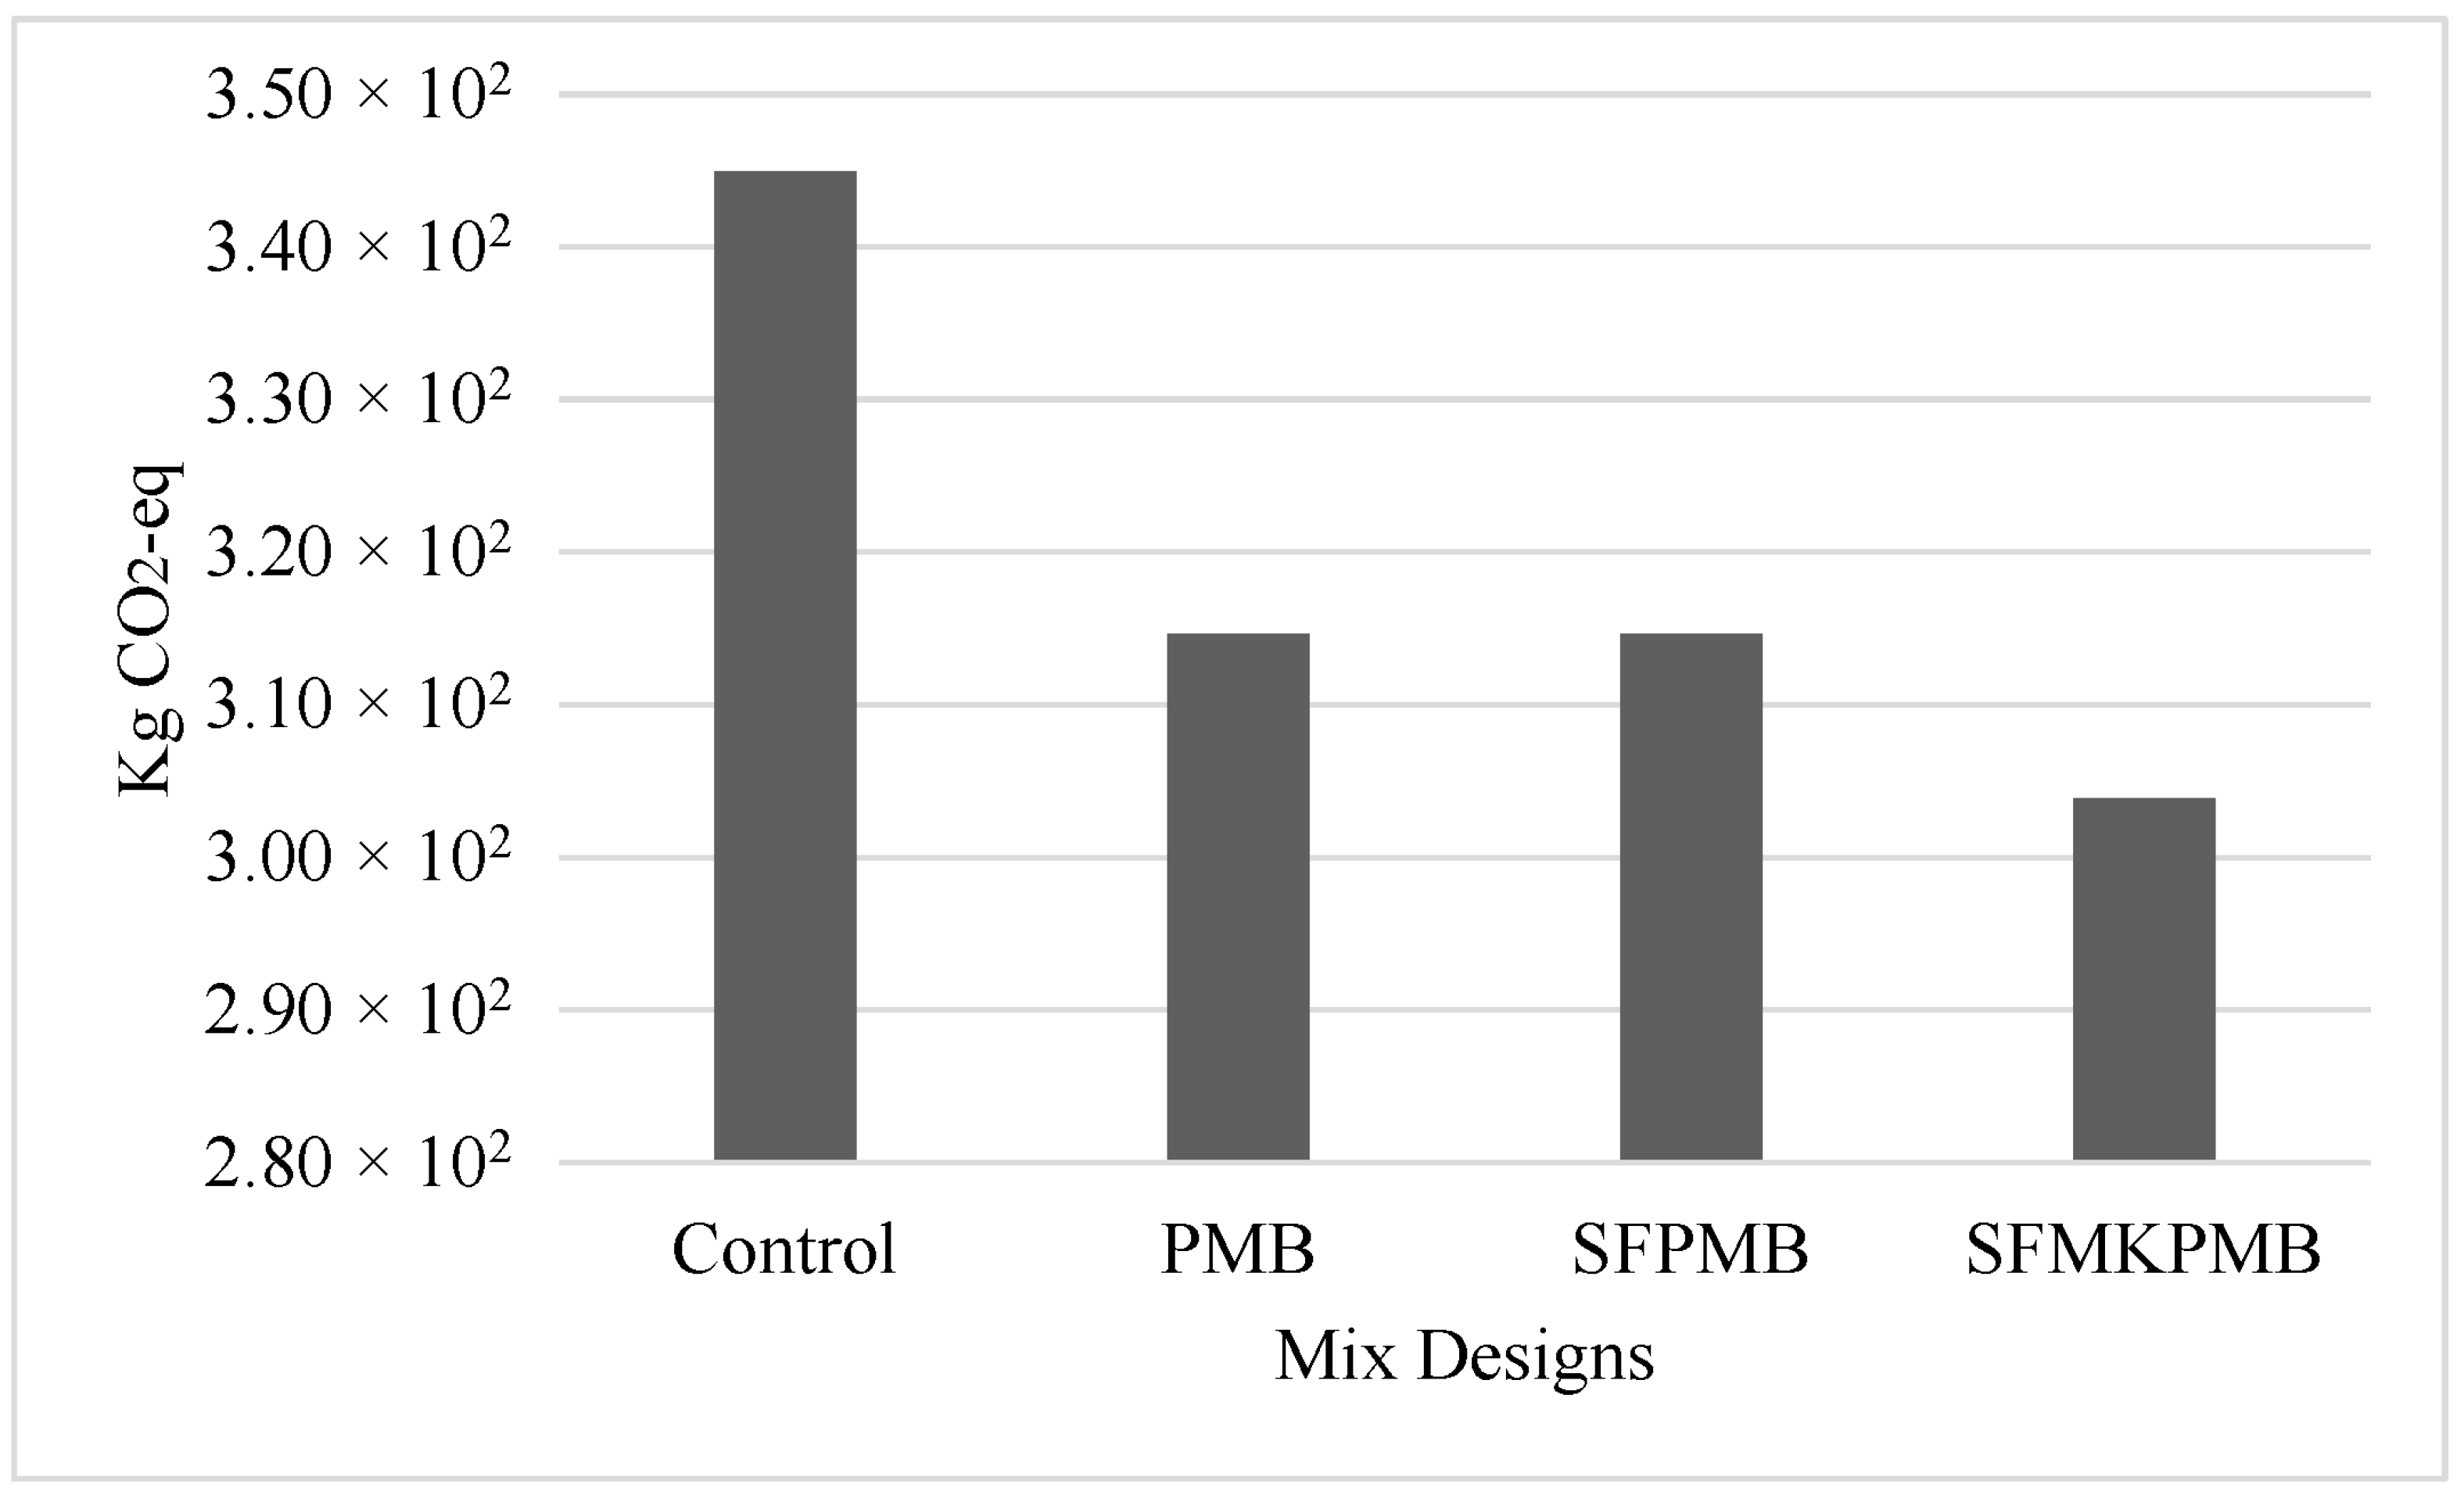
3.2. Life Cycle Assessment Results

The primary objective of the LCA was to compare the environmental impact across different categories when incorporating waste plastic milk bottles as a partial substitute for cement in concrete. This study used Melbourne, Australia, as a case study to illustrate the findings. Waste plastic milk bottles were sourced from a local resource recovery centre, 12.1 km away from the batching plant, while all other concrete materials were sourced from a quarry located 7 km away. Table 6 presents the results for various mix designs against the impact categories, and Figure 6 graphically illustrates each mix design and their total GHG emissions.
All plastic milk bottle-modified mix designs demonstrated a reduced Global Warming Potential (GWP100), indicating that incorporating the waste materials in concrete can lower the GWP by reducing the cement requirement. SFMKPMB achieved a total GHG emission savings of 41.18 kg CO2-eq. This was the highest savings due to the reduction of 15% cement per cubic metre. PMB and SFPMB achieved equal GHG emission savings of 30.37 kg CO2-eq. The novel composites represent 11.94% and 8.8% GHG emission savings for SFMKPMB and both PMB/ SFPMB composites, respectively. The control mix contributed to the negative environmental impact across all categories. However, terrestrial ecotoxicity potential (TETP100) and ozone depletion (ODP100) remained the same across both novel and control composites. Table 7 demonstrates fossil depletion potential (FDP) demonstrated both PMB and SFPMB having an increase in savings when compared to SFMKPMB. This is due to the inclusion of MK as a partial cement substitute. Despite this, SFMKPMB achieved a 6.7% FDP savings in comparison to the control. Moreover, the composites PMB and SFPMB resulted in a 7% FDP savings. The human toxicity potential (HTP100) of the control resulted in 77.64 kg 1,4-DCB-Eq. This was the highest HTP100 of all composite materials. SFPMB and PMB demonstrated a 4.9% HTP100 savings, whilst SFMKPMB exhibited a savings of 4.8%. Although the use of MK can achieve a reduction in GHG emissions due to the further reduction requirement of cement, MK can be attributed to increased levels of HTP100 and FDP when compared to the inclusion of only plastic milk bottle waste.

3.3. Monte Carlo Simulation Results

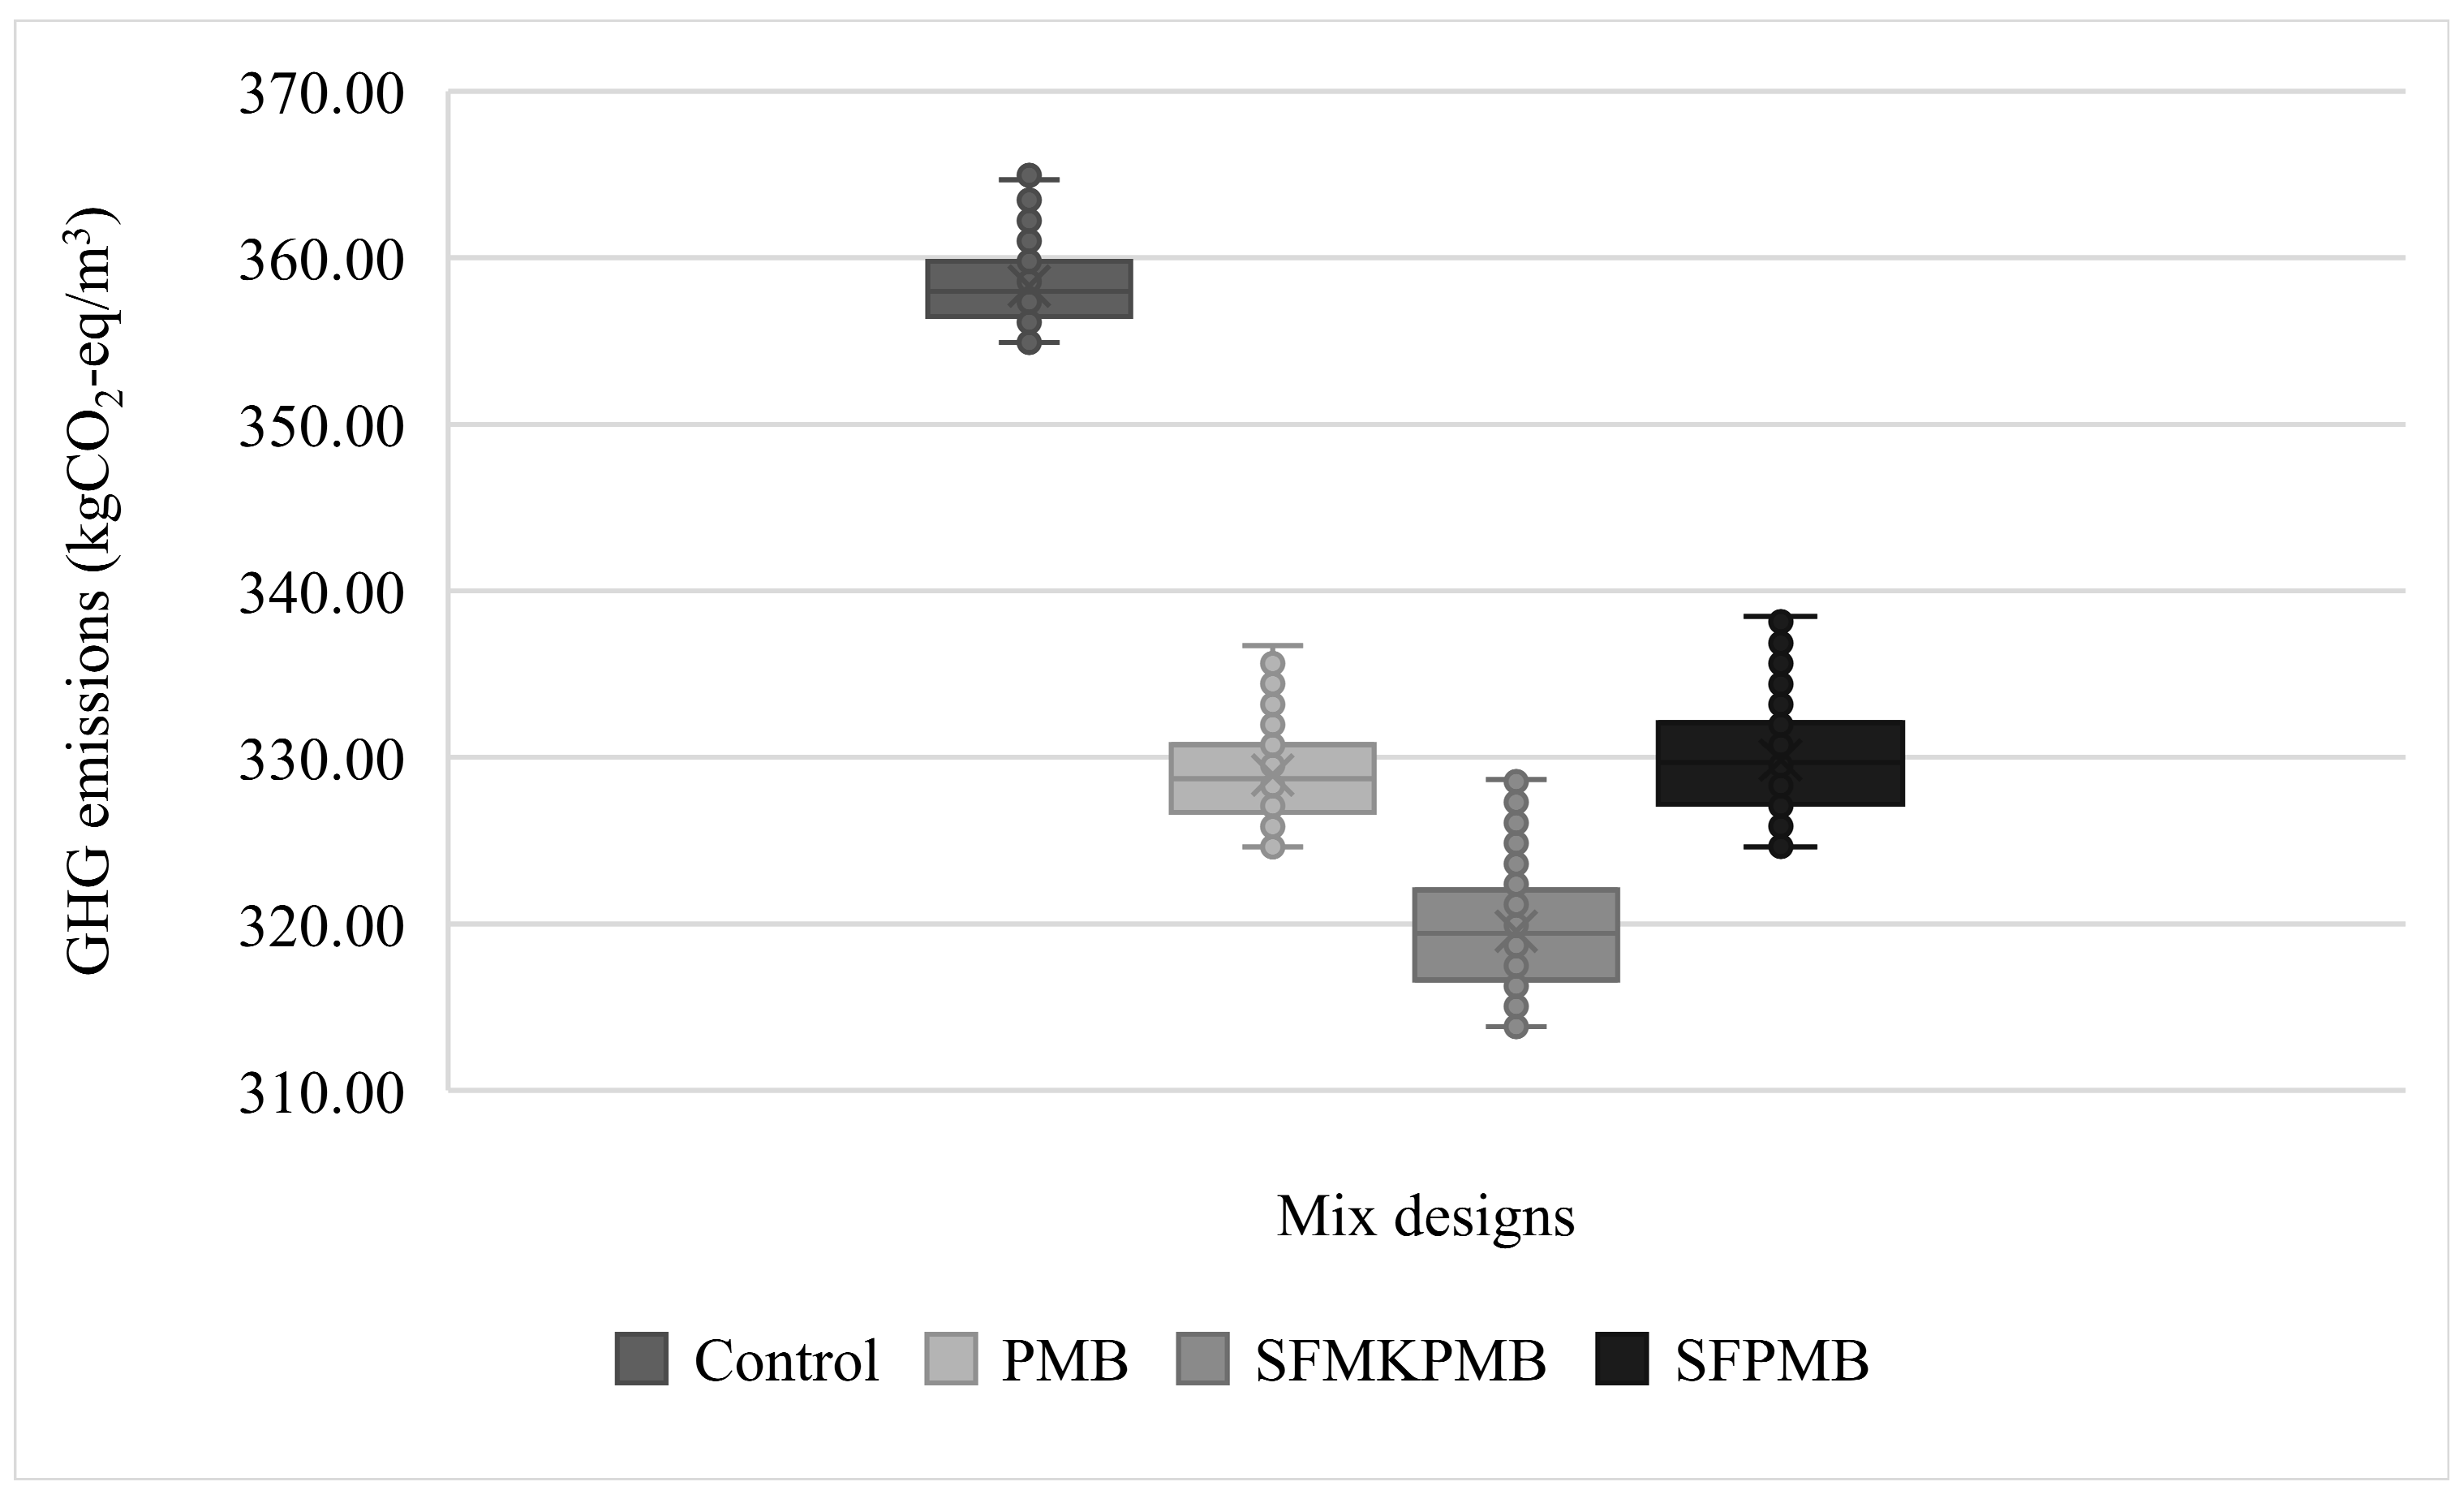
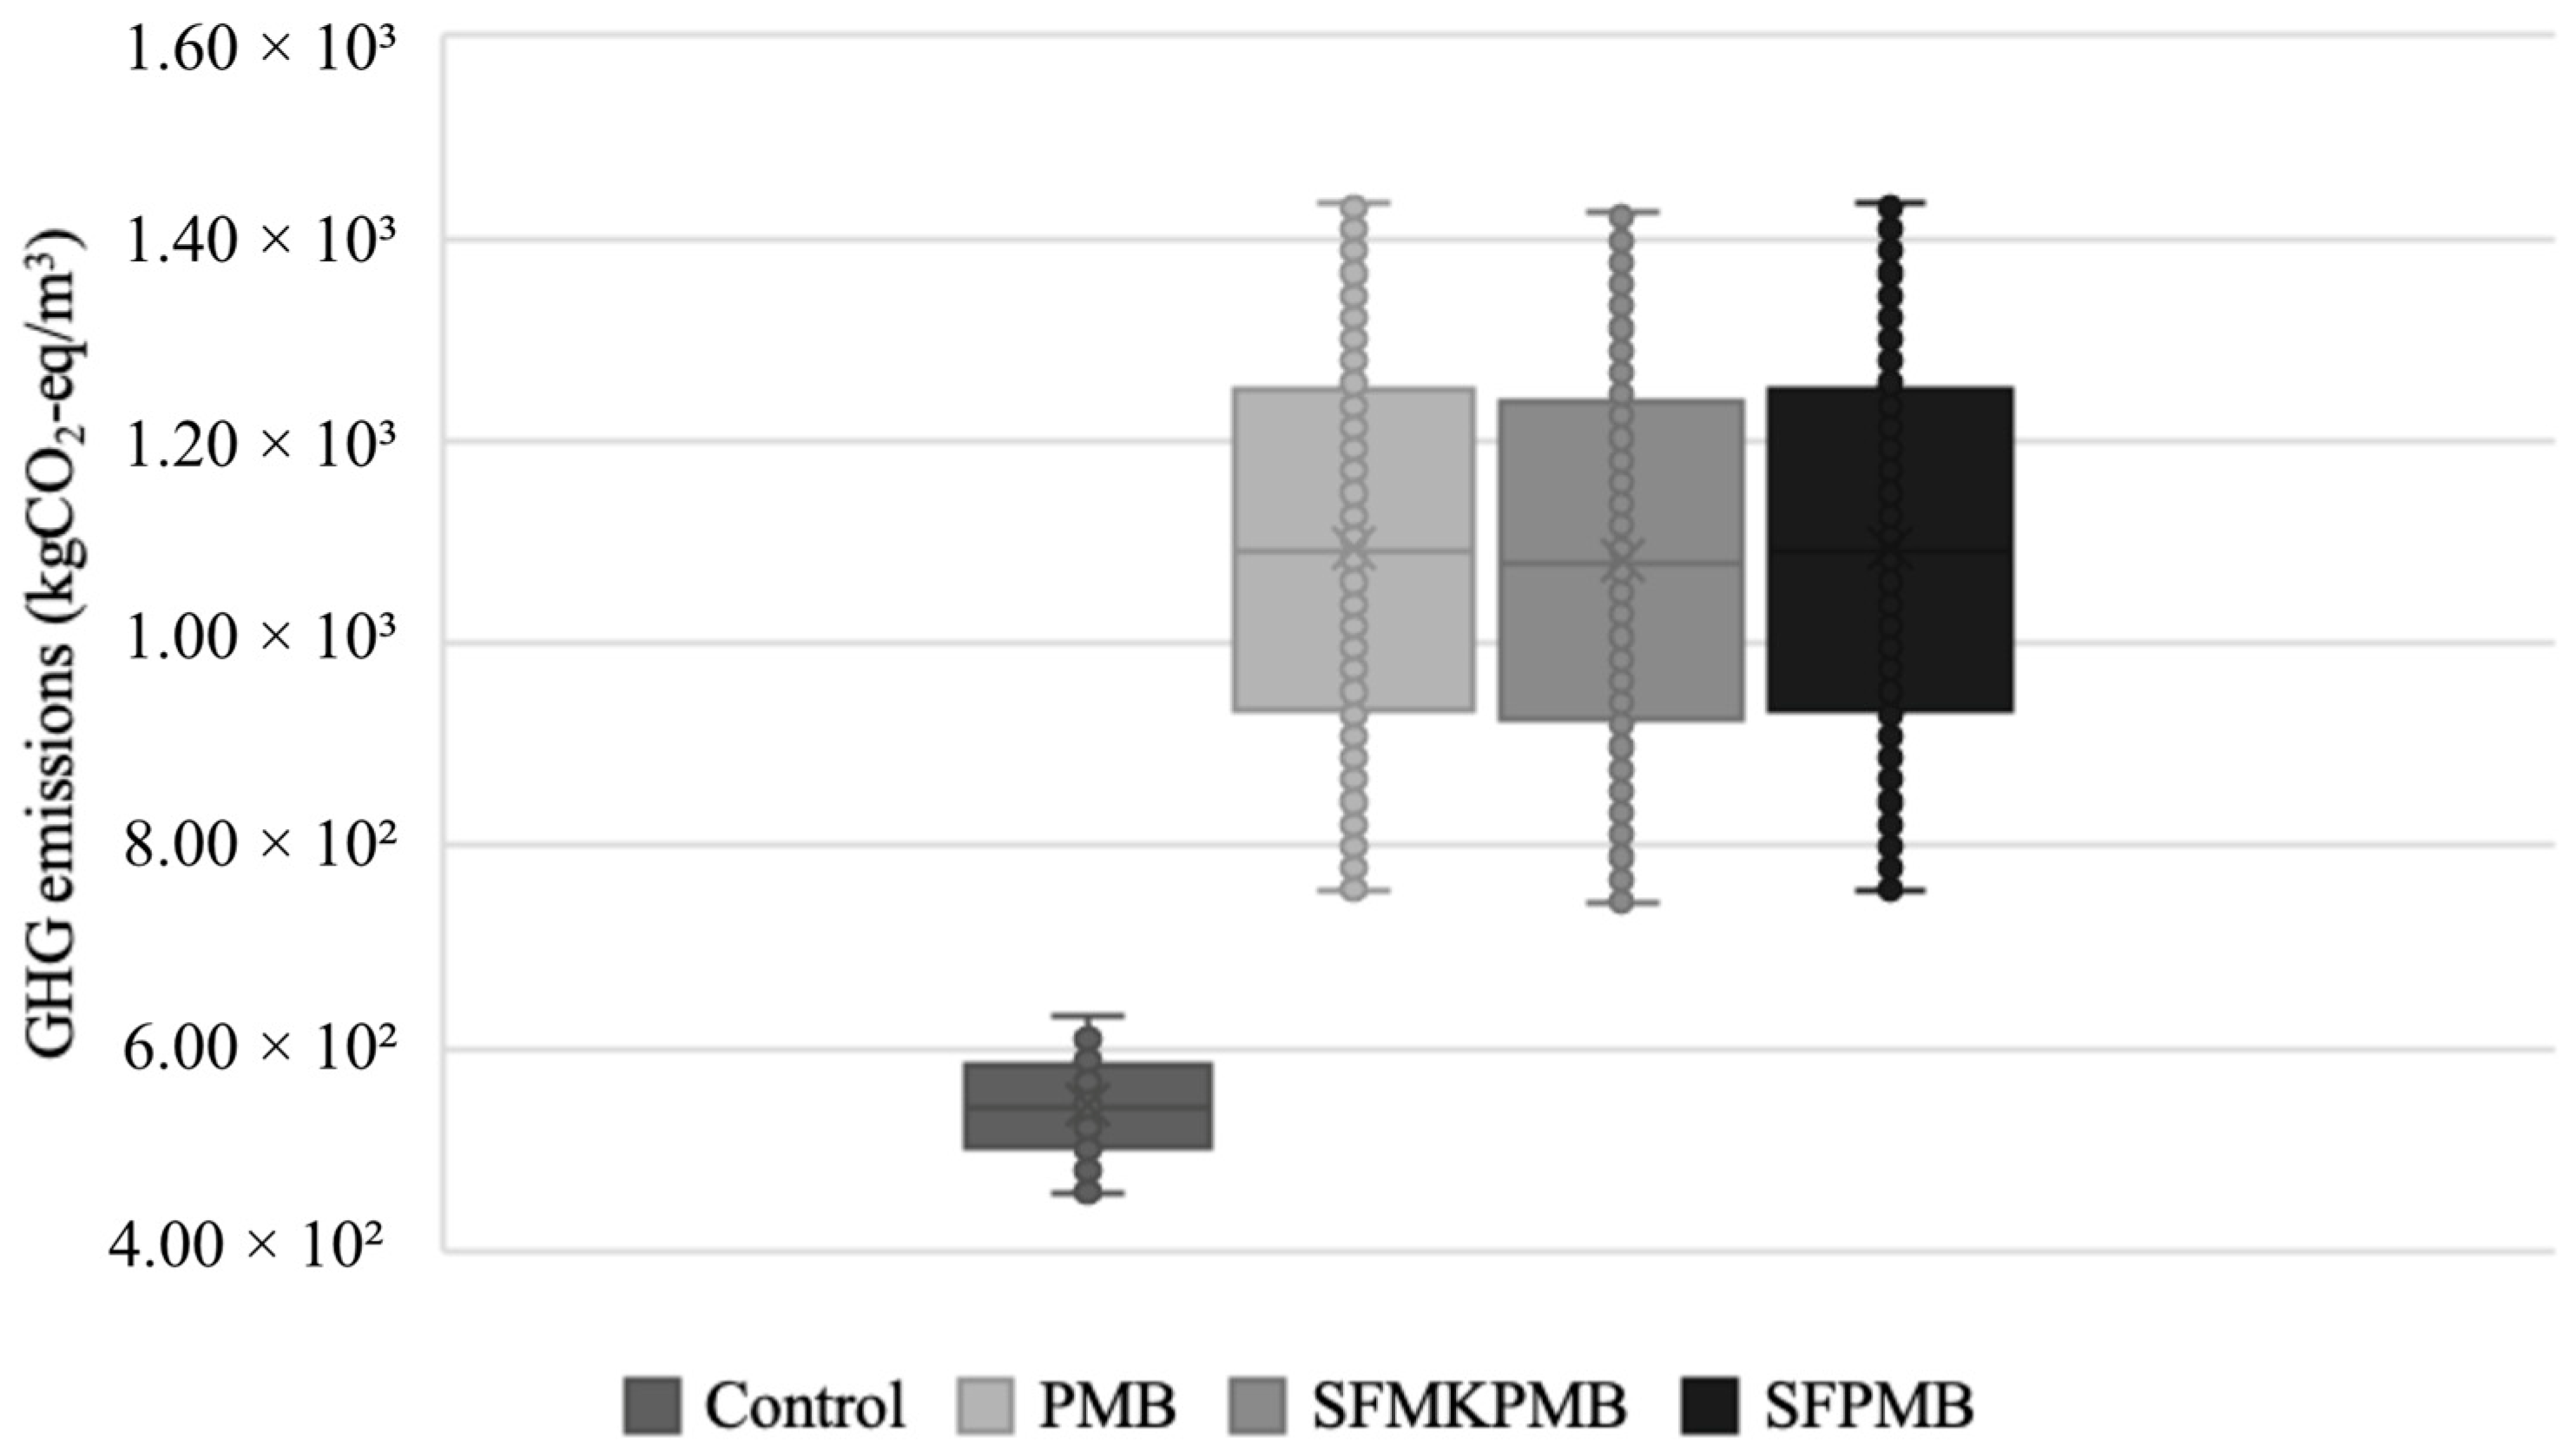
3.3.1. Transport Emissions

Pre-production transportation is often considered a sensitive factor in LCAs due to the significant variability in transport distances and emissions associated with different transport methods [91]. Given the uncertainty of this factor in future case studies, a Monte Carlo (MC) simulation was conducted to assess the impact of input parameters on LCA outcomes. Figure 7 shows the location of the raw materials relative to the concrete batching plant in Melbourne, Australia. The probability simulation, shown in Figure 8, illustrates the emissions from a concrete truck transporting raw materials to a concrete batching plant, with distances ranging from 10 to 60 km. The associated transportation emissions are presented in Figure 9, with the minimum and maximum values accounted for through a triangular distribution to estimate the most likely outcome. The MC simulation ran 10,000 iterations with a 0.05 confidence level. The box plots in the results show the lower and upper quartiles of each sample, with the minimum and maximum values indicated outside the boxes. These values were then compared across each mix design to determine the impact of transportation on the GHG emissions of the novel composite materials. It is important to note that the material emissions remained constant to isolate the variability from transportation. For the MC simulation, a volume of 1 m³ was kept as the desired transport amount, as increasing the volume would simply result in proportional increases in emissions. Figure 9 graphically represents both material emissions and transport emissions for one cubic metre of concrete.
As depicted in Figure 9, the control mix had the highest GHG emissions compared to all waste plastic milk bottle composites, mainly due to its higher cement content, which contributes more to overall material emissions. The average travel and material emissions for the control, PMB, SFPMB, and SFMKPMB were 358.24, 328.85, 329.74, and 319.45 kgCO2-eq/m3, respectively. Figure 8 reveals a greater increase in GHG emissions for SFMKPMB, due to the additional transportation needs for raw materials, such as MK, which adds extra travel emissions. The interquartile range for each sample indicates that the variability from the 10,000 MC simulation iterations is smaller, primarily because of the limited variability in transportation emissions (ranging from 10 to 60 km) and the constant material emissions. Although SFMKPMB showed only a 10.8% reduction in emissions once the material reached the construction site, this reduction can be significant for large concrete projects. Waste plastic milk bottle integration in the composite materials requires additional transportation from the materials recovery centre, leading to higher emissions from transport. The control, PMB, SFPMB, and SFMKPMB had total transportation distances of 21 km, 33.1 km, 45.2 km, and 52 km, respectively. The extra distance represents the additional materials required for the concrete batching process. However, the reduced cement demand in composite materials helps offset the increased GHG emissions from transportation. It is also important to note that the emissions from manufacturing the novel composites and the batching of the concrete materials can vary depending on the resources and location of the project.

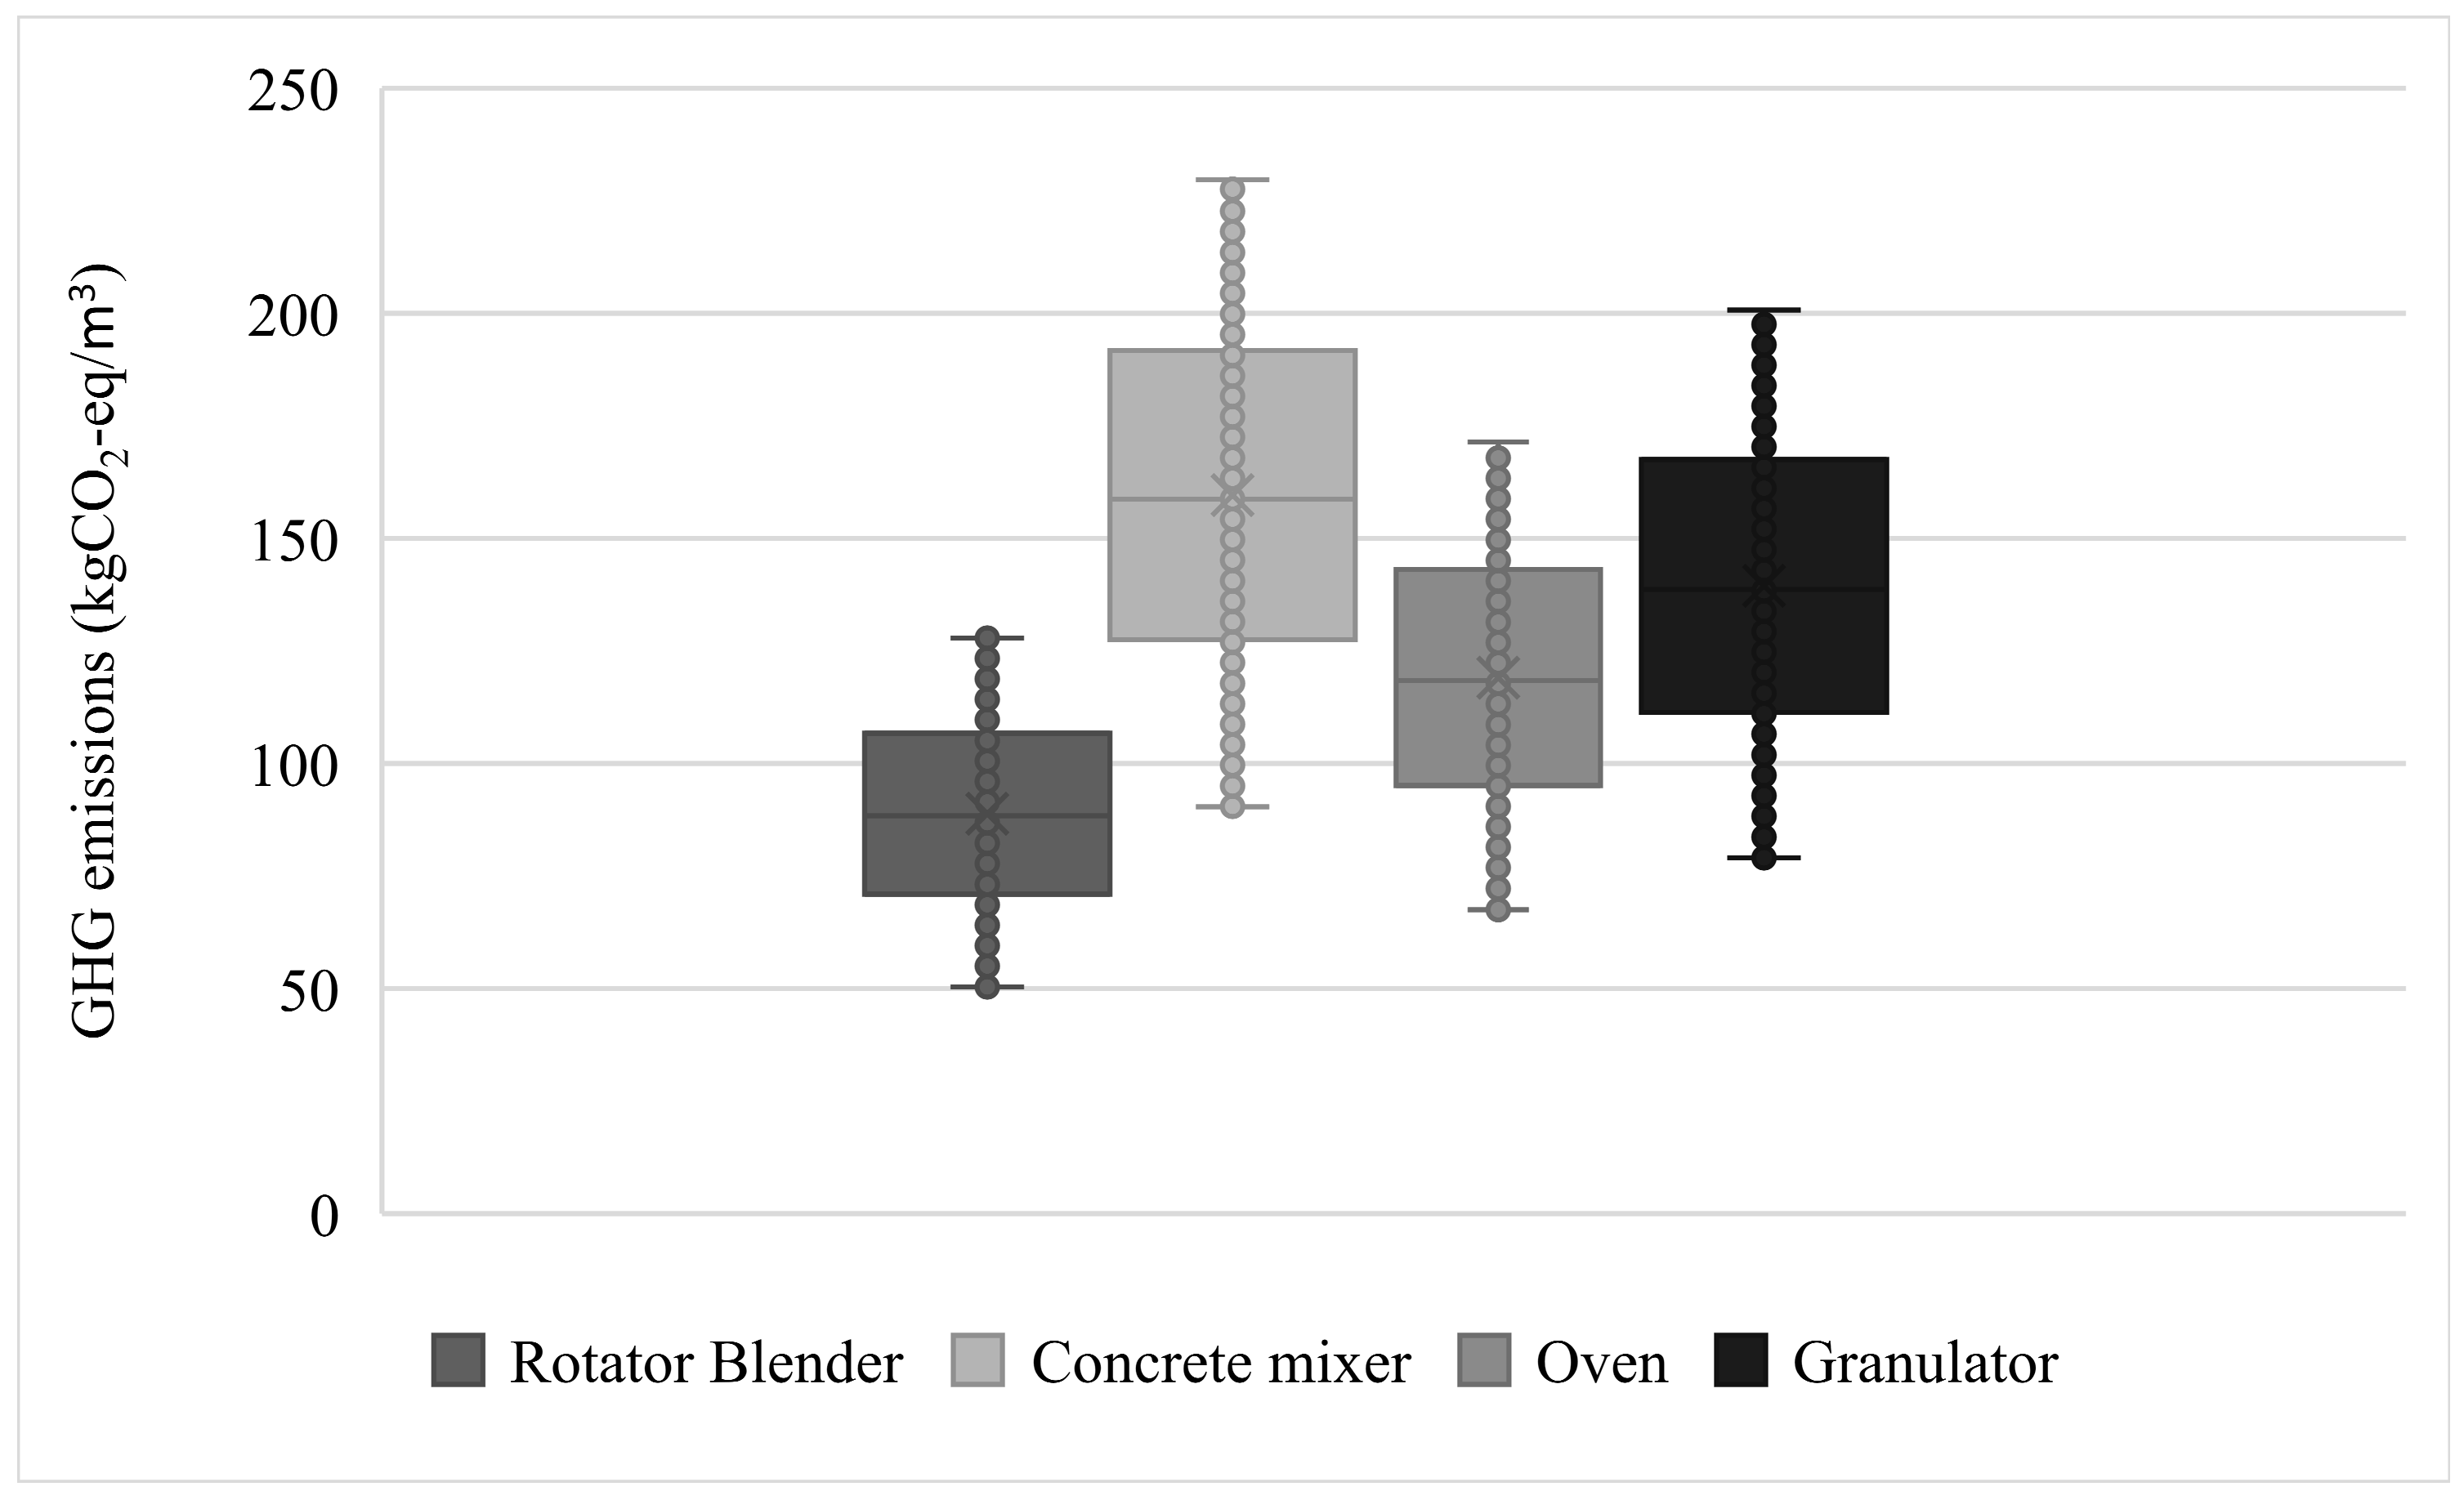
3.3.2. Energy Emissions

The energy consumption involved in producing concrete materials is a critical factor, as it varies significantly depending on the machinery used in manufacturing [92]. Due to the uncertainty of this factor in future case studies, a Monte Carlo (MC) simulation was performed to examine how input parameters affect the outcomes of the LCA. Figure 10 presents a visual representation of the fluctuating GHG emissions linked to the equipment used in the production of novel composite materials. The MC simulation ran 10,000 iterations with a confidence level of 0.05. The emissions from each type of machinery, across a time range from 60 to 300 min, accounted for the variability in composite production durations. The machinery selected was based on a laboratory-scale approach for concrete and waste material production, consistent with the scope of this study. Since 1 m³ was chosen as the functional unit, integrating larger commercial machinery would have significantly altered the LCA results. The from 60 to 300 min time range was selected as it represents a scalable time frame for production.

3.3.3. Total Energy and Transport and Materials

Figure 11 illustrates the total GHG emissions associated with all materials, transportation, and energy requirements in the production of composite materials. As illustrated, waste plastic milk bottle composites still generate the highest GHG emissions within the cradle-to-gate parameters. The control, PMB, SFPMB, and SFMKPMB exhibited average emissions of 568, 1202, 1202, and 1191 kgCO2-eq/m3, respectively. The material and manufacturing emissions produced similar results due to the constant GHG emissions of the raw materials. However, the maximum and minimum values differ because of the additional transportation requirements, which broaden the scope of the box plot and whisker data set. SFMKPMB shows a lower emission value compared to SFPMB and PMB, primarily due to the reduction in cement when replaced by MK. Despite the added transportation requirements, even small amounts of cement replacement can result in GHG emission savings.

4. Conclusions

This study explored alternative methods for integrating waste HDPE plastic milk bottles within residential concrete construction. This paper presents a methodology consisting of three key stages to evaluate the feasibility and environmental impact of using this waste material in concrete. First, the mechanical strength of waste plastic milk bottle granules as a partial cement substitute was analysed. Second, a life cycle assessment (LCA) was performed to identify the environmental effects across key categories. Lastly, a sensitivity analysis was performed to assess the variability of GHG emissions from transportation and energy consumption.
The mechanical performance of the concrete exhibited comparable compressive strength to residential concrete systems when 10% of the cement was substituted with SF-modified plastic waste granules (SFPMBs). A composite matrix modified with MK (SFMKPMB) increased the strength characteristics, using 5% MK and 10% SF-modified plastic waste granules. Moreover, the integration of MK exhibited a 10% compressive strength increase when compared to the composite SFPMB. The LCA results for PMB and SFPMB were comparable due to the low amount of SF added to the waste materials. However, despite the low value of SF used in this study, it increased the compressive strength by 93%. Moreover, raw plastic milk bottle granules reduced the target compressive strength by 60%, whereas the integration of SF increased the strength by 16% when targeting the control strength. One cubic metre of PMB, SFPMB, and SFMKPMB showed key reductions in GWP, HTP, and FDP impact categories. As mentioned, PMB and SFPMB showed similar savings for GWP, HTP, and FDP by 8.8%, 4.9%, and 7%, respectively. The LCA of SFMKPMB revealed additional savings of 11.9%, 4.8%, and 6.71% for GWP, HTP, and FDP, respectively. However, the HTP of SFMKPMB increased due to the addition of MK.
The Monte Carlo simulation examined the variability factors when integrating novel concrete materials. Initially, the added transport requirements for additional materials increased GHG emissions. SFMKPMB showed the highest average of 3.94 kgCO2-eq/m3 for transportation to the batching plant with 52.2 km. However, this increase was offset by the initial material emissions for traditional concrete batching. The control demonstrated the highest GHG emissions produced for both materials and transportation, exhibiting 358 kg CO2-eq/m3. Ultimately, SFMKPMB resulted in the lowest GHG emissions from cradle-to-gate, while the control produced the highest GHG emissions in both material and transportation factors. A sensitivity analysis on energy sources and machinery operations was also conducted. The results showed that additional energy was required for the processing of the waste plastic milk bottle granules. The extra manufacturing processes needed eliminated the initial GHG emission savings from materials and transportation. Thus, resulting in higher GHG emissions created when integrating the waste material. It is important to note that the Monte Carlo simulation focused on the triangular distribution of minimum, maximum, and most likely. With limited data, this is the most practical approach. The interpretation of the results should focus on the data entered into this study.
This study highlights the complexity of evaluating and classifying materials as “green” in cementitious composite systems. The findings illustrate how variability factors can influence the sustainability of what might initially appear to be a sustainable material alternative, potentially leading to unforeseen negative impacts. It is important to note that the system boundary included the cradle-to-gate limitation. Future studies could focus on a cradle-to-grave system boundary, which could highlight alternative environmental concerns or benefits. Additionally, future studies could focus on economic factors and feasibility. It is crucial to recognize that diverting waste from landfills always has positive environmental benefits. As renewable energy becomes more widely used, there will be more opportunities for bespoke materials to play a significant role in the construction industry.

Funding

This research received no external funding.

Data Availability Statement

The data presented in this study are available on request from the corresponding author.

Conflicts of Interest

The authors declare no conflicts of interest.

References

  1. Nayanathara Thathsarani Pilapitiya, P.G.C.; Ratnayake, A.S. The world of plastic waste: A review. Clean. Mater. 2024, 11, 100220. [Google Scholar] [CrossRef]
  2. Benallel, A.; Tilioua, A.; Garoum, M. Development of thermal insulation panels bio-composite containing cardboard and date palm fibers. J. Clean. Prod. 2024, 434, 139995. [Google Scholar] [CrossRef]
  3. Dukare, A.; Yadav, R.; Kautkar, S.; Kuppusamy, P.; Sharma, K.; Shaikh, A.; Pawar, A.; Gadade, A.; Vigneshwaran, N.; Saxena, S.; et al. Waste to wealth: Microbial-based sustainable valorization of cotton biomass, processing waste and by-products for bioenergy and other value-added products to promote circular economy. Waste Manag. Bull. 2024, 2, 262–280. [Google Scholar] [CrossRef]
  4. Pongpunpurt, P.; Chawaloesphonsiya, N.; Poyai, T.; Guiraud, P.; Tiruta-Barna, L.; Rungsithong, R.; Leknoi, U.; Janjaroen, D.; Painmanakul, P. Exploring the circular business model for sustainable plastic waste management in shopping malls: Challenges, opportunities, and impacts in Thailand. Case Stud. Chem. Environ. Eng. 2024, 10, 100872. [Google Scholar] [CrossRef]
  5. Joe Pickin, J.M. National Waste and Resource Recovery Report 2024; Blue Environment: Melbourne, Australia, 2025. [Google Scholar]
  6. Saikia, N.; de Brito, J. Use of plastic waste as aggregate in cement mortar and concrete preparation: A review. Constr. Build. Mater. 2012, 34, 385–401. [Google Scholar] [CrossRef]
  7. Mousania, Z.; Angulo, A.V.; Poon, J.P.H.; Atkinson, J.D. Quantifying the environmental impact of transportation for plastic film packaging end-of-life: Landfill, incineration, physical recycling, or chemical recycling. Resour. Conserv. Recycl. 2024, 207, 107681. [Google Scholar] [CrossRef]
  8. Crîstiu, D.; d’Amore, F.; Bezzo, F. Economic and environmental optimisation of mixed plastic waste supply chains in Northern Italy comparing incineration and pyrolysis technologies. Comput. Chem. Eng. 2024, 180, 108503. [Google Scholar] [CrossRef]
  9. Australia, W. Plastic Waste and Climate Change—Whats the Connection? Available online: https://wwf.org.au/blogs/plastic-waste-and-global-heating-what-is-the-connection/ (accessed on 3 June 2024).
  10. The_World_Bank. Solid Waste Management. Available online: https://www.worldbank.org/en/topic/urbandevelopment/brief/solid-waste-management (accessed on 4 January 2025).
  11. EPA. Plastics: Material—Specific Data. Available online: https://www.epa.gov/facts-and-figures-about-materials-waste-and-recycling/plastics-material-specific-data (accessed on 8 January 2025).
  12. World-Economic Forum. The New Plastics Economy-Rethinking the Future of Plastics. Available online: https://www3.weforum.org/docs/WEF_The_New_Plastics_Economy.pdf (accessed on 8 January 2025).
  13. Cox, K.D.; Covernton, G.A.; Davies, H.L.; Dower, J.F.; Juanes, F.; Dudas, S.E. Human Consumption of Microplastics. Env. Sci. Technol. 2019, 53, 7068–7074. [Google Scholar] [CrossRef]
  14. Yu, Z.; Nurdiawati, A.; Kanwal, Q.; Al-Humaiqani, M.M.; Al-Ghamdi, S.G. Assessing and mitigating environmental impacts of construction materials: Insights from environmental product declarations. J. Build. Eng. 2024, 98, 110929. [Google Scholar] [CrossRef]
  15. Kuz’min, M.P.; Larionov, L.M.; Kuz’mina, M.Y.; Kuz’mina, A.S.; Ran, J.Q.; Burdonov, A.E.; Zenkov, E.V. Production of portland cement using fluorine gypsum—Hydrofluoric acid waste. Mag. Civ. Eng. 2022, 111, 174. [Google Scholar] [CrossRef]
  16. Turk, O.; Yehia, S.; Abdelfatah, A.; Elchalakani, M. Sustainable concrete production: The potential of utilizing recycled waste materials. J. Build. Eng. 2024, 98, 111467. [Google Scholar] [CrossRef]
  17. Haigh, R.; Sandanayake, M.; Joseph, P.; Yaghoubi, E.; Vrcelj, Z. The mechanical and microstructural performance of waste textile and cardboard materials in concrete. Struct. Concr. 2024, 25, 4033–4047. [Google Scholar] [CrossRef]
  18. Xiang, Q.; Pan, H.; Ma, X.; Yang, M.; Lyu, Y.; Zhang, X.; Shui, W.; Liao, W.; Xiao, Y.; Wu, J.; et al. Impacts of energy-saving and emission-reduction on sustainability of cement production. Renew. Sustain. Energy Rev. 2024, 191, 114089. [Google Scholar] [CrossRef]
  19. Sandanayake, M.; Bouras, Y.; Haigh, R.; Vrcelj, Z. Current Sustainable Trends of Using Waste Materials in Concrete—A Decade Review. Sustainability 2020, 12, 9622. [Google Scholar] [CrossRef]
  20. Haigh, R. A Decade Review of Research Trends Using Waste Materials in the Building and Construction Industry: A Pathway towards a Circular Economy. Waste 2023, 1, 935–959. [Google Scholar] [CrossRef]
  21. Abbas, S.N.; Qureshi, M.I. Improved fresh and hardened properties of concrete with high density polyethylene aggregates: Role of silica fume, steel fibers, macro synthetic fibers and variation of water cement ratio. Mater. Chem. Phys. Sustain. Energy 2025, 2, 100010. [Google Scholar] [CrossRef]
  22. Cao, J.; Zou, Z.; Zeng, P. Mechanical properties of fly ash concrete after the coupling effects of sustained load and sulphate erosion. Constr. Build. Mater. 2025, 460, 139866. [Google Scholar] [CrossRef]
  23. Yavuz, D.; Akbulut, Z.F.; Guler, S. Porous concrete modification with silica fume and ground granulated blast furnace slag: Hydraulic and mechanical properties before and after freeze-thaw exposure. Constr. Build. Mater. 2024, 447, 138099. [Google Scholar] [CrossRef]
  24. Kuz’min, M.P.; Larionov, L.M.; Kondratiev, V.V.; Kuz’mina, M.Y.; Grigoriev, V.G.; Kuz’mina, A.S. Use of the burnt rock of coal deposits slag heaps in the concrete products manufacturing. Constr. Build. Mater. 2018, 179, 117–124. [Google Scholar] [CrossRef]
  25. Mohamed, A.M.; Tayeh, B.A. Metakaolin in ultra-high-performance concrete: A critical review of its effectiveness as a green and sustainable admixture. Case Stud. Constr. Mater. 2024, 21, e03967. [Google Scholar] [CrossRef]
  26. Nguyen, T.H.T.; Nguyen, T.-T.T.; Ha, N.-H.; Nguyen, K.L.P.; Bui, T.-K.L. Toward a circular economy for better municipal solid waste management in Can Gio district, Ho Chi Minh city. Sustain. Chem. Pharm. 2024, 38, 101480. [Google Scholar] [CrossRef]
  27. Vinod Kumar, R.; Rupesh Kumar, D.D. Recycled plastic (HDPE) coarse aggregate manufacturing method and performance in concrete. Mater. Today Proc. 2023, 92, 1304–1309. [Google Scholar] [CrossRef]
  28. Lim, S.M.; He, M.; Hao, G.; Ng, T.C.A.; Ong, G.P. Recyclability potential of waste plastic-modified asphalt concrete with consideration to its environmental impact. Constr. Build. Mater. 2024, 439, 137299. [Google Scholar] [CrossRef]
  29. Shaibur, M.R.; Sarwar, S.; Alshehri, M. Production and characterization of plastic bricks produced from PET, PP, and HDPE types of plastic wastes. Phys. Chem. Earth Parts A/B/C 2025, 138, 103859. [Google Scholar] [CrossRef]
  30. Heweidak, M.; Kafle, B.; Al-Ameri, R. Experimental and numerical analysis of self-compacting geopolymer concrete composite slab. Structures 2025, 71, 107942. [Google Scholar] [CrossRef]
  31. Pre-mix_Concrete_SA. Normal Class Concrete. Available online: https://premix.com.au/concrete-range/normal-class-concrete/#:~:text=(a)%20The%2020%20MPa%20and,%2C%20driveways%2C%20footings%20and%20footpaths (accessed on 2 February 2025).
  32. Youssf, O.; Mills, J.E.; Ellis, M.; Benn, T.; Zhuge, Y.; Ma, X.; Gravina, R.J. Practical Application of Crumb Rubber Concrete in Residential Slabs. Structures 2022, 36, 837–853. [Google Scholar] [CrossRef]
  33. Zhang, J.; Zhang, G.; Bhuiyan, M.A.; Agostino, J. Comparative life cycle assessment of kerbside collection methods for waste glass cullet for asphalt production. J. Clean. Prod. 2022, 374, 134055. [Google Scholar] [CrossRef]
  34. Hossain, M.U.; Poon, C.S. Comparative LCA of wood waste management strategies generated from building construction activities. J. Clean. Prod. 2018, 177, 387–397. [Google Scholar] [CrossRef]
  35. Hossain, M.U.; Poon, C.S.; Lo, I.M.C.; Cheng, J.C.P. Comparative LCA on using waste materials in the cement industry: A Hong Kong case study. Resour. Conserv. Recycl. 2017, 120, 199–208. [Google Scholar] [CrossRef]
  36. De Wolf, C.; Cordella, M.; Dodd, N.; Byers, B.; Donatello, S. Whole life cycle environmental impact assessment of buildings: Developing software tool and database support for the EU framework Level(s). Resour. Conserv. Recycl. 2023, 188, 106642. [Google Scholar] [CrossRef]
  37. Malviya, R.K.; Singh, R.K.; Purohit, R.; Sinha, R. Natural fibre reinforced composite materials: Environmentally better life cycle assessment—A case study. Mater. Today Proc. 2020, 26, 3157–3160. [Google Scholar] [CrossRef]
  38. Nascimento, F.; Gouveia, B.; Dias, F.; Ribeiro, F.; Silva, M.A. A method to select a road pavement structure with life cycle assessment. J. Clean. Prod. 2020, 271, 122210. [Google Scholar] [CrossRef]
  39. Zhao, J.; Li, S. Life cycle cost assessment and multi-criteria decision analysis of environment-friendly building insulation materials—A review. Energy Build. 2022, 254, 111582. [Google Scholar] [CrossRef]
  40. AS/NZS-1012.2; Methods of Testing Concrete. Preparing Concrete Mixes in the Laboratory. Australian Standard: Sydney, Australia, 2014.
  41. AS/NZS-3582.3; Supplementary Cementitious Materials. Part 3: Amorphous Silica. Australian Standard: Sydney, Australia, 2016.
  42. ASTM-C-618; Standard Specification for Coal Fly Ash and Raw or Calcined Natural Pozzolan for Use in Concrete. ASTM: Conshohocken, PA, USA, 2019.
  43. AS/NZS-1141.5; Methods for Sampling and Testing Aggregates—Particle Density and Water Absorption of Fine Aggregate. Australian Standard: Sydney, Australia, 2000.
  44. AS/NZS-1141.6.2; Methods for Sampling and Testing Aggregates—Particle Density and Water Absorption of Coarse Aggregate—Pycnometer Method. Australian Standard: Sydney, Australia, 2016.
  45. AS/NZS-3972; General Purpose and Blended Cements. Australian Standard: Sydney, Australia, 2010.
  46. AS/NZS-1012.8.2; Methods of Testing Concrete. Method for Making and Curing Concrete—Flexure Test Specimens. Australian Standard: Sydney, Australia, 2014.
  47. Ecoinvent. For the Availability of Envrionmental Data Worldwide. Available online: https://ecoinvent.org (accessed on 6 January 2025).
  48. OpenLCA. The Open Source Life Cycle and Sustainability Assessment Software. Available online: https://www.openlca.org (accessed on 6 January 2025).
  49. ISO 14044:2006; Environmental Management-Life Cycle Assessment-Requirements and Guidelines. ISO: Geneva, Switzerland, 2006.
  50. Goyal, H.; Kumar, R.; Mondal, P. Life cycle analysis of paver block production using waste plastics: Comparative assessment with concrete paver blocks. J. Clean. Prod. 2023, 402, 136857. [Google Scholar] [CrossRef]
  51. Haigh, R.; Sandanayake, M.; Bouras, Y.; Vrcelj, Z. A life cycle assessment of cardboard waste in low stress grade concrete applications. Environ. Manag. 2024, 354, 120428. [Google Scholar] [CrossRef]
  52. Manso-Morato, J.; Hurtado-Alonso, N.; Revilla-Cuesta, V.; Ortega-Lopez, V. Management of wind-turbine blade waste as high-content concrete addition: Mechanical performance evaluation and life cycle assessment. J. Environ. Manag. 2025, 373, 123995. [Google Scholar] [CrossRef]
  53. Ke, X.-j.; Chen, Z.-r.; Fu, W.-s. Waste rubber recycling in concrete-filled steel tube members: Mechanical performance, reliability and life cycle assessment. J. Build. Eng. 2024, 98, 111108. [Google Scholar] [CrossRef]
  54. Jin, Z.; Liang, K.; Liu, C.; Yang, G.; Cui, K.; Mao, S. Mechanical properties and life cycle assessment (LCA) of waste glass reinforced concrete. J. Build. Eng. 2024, 96, 110643. [Google Scholar] [CrossRef]
  55. Sandanayake, M.; Bouras, Y.; Vrcelj, Z. A feasibility study of using coffee cup waste as a building material—Life cycle assessment and multi-objective optimisation. J. Clean. Prod. 2022, 339, 130498. [Google Scholar] [CrossRef]
  56. Zhang, Y.; Luo, W.; Wang, J.; Wang, Y.; Xu, Y.; Xiao, J. A review of life cycle assessment of recycled aggregate concrete. Constr. Build. Mater. 2019, 209, 115–125. [Google Scholar] [CrossRef]
  57. Haigh, R. The mechanical behaviour of waste plastic milk bottle fibres with surface modification using silica fume to supplement 10% cement in concrete materials. Constr. Build. Mater. 2024, 416, 135215. [Google Scholar] [CrossRef]
  58. Haigh, R.; Sandanayake, M.; Bouras, Y.; Vrcelj, Z. The durability performance of waste cardboard kraft fibre reinforced concrete. J. Build. Eng. 2023, 67, 106010. [Google Scholar] [CrossRef]
  59. Haigh, R.; Bouras, Y.; Sandanayake, M.; Vrcelj, Z. The mechanical performance of recycled cardboard kraft fibres within cement and concrete composites. Constr. Build. Mater. 2022, 317, 125920. [Google Scholar] [CrossRef]
  60. Harikaran, M.; Gokulakannan, S.; Loganathan, A.; Chandiran, R.D.; Ajith, M.; Dhanasekar, V. Metakaolin cement concrete evaluation using industrial by-products as fine aggregate. Mater. Today Proc. 2023, in press. [Google Scholar] [CrossRef]
  61. Haw, T.T.; Hart, F.; Rashidi, A.; Pasbakhsh, P. Sustainable cementitious composites reinforced with metakaolin and halloysite nanotubes for construction and building applications. Appl. Clay Sci. 2020, 188, 105533. [Google Scholar] [CrossRef]
  62. Ecoinvent_Ecoquery. Cement, all Types to Generic Market for Cement, Unspecified. Available online: https://ecoquery.ecoinvent.org/3.10/cutoff/dataset/19768/documentation (accessed on 6 January 2025).
  63. Ecoinvent_Ecoquery. Kaolin Production. Available online: https://ecoquery.ecoinvent.org/3.10/cutoff/dataset/4048/documentation (accessed on 6 January 2025).
  64. Ecoinvent_Ecoquery. Sand Quarry Operation, Extraction from River Bed. Available online: https://ecoquery.ecoinvent.org/3.10/cutoff/dataset/20537/documentation (accessed on 6 January 2025).
  65. Ecoinvent_Ecoquery. Gravel Production, Crushed. Available online: https://ecoquery.ecoinvent.org/3.10/cutoff/dataset/830/documentation (accessed on 6 January 2025).
  66. Jafarikia, S.; Feghhi, S.A.H. Built in importance estimation in forward Monte Carlo calculations. Ann. Nucl. Energy 2022, 177, 109298. [Google Scholar] [CrossRef]
  67. Ita-Nagy, D.; Vazquez-Rowe, I.; Kahhat, R.; Quispe, I.; Chinga-Carrasco, G.; Clauser, N.M.; Area, M.C. Life cycle assessment of bagasse fiber reinforced biocomposites. Sci. Total Environ. 2020, 720, 137586. [Google Scholar] [CrossRef] [PubMed]
  68. Institute_for_Global_Environmental_Strategies. IGES List of Grid Emission Factors. Available online: https://www.iges.or.jp/en/pub/list-grid-emission-factor/en (accessed on 8 January 2025).
  69. IEA. Emission Factors 2022. Annual GHG Emission Factors for World Countries from Electricity and Heat Generation. Available online: https://www.iea.org/data-and-statistics/data-product/emissions-factors-2022 (accessed on 8 January 2025).
  70. EPA. Greenhouse Gases Equivalencies Calculator—Calculations and References. Available online: https://www.epa.gov/energy/greenhouse-gases-equivalencies-calculator-calculations-and-references (accessed on 8 January 2025).
  71. Lin, P.-C.; Wang, J.; Huang, S.-H.; Wang, Y.-T. Dispatching ready mixed concrete trucks under demand postponement and weight limit regulation. Autom. Constr. 2010, 19, 798–807. [Google Scholar] [CrossRef]
  72. Tzanetos, A.; Blondin, M. Systematic search and mapping review of the concrete delivery problem (CDP): Formulations, objectives, and data. Autom. Constr. 2023, 145, 104631. [Google Scholar] [CrossRef]
  73. Maghrebi, M.; Travis Waller, S.; Sammut, C. Optimality gap of experts’ decisions in concrete delivery dispatching. J. Build. Eng. 2015, 2, 17–23. [Google Scholar] [CrossRef]
  74. Ghafoori, N.; Diawara, H.; Hasnat, A. Remediation of loss in flow properties of self-consolidating concrete under various combinations of transportation time and temperature. Constr. Build. Mater. 2018, 192, 508–514. [Google Scholar] [CrossRef]
  75. Sakrete. Pro Tip: Mixing Concrete Using a Mixer. Available online: https://www.sakrete.com/blog/post/mixing-concrete-using-a-mixer/ (accessed on 8 January 2025).
  76. ScrewFix. How Long to Mix Concrete. Available online: https://community.screwfix.com/threads/how-long-to-mix-concrete.180903/ (accessed on 10 January 2025).
  77. Edisons. Baumr-AG 220L Portable Electric Concrete Cement Mixer. Available online: https://www.edisons.com.au/baumr-ag-220l-portable-electric-concrete-cement-mixer? (accessed on 10 January 2025).
  78. Forestwest. 80L Mortar Mixer Portable Screed Mixer 1100W BM691. Available online: https://forestwest.com.au/products/80l-portable-mortar-mixer-screed-mixer (accessed on 10 January 2025).
  79. Collections, N.A. Kartrite 850W Cement Concrete Mixer Sand Gravel Portable—200L. Available online: https://www.nordicaustraliacollections.com.au/products/kartrite-850w-cement-concrete-mixer-sand-gravel-portable-200l?srsltid=AfmBOopjHyl6gMMKMEn5n3H6-yzhCBpsIaWaVO-DELfux9EHsfHAsvbj (accessed on 10 January 2025).
  80. Pro_Plaster_Products. WallPro Powermix HD 1600w (Mixer). Available online: https://proplaster.com.au/products/wallpro-powermix-hd-1600w-mixer?srsltid=AfmBOooQxn0E7wk3PDrb_d04sTfV4JcY2IfAMzdSBsrds-izgY_YNKfH (accessed on 10 January 2025).
  81. Edisons. UNIMAC UM-PX9 Power Paddle Stirrer Mixer, Dual Gear, 7 Speed, for Plaster Cement Render Paint Tile Adhesive. Available online: https://www.edisons.com.au/unimac-um-px9-power-paddle-stirrer-mixer-dual-gear-7-speed-for-plaster-cement-render-paint-tile-adhesive?srsltid=AfmBOoqOblhrLHraCUD0m00wWjEZJV_TvZt4rUUuKFtY6BBMiA5fJBkS (accessed on 10 January 2025).
  82. ToolNation. Rubi 25940 Rubimix-9 N 1200W Mixer. Available online: https://www.toolnation.com/rubi-25940-24940-rubimix-9-n-mixer-1200-watt.html (accessed on 10 January 2025).
  83. Prosin. Small Sized Plastic Granulator/Plastic Grinder. Available online: https://www.sinoshredder.com/shredders/small-sized-plastic-granulator/ (accessed on 10 January 2025).
  84. Machines4u. Industrial Plastic Granulator 2.2kW. Available online: https://www.machines4u.com.au/view/advert/Industrial-Plastic-Granulator-2-2kW/819926/ (accessed on 10 January 2025).
  85. LabFriend. OVEN GP 60L 230V—OGS60. Available online: https://www.labfriend.com.au/oven-gp-60l-230v-ogs60 (accessed on 10 January 2025).
  86. LabDirect. Digital Laboratory Oven, 30 Litres Capacity, Max +200 °C. Available online: https://www.labdirect.com.au/digital-laboratory-oven-30-litres-capacity-max-200-c/ (accessed on 10 January 2025).
  87. Across_International. 200 °C 23L Digital Forced Air Convection Oven. Available online: https://www.acrossinternational.com.au/shop/fo19023-200degc-23l-digital-forced-air-convection-oven-423?category=87#attr=484,486 (accessed on 10 January 2025).
  88. Tao, Y.; Hadigheh, S.A.; Wang, Z. Void geometry analysis and multifaceted characterisation of cementitious mortar reinforced with short carbon and glass fibres—A comparative study. J. Build. Eng. 2024, 89, 109283. [Google Scholar] [CrossRef]
  89. Haigh, R.; Sandanayake, M.; Bouras, Y.; Vrcelj, Z. A review of the mechanical and durability performance of kraft-fibre reinforced mortar and concrete. Constr. Build. Mater. 2021, 297, 123759. [Google Scholar] [CrossRef]
  90. Haigh, R.; Sandanayake, M.; Yaghoubi, E.; Joseph, P.; Vrcelj, Z. The mechanical and microstructural investigations of concrete incorporating waste textile and cardboard fibers following thermal and freeze–thaw cycles. Struct. Concr. 2025, 1–16. [Google Scholar] [CrossRef]
  91. Morales, M.F.D.; Passuello, A.; Kirchheim, A.P.; Ries, R.J. Monte Carlo parameters in modeling service life: Influence on life-cycle assessment. J. Build. Eng. 2021, 44, 103232. [Google Scholar] [CrossRef]
  92. Sandanayake, M.; Gunasekara, C.; Law, D.; Zhang, G.; Setunge, S.; Wanijuru, D. Sustainable criterion selection framework for green building materials—An optimisation based study of fly-ash Geopolymer concrete. Sustain. Mater. Technol. 2020, 25, e00178. [Google Scholar] [CrossRef]
Figure 1. Methodology.
Urbansci 09 00116 g001
Figure 2. Materials and granulator system.
Urbansci 09 00116 g002
Figure 3. System boundary.
Urbansci 09 00116 g003
Figure 4. Composite material in mechanical testing system.
Urbansci 09 00116 g004
Figure 5. Compressive strength of mix designs.
Urbansci 09 00116 g005
Figure 6. GHG emissions of concrete specimens (1 m3).
Urbansci 09 00116 g006
Figure 7. Map of transport requirements.
Urbansci 09 00116 g007
Figure 8. One cubic metre of concrete for transport only.
Urbansci 09 00116 g008
Figure 9. Transport of 1 cubic metre of composite material.
Urbansci 09 00116 g009
Figure 10. GHG emissions of equipment required.
Urbansci 09 00116 g010
Figure 11. Total energy, transport, and material emissions.
Urbansci 09 00116 g011
Table 1. Composition of general-purpose cement.
MaterialPortland Cement ClinkerLime-StoneGypsumClinker Kiln DustChromium (VI) Hexavalent
FormulaNACaCO3CaSO4·2H2ONACr6+
Proportion92%0–7.5%3–8%0–2.5%Trace
Table 2. Composition of mix designs.
Mix Designs Cement Plastic Milk Bottle Silica Fume Metakaolin Fine AggregateCoarse AggregateWater
Control 355 7331100210
PMB319.535.5 7331100210
SFPMB319.535.50.71 7331100210
SFMKPMB301.735.50.7117.87331100210
Table 3. Energy inputs for material production (megajoules per kilogram).
MaterialsBrown CoalBlack CoalCrude OilGeothermalSolar EnergyWater PowerWind PowerNatural GasRef.
Cement11.926.31506.275.180.242.070.3044.1[47,62]
Metakaolin11.926.342.3----44.1[47,63]
Fine aggregate11.926.342.30.00003---44.1[47,64]
Coarse aggregate11.926.342.30.00011---44.1[47,65]
Table 4. Impact categories and normalisation factors.
Impact CategoryData SourceNormalisation Factors
UnitValueReference
Terrestrial acidification potential USEtox 2017KgSO2-eq4.10 × 101[47,48]
Global warming potential IPCC 2013 baselineKg CO2-eq7.99 × 103[47,48]
Terrestrial ecotoxicity potential USEtox 2.0 Kg 1,4-DCB-eq1.04 × 103[47,48]
Marine eutrophication potentialCML & EMEP/MSC-WKg N-eq1.95 × 101[47,48]
Human toxicity potential USEtox 2.0Kg 1,4-DCB-eq2.77 × 100[47,48]
Ozone layer depletion potential IPCC/WMO 2013Kg CFC-11-eq5.90 × 10−2[47,48]
Freshwater ecotoxicity potential USEtox 2.0Kg 1,4-DCB-eq4.97 × 104[47,48]
Fossil depletionCMLKg oil-eq6.50 × 104[47,48]
Table 5. Input variables used for the Monte Carlo simulation.
Variable Parameter MinimumMaximumProbability DistributionReference
Transportation truck emissions 0.1610.307Triangular [68,69,70]
Coal (black and brown) emissions 0.631.63Triangular [68,69,70]
Gas emissions 0.270.9Triangular[68,69,70]
Renewable energy emissions 0.030.09Triangular[68,69,70]
Construction site distance (km)10150Triangular[71,72,73]
Production time of concrete (minutes)60300Triangular[74,75,76]
Capacity of cement mixer (kWh)0.81.1Triangular[77,78,79]
Capacity of rotator blender (kWh)1.21.6Triangular[80,81,82]
Capacity of granulator (kWh)2.24Triangular[83,84]
Capacity of oven (kWh)0.51.8Triangular[85,86,87]
Table 6. LCA results.
Impact CategoryReference UnitMix Designs
ControlPMBSFPMBSFMKPMB
Terrestrial acidification (TAP100)kg SO2-Eq7.58 × 10−17.08 × 10−17.08 × 10−16.99 × 10⁻¹
Global warming potential (GWP100)kg CO2-Eq3.45 × 1023.15 × 102 3.15 × 1023.04 × 102
Terrestrial ecotoxicity (TETP100)kg 1,4-DCB-Eq1.21 × 10−21.16 × 10−21.16 × 10−21.16 × 10⁻²
Marine eutrophication (MEP)kg N-Eq2.51 × 10−12.33 × 10−12.33 × 10−12.27 × 10⁻¹
Human toxicity (HTP100)kg 1,4-DCB-Eq7.76 × 1017.38 × 1017.38 × 1017.39 × 101
Ozone depletion (ODP100)kg CFC-11-Eq1.13 × 10−51.05 × 10−51.05 × 10−51.04 × 10⁻⁵
Freshwater ecotoxicity (FETP100)kg 1,4-DCB-Eq1.77 × 1001.67 × 1001.67 × 1001.63 × 100
Fossil depletion (FDP)kg oil-Eq4.03 × 1013.75 × 1013.75 × 1013.76 × 101
Table 7. Savings from control.
Impact CategoryReference UnitPMBSFPMBSFMKPMB
Climate change (GWP100)kg CO2-Eq3.04 × 1013.04 × 1014.12 × 101
Terrestrial acidification (TAP100)kg SO2-Eq5.04 × 10−25.04 × 10−25.94 × 10−2
Terrestrial ecotoxicity (TETP100)kg 1,4-DCB-Eq4.81 × 10−44.81 × 10−45.43 × 10−4
Marine eutrophication (MEP)kg N-Eq1.80 × 10−21.80 × 10−22.38 × 10−2
Human toxicity (HTP100)kg 1,4-DCB-Eq3.80 × 1003.80 × 1003.72 × 100
Ozone depletion (ODP100)kg CFC-11-Eq8.29 × 10−78.29 × 10−79.14 × 10−7
Freshwater ecotoxicity (FETP100)kg 1,4-DCB-Eq9.96 × 10−29.96 × 10−21.33× 10−1
Fossil depletion (FDP)kg oil-Eq2.83 × 1002.83 × 1002.71 × 100
Disclaimer/Publisher’s Note: The statements, opinions and data contained in all publications are solely those of the individual author(s) and contributor(s) and not of MDPI and/or the editor(s). MDPI and/or the editor(s) disclaim responsibility for any injury to people or property resulting from any ideas, methods, instructions or products referred to in the content.

