Article

Effective and Affordable Methodologies for the Optical Characterization of Envelope Materials Within Urban Contexts

1
Institute of Environment, Habitat and Energy (INAHE-CONICET), CCT Mendoza, CC 131, Mendoza 5500, Argentina
2
Eduardo Torroja Institute for Construction Science (IETCC), Spanish National Research Council (CSIC), Serrano Galvache 4, 28033 Madrid, Spain
3
Centre for Exact Sciences, Technology and the Environment, Pontifícia Universidade Católica de Campinas, Sao Paulo 13086-900, Brazil
*
Author to whom correspondence should be addressed.
Urban Sci. 2025, 9(3), 57; https://doi.org/10.3390/urbansci9030057
Submission received: 2 December 2024 / Revised: 17 February 2025 / Accepted: 18 February 2025 / Published: 22 February 2025

Abstract

The optical properties of urban envelope materials play a significant role in determining the energy balance of cities. The effective management of solar energy through these materials can help mitigate the urban heat island effect (UHI) and improve thermal comfort in urban spaces. The main objective of this study is to determine reliable methodologies for the optical characterization of opaque façade and pavement materials within urban enclosures. These methodologies should be cost-effective for implementation in emerging economies, enabling the collection of precise data for the development of urban energy simulation models. A social neighborhood in the city of Mendoza, Argentina, was selected as the case study. The optical properties of façade and pavement materials were characterized by spectrometric analysis (solar and visible reflectance, color coordinates) and in situ thermal emissivity. This research provides essential data for the development of more precise building and city simulation models, as well as for the identification of optimal materials to replace existing ones in the pursuit of strategies to reduce energy demand and enhance the urban microclimate.

1. Introduction

The surfaces of urban envelopes are composed of a mosaic of different materials, and each urban component—roofs, façades, and pavements—has characteristic optical and thermal properties. These properties modify the energy balance of buildings [1] and cities, contributing, for example, to the urban heat island (UHI) effect and its subsequent impact on global warming and human comfort [2].
The behavior of building envelopes with respect to solar radiation is related to the climatic characteristics of the site and to the physical surface properties of the materials, which determine their ability to transfer heat and reflect light [3,4]. Specifically, the reflectance and transmittance—solar and visible—and the thermal emittance of the materials influence to a greater or lesser degree the heat transfer by convection, radiation, and sun–air conduction [3].
Materiality and design play a key role in interior spaces, influencing the levels of natural lighting and energy demand for thermal conditioning of buildings [5]. From an urban perspective, they also affect the level of envelope overheating, the associated UHI effect, and air quality [6].
The majority of solar gains in buildings occur through the transparent components of the building envelope, particularly windows. However, in the last three decades, it has been recognized that the overall design of the building must also take into account the thermal load received by the whole envelope, including the opaque components of the façade, roof, and pavement [7]. In light of these considerations, the use of cold materials or materials with high solar reflectance has been proposed as a strategy for mitigating the increase in ambient temperature due to the effect of UHI. Furthermore, research indicates that these materials can reduce energy consumption for cooling in buildings [8]. However, during periods of high temperatures, when reflected solar radiation is concentrated in urban spaces, these materials can cause thermal discomfort for pedestrians [9]. Therefore, it is essential to conduct comprehensive research to fully leverage the benefits of cold materials while managing any potential drawbacks.
Efficient solar management in buildings and cities is a priority in the coming decades, especially in Latin American cities with emerging economies. This is due to the overlapping effects of climate change, UHI, and accelerated urban population growth [10]. It is notable that these issues are concentrated in specific urban areas. Indeed, the scientific literature identifies an asymmetrical distribution of mortality due to heat stress that has an accentuated impact on the most vulnerable population and in neighborhoods with fewer economic resources [11,12]. Studies conducted in Boston and Chicago indicate that the use of reflective materials can decrease mortality due to extreme heat during heat waves [13].
To optimize solar energy management, building-scale (e.g., Design Builder software) or urban-scale (e.g., EnviMet software) energy models are commonly used. These models require the definition of the optical properties of materials (visible solar reflectance and emittance) for model building and energy simulation in different scenarios. Consequently, when analyzing the energy performance and improvement possibilities of a given case study (building or urban space), more realistic models will be obtained when the optical properties considered match those of the materials present in the actual case more closely [14]. It is therefore essential to conduct on-site tests of the materials using reliable techniques. Laboratory techniques are the optimal choice for making highly precise measurements under strictly controlled conditions. However, field measurements have the advantage of evaluating materials during their use, which allows us to determine their suitability against deterioration or wear due to the passage of time [15]. With this intention, a previous work by the authors presents the optical analysis of 40 in-use materials, representing the most common surfaces of the finishing materials of pavement and walls in the city of Madrid, Spain [16]. A recent work also presents the in situ optical characterization of urban materials in Toulouse, France. The final aim in this case was to obtain a map of finishes at the local level to train machine learning tools, which can provide information on finishing materials from hyperspectral data taken from the air (by planes) or even from space (by satellites) [17]. More literature can be found on the characterization in the laboratory of different types of urban materials and their degradation [18,19,20,21].

2. Objectives

Based on the above, this research is motivated by two aspects: the urgent need to improve the habitability of urban spaces in Latin American cities and the possibility of contributing to achieving this challenge through the incorporation of materials that adequately manage solar radiation within the street canyons. In this framework, the main objective of the research is to establish reliable methodologies for the determination of the optical and thermal properties of opaque materials of the urban envelope using in situ measurements. The methodologies should provide adequate values for the solar and visible absorptance and the emissivity of the envelope materials that will allow for the construction of realistic models in energy simulation tools. In addition, they should employ affordable equipment in order to make its use feasible in countries with emerging economies.
The research is structured around two specific objectives:
  • The evaluation of in situ optical response of opaque coatings used on urban building envelopes, focusing on a case study within a social housing neighborhood in the Mendoza Metropolitan Area, Argentina. The collected data will contribute to the development of strategies for improved building and urban energy efficiency, specifically through the creation of representative models.
  • The assessment of the scope of methodologies and instruments used for the in situ optical characterization of materials, since their reliability may be constrained with respect to those obtained in a laboratory setting. In particular, field measurements are subject to uncontrolled variations in temperature and humidity conditions, as well as the presence of pollutants and/or dust in the environment and the necessary movement of equipment to characterize different materials. Firstly, the reliability of the results obtained from the characterization must be evaluated, particularly in the case of materials with geometrically complex and non-homogeneous surfaces. Secondly, the reliability of low-cost methodologies and instruments that allow this characterization to be carried out in every socioeconomic context must be evaluated.

3. Materials and Methods

3.1. Study Area

The selected study area is Barrio Cementista in the department of Las Heras, northwestern Mendoza (latitude: 32°54′48″ S; longitude: 68°50′46″ W). The neighborhood was constructed in accordance with a national plan for construction workers in the 1980s. The area was selected for study because it is representative of traditional social neighborhoods in the city of Mendoza in terms of its technological and functional characteristics. The neighborhood encompasses an area of 1 hectare and is situated 3.2 km from the center of Mendoza (Figure 1). The urban distribution of the sector is composed of 80% built-up area, 13% green areas, and 7% street surfaces. It is essentially residential. This area has great potential for urban renovation due to its continuous expansion and projected growth. It also represents a characteristic urban fabric of 20th-century residential developments in Latin American cities, allowing for conclusions to be drawn for numerous cases.
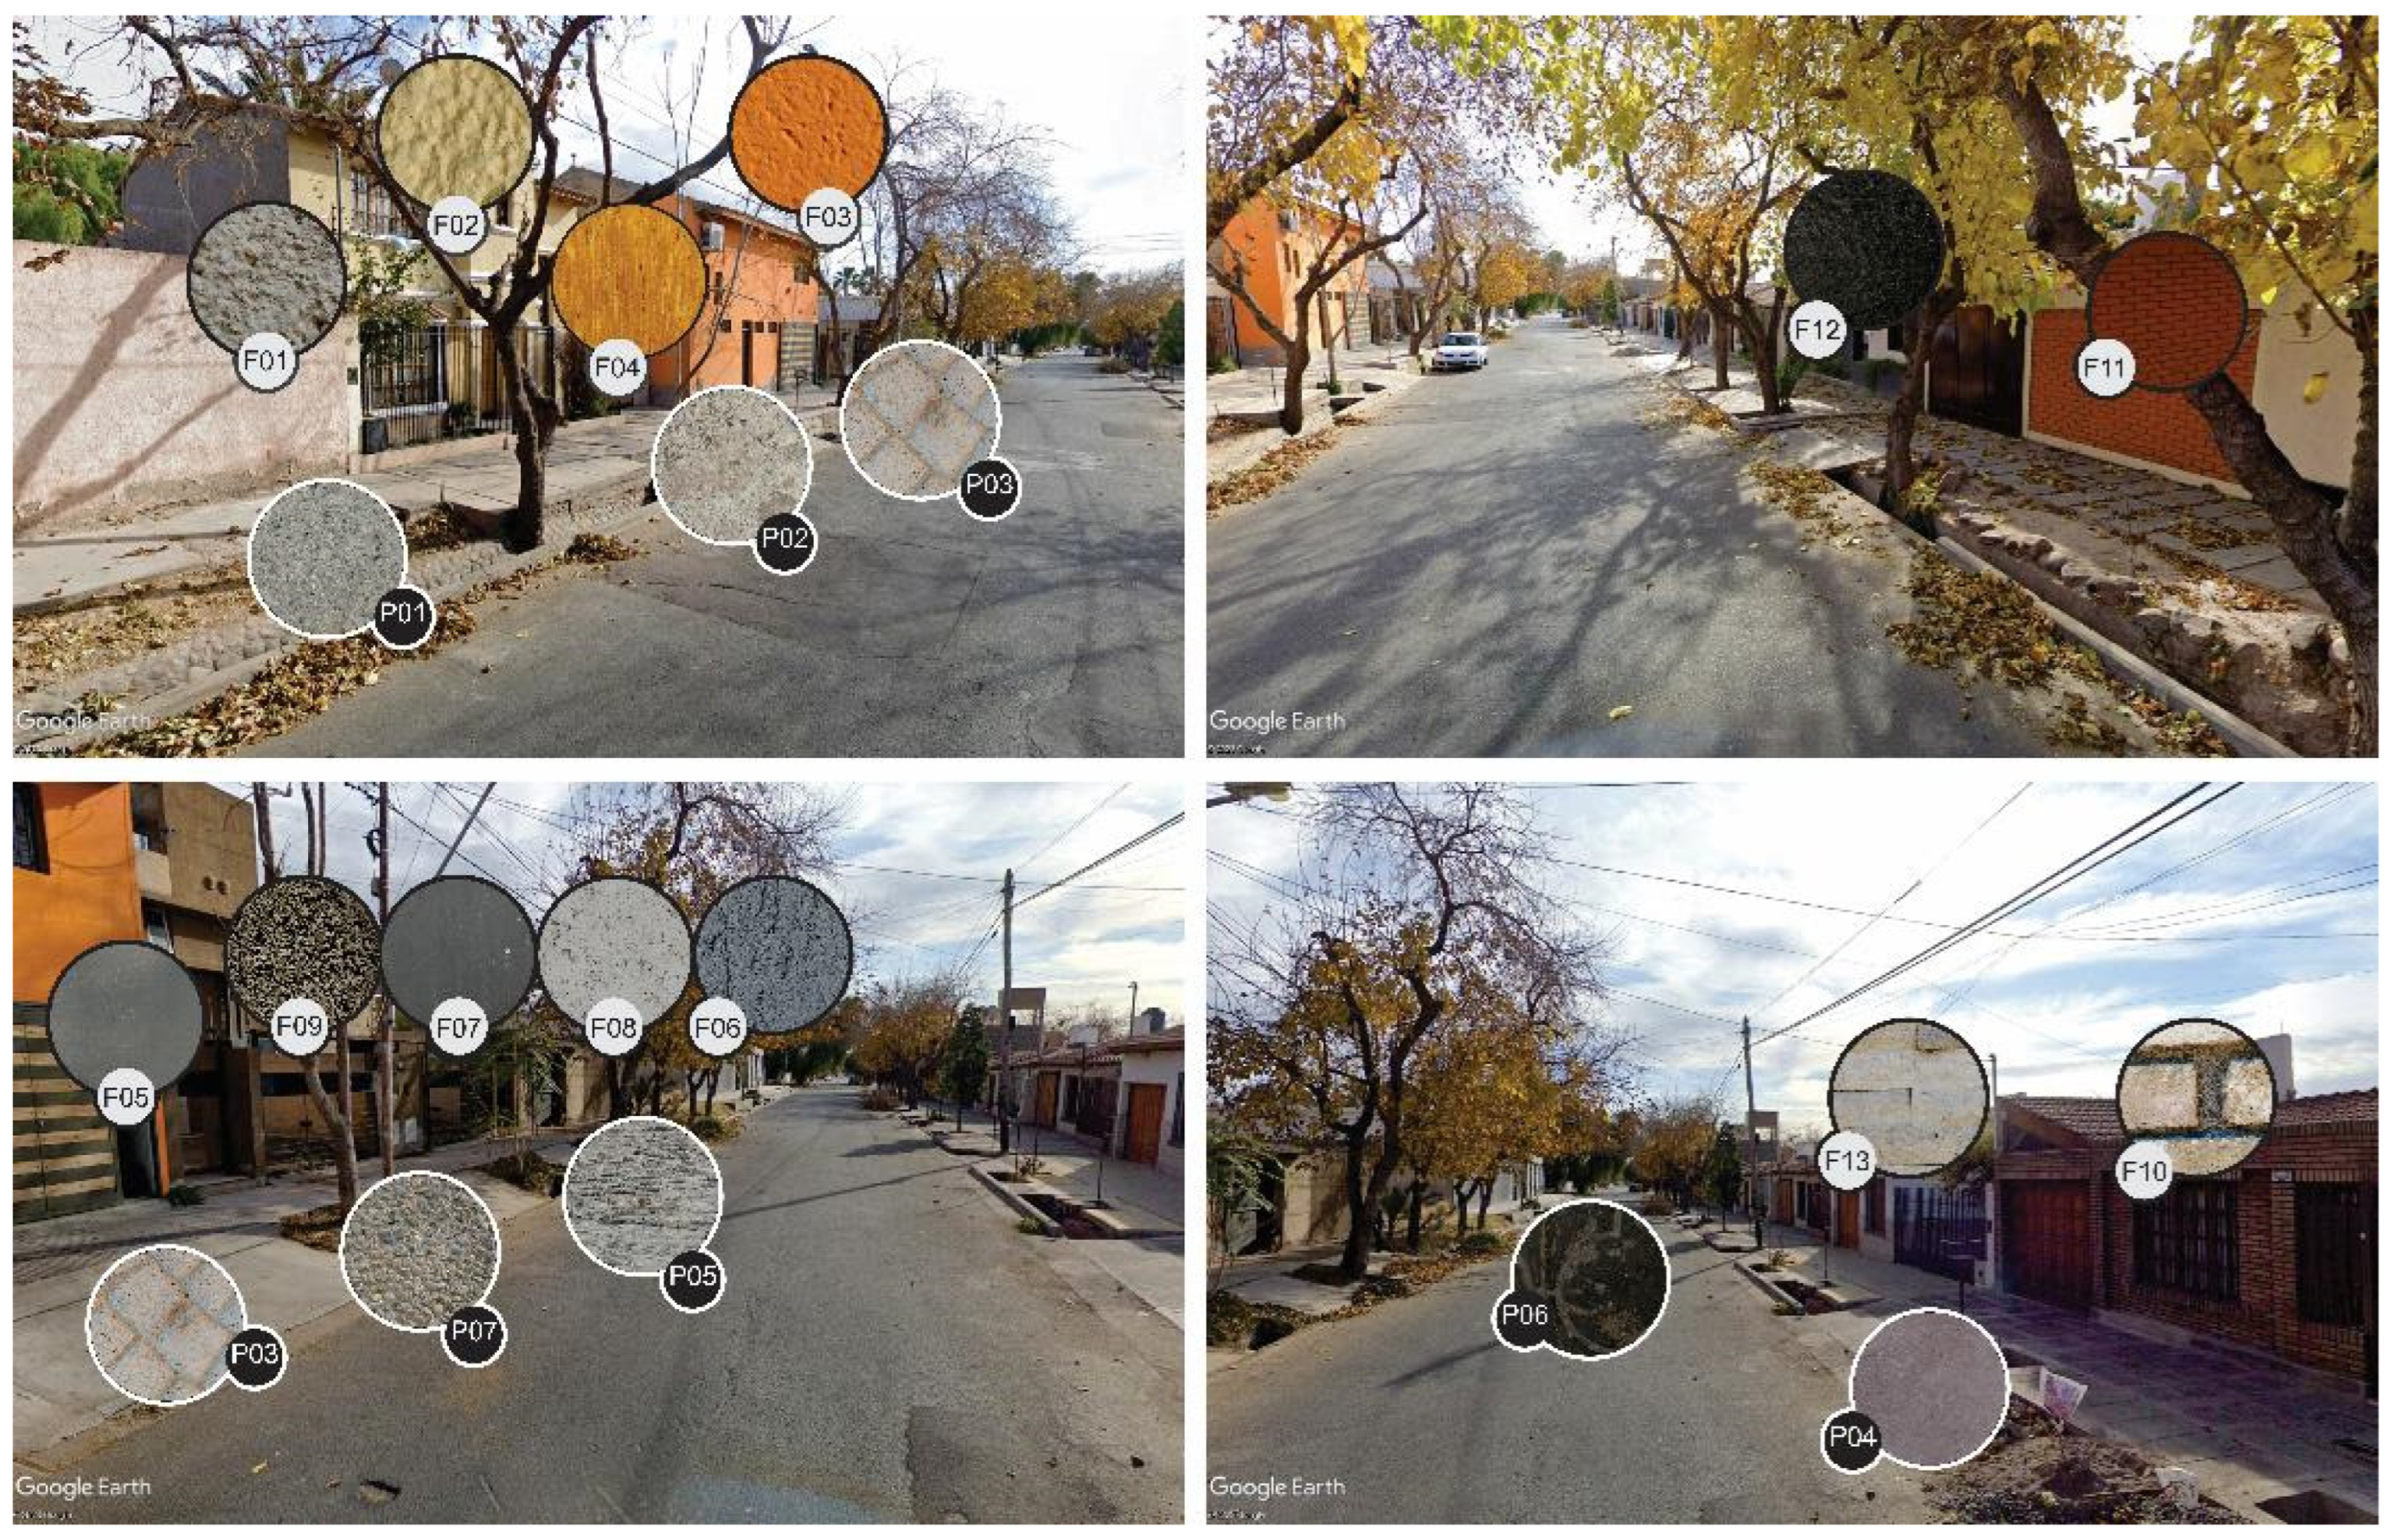
The area selected for the study is characterized by building homogeneity, in terms of both morphology and material composition. Figure 2 outlines the materials and location of the analysis samples, which were selected for their high representativeness in the case study. Figure 3 describes the spatial distribution of infrared temperature of the analyzed street canyon.

3.2. Optical Properties Analyzed

The surface properties analyzed in this study include solar reflectance (albedo), visible reflectance, color coordinates, and thermal emissivity (ε).
Solar reflectance or albedo (â) is the ratio of the reflected radiant flux to the incident radiant flux in the solar range. Since more than 99% of the energy content of solar radiation is in the 0.2 to 2.5 µm wavelength band, the practical implementation of the albedo definition usually restricts the analysis to this range [22]. The definition of albedo is:
â s w = λ = 0.0 â λ G λ d λ λ = 0.0 G λ d λ λ = 0.2 µ m 2.5 µ m â λ G λ d λ λ = 0.2 µ m 2.5 µ m = G λ d λ ,
âsw: shortwave reflectance (albedo), âλ: spectral reflectance, Gλ: solar spectral irradiance, and dλ: spectral differential.
This property is a determinant of the maximum temperatures reached by a material exposed to the external environment. Opaque surfaces with low solar reflectance absorb a larger proportion of the incident solar energy. A portion of this energy is conducted into the ground and inside buildings; another portion is transmitted by convection into the air (resulting in an increase in air temperature), and the remaining portion is radiated towards the sky [23].
Similarly, the visible reflectance is defined as the ratio of the reflected radiant flux to the incident radiant flux for wavelengths of between 380 and 780 nm. It is also the sum of the normal reflectance ρ and the diffuse reflectance ρd. When defined in terms of wavelength, it is called the visible spectral reflectance.
  • Color coordinates have been defined in CIELab space, which is a uniform color space intended to represent perceived threshold or suprathreshold color differences of equal size [24]. It is one of the most widely used color spaces in the industry. Typical applications include color specification and color difference assessment. The CIELAB color system, also known as CIE L*a*b*, provides a quantitative representation of color relationships across three axes: The L* value indicates the lightness, while a* and b* represent the chromaticity coordinates. In the color space diagram, L* is represented on a vertical axis with values from 0 (black) to 100 (white). The a* value indicates the red–green component of a color, with positive and negative values representing the red and green components, respectively. The yellow and blue components are represented on the b* axis as positive and negative values, respectively. The neutral or achromatic point is located at the center of the plane [25]. In order to determine the color coordinates, it is necessary to define both the observer and the standard illuminant.
  • Total hemispherical emittance (HTE) is the total radiant power emitted by a surface per unit area and per unit solid angle in a given direction.
ε = (P − P_r)/(ε2 σT4),
ε: surface emissivity, P: total power radiated by the surface, P_r: power reflected by the surface, σ: Stefan–Boltzmann constant (5.67 × 10⁻⁸ W m−2 K−4), ε2: perfect blackbody emissivity (ε2 = 1), and T: absolute temperature of the surface (in Kelvin).

3.3. Equipment and Methodologies

To obtain the values of the mentioned optical properties, three observations were made for each material. The equipment and methodologies used for the characterization of each of the properties are detailed in the following sections:
  • Solar reflectance (r_sol) and visible reflectance (r_vis): are determined from reflectance spectra measured with modular Stellarnet equipment consisting of a radiation source and two spectrometers. The source is a tungsten–halogen lamp with a spectral range of 350 nm to 2200 nm, a power output of 200 W/m2, and an optical color temperature of around 2800 K, including a color equalizer filter. The Black Comet spectrometer provides detection in the 200–1080 nm range with a concave grating optics, having no mirrors or optical adjustments, and a 2048-pixel CCD detector. An internal slit with a size of 50 µm gives rise to an estimated resolution of 2.0 nm. The Dwarf Star spectrometer provides detection in the 900–1700 nm range with a 512-pixel Peltier-cooled InGaAs detector. The resolution is 2.5 nm with a slit width of 25 μm. The equipment’s measurement range combining the different modules is from 350 to 1700 nm, which covers over 95% of solar energy, though it does not span the full wavelength range of 200 to 2500 nm (Equation (1)). The reflectance is measured using a probe comprising seven illumination optical fibers encircling a central reflected radiation measurement fiber. The probe can be housed in a fixture that allows the angle of incidence of the radiation to be defined as either 45° with respect to the sample surface (more suitable for samples with a glossy finish) or 90° (more suitable for a matte finish). The geometry of the measurement is not as reliable as the one based in integrating spheres usual in laboratory equipment. However, unlike the laboratory configurations, the probe used provides the higher signal and lower measuring times that are necessary for in situ characterization. Different strategies are implemented to improve the reliability of the measurement results. It is essential to optimize the distance between the probe tip and the surface to be measured and fix it along the measurements for each configuration in order to obtain the maximum signal in the spectrometer. The various components of the equipment are linked via single or bifurcated optical fibers of varying diameters, contingent on the signal in question. To calibrate the equipment, the zero signal is defined by covering the radiation output of the source with a mask. This process eliminates the need to turn off the radiation source at each calibration, which would otherwise result in a loss of signal stability. Calibration is completed using a Spectralon standard with a reflectance value (mostly diffuse) greater than 97% over the entire measurement range of the instrument. It is important to note that the reflectance measurement may be affected if there is significant movement of the optical fibers. Therefore, it is advisable to perform the calibration with the standard placed on the surface to be measured and to avoid unnecessary movement during measurement. This condition implies the need to repeat the calibration for each material in the case of in situ measurements such as those presented in this study. It is also important to note that the reflectance values obtained are relative to the reflectance of the Spectralon standard. Consequently, the accuracy of the results depends on the accuracy of the reflectance values of the standard and will be affected by the aging of its surface. Field measurements are carried out under poorly controlled conditions, which in many cases lead to degradation of the standard. To improve the accuracy of the results without investing in costly periodic calibrations by accredited bodies, standards used for field measurements are often calibrated against an unaged calibrated standard stored under stable conditions.
  • CIELab color coordinates are determined from reflectance spectra measured with the Stellarnet Black Comet spectrometer, in accordance with the CIE 1964 Standard Observer and D65 Illuminant. The results obtained with this instrumentation will be compared with those produced by the NR20XE 3nh precision colorimeter, which complies with the “CIE 15: Technical Report: Colorimetry” that considers the CIE 1964 Standard Observer and D65 Illuminant [26]. The colorimeter has a repeatability of ΔE*ab 0.08 with a measuring aperture of Φ20 mm (Figure 4).
  • Emissivity (ε) is measured with a portable emissivity meter (ET100 with SOC410 unit) from Surface Optics Corporation, which complies with ASTM E408-19 [27]. The ET100 measures total directional emittance by directing radiation onto a surface in a specific direction and collecting the reflected radiation in all directions. This instrument features a measuring head based on a modified integrating sphere with an internal gold coating. The instrument is calibrated with a specular gold standard and records the total directional reflectance for angles of incidence of 20° and 60° in six discrete bands in the infrared spectral region: 1.9–2.4, 3.0–3.9 µm (mid IR), 4.0–5.0, 5.0–10.0, and 10.0–21.0 µm (long IR) using six combined filters. Based on these measurements, it determines the total directional emittance at these angles of incidence. Additionally, it calculates the total hemispherical emittance (HTE) using the measurements taken at 20°. The declared accuracy of the emissivity measurements is ±0.03.

4. Results

The results are analyzed in three sections. The first section evaluates the optical response of the materials found in the neighborhood. This includes solar and visible spectral reflectance, thermal emissivity, and color coordinates (Section 4.1). The second section discusses the reliability of the measurement techniques and the instrumentation used to evaluate the optical properties of the materials in situ (Section 4.2). Finally, the third section compares observations obtained with low-complexity and high-complexity portable instruments and provides a comparative analysis of solar and visible reflectance (Section 4.3).

4.1. Optical Response of Opaque Urban Materials

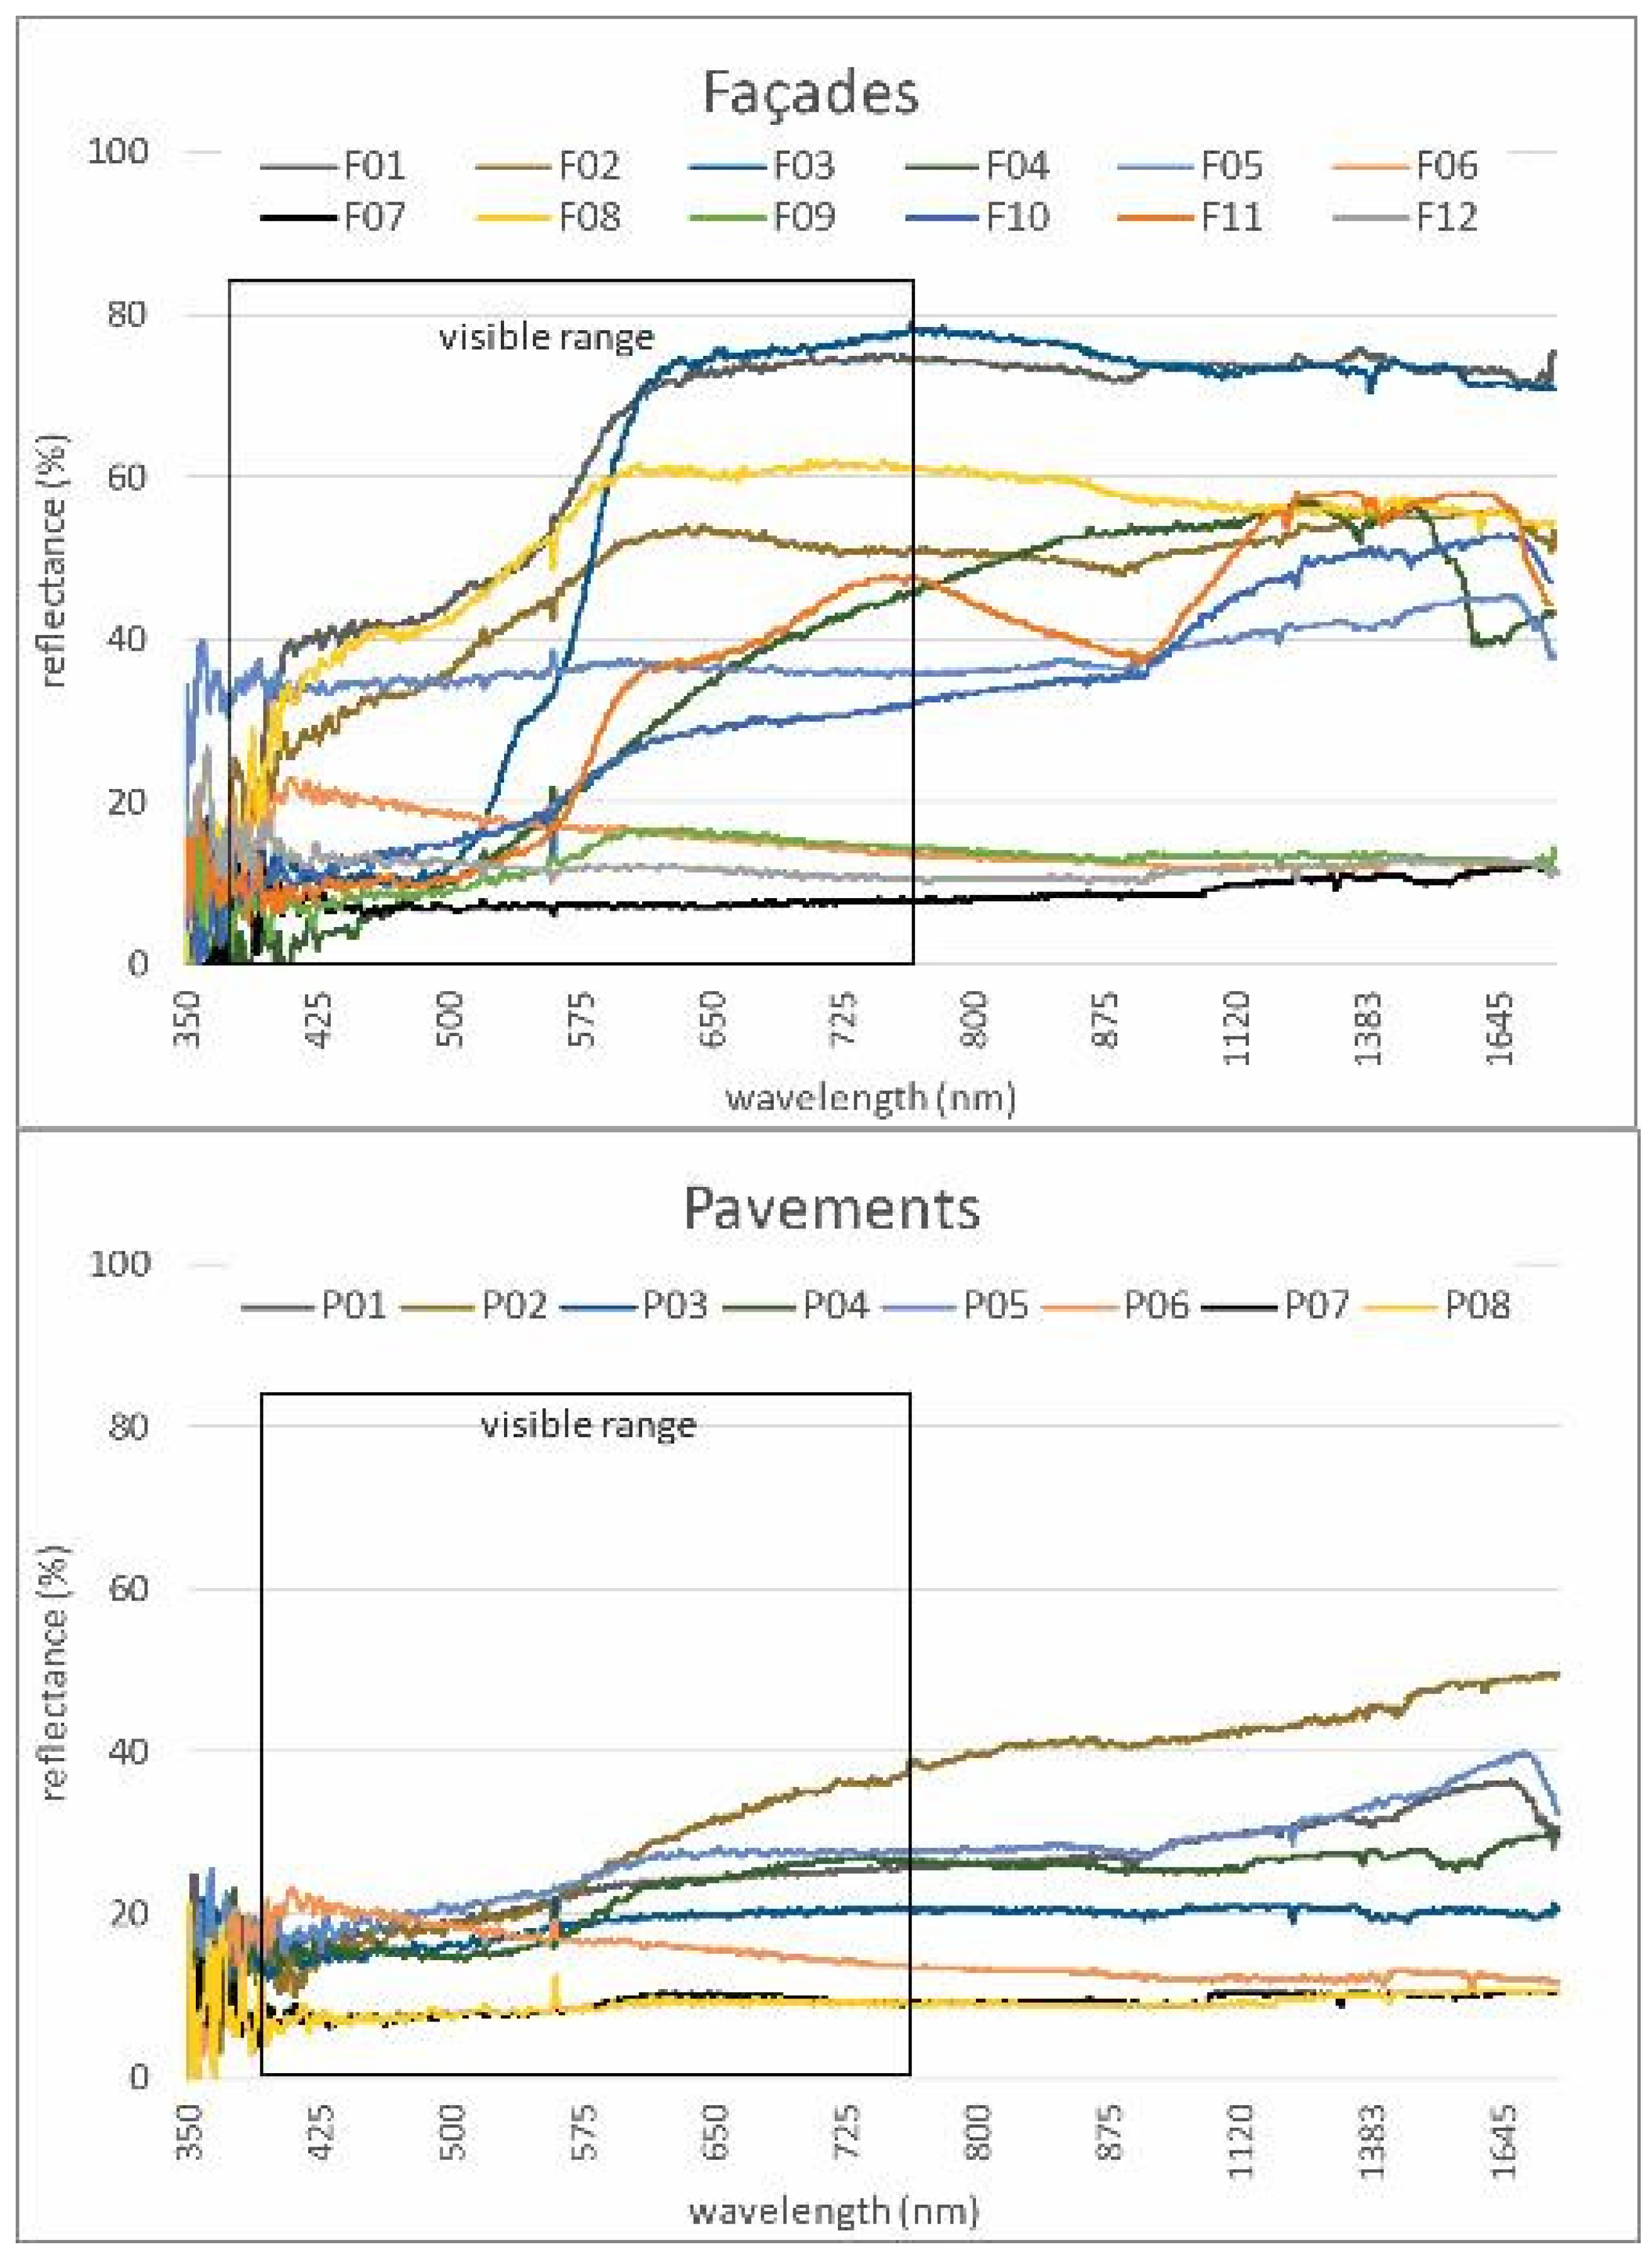
Figure 5 illustrates the average reflectance spectra of each envelope material analyzed, classified according to its position within the urban canopy: vertical (façades) or horizontal (pavements) for the visible and near-infrared range (350 nm to 1700 nm).
Table 1 and Table 2 provide an overview of the average values and deviations of r_vis and solar properties, CIELab color coordinates, and infrared emittance of façades and pavements, respectively.
A review of global trends in vertical envelopes reveals that the façade materials have an average visible reflectance (r_vis) value of 0.28, with minimum levels of 0.07 and maximum levels of 0.57. The average solar reflectance (r_sol) is 0.32, with minimum levels of 0.08 and maximum levels of 0.61. A similar range of solar reflectance, with slightly higher values (0.15–0.71), was reported for the most common façade materials in Madrid [16]. Emissivity, however, is the property that shows the least variation, with an average value of 0.89, a minimum of 0.82, and a maximum of 0.91 (Table 1).
In regard to pavements, the average r_vis value is 0.18, with a minimum of 0.08 and a maximum of 0.25. The average r_sol value is 0.20, with a minimum of 0.08 and a maximum of 0.31 (Table 2). A lower variability in the solar reflectance of pavement finishes, with lower mean values compared to those of the façades, was also obtained in the analysis of urban materials in Madrid (r_sol of between 0.13 and 0.40) [16].
The analysis indicates that both façade and pavement components exhibit mainly intermediate and low visible reflectance values, suggesting a prevalence of medium and dark colors in the study area. These surfaces also have a low solar r_sol, which results in greater absorption of incident solar radiation. This can lead to an increase in surface temperature. It is worth noting that the F01 façade, with its light shades (CIELab = 79.35; 10.60; 14.99), has the highest reflectance along the spectral curve, reaching its peak at 600 nm and above (Figure 5).
The results collected in Table 1 and Table 2 can be compared with those reported in the literature for different types of materials. In the case of façade materials, the authors analyzed the albedo and the emissivity of 80 samples of textured claddings and 16 samples of façade paints with different composition, color, finish, and texture. The initial values of albedo range from 0.26 for a dark grey acrylic finish with fine texture, to 0.94 for a white concrete finish with medium texture. These values decrease to 0.23 and 0.54, respectively, after exposure to outdoor conditions for three years. Lower values of solar reflectance are obtained for some façade finishes in the present work, which may be due partially to the different method used to measure r_sol with respect to the albedo measurements that were performed in controlled conditions according to Akbari et al.’s (2008) method [28]. The scope of optical and thermal characterization methodologies for construction materials was discussed at Villalba (2018) [14].
In the case of pavements, the solar reflectance of black conventional asphalt observed in previous works ranges from 0.04 to 0.06, and higher values (up to 0.25) are obtained for the in-use material when subjected to aging [8,16,20]. The r_sol value of 0.08 obtained in this work is coherent with the slightly aged appearance of the asphalt pavements in the case study. The emissivity value (0.91) is also within the range reported in the literature analyzing [20,21] the optical response of 38 precast concrete pavement specimens from different concrete mixes, representing the range of precast concrete pavements produced in Spain. The solar reflectance ranges from 0.13 to 0.79, depending on the concrete composition. The lower values correspond to paving materials made with dark grey Portland cement and fine siliceous aggregates, while the higher values are found for white precast concrete samples, made with white Portland cement and white aggregates as marble powder. Apart from these extreme cases, most of the samples show a solar reflectance of between 0.2 and 0.5. Compared to these results, the values obtained in the present work for cementitious pavements (P01, P03, P04, P05, and P06) ranging from 0.17 to 0.27 are relatively low. These low values may be related to the dark colors of these pavements and to a weathering effect that diminishes the solar reflectance due to the accumulation of dirt [16,23].
The average infrared emissivity of the sample unit is 0.90, with minimum records of 0.88 and maximums of 0.91. These high emissivity ranges are in line with the values typically observed for non-metallic building materials, which are known to function as highly efficient long-wave energy radiators [18] (Table 2). The high infrared emissivity demonstrates the effectiveness of building materials in releasing accumulated heat in the form of long-wave radiation to cooler surfaces. However, this characteristic can result in increased urban overheating due to the reduced sky-view factor in vial channels [29].
Next, boxplot diagrams were created to illustrate the radiative behaviors in r_sol and r_vis, grouped by component (Figure 6).
The graph demonstrates a strong correlation between the values of r_vis and r_sol for the total sample unit. The coefficient of determination (R2) is equal to 0.976, indicating a strong correlation between the two ranges of the spectrum (Figure 6).
In particular, an analysis of the behavior based on the component category reveals that the façade materials exhibit greater variability than the pavement materials in r_sol and r_vis. The façades analyzed show the highest coefficient of variation (CV%) for r_vis (CV% 60.54), followed by r_sol (CV% 57.29). In the case of pavements, the greatest variability is observed in solar reflectance (CV% 41.21), with visible reflectance showing a slightly lower coefficient (CV% 37.70). This is due to the fact that pavements exhibit greater similarity in shades than in façades. These results demonstrate that the local market offers a wider range of façade materials that can be selected based on their radiative response. In contrast, pavements exhibit more limited ranges of variation and solar and visible reflectance values below 0.30. The same tendencies were observed in previous analysis of urban materials common in the city of Madrid, Spain [16].

4.1.1. Cluster Analysis of Solar and Visible Reflectance

To analyze materials with similar optical behaviors based on their reflective responses, tree diagrams, or dendrograms, were constructed in plot hierarchies based on the degree of similarity and shared characteristics. The materials were grouped into clusters (Figure 4 and Figure 5). The r_sol and r_vis clusters were ordered using the K-nearest neighbors (KNN) method, with a Euclidean squared distance metric.
KNN is a supervised machine learning algorithm used for both classification and regression. Its fundamental principle is based on the idea that similar data points tend to be close to each other in feature space. The squared Euclidean distance is used to detect the largest differences between points. Distances of 0.05 (high similarity), 0.1 (medium similarity), and 0.2 (low similarity) were used [30].
In the solar range, the data sets were grouped into two categories (Figure 7). The initial cluster comprises light-toned, textured façade materials, exhibiting an average r_sol of 0.53. The second cluster comprises two subcategories, with a distance of less than 0.05 between them. The first subgroup stands out from the rest due to the unique characteristics of the metallic material F05. This subgroup includes materials such as cementitious, stone, and wood materials, which are typically brown, terracotta, or gray in color, with an average r_sol of 0.30. The second subgroup comprises blue paints, stone materials, cementitious materials, and dark gray and black metals (F06, P06, F07, P08, P07, F12, F09).
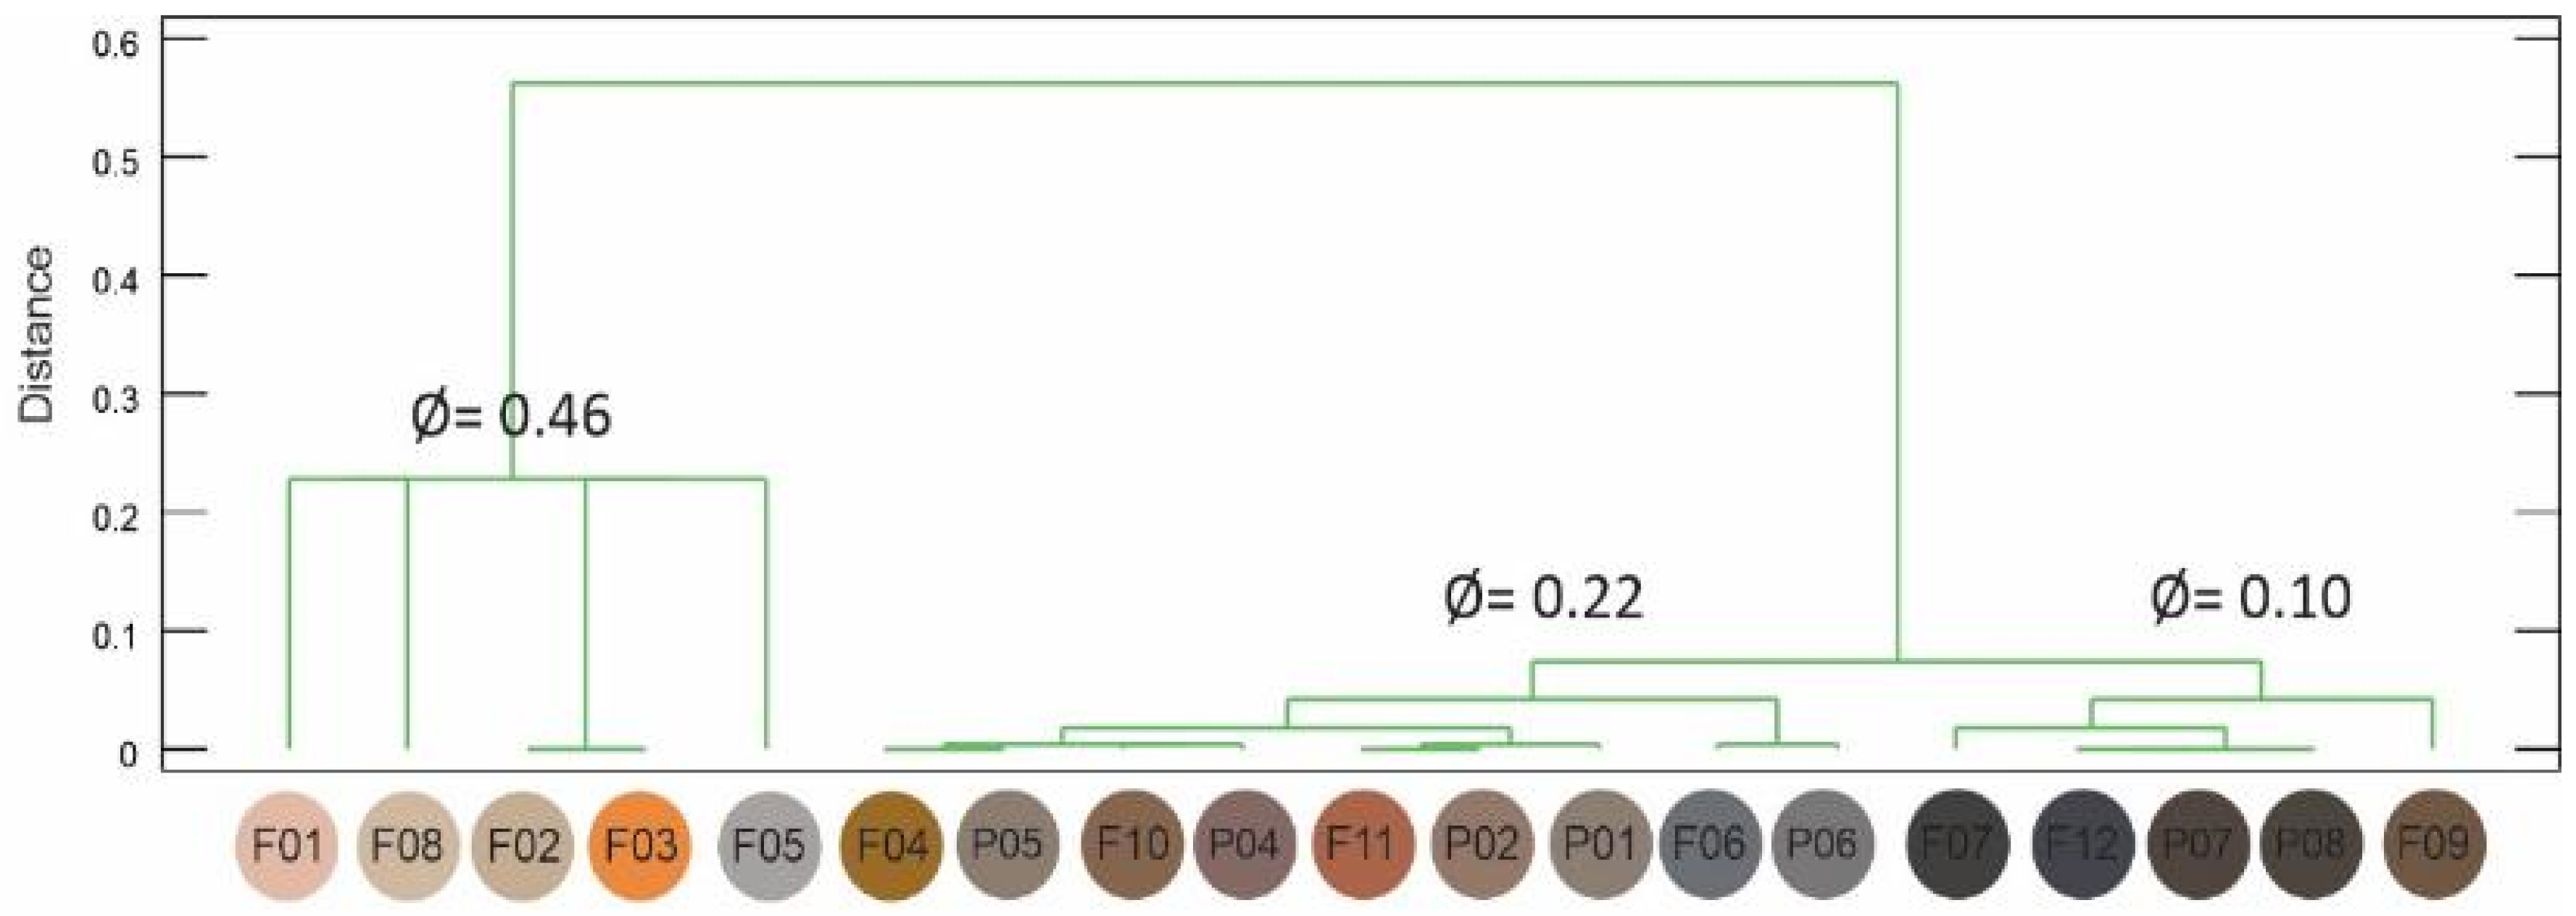
As illustrated in Figure 8, the visible range reveals two distinct groups. The first group is composed entirely of façade materials, primarily textured and plastered coatings in light shades with an average r_vis of 0.46. This group demonstrates low similarity in their response, which results in them behaving as outliers (F01, F08, F02, F03, F05). Their Euclidean distance exceeds 0.2, indicating a significant discrepancy in their visible spectral response. The second group demonstrates greater similarity in their visible spectral response (distance of less than 0.1) and is composed of the darkest shades of façades and pavements. Two subcategories within the second group demonstrate a high degree of similarity in their spectral response, with a distance of less than 0.05 in r_vis. The first subgroup has an average r_vis of 0.22 and is composed of materials in grayish, reddish, and blue shades (F04, P05, F10, P04, F11, P02, P01). The second subgroup is composed of materials in black, brown, and dark gray shades, with a very low average r_vis, equal to 0.1 (F07, F12, P07, P08, F09) (Figure 5).
A comparison of the responses in r_sol and r_vis indicates that the hierarchical distribution is maintained, with the data grouped mainly by similarity of shades: light, medium, and dark. The materials analyzed have similar thermal characteristics, including high thermal inertia, density, and low thermal conductivity. However, materials that do not possess these characteristics, such as metal and wood, were identified, necessitating a modification to the hierarchical order. To illustrate, F05, a light gray metallic material, is ranked 12th in r_sol, while in r_vis it is ranked 5th (Figure 7 and Figure 8).

4.1.2. Color Coordinates

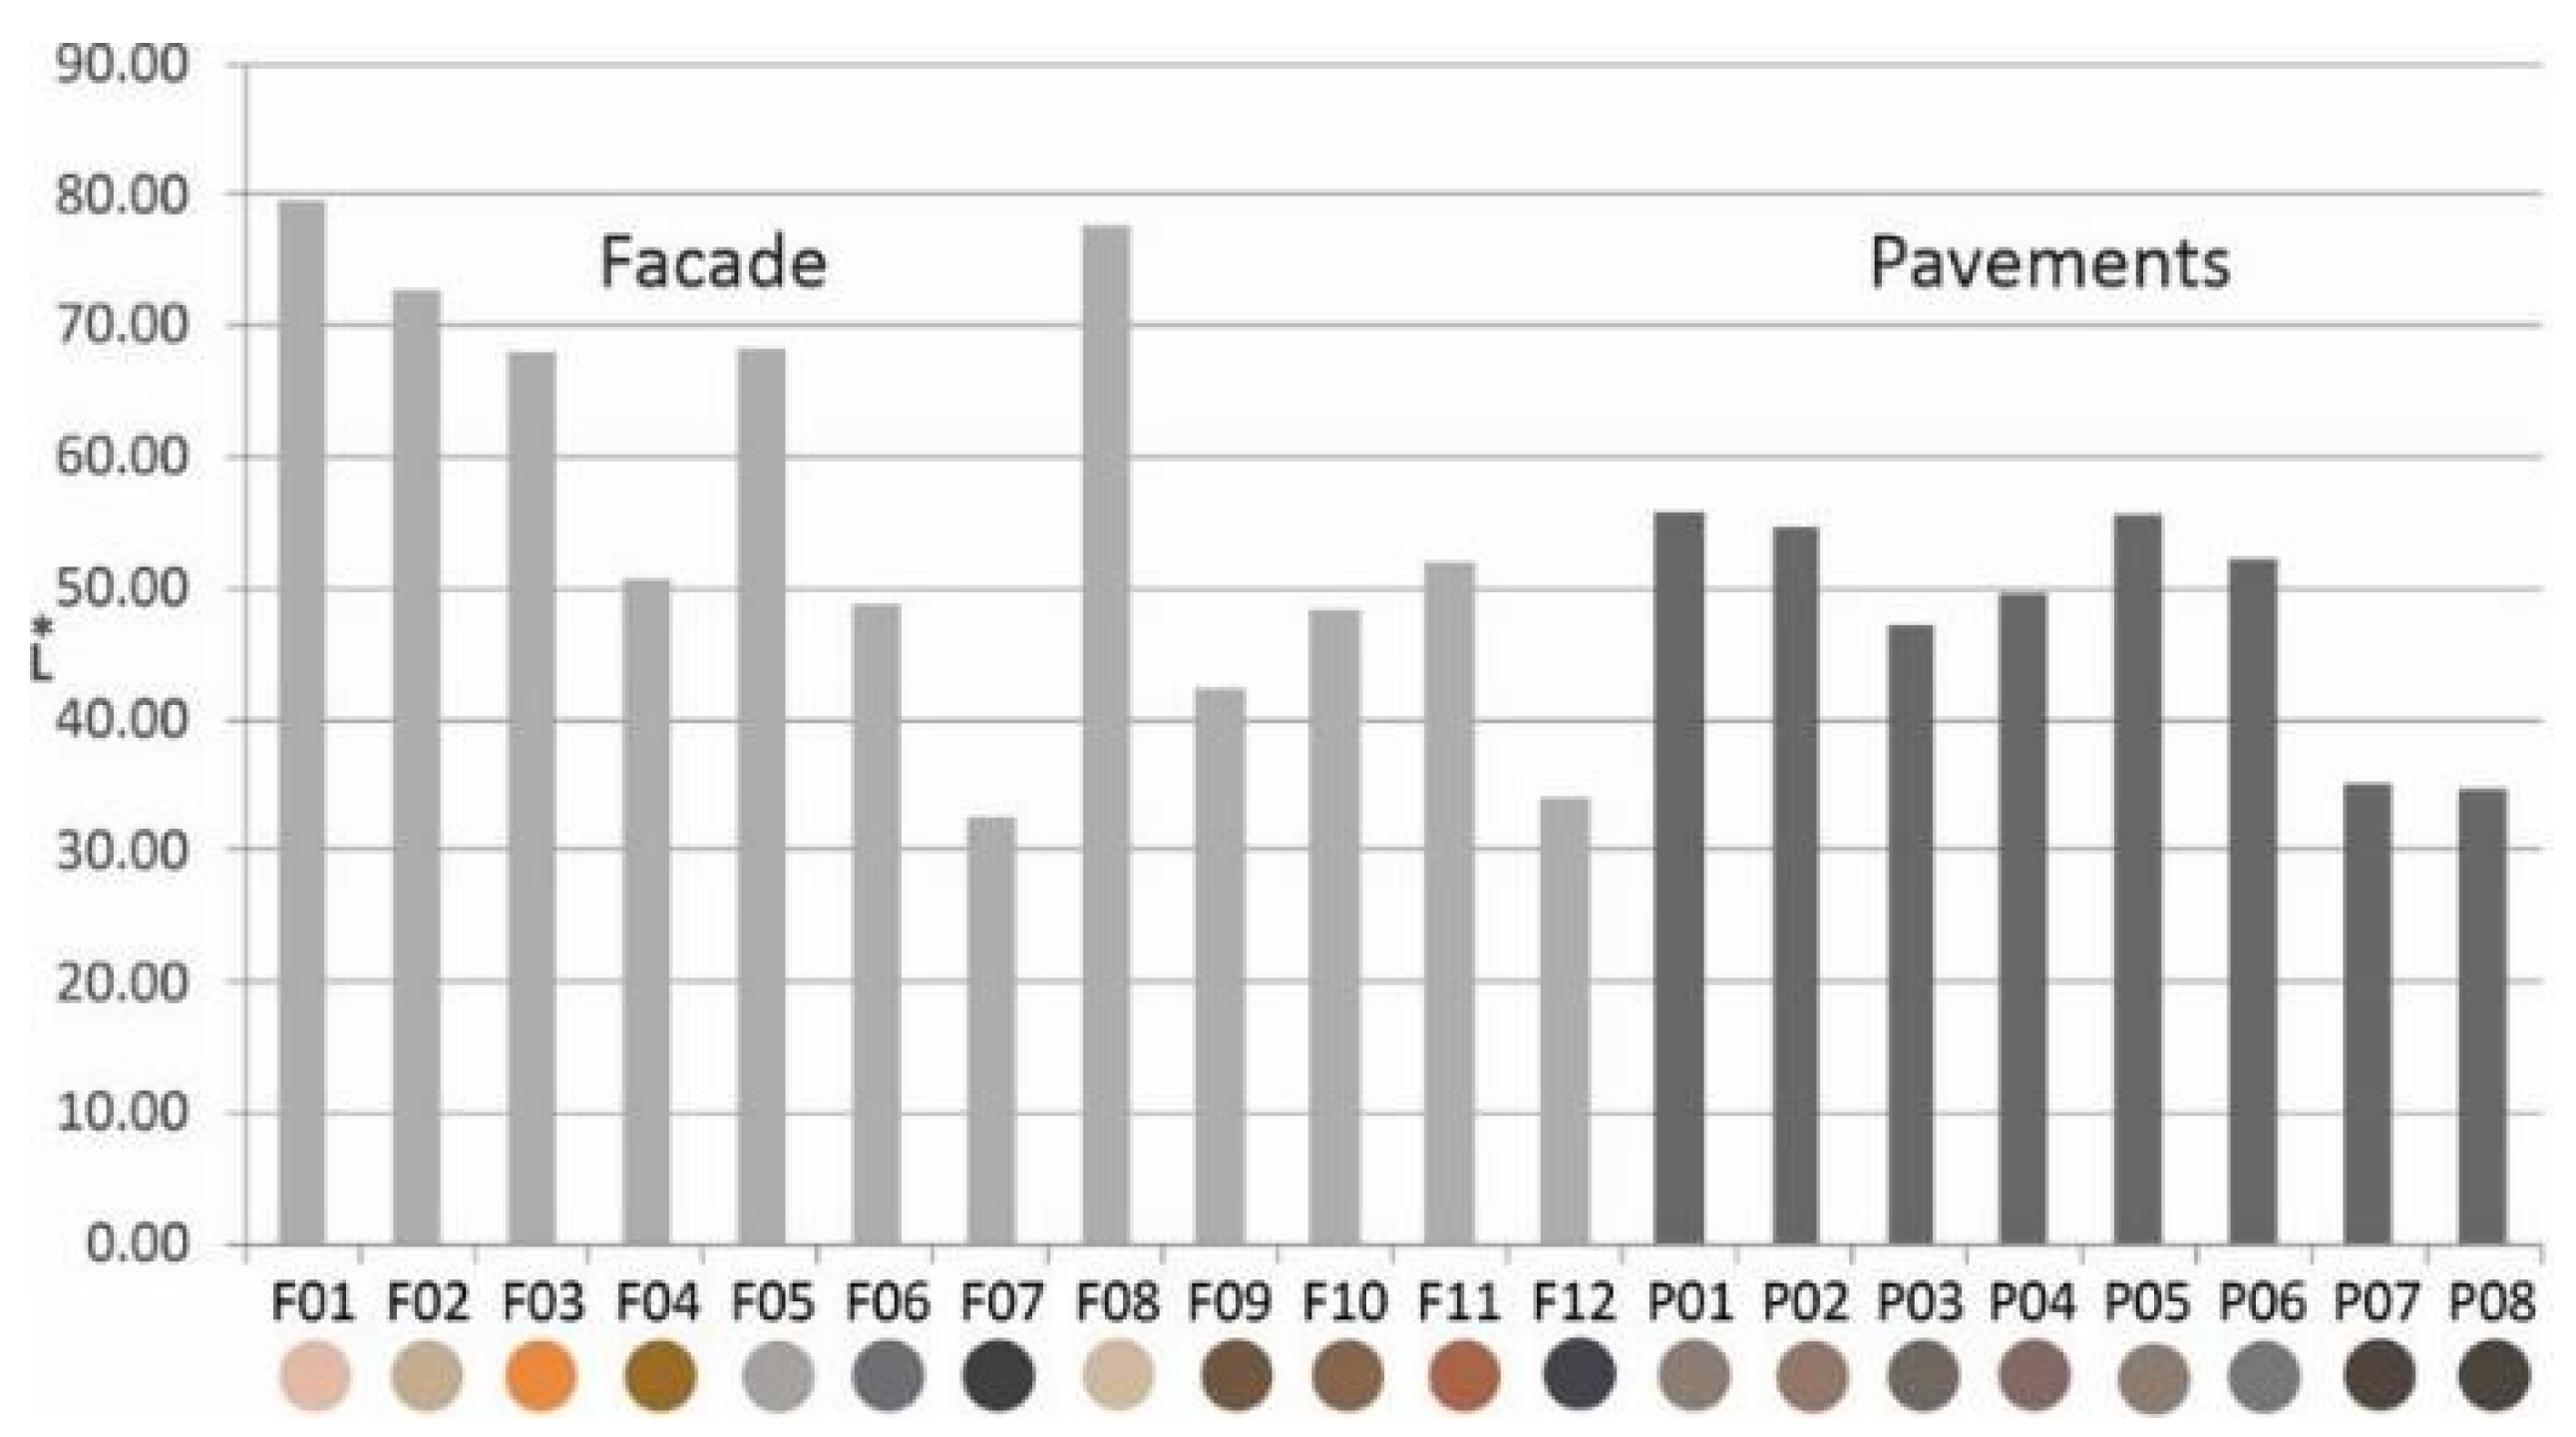
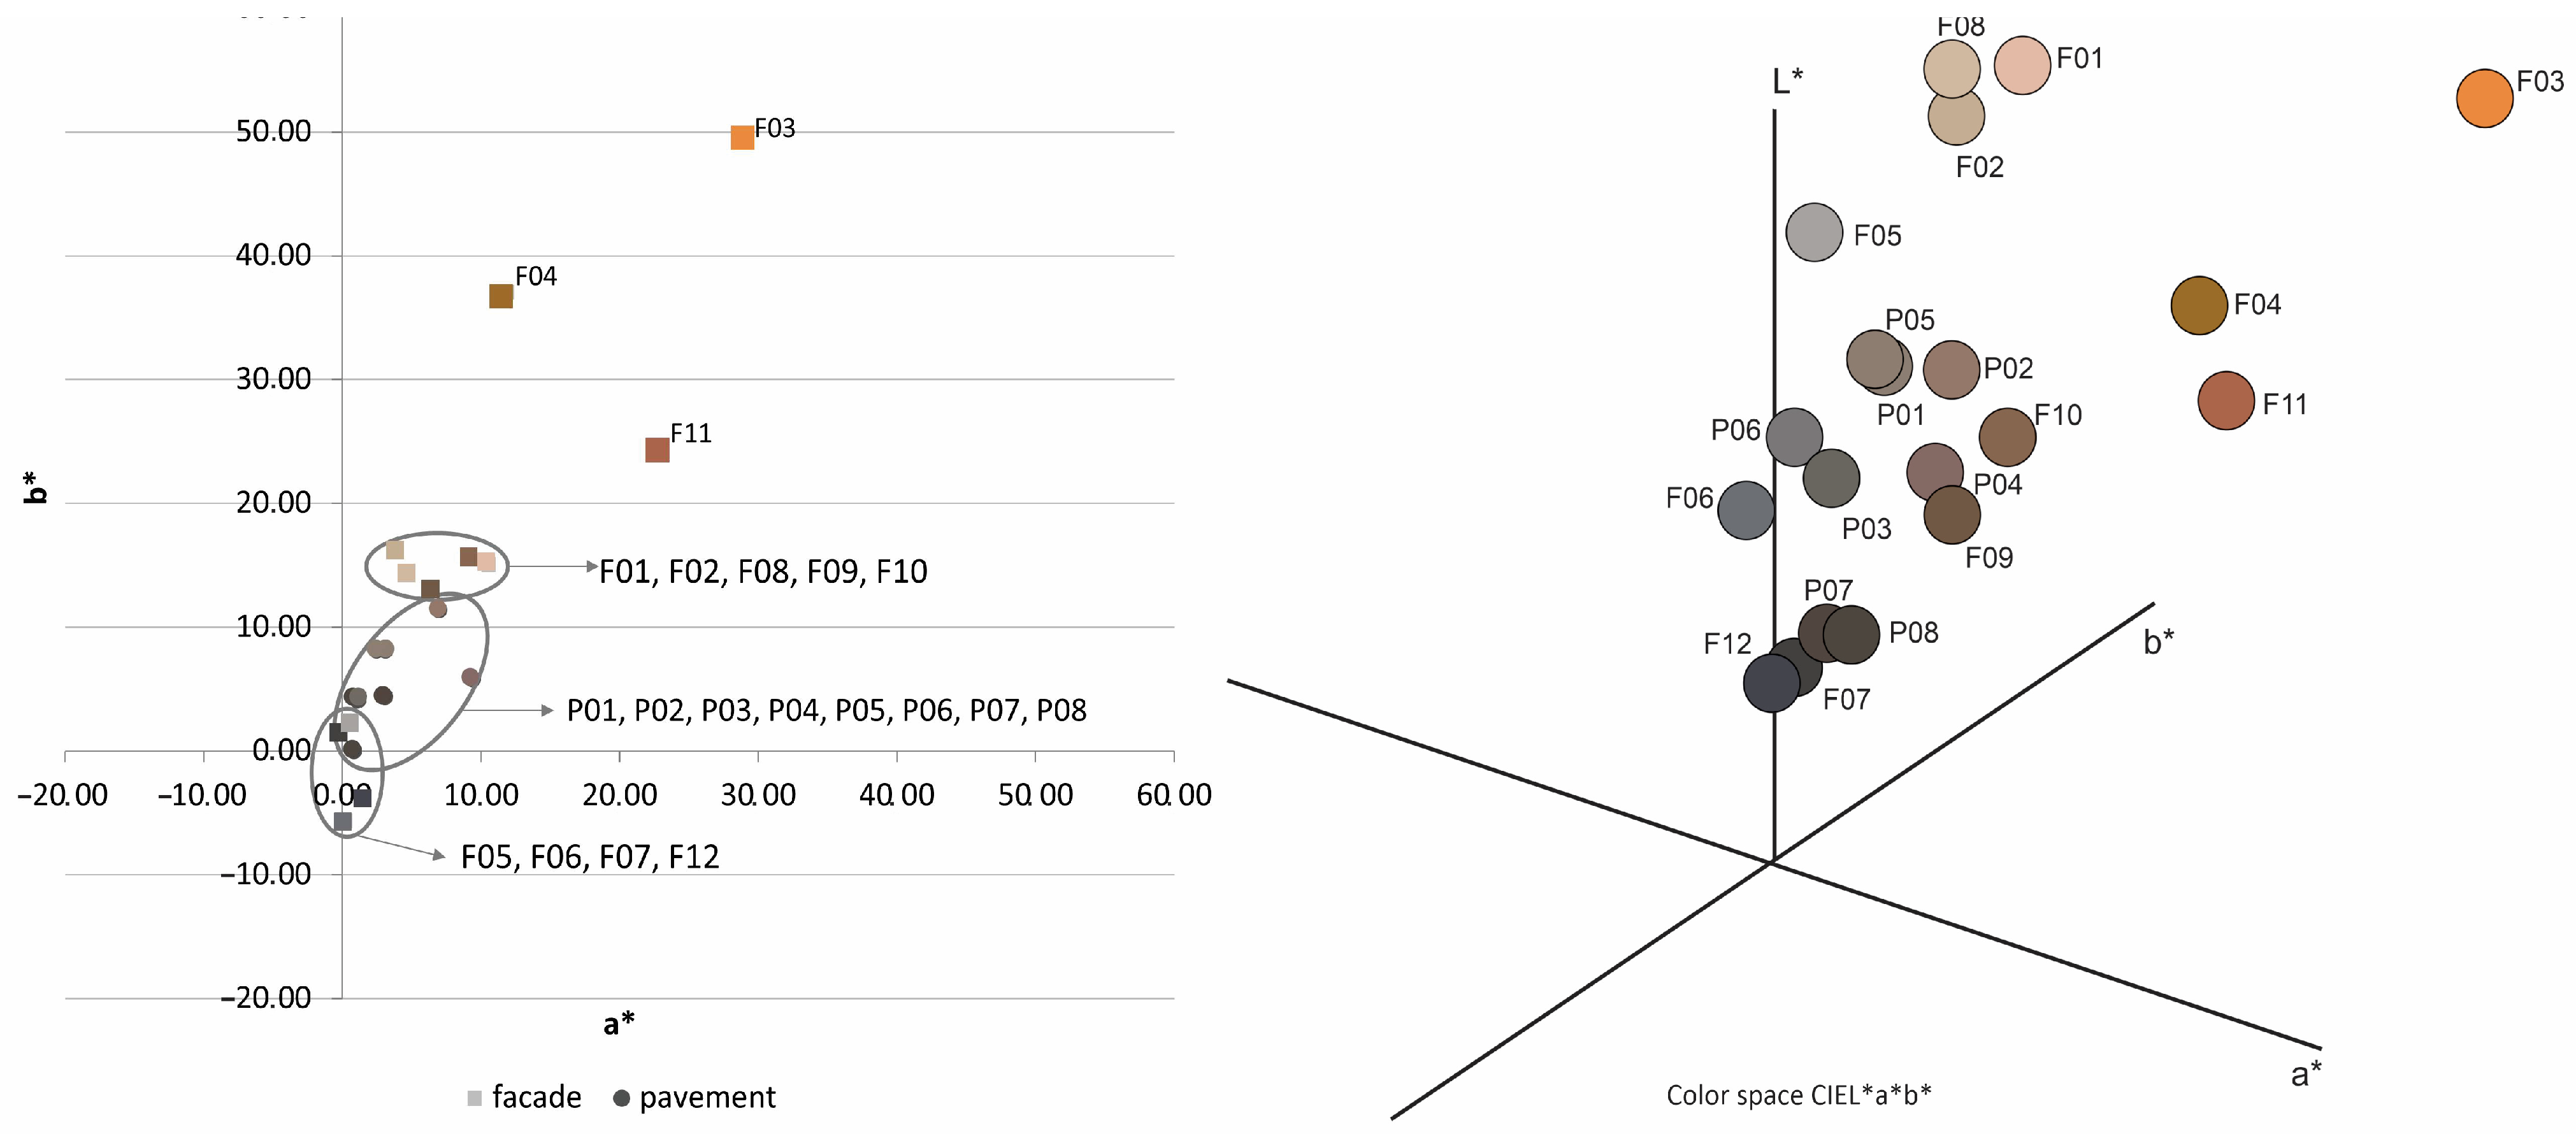
The CIELab color coordinates were calculated in accordance with the spectral reflectance in the visible range of the analyzed materials. It is evident that the variation in brightness (ΔL*) is more pronounced in the façades (ΔL*= 46.96) than in the pavements (ΔL*= 21.07) (Figure 9). The material with the highest L* value is the pink textured façade (L*= 79.35) (F01), while the material with the lowest value is the black metal sheet façade (L*= 32.38) (F07). These variations are consistent with those observed in the spectral reflectance of façades and pavements (Figure 5). Some materials have reflectance values approaching 80% for vertical coatings and 40% for horizontal coatings.
The a* and b* coordinates exhibit less variation in pavements (Δa* = 8.56 and Δb* = 11.39) compared to façades (Δa* = 29.24 and Δb* = 54.96), as illustrated in Figure 10. The majority of samples exhibit positive a* values, indicating a tendency towards red, and positive b* values, indicating a tendency towards yellow. Therefore, the majority of them exhibit a tendency towards the orange color.
In examining the façades, we identified three groups with distinct behaviors. The first group consists of materials with higher values of a* and b*, exhibiting an orange–yellow hue. The second group includes finishes F01, F02, F08, F09, and F10, which present pink, red, or orange finishes with intermediate values of both coordinates. The third group includes finishes situated near the origin of the coordinates in Figure 10, perceived as gray or bluish-gray (F05, F06, F07, and F12). This behavior is clearly illustrated in the spectral reflectance graph of the façades (Figure 5). The materials with colored finishes (orange–yellow, pink, red, or orange) show lower reflectance values of below 500 nm, which then rise until reaching a maximum at 600 nm, and then sustain that level until 780 nm. In some cases, within this group, this is more pronounced. For example, the orange painted plaster (F3) increases its reflectance of between 500 nm and 600 nm abruptly by approximately 60%. Conversely, we observed a group of façade materials that exhibit homogeneous reflectance across the entire spectrum (F05, F06, F07, and F12). This is expressed in their grayish appearance with varying degrees of luminosity. These differences in spectral reflectance are also shown in the standard deviation values of the wavelength-to-wavelength reflectance, with the first group showing an average standard deviation of 14% and the group of materials with gray finishes showing an average standard deviation of 1%.
The pavements display reduced values for both coordinates (Figure 10), which is evident in their gray appearance with shades of red or orange at higher or lower brightness levels. The homogeneous solar range spectra of these materials (r_sol max: 8.36%; r_sol min 0.86%) further demonstrate this, reflecting their similar colors. There are two distinct groups. The first group includes those with a color tendency towards red–orange (P01, P02, P04, and P05), which exhibit increased reflectance from 500 nm onwards. These pavements are composed of cement (smoothed and brushed, red limestone mosaic, and pink–beige flagstone). The second group includes those with a gray coloration (P03, P06, P07, and P08) and have highly homogeneous spectral distributions, with an average r_sol value of 1.18%. The latter corresponds to gray and black calcareous mosaic, gray pebble mosaic, and vehicular pavement.
Similar results were found in the analysis of horizontal urban finishes in Madrid, with one group of samples corresponding to the white-, black-, and grey-colored pavements that showed lower a* values, ranging from 0.1 to 2.4, and another group consisting of the reddish-colored pavements, with higher a* values of between 6.7 and 17.1 [16]. Two similar groups were identified in the case of façade finishes, but with a significantly higher variability, as observed in Figure 10 for the façades in the present study.

4.1.3. Emissivity Analysis

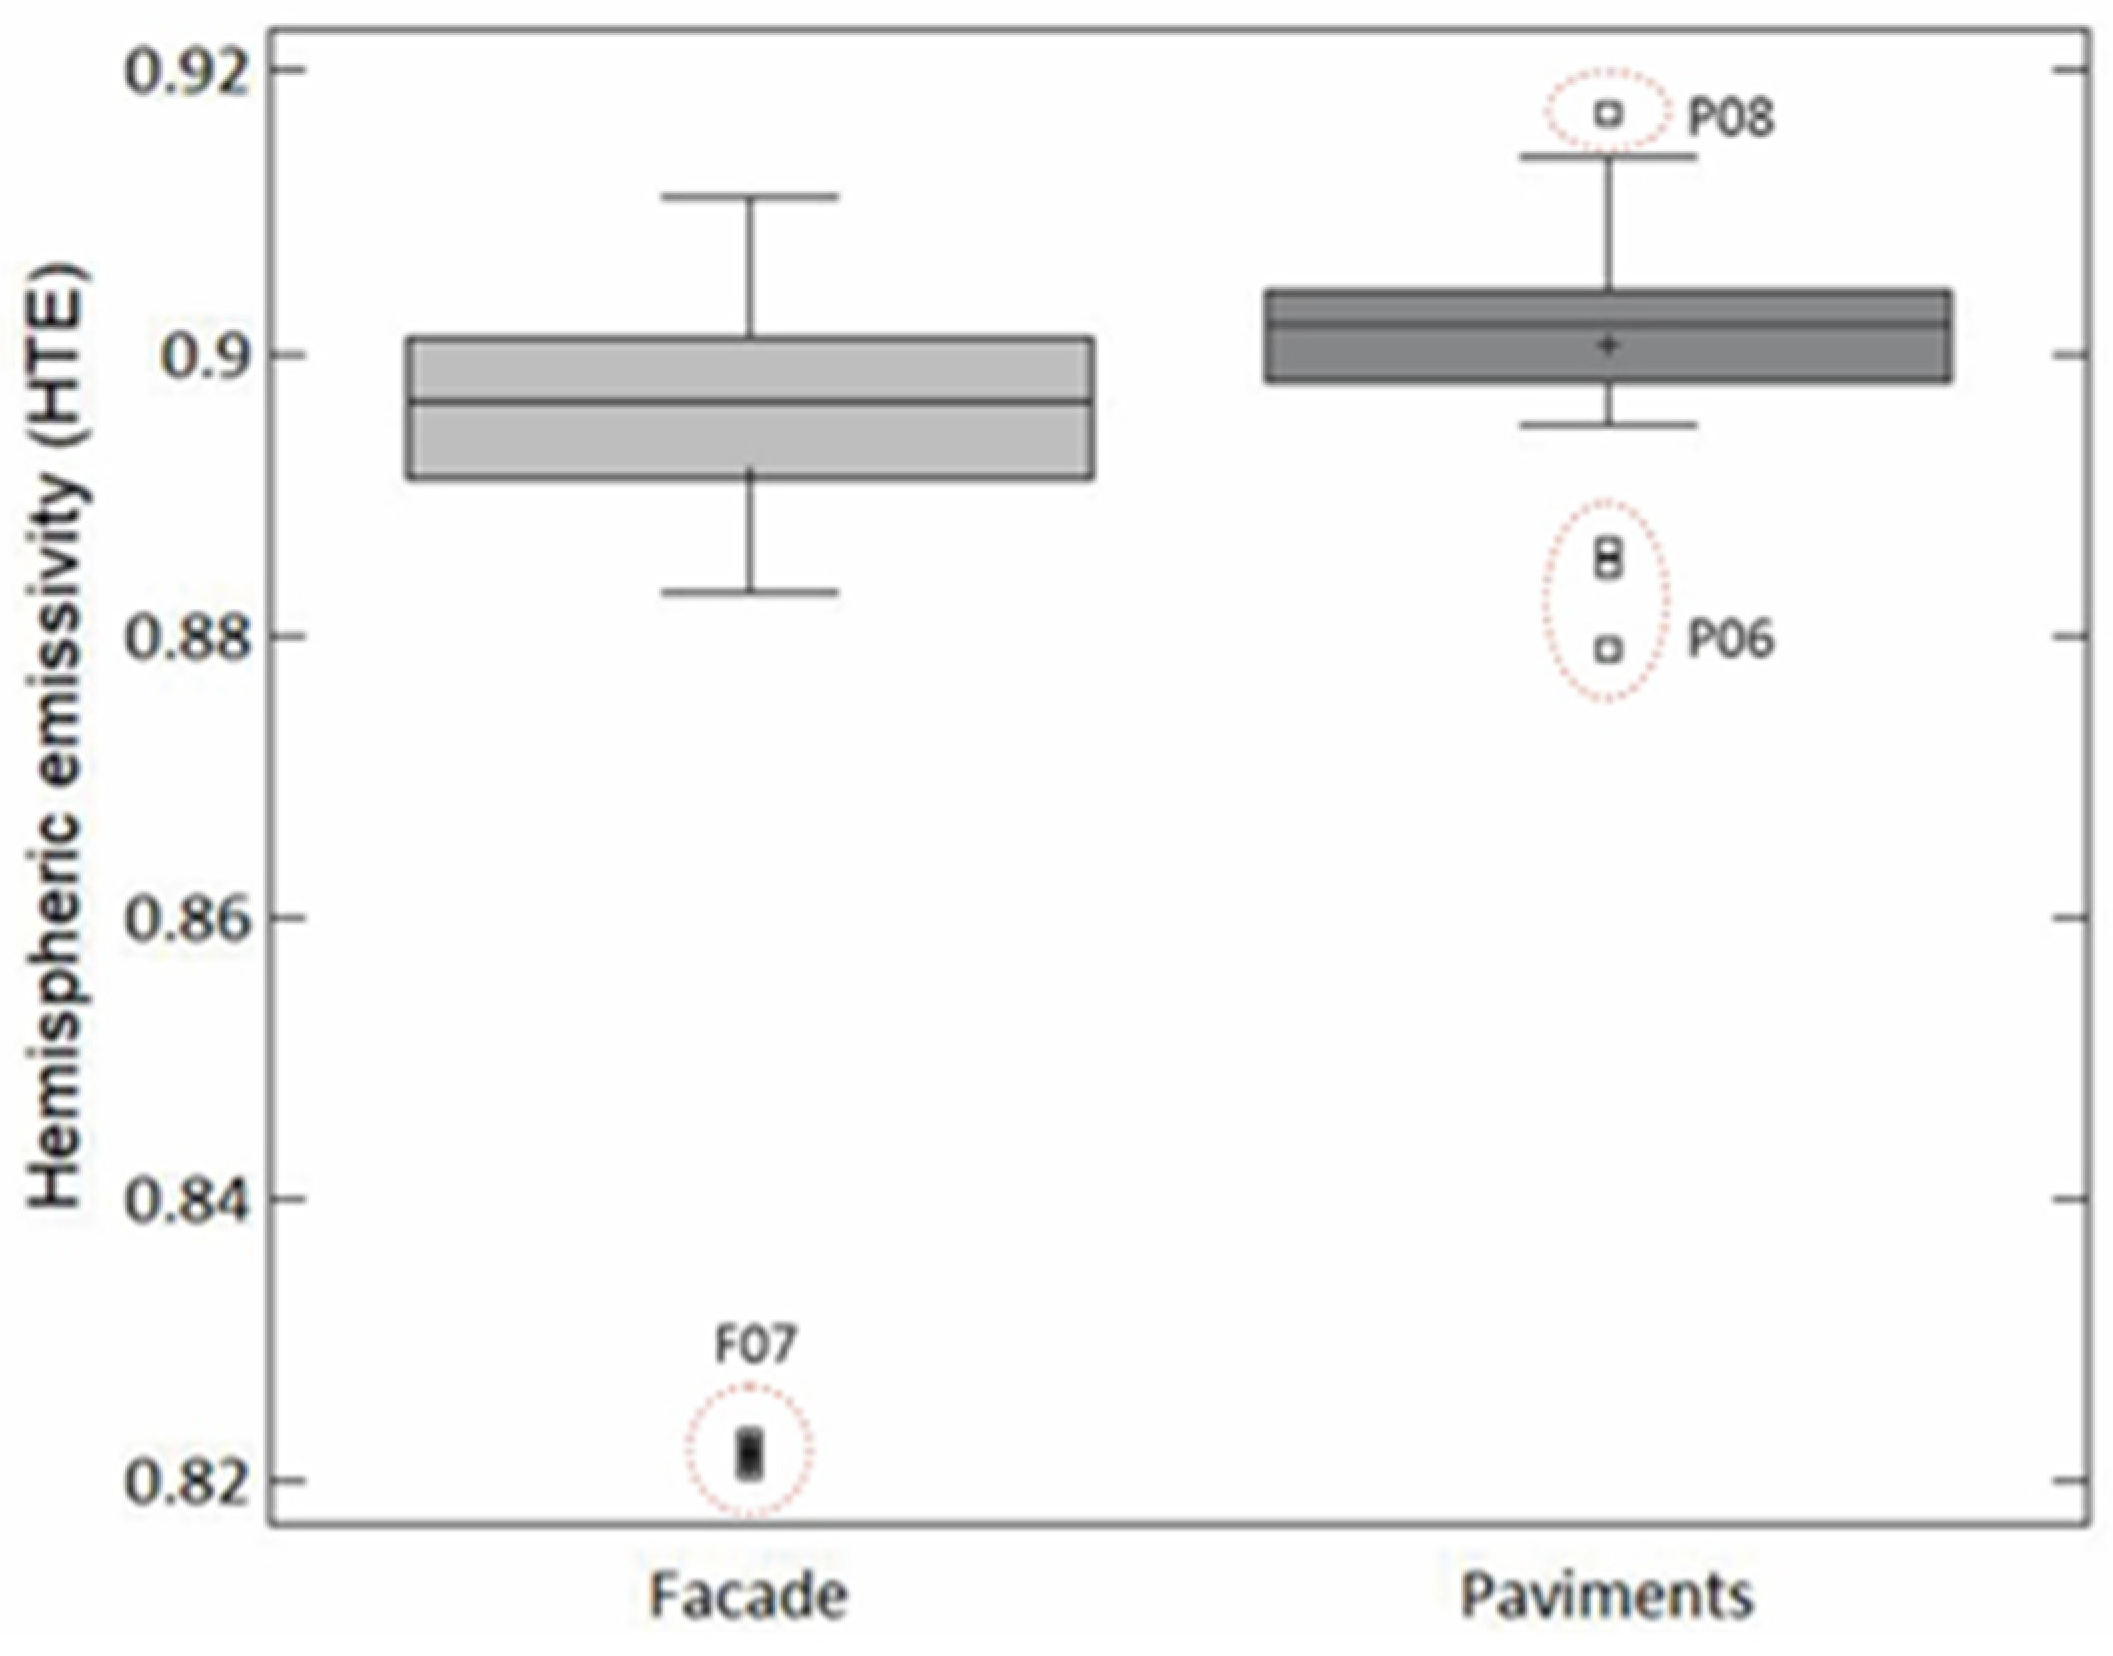
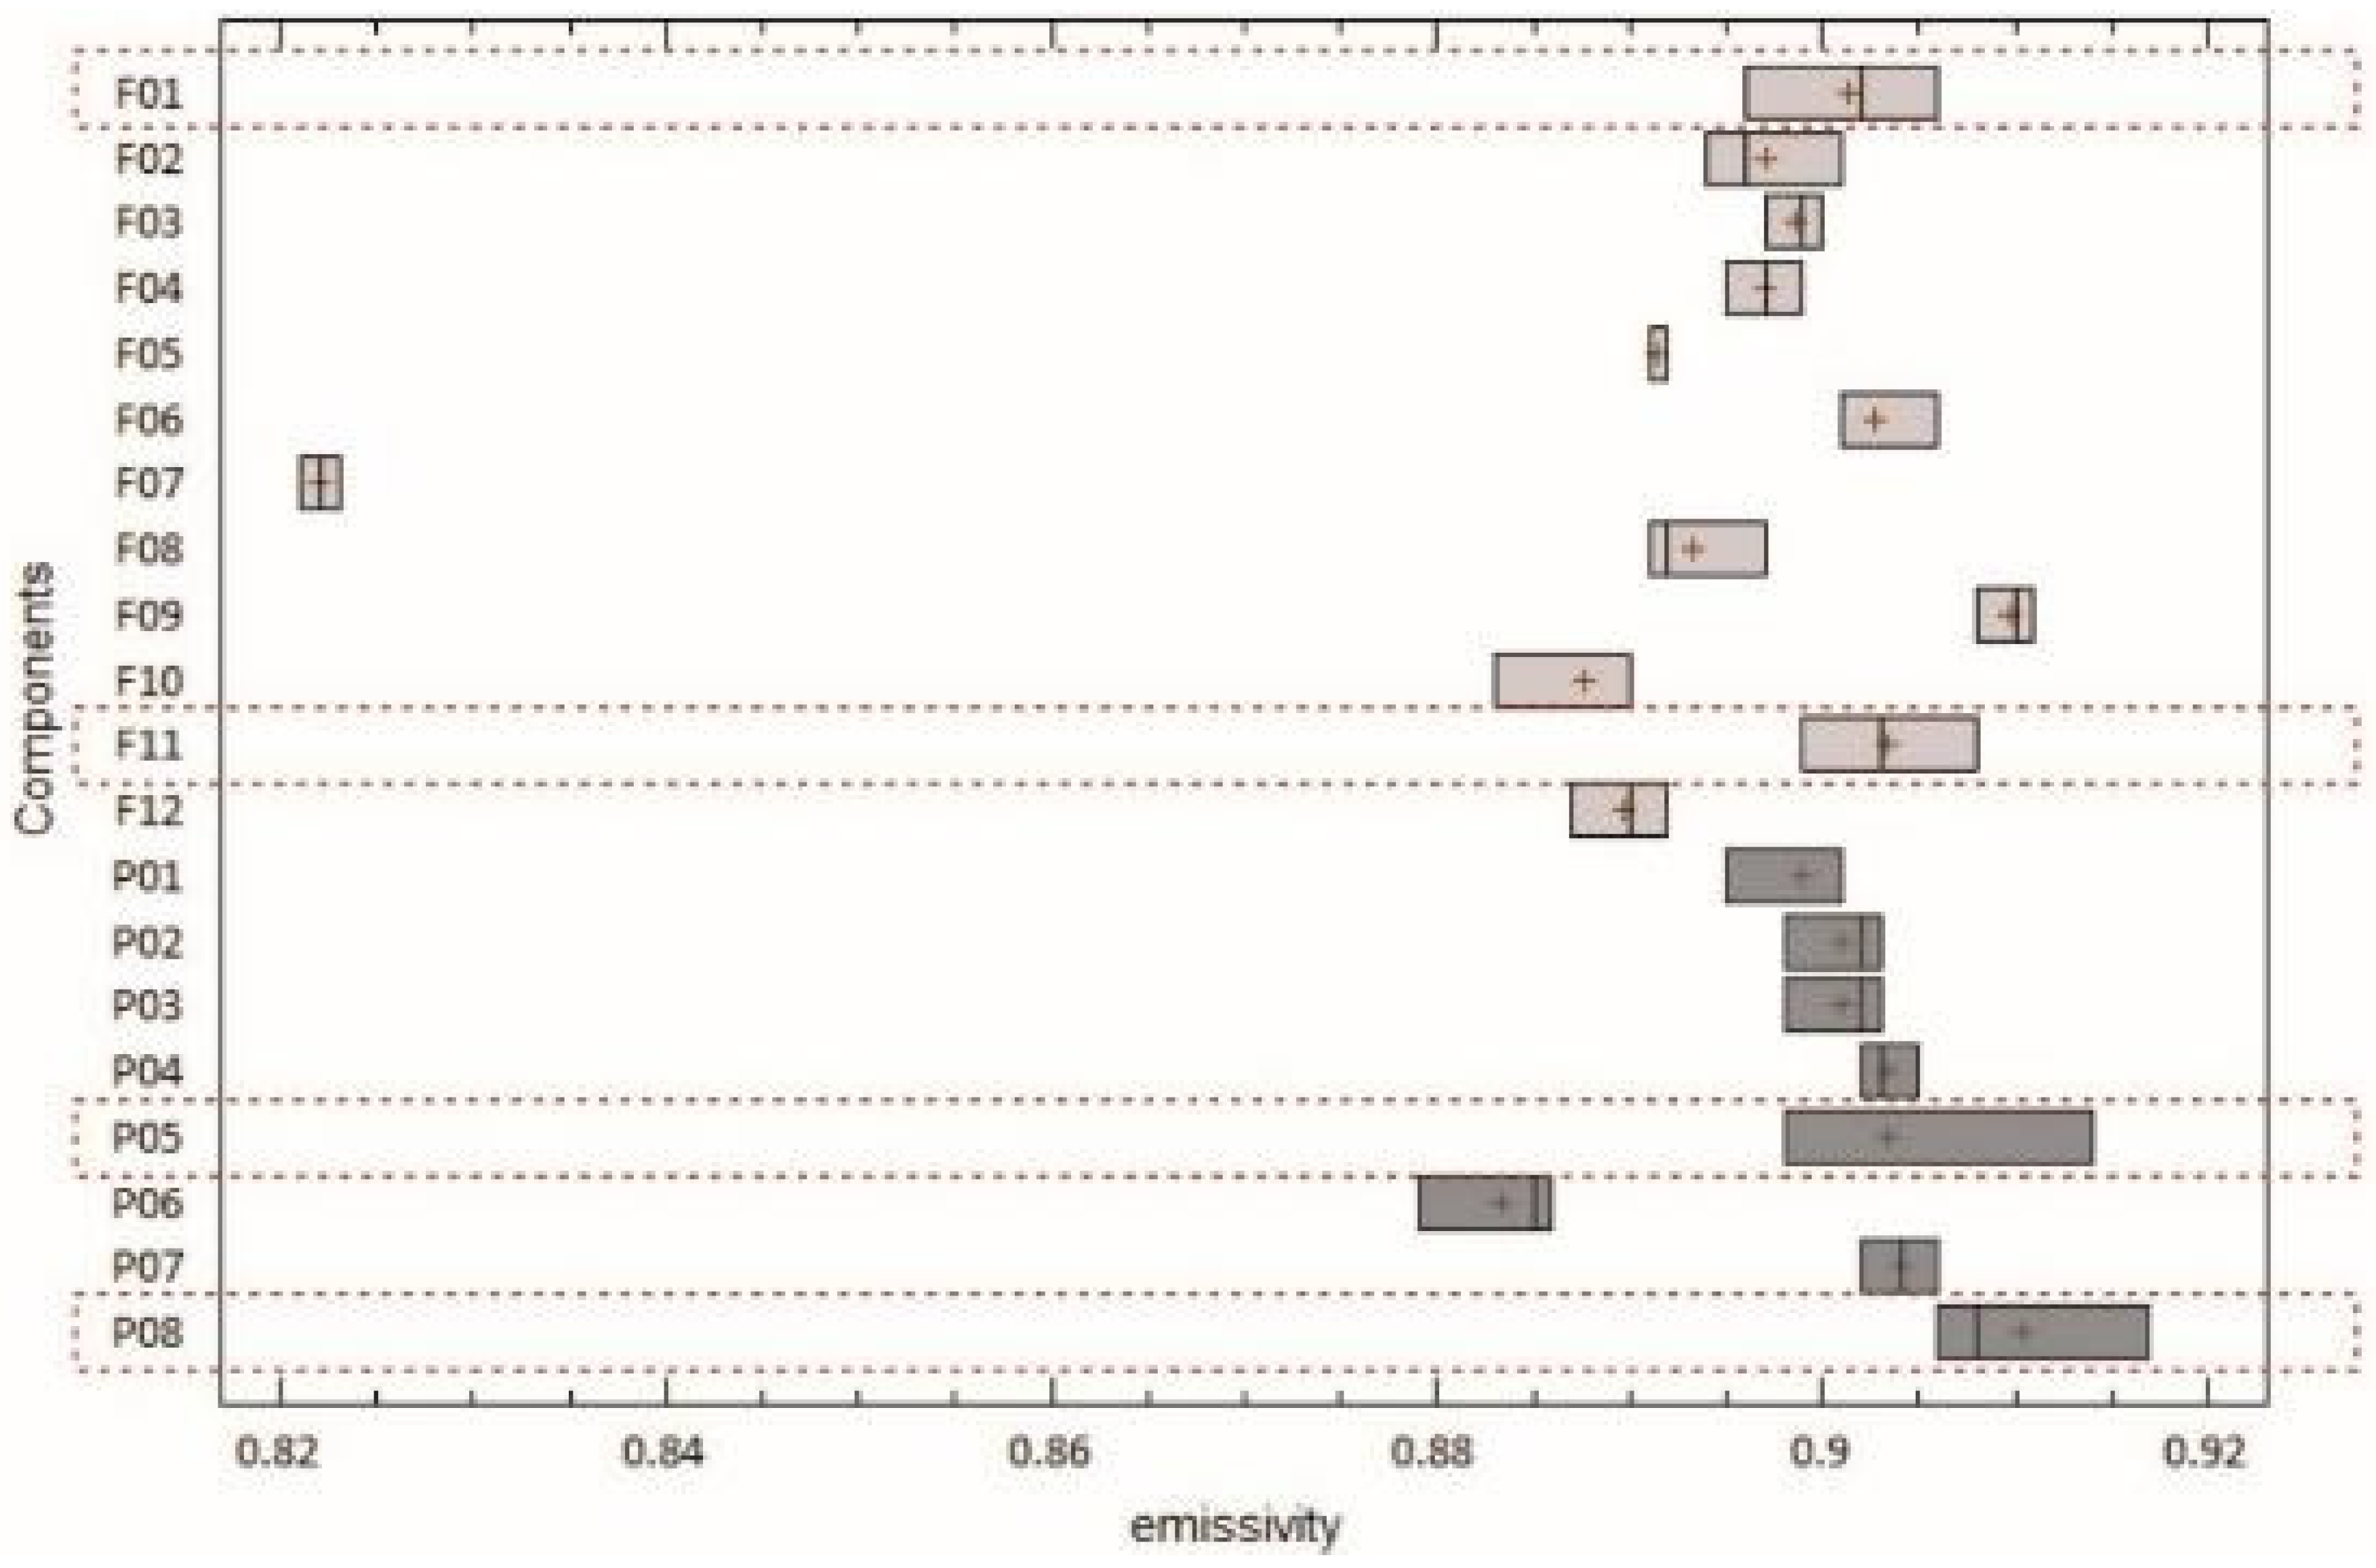
Figure 11 illustrates the distribution of the three hemispherical total emittance (HTE) records for each material, with a total of 36 observations in façades and 24 observations in pavements.
As a general observation, the emittance values of the façade materials exhibit a wider range than those of the pavement materials. The average emittance in façades is 0.89, with a standard deviation of 0.022. In pavements, the average emittance is 0.90, with a lower standard deviation of 0.008.
It is notable that three materials within the group exhibit atypical responses. On the one hand, façade F07, a black metallic material with a surface treatment, has an emittance value of 0.82, which is 7% lower than the average for façade materials. In contrast, the vehicular pavement P08 (asphalt) and the pedestrian pavement P06 (black calcareous mosaic) stand out as having particularly extreme behaviors in the pavements. Asphalt has the highest infrared energy release capability, with an average emittance of 0.91. This value is in the high range of the values reported in the literature for asphalt finishes (0.70–0.95) [20] and confirms the slight degradation of the vehicular pavement in the study area of the present work. On the other hand, calcareous mosaic has the lowest emittance in the area (0.88), which may be related to its composition and signs of wear or aging.

4.2. Reliability Analysis of In Situ Characterization Results

This section examines the methodological scope and limitations for obtaining a record of the optical properties of façade and pavement materials within an urban canyon.

4.2.1. Estimation of Spectral Reflectance in Non-Homogeneous Materials

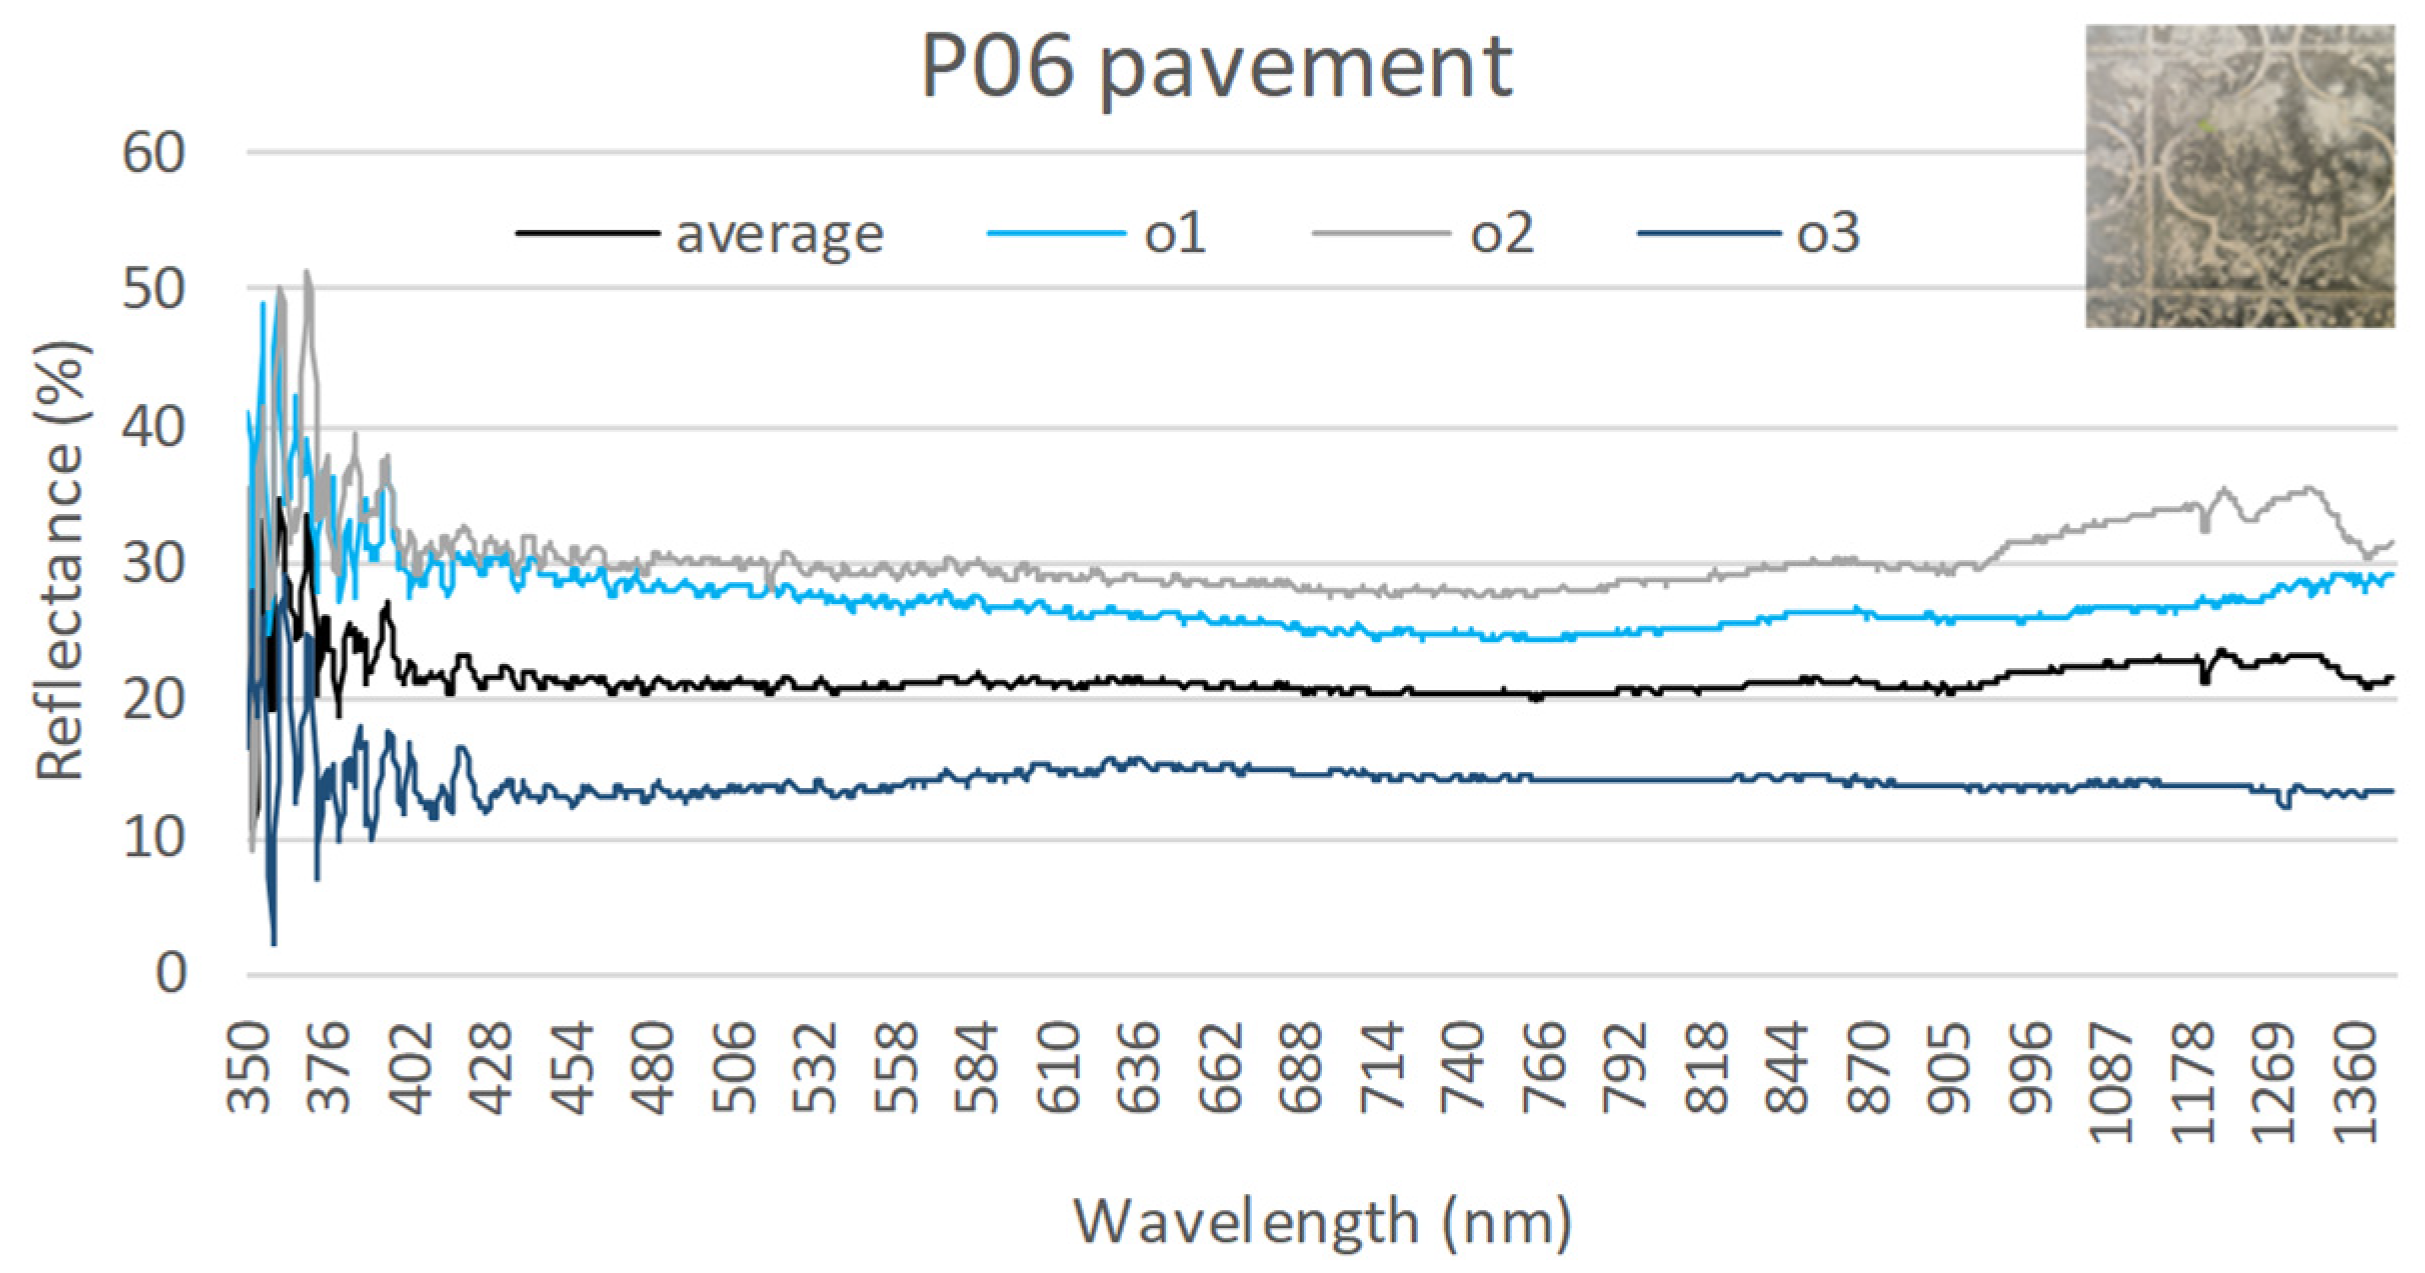
The majority of materials analyzed in situ have a homogeneous surface appearance. The solar reflectance values obtained from their characterization have a standard deviation that is at least one order of magnitude smaller than the average value of 0.022 in r_sol (Table 1 and Table 2). It should be noted that the black calcareous limestone mosaic (P06) and gray pebble mosaic (P07) pedestrian pavements, as well as the asphalt vehicular pavement (P08), are exceptions to this rule. P06 has the highest standard deviation of solar reflectance at 0.09. Meanwhile, materials P07 and P08 have standard deviation values that are comparable to the average solar reflectance. Therefore, a more detailed analysis of these three materials is warranted.
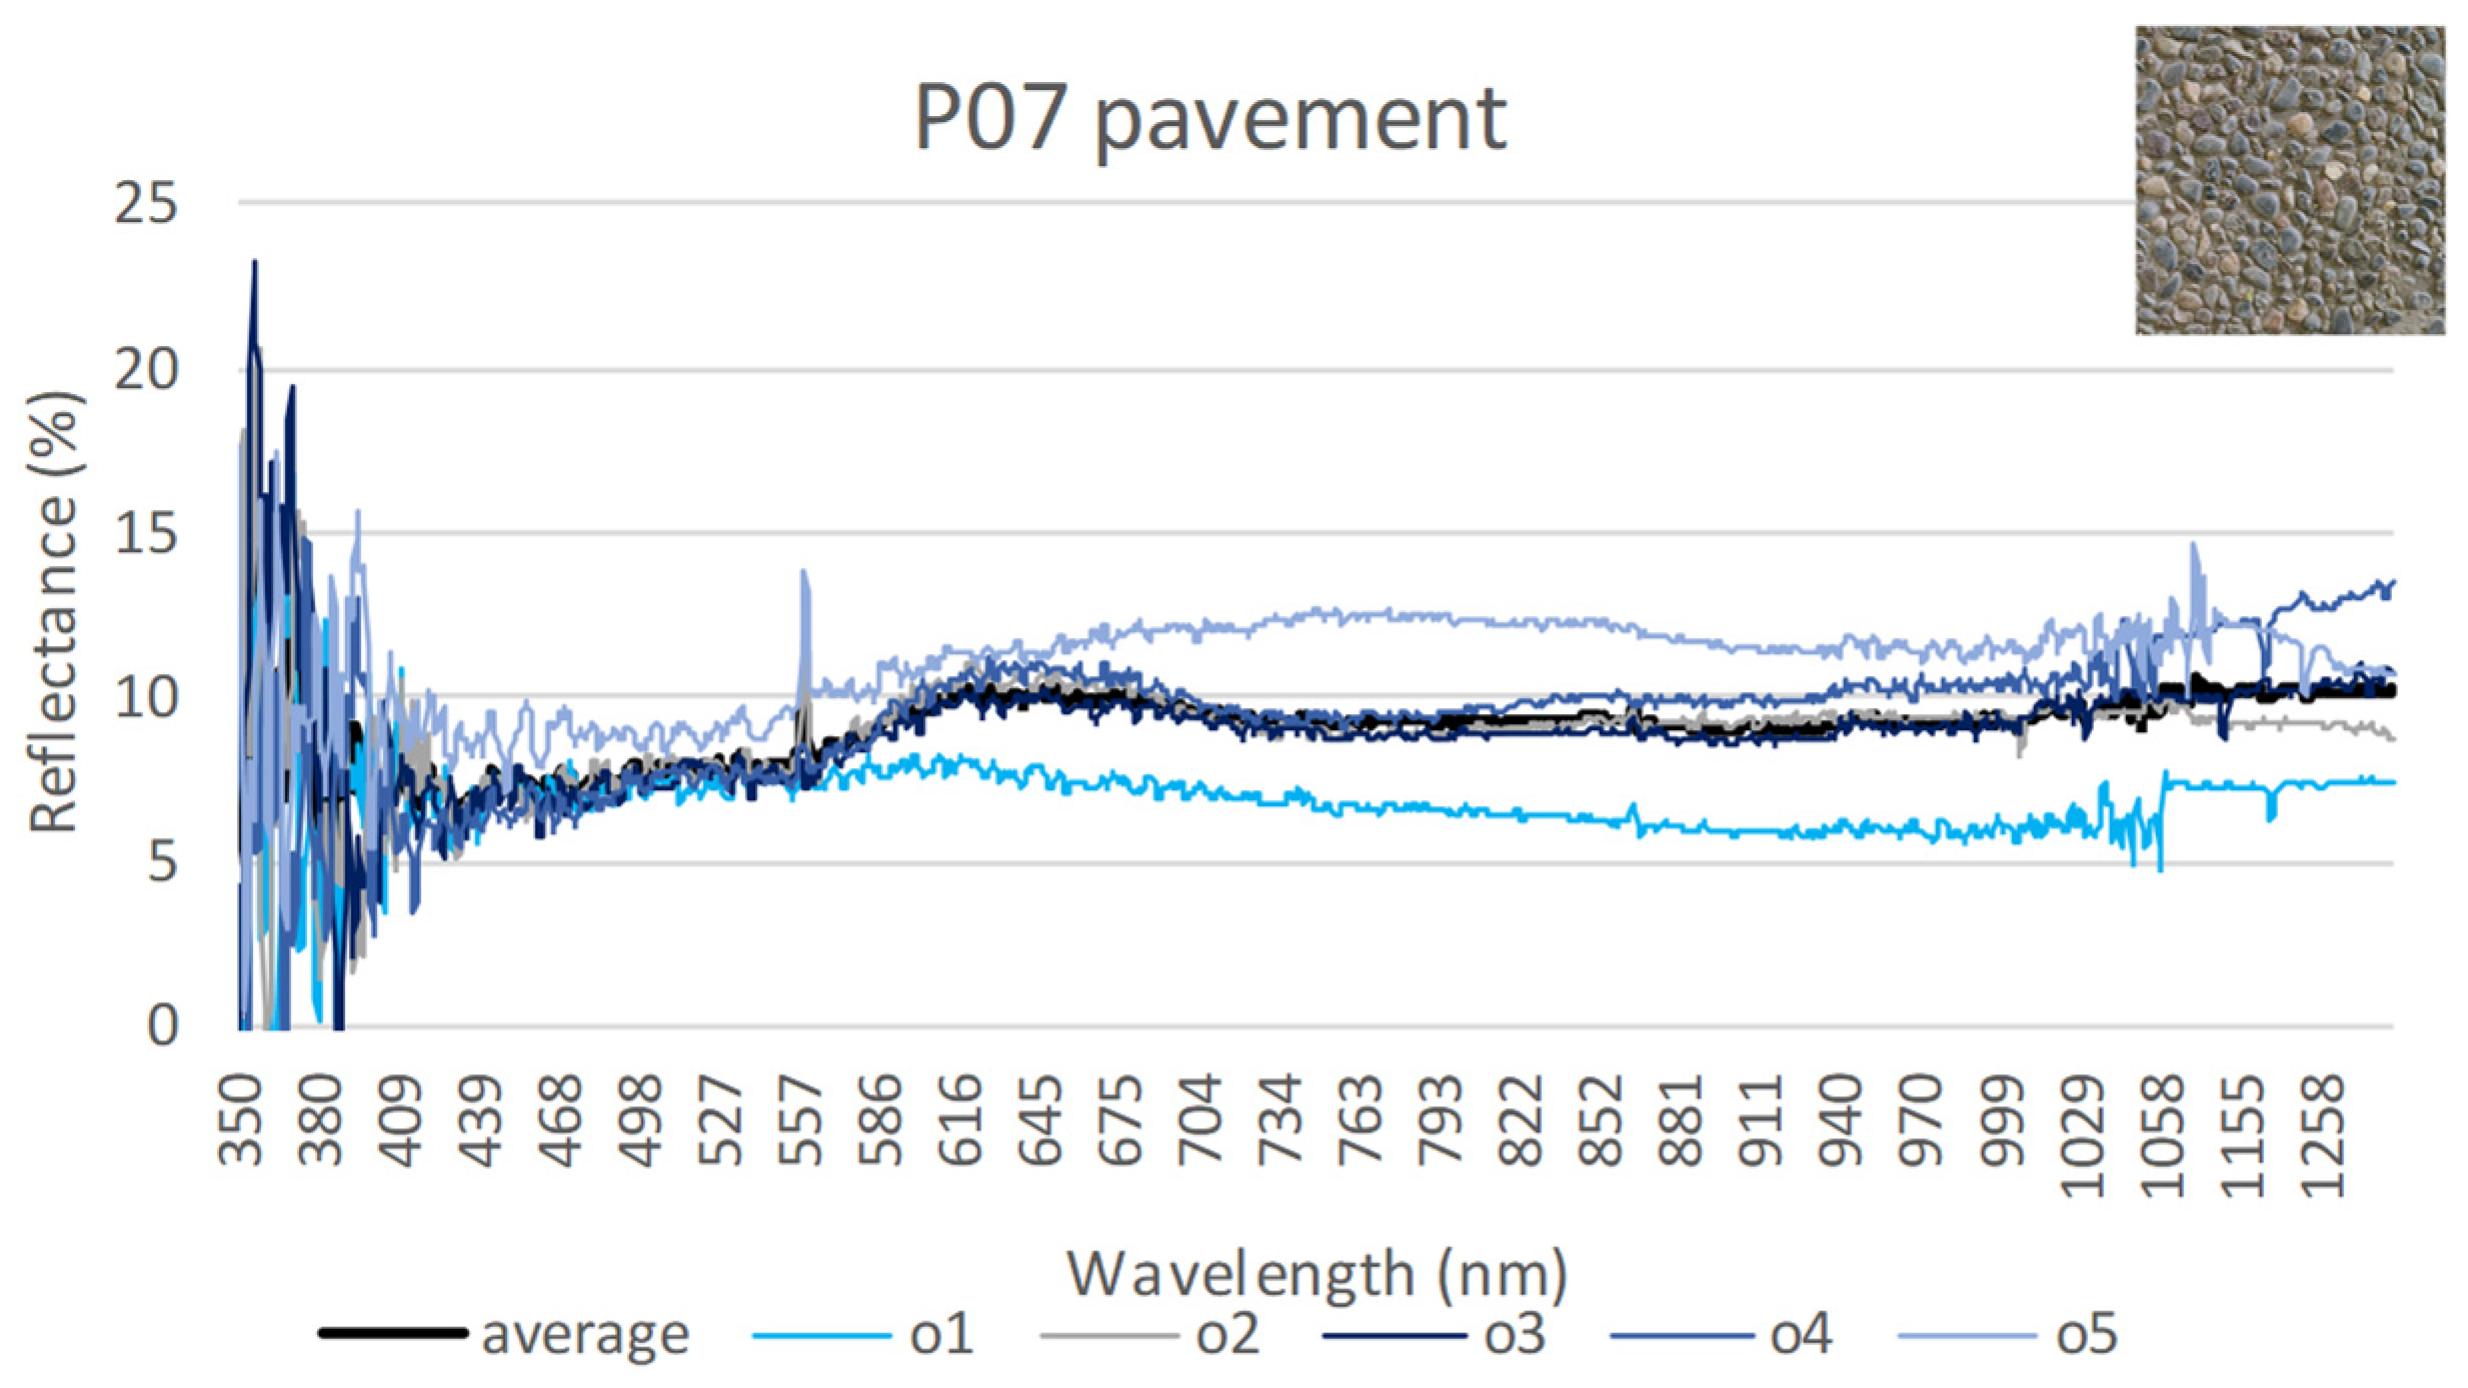
Figure 12 shows the reflectance curves from 380 to 1600 nm of the four measurements made on the pedestrian pavement—black calcareous mosaic (P06)—and their average. This pavement has worn areas of lighter appearance and, therefore, although the curves show similarity in their distribution, the degree of reflectance varies for each test. On the other hand, in the case of P07 (Figure 13), the shape of the curves varies from dataset to dataset. This means that the spectral distribution obtained varies depending on where the sensor is positioned in the pavement. This behavior can be related to the heterogeneous conformation of the material, formed by different types of stones agglutinated with cement. For the asphalt pavement (P08), which is homogeneous in terms of matrix/composition but presents areas that are lighter than others, which is reflected in curves of similar shapes but with higher or lower reflectance levels (Figure 14).
The results presented in Figure 13 and Figure 14 show the need to perform multiple measurements to obtain a representative average reflectance value for nonhomogeneous materials. Therefore, for this type of material, the application of the ASTM E-1918 [31] variant method developed by Akbari et al. (2008) [28] is recommended, provided that the specific experimental conditions necessary for the correct development of the method are met: area larger than 1 m2, flat surface, angle of solar incidence, etc. The ASTM E-1918A variant method describes the procedure for measuring the solar reflectance of a material over an area of 1 m2 using a pyranometer or an albedometer and a pair of black and white masks. The solar irradiance (power per unit area) incident on the sensor of a horizontal, downward-facing pyranometer is a weighted average of the reflected solar radiation per unit area of the target.
Figure 15 shows a different situation from the three previously shown. It shows the reflectance curves of a homogeneous sample—black painted tile (F12)—where the variation in one of the measured spectra (o1) can be attributed to “errors” or variations in the measurement conditions, such as fiber movement or recording on a surface that is not completely flat. It is important to recognize these situations and discard such data, as they will alter the average spectral response of the material (wrong average) and therefore its final reflectance value.

4.2.2. Estimation of Emissivity with the Portable Instrument ET 100

In this section, the results of the three observations (m1, m2, m3) recorded for each component are compared to more accurately determine the thermal emissivity value. Figure 16 describes the thermal emissivity ranges observed in the area. This graph shows that 80% of the materials tested show a very similar response in the three observations, with coefficients of variation of less than 0.005. The materials that show a larger scatter in their results are F01 (range ε: 0.896 to 0.906), F11 (range ε: 0.899 to 0.908), P05 (range ε: 0.898 to 0.914), and P08 (range ε: 0.906 to 0.917).
In other words, the majority of the materials analyzed demonstrate a high degree of consistency between the three emittance measurements obtained with the ET100 portable instrument. However, as outlined in the international literature, certain types of materials and surface treatments present greater challenges in obtaining reliable emissivity values with portable equipment [32]. For instance, materials with a high degree of surface topology exhibit strong directional dependencies that cannot be captured by portable instruments. These findings align with the monitored values in the textured cladding (F01), brick façade (F11), brushed concrete floor (P05), and asphalt pavement (P08), which feature coarse-grained surface finishes.

4.3. Contrasting Results Obtained with Low- and High-Complexity Instrumentation

The construction industry has seen a significant increase in the use of new materials over the past decade. However, there is a notable gap in the availability of information on the optical properties of these materials in Latin America. Internationally, the characterization of components and materials is typically conducted using advanced equipment, such as goniometers, spectrometers, and spectrophotometers. However, in countries with emerging economies, the cost of acquiring this equipment, including the associated maintenance costs, can be a significant barrier.
It is therefore crucial to develop methodologies and measurement techniques (including instrumentation adaptation) and predictive models to estimate the optical properties of materials and components of the envelope. Building on this foundation, the following section of the work presents an initial model for calculating solar reflectance based on visible reflectance and the contrast in color coordinates determined by a colorimeter (low-complexity equipment) in comparison to a spectrometer.

4.3.1. Color Coordinates with Spectrometer vs. Colorimeter

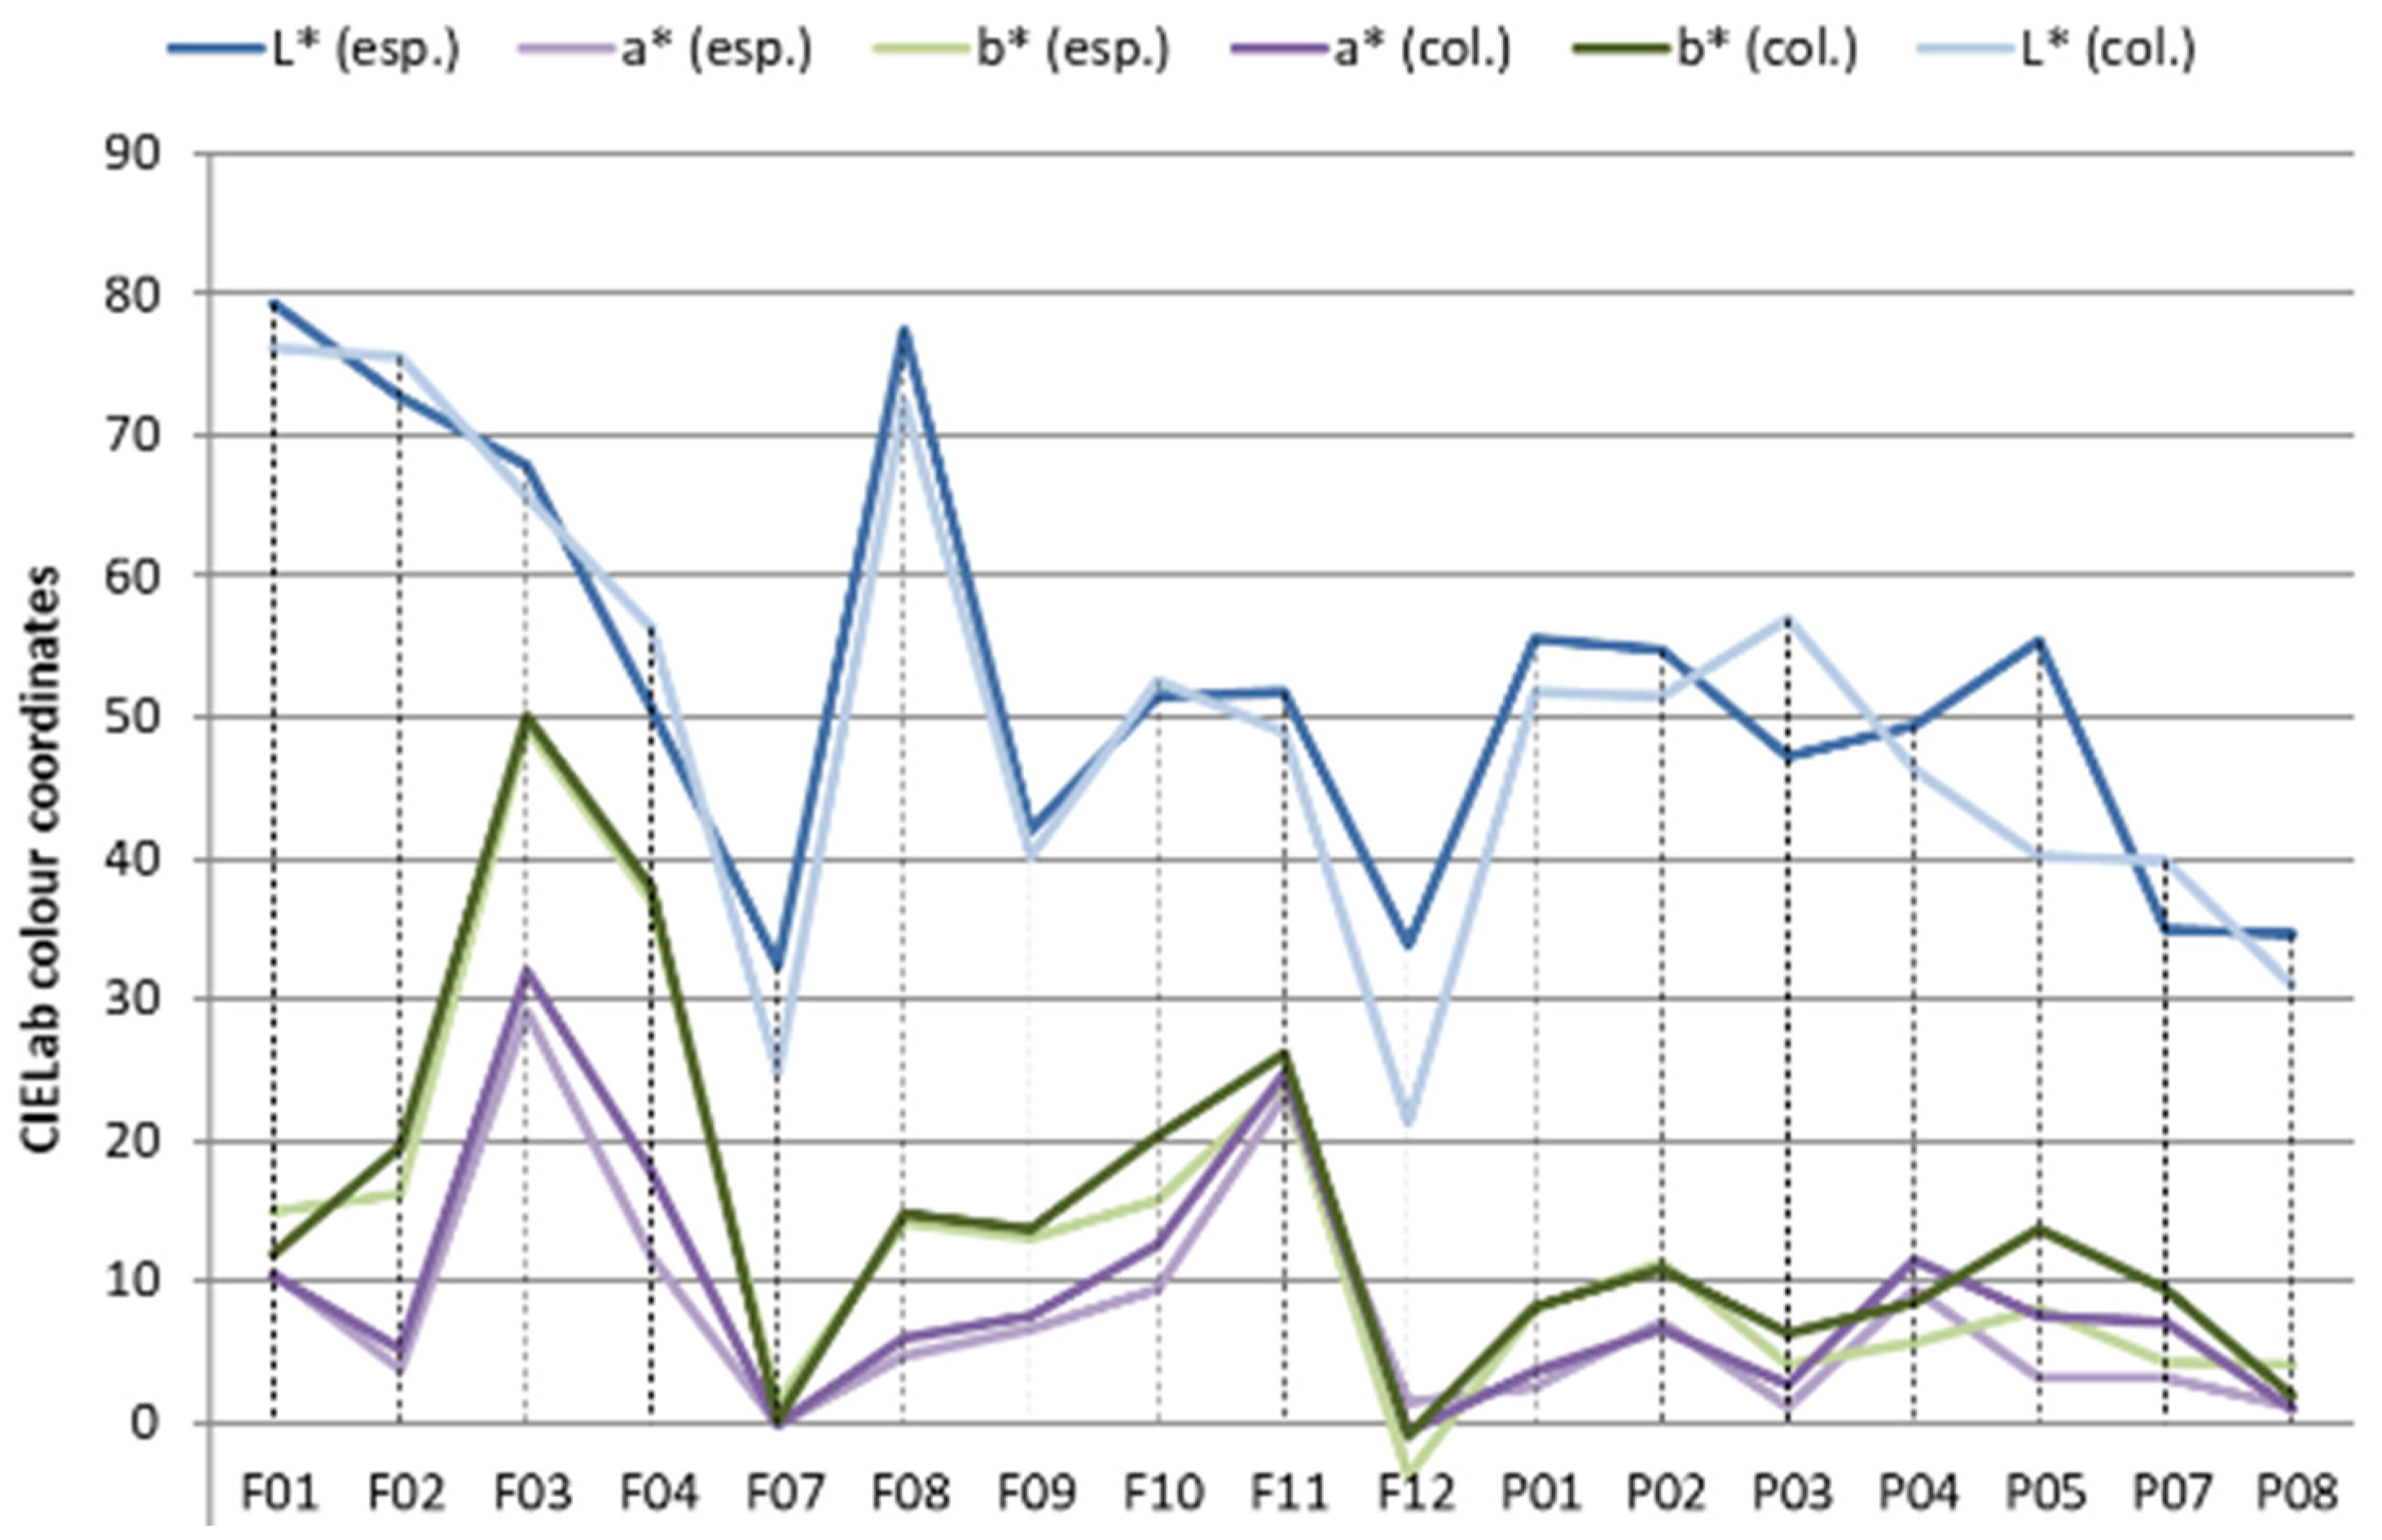
To validate the use of low-complexity equipment for characterizing materials in the urban environment, we compared the data of the CIELab color coordinates collected with a low-cost colorimeter, using as a standard those determined with the Stellarnet Black Comet spectrometer (Figure 17).
As illustrated in Figure 17, the colorimeter and spectrometer demonstrate a high degree of correlation in their responses across all color coordinates. The greatest discrepancies are observed in the L* coordinate (luminosity) for materials F12 (ΔL* = 12.71), P03 (ΔL* = −9.75), and P05 (ΔL* = 15.29). The remaining differences for this coordinate are below 7.42. With regard to the a* and b* coordinates (color), the discrepancies between the records are less than 5.95 for the a* coordinate and less than 5.55 for the b* coordinate (Table 3).
Table 3 shows that the a* values determined by the colorimeter are higher than those detected by the spectrometer, indicating a shift towards the red color. With respect to the b* coordinate, the overestimation of the colorimeter would indicate a shift towards the yellow color. However, it is essential to exercise caution when interpreting these data, as the acceptable tolerance for color differences is dependent on the intended use of the materials in question (e.g., food industry, automotive, textile, etc.).

4.3.2. Linear Regression Models of Solar Reflectance

To facilitate the development of predictive models of spectral behavior in the solar range using readily available instrumentation, this section introduces a function that estimates the spectral responses in this range from records in the visible range, which can be obtained with more cost-effective equipment. The records in the solar range for the set of materials analyzed in the study area are considered the dependent variable and those in the visible range are the explanatory variable (Equation (3)):
r_sol = 0.00735142 + 1.08572 * r_vis
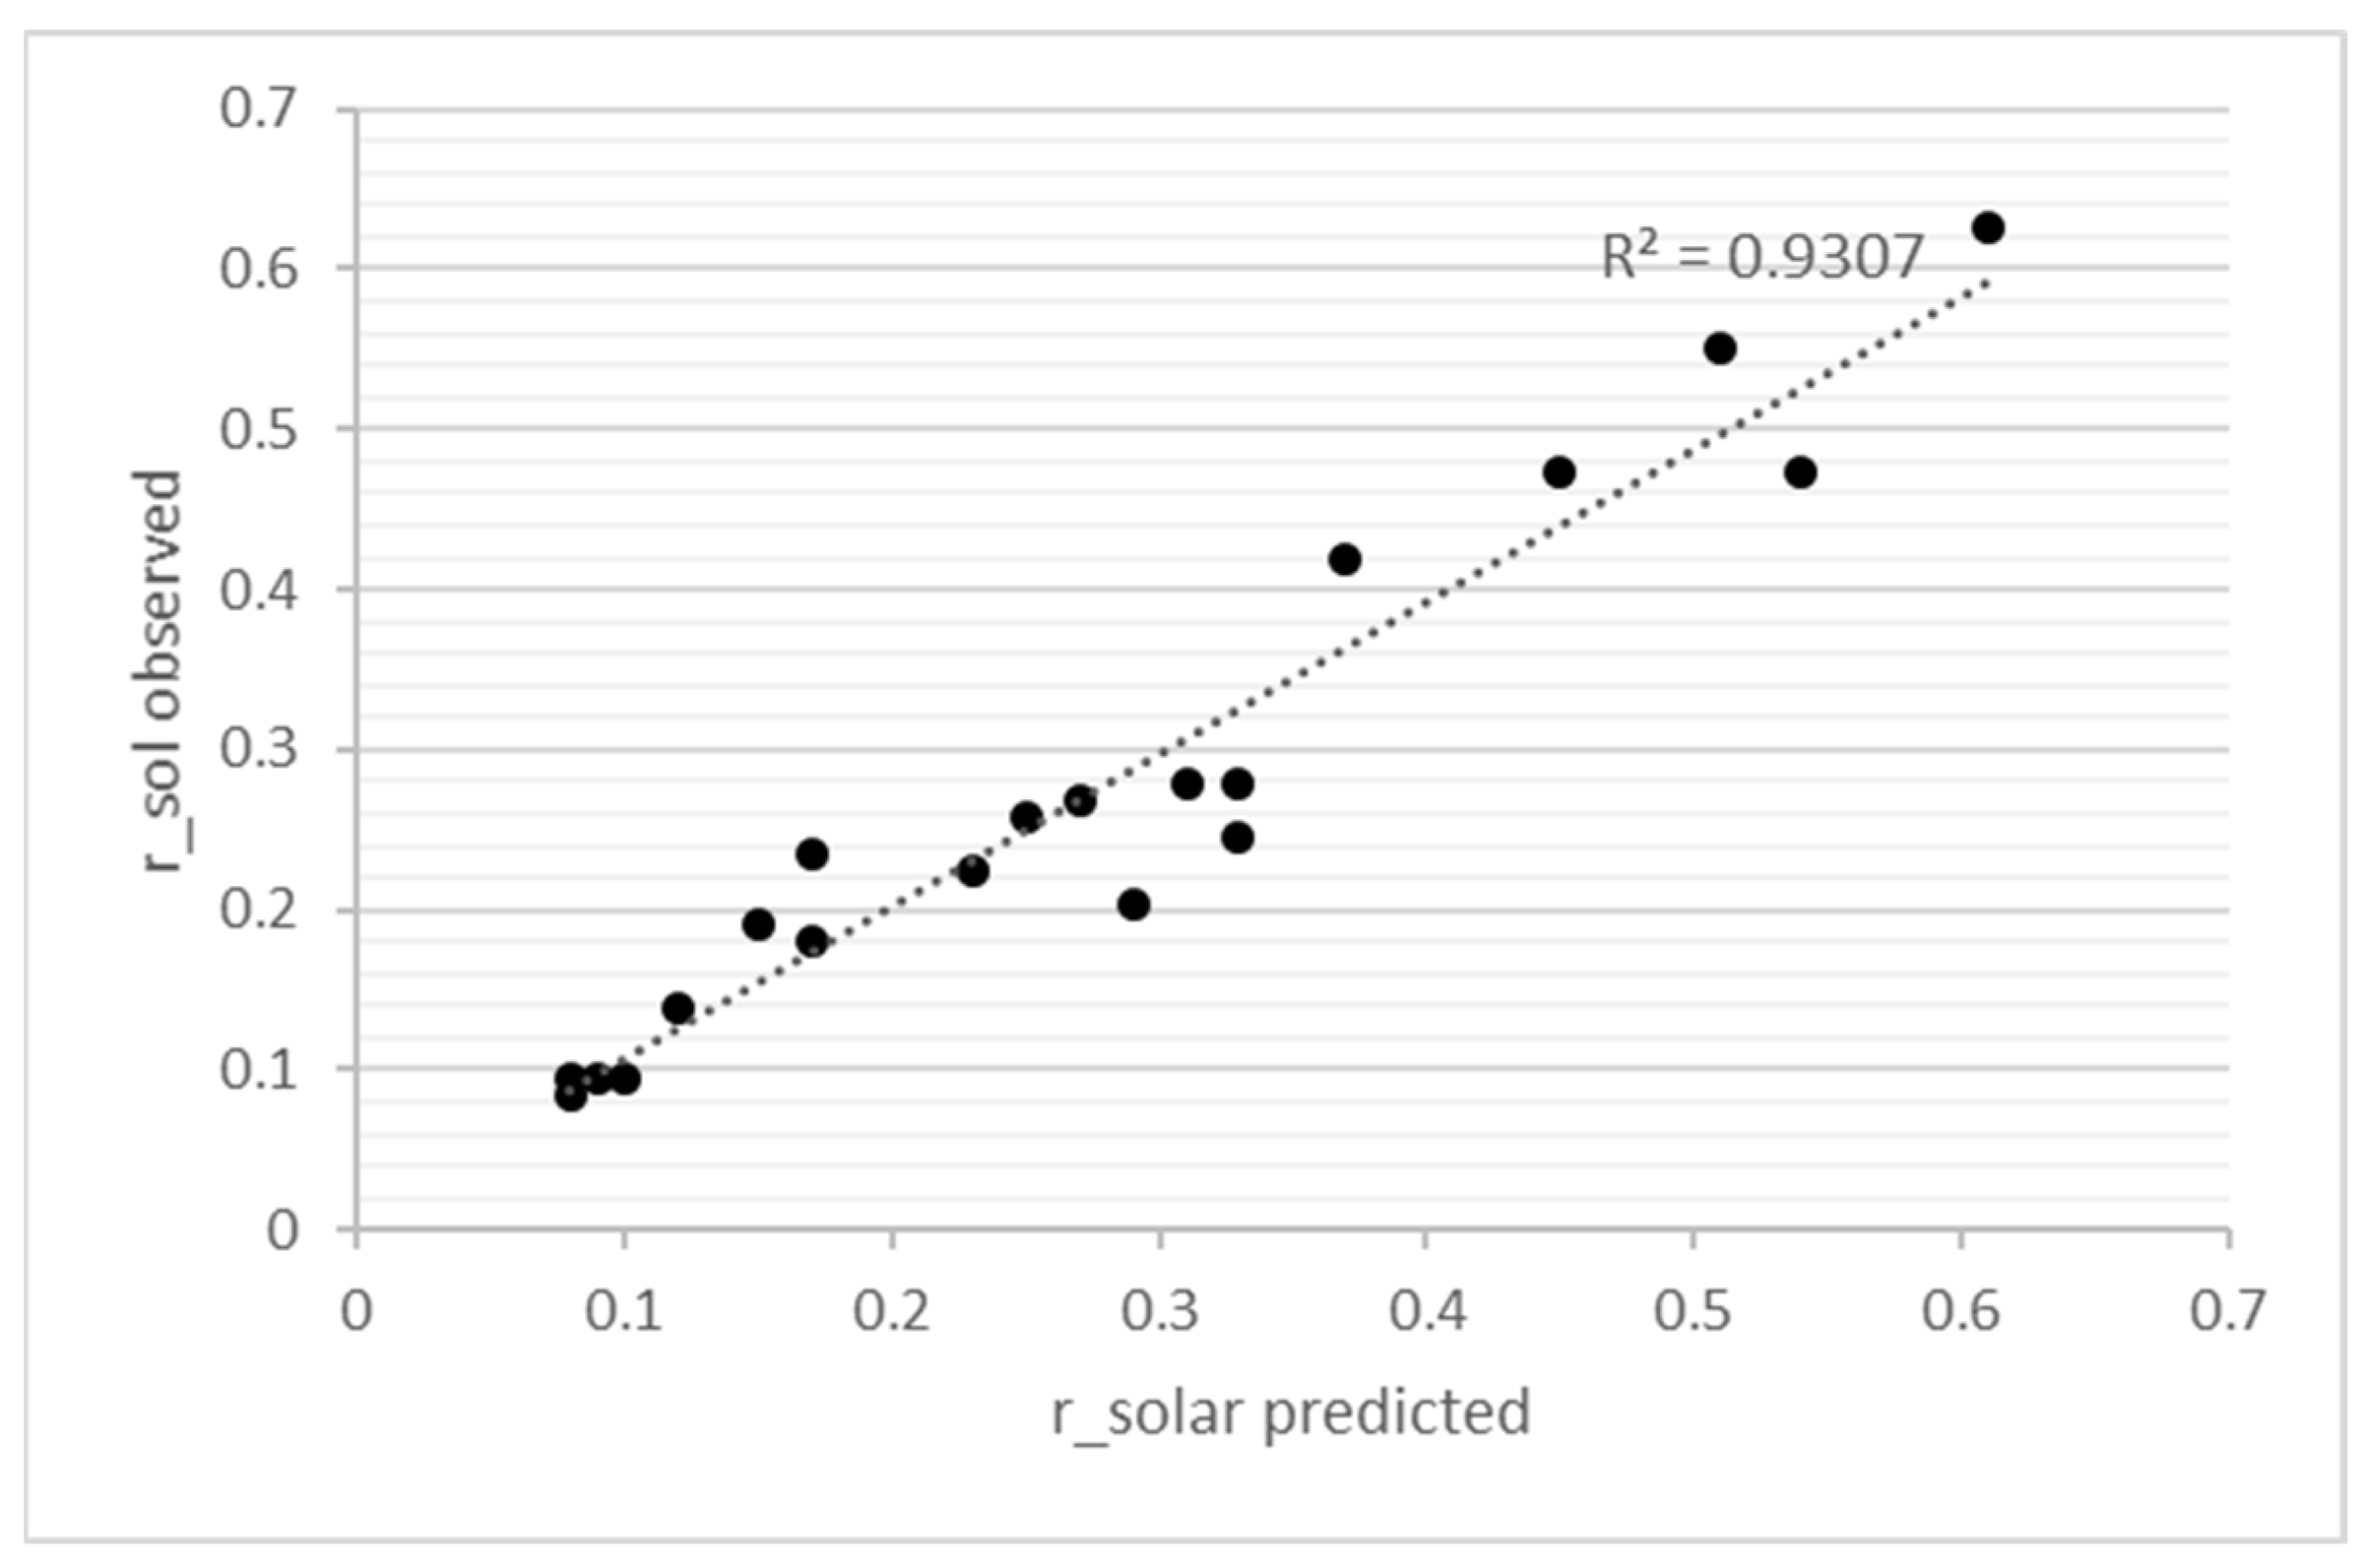
Based on the data obtained through Equation (3), we calculated the predictive r_sol values using the observed r_sol as a reference point. The results demonstrate a robust correlation between the two groups.
The function identified accounts for 93.1% of the observed variability in r_sol across the entire sample (see Table 4 and Figure 18).
Equation (3) and Figure 18 provide a foundation for future development of a more sophisticated model that will incorporate data from materials with diverse colors and compositions to capture variability in solar behavior, particularly in the near-infrared spectrum.

5. Discussion

Urban Retrofitting Strategies Based on the Thermo-Optical Behavior of Opaque Materials

The presented data constitute relevant information for the design of urban renovation strategies focused on the evaluation of the thermo-optical behavior of materials. The appropriate selection of materials contributes to improving the microclimatic conditions of urban canyons, without impairing visual and thermal comfort. In this sense, several studies have focused on defining the relationship between external temperature at the pedestrian scale and different materials of the building envelopes. These studies analyze the effects of reflected radiation produced inside the street canyon [33,34,35]. Increasing the reflectivity (r_sol) of building surface materials to solar radiation is the main method used to reduce the heat gain of buildings [36]. At the district level, studies have shown how the use of high-r_sol roofing materials in more than one hundred cities has improved air quality and urban climate [37]. On average, there has been a 3% decrease in ozone concentration, with a maximum decrease in air temperature of up to 4 °C [38]. Wang et al. (2022) [39] demonstrated an energy-savings rate of between 21 and 65% after the application of high-r_sol roofs in cities near the equator. The impact of high-r_sol façades is twofold: they reduce energy demand and enhance interior thermal comfort in sunny contexts. Furthermore, an effective design can optimize urban planning, thereby improving both interior and exterior habitability [40].
Roofs and pavements, due to their relative position within the urban canyon, have a greater ability to radiate the accumulated thermal energy towards the sky vault, by means of passive radiative cooling mechanisms. It should be noted that reflected longwave radiation can cause an overheating effect inside the canyons, a phenomenon known as the inter-building effect (IBE). The effect is further intensified by the height of buildings, as the mutual radiation from the vertical surfaces (façade) is confined within the channel [41].
Research conducted by Alchapar and Correa in 2016 and 2020 [19,42] in the city of Mendoza has yielded recommendations for determining the optimal level of r_sol, with these recommendations based on the height of the façades. This research determined that, in buildings over 12 m high, the r_sol of vertical materials should be lower than 0.50 to avoid thermal discomfort. According to the findings, every 10% increase in r_sol raises the air temperature by 0.5 °C.
Given the climatic conditions of the case study in the present research, it is advisable to employ strategies that reduce the overheating of surfaces. This is because the inter-building effect is not a significant problem due to the low building height and the wide urban roadway. To prevent excessive overheating due to solar radiation absorption in façades and pavements, it is essential to employ materials with high solar reflectance. Thus, it would be beneficial to replace the materials in the subgroup comprising blue paints, stone, cementitious materials, and dark gray and black metals (F06, P06, F07, P08, P07, F12, F09) in Figure 7 with others with characteristics similar to those of the first cluster, with an average solar reflectance of 0.53. Concurrently, it is recommended to select materials with high infrared emissivity to facilitate the nighttime emission of thermal energy, particularly in pavements.
In addition to the conditioning factors related to thermal comfort, it is essential to consider visual comfort, which is related to the optical properties of materials in the visible range. In general, studies that demonstrate a strong correlation between visual discomfort and the built environment tend to focus on areas with façades featuring specular surfaces [43]. Local studies in Mendoza city have demonstrated that individuals are adapted to the light climate of urban areas and therefore do not perceive glare, despite the diversity of contrast between urban surfaces [44,45]. Corica et al. (2011) [46] recorded visible reflectance levels of between 44% and 55% for façades and of between 14% and 15% for pavements in Mendoza city.
The findings of the present research indicate that the majority of façade surfaces analyzed exhibit visible reflectance values of below 55%, with pavement reflectance values ranging between 8% and 25%. As our analysis is based on the same city as the one used by Corica et al. [44,45]—with comparable urban environments (including urban trees and reflectance levels of urban envelopes)—we expect to find few, if any, instances of visual discomfort that could affect those using the studied area.
It is important to note that the selection of a more efficient material in terms of its opto-thermal properties does not involve additional costs, but can make a significant contribution to improving the habitability of outdoor spaces and, indirectly, to reducing energy consumption through the use of air-conditioning in indoor spaces. Synnefa et al. (2007) [47] defines it as an effective, low-cost, and easy-to-use technique for energy efficiency and thermal comfort in buildings in various climatic conditions.
Highly reflective surfaces with optimized properties are constantly being developed [48,49]. The most advanced material technologies include photonic fabrication methods and metamaterials, which enable building surface materials to have high solar reflectivity and thermal emissivity throughout the day, while reducing glare discomfort and thermal stress [50,51,52].
To support decision-making in urban planning, there are many catalogs in the building market that characterize materials based on the reflective properties of roof and wall materials. One example is the Cool Roof Council program, which is dedicated to promoting the adoption of cool material technologies on a global scale. Roof and façade classification catalogues from different building sectors around the world are available on the website (https://coolroofs.org/). In addition, in Argentina, South America, INAHE-CONICET has developed catalogues with thermal and optical databases of the most frequently used materials in the region (http://inahe.mendoza-conicet.gob.ar/materiales/, accessed on 1 November 2024).

6. Conclusions

Latin American cities must address the challenge of improving urban livability in contexts of limited economic resources. In this scenario, the appropriate management of solar radiation in urban environments presents a valuable opportunity to contribute to this objective. The selection of urban envelope materials based on their optical behavior can have a significant impact on the thermal comfort and energy efficiency of cities. Furthermore, this selection must take into account future scenarios of higher temperatures and more frequent extreme weather events expected due to climate change.
The research addresses two key areas: the first is the analysis of the optical behavior of materials within urban enclosures, and the second is the assessment of low-cost methodologies and tools to ensure their applicability in emerging socioeconomic contexts.
The initial findings on the primary axis indicated the following patterns of behavior. The spectral reflectance of the study area façades and pavements was found to be low both in the solar range (Ø r_sol: 0.26) and in the visible range (Ø r_vis: 0.23). This indicates a greater absorption of incident solar radiation, which increases the risk of overheating within the urban environment. Through cluster analysis, three groups of materials with distinct radiative characteristics were identified: light, medium, and dark shades. This variability in the solar and visible range presents an opportunity to identify materials that can enhance the habitability of outdoor spaces.
Furthermore, this work examined the chromatic behavior of building materials in relation to their spectral reflectance. The façades were classified into three groups based on their a* and b* coordinates: orange-yellowish, pinkish, reddish-orange, and gray or bluish-gray. In the case of pavements, two main groups can be distinguished: those with reddish-orange tones and those with gray tones. Materials with warm colors (orange, red) reflect more radiation than gray ones, which has significant implications in terms of energy efficiency and thermal comfort in buildings. In this context, there is a clear need for the building materials industry to direct its efforts towards the development of materials and surface finishes with higher solar reflectance, especially in vehicular pavements. This would reduce heat absorption by paved surfaces, thus contributing to mitigating the urban heat island effect and improving microclimatic conditions in cities. This strategy is especially important given the upcoming increase in temperatures caused by climate change.
In regard to the radiative behavior at long wavelengths (low frequency), the study demonstrated that the infrared emissivity monitored in the case study exhibited average values of 0.90. In other words, they are highly efficient heat energy-radiating materials, in line with the ranges typically observed in urban materials with similar mass characteristics (high density, high heat capacity, and thermal inertia). In future work, it is proposed to extend the sample unit to incorporate unpainted metallic materials.
In regard to the second axis, it was shown how the reliability of the spectral reflectance-monitoring results with the portable fiber optic spectrometer can be affected in materials with complex and non-homogeneous surfaces. The compact nature of the device presents a spotty measurement area, which can result in the acquisition of values that are not representative of the total sample.
Repetition of the infrared emissivity tests on the material analyzed demonstrated the high performance of the ET100 portable instrument. However, some difficulties were noted with materials with a high degree of surface topology due to the strong directional dependence, which cannot be fully captured by a portable instrument (F01, F11, and P05).
The color coordinates of the materials were also compared using the most affordable portable colorimeter (colorimeter NR20XE 3nh) and the data obtained with the highly complex spectrometer (Stellarnet spectrometer). The results indicate that the values determined by the colorimeter were overestimated in a* (red shift) with respect to those detected by the spectrometer.
Finally, the study advanced the development of a linear regression model to predict the spectral response in the solar range from values in the visible range, which is an advantage given that equipment that quantifies visible reflectance is considerably less expensive than equipment that quantifies solar reflectance. The preliminary statistical model revealed a correlation between the observed and calculated values of solar r_sol (R2 = 0.93). These findings pave the way for the creation of a more robust predictive tool that incorporates a larger number of analyzed materials to identify cases with divergent behavior in the infrared range.
This research highlights the importance of a thorough diagnosis of the optical properties of the materials present in urban environments. This in-depth assessment is essential for the efficient management of solar radiation in the façade and pavement materials most commonly used in the local building stock. This is key information for the construction of more accurate simulation models of buildings and cities, as well as for the identification and selection of the most suitable materials to replace current ones, in the search for strategies to reduce energy demand and improve the urban microclimate. Economic analysis of the cost-effectiveness of implementing rehabilitation materials is planned for future work.

Author Contributions

Conceptualization: N.A., F.M.-C., A.V., and G.P.; methodology: N.A., A.V., C.P., and G.P.; validation: N.A., A.V., and G.P.; formal analysis: N.A., A.V., and G.P.; investigation: C.A., B.F., and G.P.; resources: F.M.-C., C.A., B.F., and G.P.; data curation: N.A., F.M.-C., A.V., and G.P.; writing—original draft preparation: N.A., A.V., and G.P.; writing—review and editing: N.A., F.M.-C., A.V., and G.P.; visualization: N.A., A.V., and C.P.; supervision: G.P.; project administration: F.M.-C. and G.P.; funding acquisition: F.M.-C. and G.P. All authors have read and agreed to the published version of the manuscript.

Funding

This research was funded by the Lincglobal 2021 Program funded by Consejo Superior de Investigaciones Científicas de -España, grant number INCGLO00008; also; and with the collaboration of the Agencia Nacional de Promoción Científica y Tecnológica-ANPCyT-Argentina.

Data Availability Statement

The original contributions presented in this study are included in the article. Further inquiries can be directed to the corresponding author.

Acknowledgments

To the Sustainable Urbanism team of the Institute of Environment, Habitat and Energy (CONICET), led by Correa, for their collaboration with the field studies.

Conflicts of Interest

The authors declare no conflicts of interest. The funders had no role in the design of the study; in the collection, analyses, or interpretation of data; in the writing of the manuscript; or in the decision to publish the results.

References

  1. López-García, E.; Lizana, J.; Serrano-Jiménez, A.; Díaz-López, C.; Barrios-Padura, Á. Monitoring and analytics to measure heat resilience of buildings and support retrofitting by passive cooling. J. Build. Eng. 2022, 57, 104985. [Google Scholar] [CrossRef]
  2. Santamouris, M.; Paolini, R.; Haddad, S.; Synnefa, A.; Garshasbi, S.; Hatvani-Kovacs, G.; Gobakis, K.; Yenneti, K.; Vasilakopoulou, K.; Feng, J.; et al. Heat mitigation technologies can improve sustainability in cities. An holistic experimental and numerical impact assessment of urban overheating and related heat mitigation strategies on energy consumption, indoor comfort, vulnerability and heat-related mortality and morbidity in cities. Energy Build. 2020, 217, 110002. [Google Scholar] [CrossRef]
  3. Akbari, H.; Lodi, C.; Muscio, A.; Tartarini, P. Analysis of a new index for the thermal performance of horizontal opaque building components in summer. Atmosphere 2021, 12, 862. [Google Scholar] [CrossRef]
  4. Santamouris, M. Environmental Design of Urban Buildings: An Integrated Approach; Routledge: Abingdon, UK, 2006. [Google Scholar]
  5. Bui, D.K.; Nguyen, T.N.; Ghazlan, A.; Ngo, N.T.; Ngo, T.D. Enhancing building energy efficiency by adaptive façade: A computational optimization approach. Appl. Energy 2020, 265, 114797. [Google Scholar] [CrossRef]
  6. Levinson, R. Using solar availability factors to adjust cool-wall energy savings for shading and reflection by neighboring buildings. Sol. Energy 2019, 180, 717–734. [Google Scholar] [CrossRef]
  7. Taha, H.; Sailor, D.; Akbari, H. High-Albedo Materials for Reducing Building Cooling Energy Use; University of California: Berkeley, CA, USA, 1992. [Google Scholar] [CrossRef]
  8. Santamouris, M.; Synnefa, A.; Karlessi, T. Using advanced cool materials in the urban built environment to mitigate heat islands and improve thermal comfort conditions. Sol. Energy 2011, 85, 3085–3102. [Google Scholar] [CrossRef]
  9. Falasca, S.; Ciancio, V.; Salata, F.; Golasi, I.; Rosso, F.; Curci, G. High albedo materials to counteract heat waves in cities: An assessment of meteorology, buildings energy needs and pedestrian thermal comfort. Build. Environ. 2019, 163, 106242. [Google Scholar] [CrossRef]
  10. Miller, W.; Machard, A.; Bozonnet, E.; Yoon, N.; Qi, D.; Zhang, C.; Liu, A.; Sengupta, A.; Akander, J.; Hayati, A.; et al. Conceptualising a resilient cooling system: A socio-technical approach. City Environ. Interact. 2021, 11, 100065. [Google Scholar] [CrossRef]
  11. Martín-Consuegra, F.; De Frutos, F.; Hernández-Aja, A.; Oteiza, I.; Alonso, C.; Frutos, B. Utilización de datos catastrales para la planificación de la rehabilitación energética a escala urbana: Aplicación a un barrio ineficiente y vulnerable de Madrid. Ciudad. Territ. Estud. Territ. 2021, 54, 115–136. [Google Scholar] [CrossRef]
  12. Klinenberg, E. Heat Wave a Social Autopsy of Disaster in Chicago; University of Chicago Press: Chicago, IL, USA, 2022; Available online: https://www.perlego.com/book/1853205/heat-wave-a-social-autopsy-of-disaster-in-chicago-pdf (accessed on 17 February 2025).
  13. Kalkstein, L.; Klink, F.; Shickman, K.; Schneider, S.; Egolf, M.; Sailor, D. The Potential Impact of Cool Roof Technologies upon Heat Wave Meteorology and Human Health in Boston and Chicago. In Roofing Research and Standards Development: 9th Volume; ASTM International: West Conshohocken, PA, USA, 2020; pp. 1–27. [Google Scholar] [CrossRef]
  14. Villalba, A.; Alchapar, N.; Correa, E.; Pattini, A.; Santoni, L. Métodos de evaluación opto-térmica de materiales y componentes de la envolvente edilicia. Situación en Argentina. Rev. Hábitat Sustentable 2018, 8, 64–79. [Google Scholar] [CrossRef]
  15. Pérez, G.; Martín-Consuegra, F.; Martínez, A.; Alonso, C.; de Frutos, F.; Guerrero Bustos, A.M. Medidas de Reflectancia Solar y Emisividad de Materiales Urbanos. Fiabilidad de las Medidas In-Situ con Equipos Portátiles. Congreso Español de Metrología. 2022, pp. 1–9. Available online: https://digital.csic.es/bitstream/10261/296434/1/Medidas%20de%20reflectancia%20solar%20y%20emisividad%20de%20materiales%20urbanos.pdf (accessed on 17 February 2025).
  16. Pérez, G.; Martín-Consuegra, F.; de Frutos, F.; Martínez, A.; Oteiza, I.; Frutos, B.; Alonso, C. Analysis of the Optical Response of Opaque Urban Envelope Materials: The Case of Madrid. Infrastructures 2022, 7, 116. [Google Scholar] [CrossRef]
  17. Thoreau, R.; Risser, L.; Achard, V.; Berthelot, B.; Briottet, X. Toulouse Hyperspectral Data Set: A benchmark data set to assess semi-supervised spectral representation learning and pixel-wise classification techniques. ISPRS J. Photogramm. Remote Sens. 2024, 212, 323–337. [Google Scholar] [CrossRef]
  18. Alchapar, N.; Correa, E.; Cantón, M. Classification of building materials used in the urban envelopes according to their capacity for mitigation of the urban heat island in semiarid zones. Energy Build. 2014, 69, 22–32. [Google Scholar] [CrossRef]
  19. Alchapar, N.; Correa, E. Optothermal properties of façade coatings. Effects of environmental exposure over solar reflective index. J. Build. Eng. 2020, 32, 101536. [Google Scholar] [CrossRef]
  20. Sen, S.; Roesler, J. Thermal and optical characterization of asphalt field cores for microscale urban heat island analysis. Constr. Build. Mater. 2019, 217, 600–611. [Google Scholar] [CrossRef]
  21. Sanjuán, M.Á.; Morales, Á.; Zaragoza, A. Effect of Precast Concrete Pavement Albedo on the Climate Change Mitigation in Spain. Sustainability 2021, 13, 11448. [Google Scholar] [CrossRef]
  22. Sailor, D.J.; Resh, K.; Segura, D. Field measurement of albedo for limited extent test surfaces. Sol. Energy 2006, 80, 589–599. [Google Scholar] [CrossRef]
  23. Levinson, R.; Akbari, H. Effects of composition and exposure on the solar reflectance of portland cement concrete. Cem. Concr. Res. 2002, 32, 2001–2002. [Google Scholar] [CrossRef]
  24. Luo, M.R. CIELAB BT—Encyclopedia of Color Science and Technology; Luo, R., Ed.; Springer: Berlin/Heidelberg, Germany, 2014; pp. 1–7. [Google Scholar] [CrossRef]
  25. Ly, B.; Dyer, E.; Feig, J.; Chien, A.; Del Bino, S. Research Techniques Made Simple: Cutaneous Colorimetry: A Reliable Technique for Objective Skin Color Measurement. J. Investig. Dermatol. 2020, 140, 3–12.e1. [Google Scholar] [CrossRef] [PubMed]
  26. International Commission on Illumination (CIE). CIE 15: Technical Report: Colorimetry, 3rd ed.; Vienna, Austria, 2004; ISBN 978 3 901906 33 6. [Google Scholar]
  27. ASTM E408-09; Standard Test Methods for Total Normal Emittance of Surfaces Using Inspection-Meter Techniques. ASTM International: West Conshohocken, PA, USA, 2009.
  28. Akbari, H.; Levinson, R.; Stern, S. Procedure for measuring the solar reflectance of flat or curved roofing assemblies. Sol. Energy 2008, 82, 648–655. [Google Scholar] [CrossRef]
  29. White, M.; Hu, Y.; Langenheim, N.; Ding, W.; Burry, M. Cool city design: Integrating real-time Urban canyon assessment into the design process for chinese and Australian cities. Urban Plan. 2016, 1, 25–37. [Google Scholar] [CrossRef]
  30. Hasan, M.; Islam, A. Kabir, M. A Comprehensive Survey on Distance Based Machine Learning Algorithms. J. Artif. Intell. 2016, 9, 1–54. [Google Scholar]
  31. ASTM 1918-21; Standard Test Method for Measuring Solar Reflectance of Horizontal and Low-Sloped Surfaces in the Field. ASTM International: West Conshohocken, PA, USA, 2021.
  32. Taylor, S.; Wright, J.; Forrest, E.; Jared, B.; Koepke, J.; Beaman, J. Investigating relationship between surface topography and emissivity of metallic additively manufactured parts. Int. Commun. Heat. Mass. Transf. 2020, 115, 104614. [Google Scholar] [CrossRef]
  33. Salvati, A.; Kolokotroni, M.; Kotopouleas, A.; Watkins, R.; Giridharan, R.; Nikolopoulou, M. Impact of reflective materials on urban canyon albedo, outdoor and indoor microclimates. Build. Environ. 2022, 207, 108459. [Google Scholar] [CrossRef]
  34. Tsoka, S.; Tsikaloudaki, K.; Theodosiou, T.; Bikas, D.; Tsikaloudaki, A.; Theodosiou, T. Urban warming and cities’ microclimates: Investigation methods and mitigation strategies—A review. Energies 2020, 13, 1414. [Google Scholar] [CrossRef]
  35. Khorat, S.; Das, D.; Khatun, R. Cool roof strategies for urban thermal resilience to extreme heatwaves in tropical cities. Energy Build. 2024, 302, 113751. [Google Scholar] [CrossRef]
  36. Xu, F.; Zhang, J.; Gao, Z. The effect of building surface cool and super cool materials on microclimate in typical residential neighborhoods in Nanjing. Sustain. Cities Soc. 2023, 98, 104838. [Google Scholar] [CrossRef]
  37. Santamouris, M. Cooling the cities—A review of reflective and green roof mitigation technologies to fight heat island and improve comfort in urban environments. Sol. Energy 2014, 103, 682–703. [Google Scholar] [CrossRef]
  38. Morini, E.; Castellani, B.; Presciutti, A.; Filipponi, M.; Nicolini, A.; Rossi, F. Optic-energy performance improvement of exterior paints for buildings. Energy Build. 2017, 139, 690–701. [Google Scholar] [CrossRef]
  39. Wang, N.; Lv, Y.; Zhao, D.; Zhao, W.; Xu, J.; Yang, R. Performance evaluation of radiative cooling for commercial-scale warehouse. Mater. Today Energy 2022, 24, 100927. [Google Scholar] [CrossRef]
  40. Alonso, C.; Martín-Consuegra, F.; Oteiza, I.; Asensio, E.; Pérez, G.; Martínez, I.; Frutos, B. Effect of façade surface finish on building energy rehabilitation. Sol. Energy 2017, 146, 470–483. [Google Scholar] [CrossRef]
  41. Pisello, A.; Taylor, J.; Xu, X.; Cotana, F. Inter-building effect: Simulating the impact of a network of buildings on the accuracy of building energy performance predictions. Build. Environ. 2012, 58, 37–45. [Google Scholar] [CrossRef]
  42. Alchapar, N.; Correa, E. The use of reflective materials as a strategy for urban cooling in an arid “OASIS” city. Sustain. Cities Soc. 2016, 27, 1–14. [Google Scholar] [CrossRef]
  43. Suk, J.; Schiler, M.; Kensek, K. Reflectivity and specularity of building envelopes: How materiality in architecture affects human visual comfort. Archit. Sci. Rev. 2017, 60, 256–265. [Google Scholar] [CrossRef]
  44. Córica, M.; Ruiz, M. Aspectos cuantitativos y cualitativos de la luz solar en recintos urbanos de alta densidad edilicia en climas soleados (período invernal). Rev. Hábitat Sustentable 2018, 8, 16–27. [Google Scholar] [CrossRef]
  45. Córica, M.; Ruiz, M. Luz solar en recintos urbanos de alta densidad edilicia en el modelo oasis de la ciudad de Mendoza. Aspectos cuantitativos y cualitativos (período estival). Cuad. Urbano 2018, 25, 117–138. [Google Scholar] [CrossRef]
  46. Corica, L.; Pattini, E. Natural en cañones urbanos de la ciudad de mendoza, evaluation of the component reflected of daylight in urban environments. Energías Renov. Medio Ambient. 2011, 28, 9–16. [Google Scholar]
  47. Synnefa, A.; Santamouris, M.; Akbari, H. Estimating the effect of using cool coatings on energy loads and thermal comfort in residential buildings in various climatic conditions. Energy Build. 2007, 39, 1167–1174. [Google Scholar] [CrossRef]
  48. Castellani, B.; Morini, E.; Anderini, E.; Filipponi, M.; Rossi, F. Development and characterization of retro-reflective colored tiles for advanced building skins. Energy Build. 2017, 154, 513–522. [Google Scholar] [CrossRef]
  49. Xue, X.; Yang, Z.; Li, Y.; Sun, P.; Feng, Y.; He, Z.; Qu, T.; Dai, J.G.; Zhang, T.; Qin, J.; et al. Superhydrophobic self-cleaning solar reflective orange-gray paint coating. Sol. Energy Mater. Sol. Cells 2018, 174, 292–299. [Google Scholar] [CrossRef]
  50. Li, W.; Shi, Y.; Chen, Z.; Fan, S. Photonic thermal management of coloured objects. Nat. Commun. 2018, 9, 4240. [Google Scholar] [CrossRef]
  51. Mandal, J.; Fu, Y.; Overvig, A.; Jia, M.; Sun, K.; Shi, N.N.; Zhou, H.; Xiao, X.; Yu, N.; Yang, Y. Hierarchically porous polymer coatings for highly efficient passive daytime radiative cooling. Science 2018, 362, 315–319. [Google Scholar] [CrossRef] [PubMed]
  52. Zhai, Y.; Ma, Y.; David, S.; Zhao, D.; Lou, R.; Tan, G.; Yang, R.; Yin, X. Scalable-manufactured randomized glass-polymer hybrid metamaterial for daytime radiative cooling. Science 2017, 355, 1062–1066. [Google Scholar] [CrossRef] [PubMed]
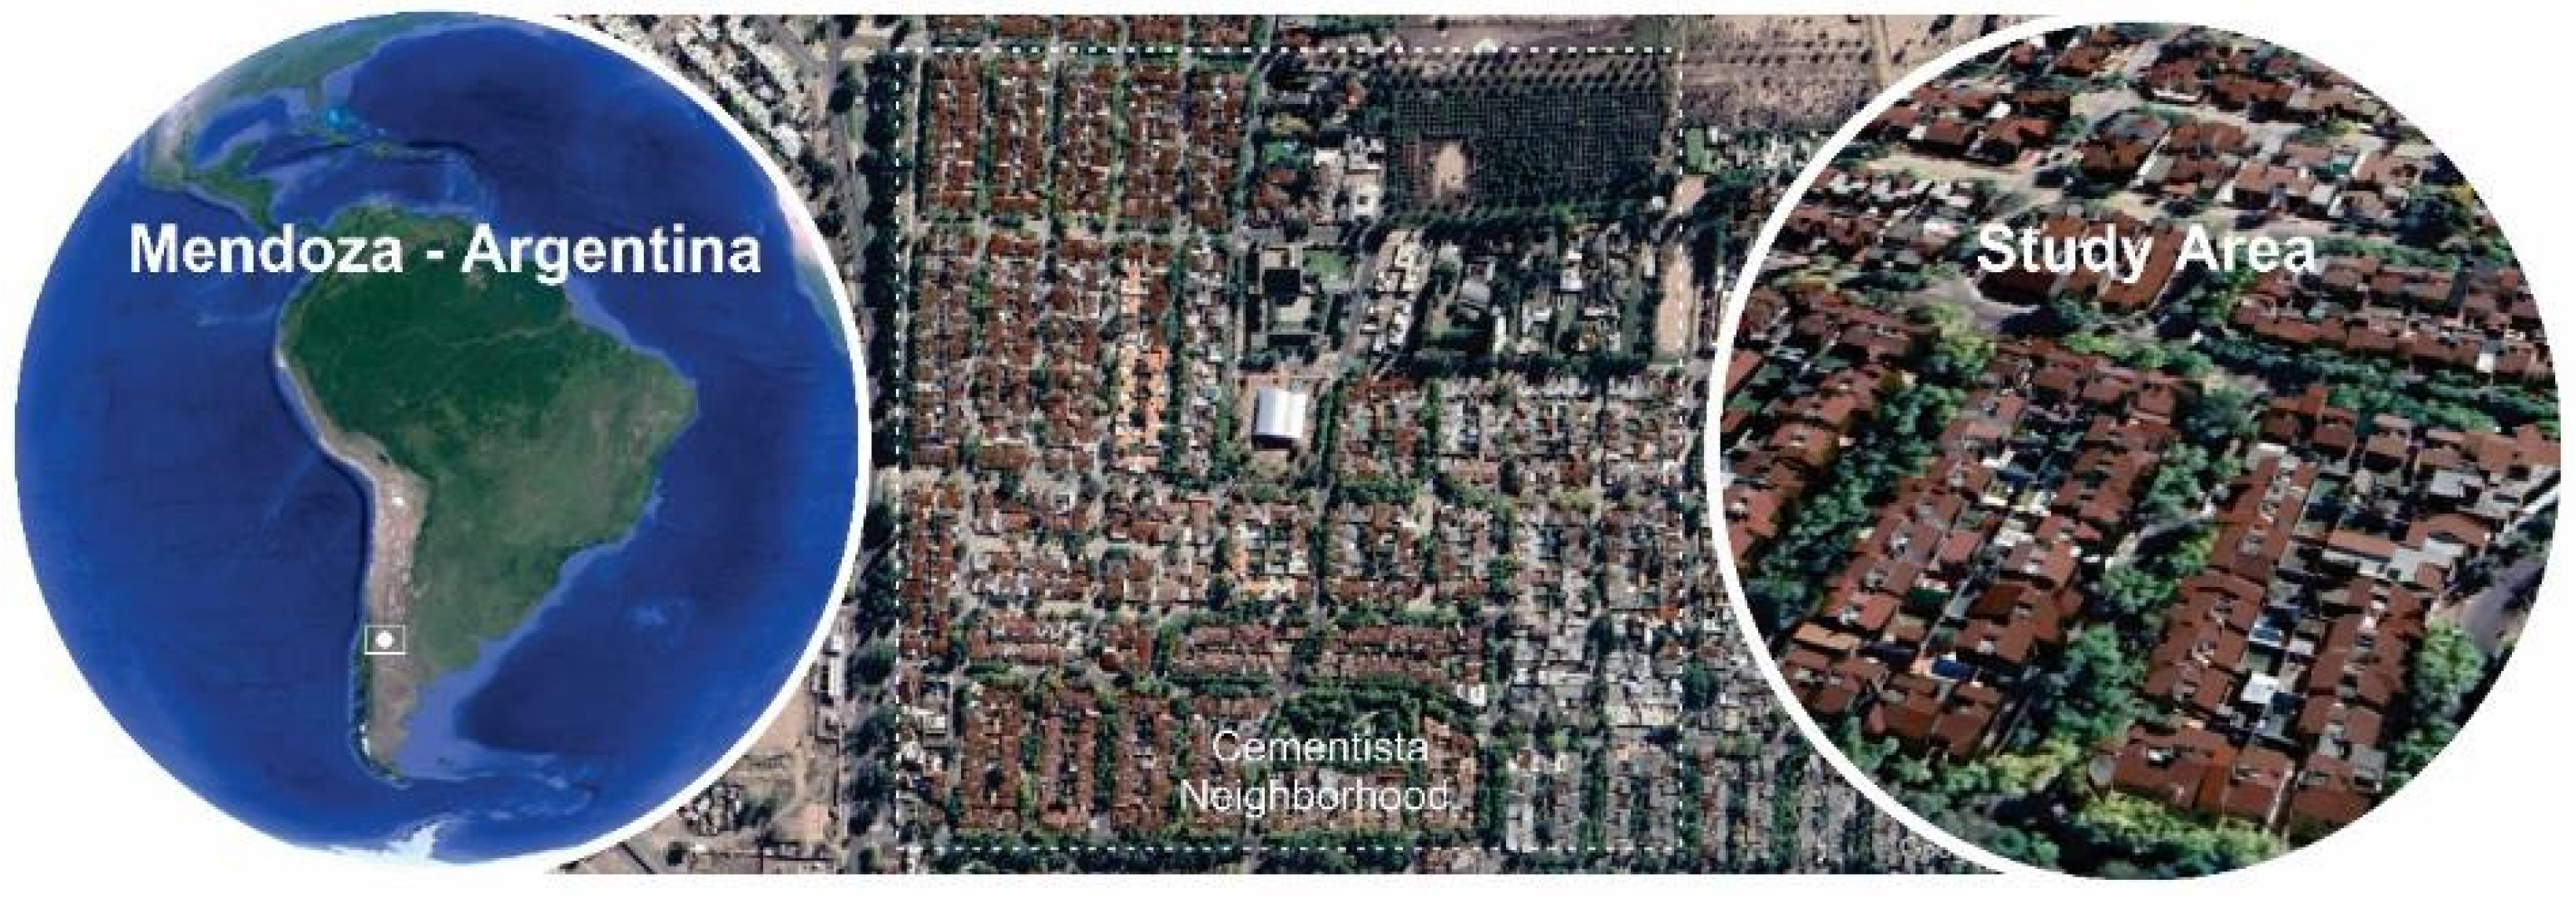
Figure 1. Aerial image of the Cementista neighborhood.
Urbansci 09 00057 g001
Figure 2. Materials evaluated. Façades (F) and pavements (P) selected for the study. See material descriptions in Table 1 and Table 2.
Urbansci 09 00057 g002
Figure 3. Infrared mapping of the studied road channel.
Urbansci 09 00057 g003
Figure 4. Equipment used in the measurement campaign in the Cementista neighborhood: spectrometer (Stellarnet Black Comet), emissometer (ET100), and colorimeter (3nh).
Urbansci 09 00057 g004
Figure 5. Reflectance measured in situ of vertical envelopes (façades) and horizontal envelopes (pavements).
Urbansci 09 00057 g005
Figure 6. Boxplot of the total samples evaluated in the area in the solar (r_sol) and visible (r_vis) range (r_vis).
Urbansci 09 00057 g006
Figure 7. Reflectance dendrogram in the solar range (r_sol).
Urbansci 09 00057 g007
Figure 8. Reflectance dendrogram in the visible range (r_vis).
Urbansci 09 00057 g008
Figure 9. Bar graph with the values of L* color coordinates of the sample unit.
Urbansci 09 00057 g009
Figure 10. CIEL*a*b* coordinates of the sample unit. Scatter plot of a* and b* coordinates (left) and 3D coordinates CIEL*a*b* (right).
Urbansci 09 00057 g010
Figure 11. Hemispheric total emittance (HTE) based on the urban component.
Urbansci 09 00057 g011
Figure 12. Spectral reflectance in non-homogeneous pavements (P06). Observations: o1, o2, o3, and average.
Urbansci 09 00057 g012
Figure 13. Spectral reflectance in non-homogeneous pavements (P07). Observations: o1, o2, o3, and average.
Urbansci 09 00057 g013
Figure 14. Spectral reflectance in non-homogeneous pavements (P08). Observations: o1, o2, o3, and average.
Urbansci 09 00057 g014
Figure 15. Spectral reflectance in homogeneous pavements (P12). Observations: o1, o2, o3, and averages.
Urbansci 09 00057 g015
Figure 16. Thermal emissivity ranges observed in each sample unit.
Urbansci 09 00057 g016
Figure 17. Line graph with the CIELab coordinate values measured with a spectrometer and colorimeter for each of the materials compared.
Urbansci 09 00057 g017
Figure 18. Scatter plot of observed and predicted r_sol.
Urbansci 09 00057 g018
Table 1. Radiative properties of façades. Mean values (Ø) and deviations (StDev) for each evaluated material.
IDFaçade TypeReflectanceColor CoordinatesHemispherical Infrared Emissivity (HTE)
r_visr_solL*a*b*
F01Pink textured finishØ 0.570.6179.3510.6014.990.90
StDev0.040.042.270.931.210.01
F02Ocher textured finishØ 0.430.4572.693.8516.230.90
StDev0.070.085.010.411.410.00
F03Orange painted plasterworkØ 0.430.5467.8829.1749.230.90
StDev0.020.020.951.652.050.00
F04Natural varnished wood panelingØ 0.220.3350.6811.8836.960.90
StDev0.010.011.721.311.120.00
F05Gray metallic claddingØ 0.380.3968.020.682.140.89
StDev0.000.010.180.010.840.00
F06Blue textured finishØ 0.170.1548.580.24−5.730.90
StDev0.010.010.940.540.900.00
F07Black metallic claddingØ 0.070.0832.38−0.071.380.82
StDev0.000.001.310.771.780.00
F08Beige textured finishØ 0.500.5177.514.7714.230.89
StDev0.000.000.120.100.450.00
F09Brown textured finishØ 0.120.1242.256.3012.850.91
StDev0.000.000.470.730.970.00
F10Varnished exposed brickworkØ 0.180.2648.189.2615.680.89
StDev0.010.020.401.160.120.00
F11Terracotta painted brickworkØ 0.250.3351.8723.1324.100.90
StDev0.010.011.442.060.950.04
F12Black painted stoneworkØ 0.080.0933.941.41−3.800.89
StDev0.020.024.390.021.350.00
SummaryØ 0.280.3256.118.4414.860.89
StDev0.020.021.600.811.100.00
Table 2. Radiative properties of pavements. Mean values (Ø) and deviations (StDev).
IDPavement TypeReflectanceColor CoordinatesHemispherical Infrared Emissivity
(HTE)
r_visr_solL*a*b*
P01 *Smooth cement finishØ 0.240.2755.662.488.080.90
StDev0.030.032.591.150.770.00
P02 *Pink and beige flagstoneØ 0.250.3154.557.7011.240.90
StDev0.000.010.521.190.910.00
P03 *Gray limestone mosaicØ 0.160.1747.601.214.160.90
StDev0.010.011.060.900.530.00
P04 *Red limestone mosaicØ 0.200.2249.479.435.750.91
StDev0.000.000.111.080.280.04
P05 *Brushed cement finishØ 0.230.2655.413.148.080.90
StDev0.030.033.370.411.020.01
P06 *Black limestone mosaicØ 0.210.2252.180.87−0.070.88
StDev0.080.099.391.192.450.00
P07 *Gray river rock mosaicØ 0.080.0934.933.084.310.90
StDev0.010.011.691.421.920.00
P08 **AsphaltØ 0.080.0834.591.124.030.91
StDev0.030.025.670.252.010.01
SummaryØ 0.180.2048.053.635.700.90
StDev0.020.033.050.951.240.01
* Pedestrian pavement. ** Vehicular pavement.
Table 3. Differences for each of the measured CIELab color coordinates (ΔL*, Δa*, Δb*) and the total color difference (ΔE) recorded with a spectrometer and colorimeter for each of the materials compared.
FaçadesΔL*Δa*Δb*ΔEPavementsΔL*Δa*Δb*ΔE
F013.210.22.984.38P013.82−1.07−0.143.97
F02−2.96−1.35−3.254.6P023.280.430.473.34
F032.23−2.86−0.823.72P03−9.75−1.45−2.2510.11
F04−5.74−5.95−0.988.32P043.19−2.12−2.764.72
F077.420.071.287.53P0515.29−4.38−5.5516.84
F085.07−1.27−0.515.25P07−4.91−3.96−5.188.16
F091.99−0.86−0.52.23P083.560.232.084.13
F10−1.12−3.26−4.585.73
F112.86−1.59−1.973.82
F1212.712.1−2.8713.19
Table 4. Statistical summary of observed and predicted data.
Statisticsr_sol Observedr_sol Predicted
Count2020
Average0.270.27
Standard deviation0.160.16
Coefficient of variation58.9%58.7%
Minimum0.080.08
Maximum0.610.63
Disclaimer/Publisher’s Note: The statements, opinions and data contained in all publications are solely those of the individual author(s) and contributor(s) and not of MDPI and/or the editor(s). MDPI and/or the editor(s) disclaim responsibility for any injury to people or property resulting from any ideas, methods, instructions or products referred to in the content.