1. Introduction
Mapping symbolizes the scope of representation, such as projecting a more inclusive picture of the city. Additionally, it fundamentally describes improved maps to address challenges through monitoring topography and interpreting landscape meaning [
1,
2]. Mapping can also address object bias and illustrate social, economic, and environmental knowledge hierarchies [
3] while fostering a more collective understanding of the environment [
4]. Furthermore, mapping is particularly relevant for assessing changes in inner urban zones, emphasizing the need for city development to be based on inclusive strategies, such as promoting historical values, expanding green spaces, regulating pollution and emissions, and encouraging public participation to create a more inclusive urban area [
5,
6].
Many researchers have concluded that mapping illustrates various aspects, including population growth, public spaces, settlements, and green open areas, which collectively contribute to the concept of an inclusive city [
3,
7,
8]. However, several obstacles arise in mapping, such as temporal changes in areas with specific populations or significant transformations in certain regions [
9]. Another study found that ‘the image of the city’ is closely linked to environmental perceptions of urban life, as cities are shaped by factors such as age, history, and commercial core areas, which reflect population density ranging from slums to upper-class housing [
10]. According to the World Health Organization (WHO), an ideal city should have at least 9 square meters of green space per person. Thus, the environmental image is considered a symbolic representation of open space that must be accessible to all [
11,
12]. Urban development has influenced the dynamics of urban planning, with ongoing adjustments in urban land use to accommodate more exclusive conditions [
13]. Additionally, fast-growing cities present a complex picture, including political, commercial, and artistic developments, as well as rural-to-urban migration [
1,
7]. Therefore, the rapid growth of urban areas must be accompanied by sustainable urban planning.
In rapidly developing countries, such as Indonesia, urbanization and challenges related to territorial expansion have resulted in the migration of over half the population [
14,
15,
16]. In this research, urbanization refers to the shifting proportion of rural and urban populations, which drives the increasing need for urban green spaces. Green space is essential for cities due to its ecological, economic, social, and cultural significance [
4,
5], including its role as a public space [
7]. In addition, green spaces improve air quality, reduce heat, support biodiversity, promote mental health, encourage recreation, and enhance urban aesthetics and sustainability. Thus, the necessity of urban green spaces is widely acknowledged [
9]. Moreover, research indicates that urban green areas can be identified using various approaches, particularly in inner-city built-up areas and their surrounding structures [
13]. Studies on green open space regulation in the context of urban development adopt various perspectives. These include analyzing green spaces through a city’s topography and landscape [
1], examining the basic land surface types of cities [
10], studying urban management and green space efficiency [
9], and assessing how institutional and policy factors influence urban mapping [
17]. However, the use of remote sensing to map urban areas and green spaces remains underdeveloped.
Remote sensing provides a good solution for mapping urban and green space areas in a city [
18], monitoring the effects of changes in a city through Sentinel data, obtaining basic information about city topography, and monitoring and urban planning [
19]. The applications of remote sensing also extend to the analysis of Sentinel-2 data, particularly through the use of Google Earth Engine (GEE). Many researchers have successfully utilized Google Earth Engine (GEE) for generating remote sensing data for several purposes [
20,
21,
22]. Sentinel-2, equipped with high-resolution optical imagery, enables the detailed monitoring of land vegetation, which is crucial for green space research [
18,
23]. GEE facilitates efficient processing and analysis of this data by providing a cloud-based platform capable of handling vast datasets and performing complex geospatial computations. For green space research, Sentinel-2 data processed on GEE can be utilized to calculate vegetation indices, such as the Normalized Difference Vegetation Index (NDVI), which serve as indicators of vegetation health and density [
19]. Similarly, for urban area assessment, Sentinel-2 data can be analyzed to map impervious surfaces and urban sprawl, offering insights into land use patterns and the impacts of urbanization. By combining the advanced capabilities of Sentinel-2 with the computational efficiency of GEE, researchers can derive actionable insights to support sustainable urban planning and the preservation of green spaces.
In the context of Indonesian cities, such as Central Jakarta, Bandung, Yogyakarta, Surabaya, and Semarang, the application of remote sensing holds significant potential for urban and green space management. Over the last two decades, Central Jakarta, Bandung, Yogyakarta, Surabaya, and Semarang have faced rapid urbanization and land use changes [
24,
25,
26,
27]. These cities, which are characterized by rapid urbanization and diverse land use patterns, face challenges such as diminishing green spaces and increased urban density. By utilizing Sentinel-2 imagery processed on GEE, researchers can monitor urban expansion, identify critical green spaces, and assess vegetation health through indices like NDVI and Enhanced Vegetation Index (EVI). For instance, mapping impervious surfaces in Central Jakarta can provide insights into flood mitigation strategies and water resources management, while green space assessments in Bandung and Yogyakarta can guide urban greening initiatives in Surabaya and Semarang, where industrial activities and coastal dynamics influence urban growth. Coastal dynamics in Surabaya and Semarang occur due to a combination of natural and human-induced factors, including sea level or tidal fluctuations, sediment transport, and land subsidence [
28,
29]. However, Sentinel-2 data can help analyze land use changes and support sustainable urban development. These applications not only enhance urban planning but also contribute to the formulation of policies aimed at improving livability and environmental resilience in Indonesian cities. Urban green spaces (UGS), including parks, forests, gardens, and other vegetation areas, are critical for enhancing environmental quality, mitigating urban heat islands, improving public health, and promoting biodiversity [
30,
31]. However, rapid urbanization in Indonesia has reduced green spaces, particularly in densely populated cities that face significant challenges in maintaining green spaces due to urban sprawl and infrastructure development. For example, cities like Jakarta experienced a decline in green space from 45% to 20% over a 25-year period [
32]. This reduction is primarily due to the conversion of green areas into built-up regions to accommodate the growing urban population and infrastructure demands [
33]. These challenges underscore the need for efficient monitoring tools, such as remote sensing, to guide urban planning and conservation efforts.
Therefore, the objectives of this research are as follows: (1) To develop a comprehensive mapping framework for identifying, quantifying, and monitoring urban green spaces in Central Jakarta, Bandung, Yogyakarta, Surabaya, and Semarang using Sentinel-2 imagery and indices such as NDVI and EVI to support urban planning and sustainable development. (2) While the remarkable impact of rapid urban growth, this research also tries to develop a comprehensive mapping framework for identifying, quantifying, and monitoring urban green spaces in Central Jakarta, Bandung, Yogyakarta, Surabaya, and Semarang using Sentinel-2 imagery and indices such as NDVI and EVI, to support urban planning and sustainable development. The use of remote sensing data makes it possible to collect spatial data more accurately and quickly in a relatively short period of time. Remote sensing technologies enable the rapid and accurate collection of spatial data over extensive areas without the need for direct ground contact, significantly reducing the time and labor associated with traditional surveying methods. This efficiency facilitates timely monitoring and analysis of environmental changes, including land use patterns and vegetation cover, with high precision [
34].
This study presents a novel framework for urban green space management that addresses the pressing need for accurate, scalable, and dynamic monitoring methods in rapidly urbanizing regions. Using Sentinel-2 imagery and advanced vegetation indices such as NDVI and EVI, this research provides an innovative methodology for identifying, quantifying, and tracking urban green spaces in five Indonesian cities: Central Jakarta, Bandung, Yogyakarta, Surabaya, and Semarang. Integrating remote sensing technology enables timely and accurate assessments, addressing challenges for improving data accuracy and reliability in future studies. This study fills a critical gap in urban green space monitoring for developing countries. It supports sustainable urban planning by providing applicable tools for managing and enhancing green infrastructure in dynamic urban environments.
2. Literature Review
Urban green spaces are essential for improving the quality of life in metropolitan areas, promoting ecological balance, and addressing the challenges of sustainable urban development [
35,
36,
37]. In order to achieve a sustainable city, it is necessary to prioritize nature-based solutions [
38], including renaturation and rewilding [
13]. These green spaces—including parks, gardens, and other natural areas—are essential for increasing urban biodiversity, maintaining air quality, and promoting the overall health of urban ecosystems [
31,
39]. Urban ecology plays a crucial role in creating, preserving, and sustainably restoring green and open spaces. Greening the city involves implementing strategies and techniques to protect and restore ecological systems within urban communities [
30]. It focuses on integrating urbanism with nature to create healthy, enriching, and sustainable living environments [
30]. As cities continue to grow, the preservation and development of these green spaces become critical to urban sustainability and public health [
39]. These efforts have numerous environmental benefits, such as reducing the urban heat island effect, conserving energy, improving air quality, and absorbing carbon dioxide from the atmosphere [
13,
40].
Mapping the distribution and condition of green spaces becomes increasingly complex as cities face various environmental challenges. Traditional approaches to mapping and analyzing green spaces can be time-consuming and effort-intensive [
33,
41], highlighting the need for more efficient methods. Machine learning techniques have shown promise in categorizing land use and identifying changes [
22,
42], thereby improving our understanding of urban ecological interactions [
43]. By integrating these methods, urban green spaces can be better assessed, and sustainable urban planning efforts can be improved, highlighting the importance of better management of green spaces [
22]. Furthermore, remote sensing has significant potential to support these initiatives.
Remote sensing technologies have become highly developed tools for monitoring and managing urban green spaces [
22,
35,
41]. They enable policymakers to track change and strategize for future development effectively [
44]. They provide a comprehensive overview of how satellite imagery can be used to assess the extent and health of vegetation in urban environments [
30,
31]. Remotely sensed data, particularly from platforms such as Landsat, Sentinel, and other satellite sensors, provide detailed insights into urban green spaces’ spatial distribution and temporal dynamics. Designed to handle massive amounts of geospatial data, Google Earth Engine (GEE) enables researchers to analyze large datasets with remarkable efficiency [
22]. This cloud-based platform excels at handling inputs from satellite imagery, including Landsat and Sentinel datasets, which are essential for monitoring land cover change over time [
21,
41]. These data can be analyzed using geographic information systems to produce maps and visualizations of green space patterns, which can then be used to inform urban planning and policy decisions [
45]. Remote sensing has become an important tool for mapping urban green spaces, using various techniques and technologies to improve data accuracy and analysis.
In this context, the emergence of remote sensing technology, mainly through platforms such as Google Earth Engine, provides innovative solutions for monitoring urban green spaces. Using high-resolution satellite imagery and advanced analysis tools [
22,
43], it systematically identifies, assesses, and visualizes green spaces on a large scale [
21,
37], ultimately contributing to creating more resilient and livable cities. Moreover, indices such as the EVI are vital in analyzing the diminishing vegetation cover amidst the relentless expansion of urban landscapes [
42]. The EVI was developed as an improvement over the NDVI to address some limitations [
45]. By revealing the inverse spatial pattern between the availability of green space and the rate of urbanization, EVI provides critical insights into how cities are transforming green space [
45,
46]. This analysis takes on particular value in densely populated urban areas, where traditional mapping techniques often are unable to capture the complex dynamics of land use [
30,
47]. As a result, remote sensing technologies aim to improve understanding of urban ecosystems in increasingly crowded cities.
Integrating remote sensing data through platforms such as Google Earth Engine represents a novel approach to mapping and monitoring urban green spaces using large datasets. In this context, the application of remote sensing analysis focused on the case studies conducted in Indonesian cities. This methodology facilitates rapid and large-scale assessments and allows for detailed temporal comparisons across three different time periods. By using GEE with Sentinel-2 data, remote sensing effectively bridges the gap between data collection and practical insights for urban planning. The implications of mapping urban green spaces are fundamental to informing future urban development strategies.
3. Materials and Methods
This study employed Google Earth Engine (GEE) as a cloud-based platform for processing and analyzing satellite imagery to map and assess urban green spaces in five major Indonesian cities: Central Jakarta, Bandung, Yogyakarta, Surabaya, and Semarang. Sentinel-2 Level-2A imagery was utilized for its high spatial resolution (10–20 m) and spectral bands suitable for vegetation analysis. To quantify and monitor green spaces, two vegetation indices were calculated: the Normalized Difference Vegetation Index (NDVI) and the Enhanced Vegetation Index (EVI). NDVI was used to measure the presence and density of vegetation, leveraging its sensitivity to chlorophyll content, while EVI provided complementary insights by reducing atmospheric and soil reflectance interference, thereby enhancing the detection of dense vegetation areas.
3.1. Sentinel Data
Using remote sensing techniques based on Sentinel-2 data analysis, we were able to extract urban area and green space data. Firstly, the current and relevant image data can be accessed at
https://code.earthengine.google.com/ (accessed on 10 November 2024). After procuring the data, we performed cloud masking, where the Quality Assessment (QA) Band in Landsat and Cloud Probability Layer in Sentinel-2 were used to mask clouds and cloud shadows [
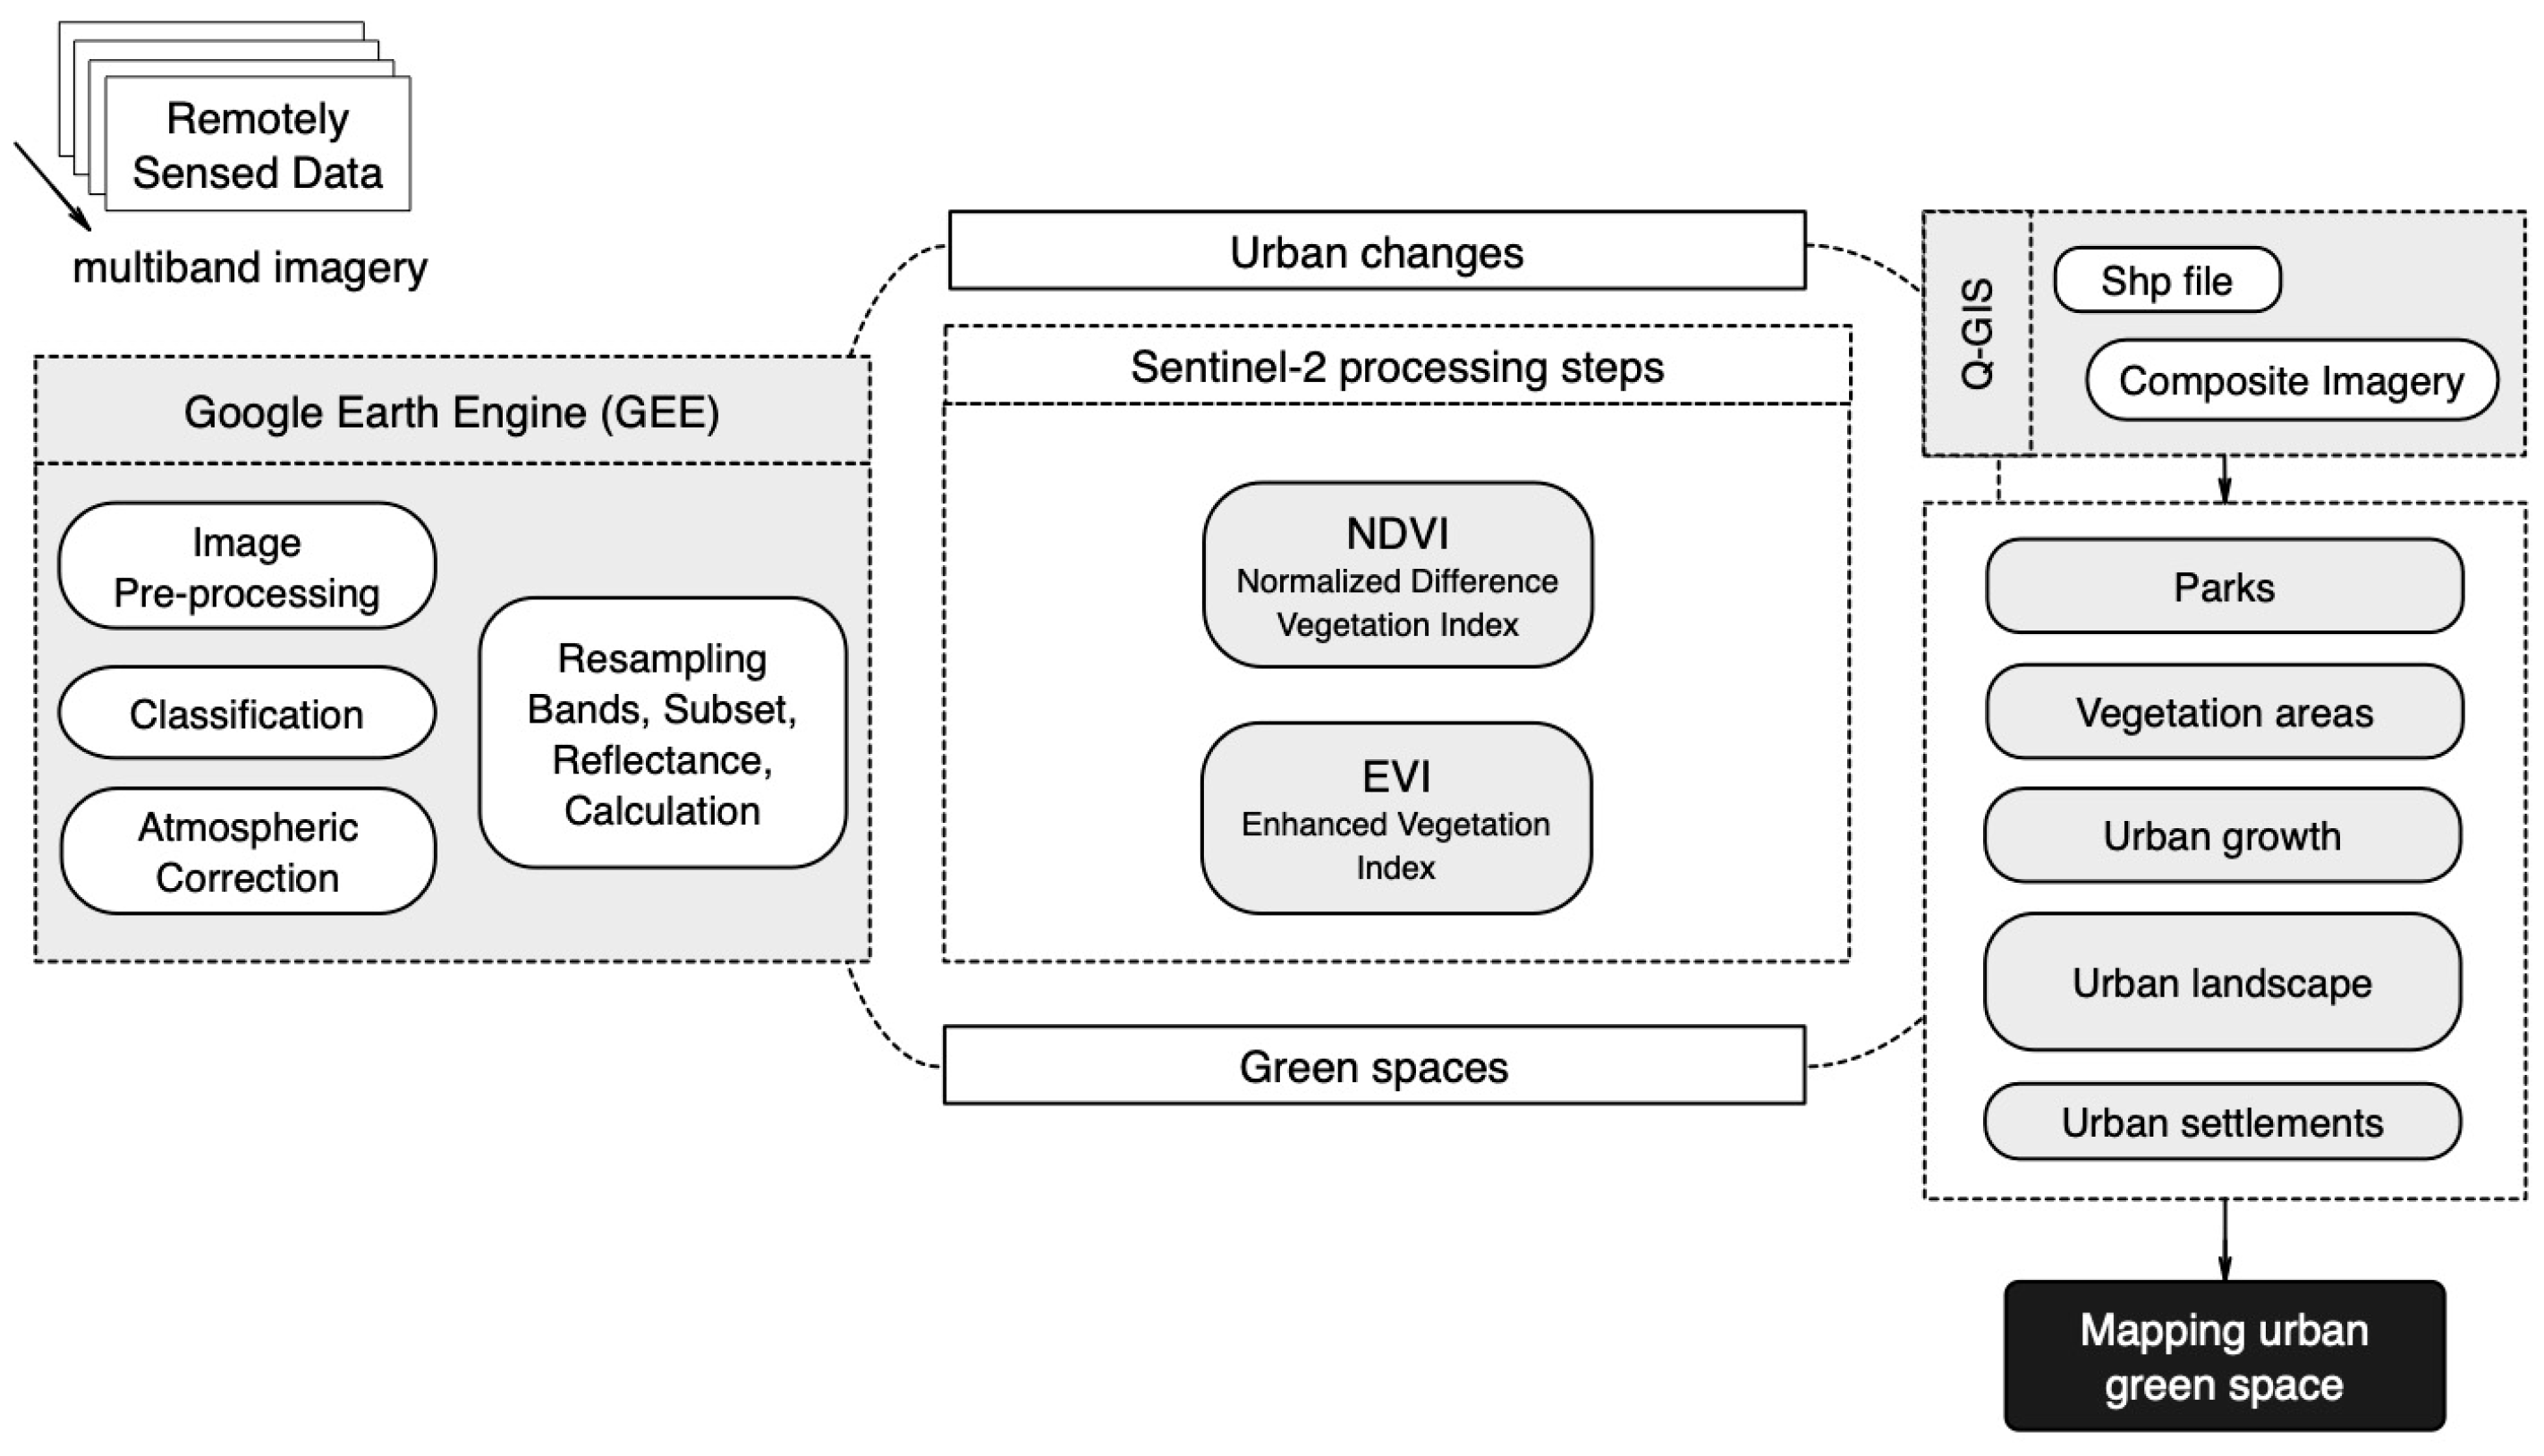
48]. Image calibration and radiometric corrections were applied to ensure consistency across images (e.g., reflectance values are adjusted), and the region of interest (ROI) was defined for each city (Jakarta, Bandung, Yogyakarta, Surabaya, and Semarang) based on administrative boundaries. Furthermore, the Sentinel-2 image product was processed for visualization purposes using Q-GIS for more processed image classification. See
Figure 1 for more details on the data flow analysis.
Figure 1 illustrates the processing steps for mapping urban green spaces using remotely sensed data. Multiband imagery was processed through Google Earth Engine (GEE), which involves preprocessing steps such as classification, atmospheric correction, and resampling (bands, subset, reflectance, and calculations). Sentinel-2 data were then used to derive the Normalized Difference Vegetation Index (NDVI) and Enhanced Vegetation Index (EVI) for analyzing urban changes and green spaces. Outputs included parks, vegetation areas, urban growth, landscapes, and settlements. Q-GIS (3.40) software integrates shapefiles and composite imagery to finalize the analysis. The process ultimately maps urban green spaces to monitor urban growth and sustainability effectively.
3.2. Data Acquisition
The preprocessing steps included filtering images by cloud cover (less than 10%) and temporal selection to align with the dry season (May to September) to ensure consistency in vegetation phenology. The NDVI and EVI values were computed for each city using GEE’s built-in algorithms, and the resulting indices were classified into thresholds to distinguish green spaces from impervious surfaces and other land use types. A spatial analysis was conducted to map the distribution of green spaces and to quantify changes over time. The results were exported to GIS platforms for further visualization and interpretation, with the goal of informing urban planning strategies aimed at enhancing green space conservation and urban sustainability.
Table 1 presents the Sentinel-2 dataset used in this study.
Data were acquired from the Sentinel-2 Multispectral Instrument (MSI) to monitor vegetation dynamics and land cover change. Sentinel-2 data offer high-resolution imagery and are valuable for monitoring vegetation dynamics and land cover changes. The research is limited to data collected from three specific periods: 2019–2020, 2021–2022 and 2023–2024. Although Sentinel-2 became operational in 2015, it focused on discrete periods to better capture inter-annual variability and assess gradual changes over time, particularly in relation to major development projects or environmental policy implementations. Sentinel-2 spatial resolution of 10 m using specific spectral bands: Blue (B2), Green (B3), Red (B4), Near Infrared (NIR, B8), Short-Wave Infrared 1 (SWIR1, B11), and Short-Wave Infrared 2 (SWIR2, B12). Vegetation indices, including NDVI and EVI, were derived from these bands.
3.3. Study Area
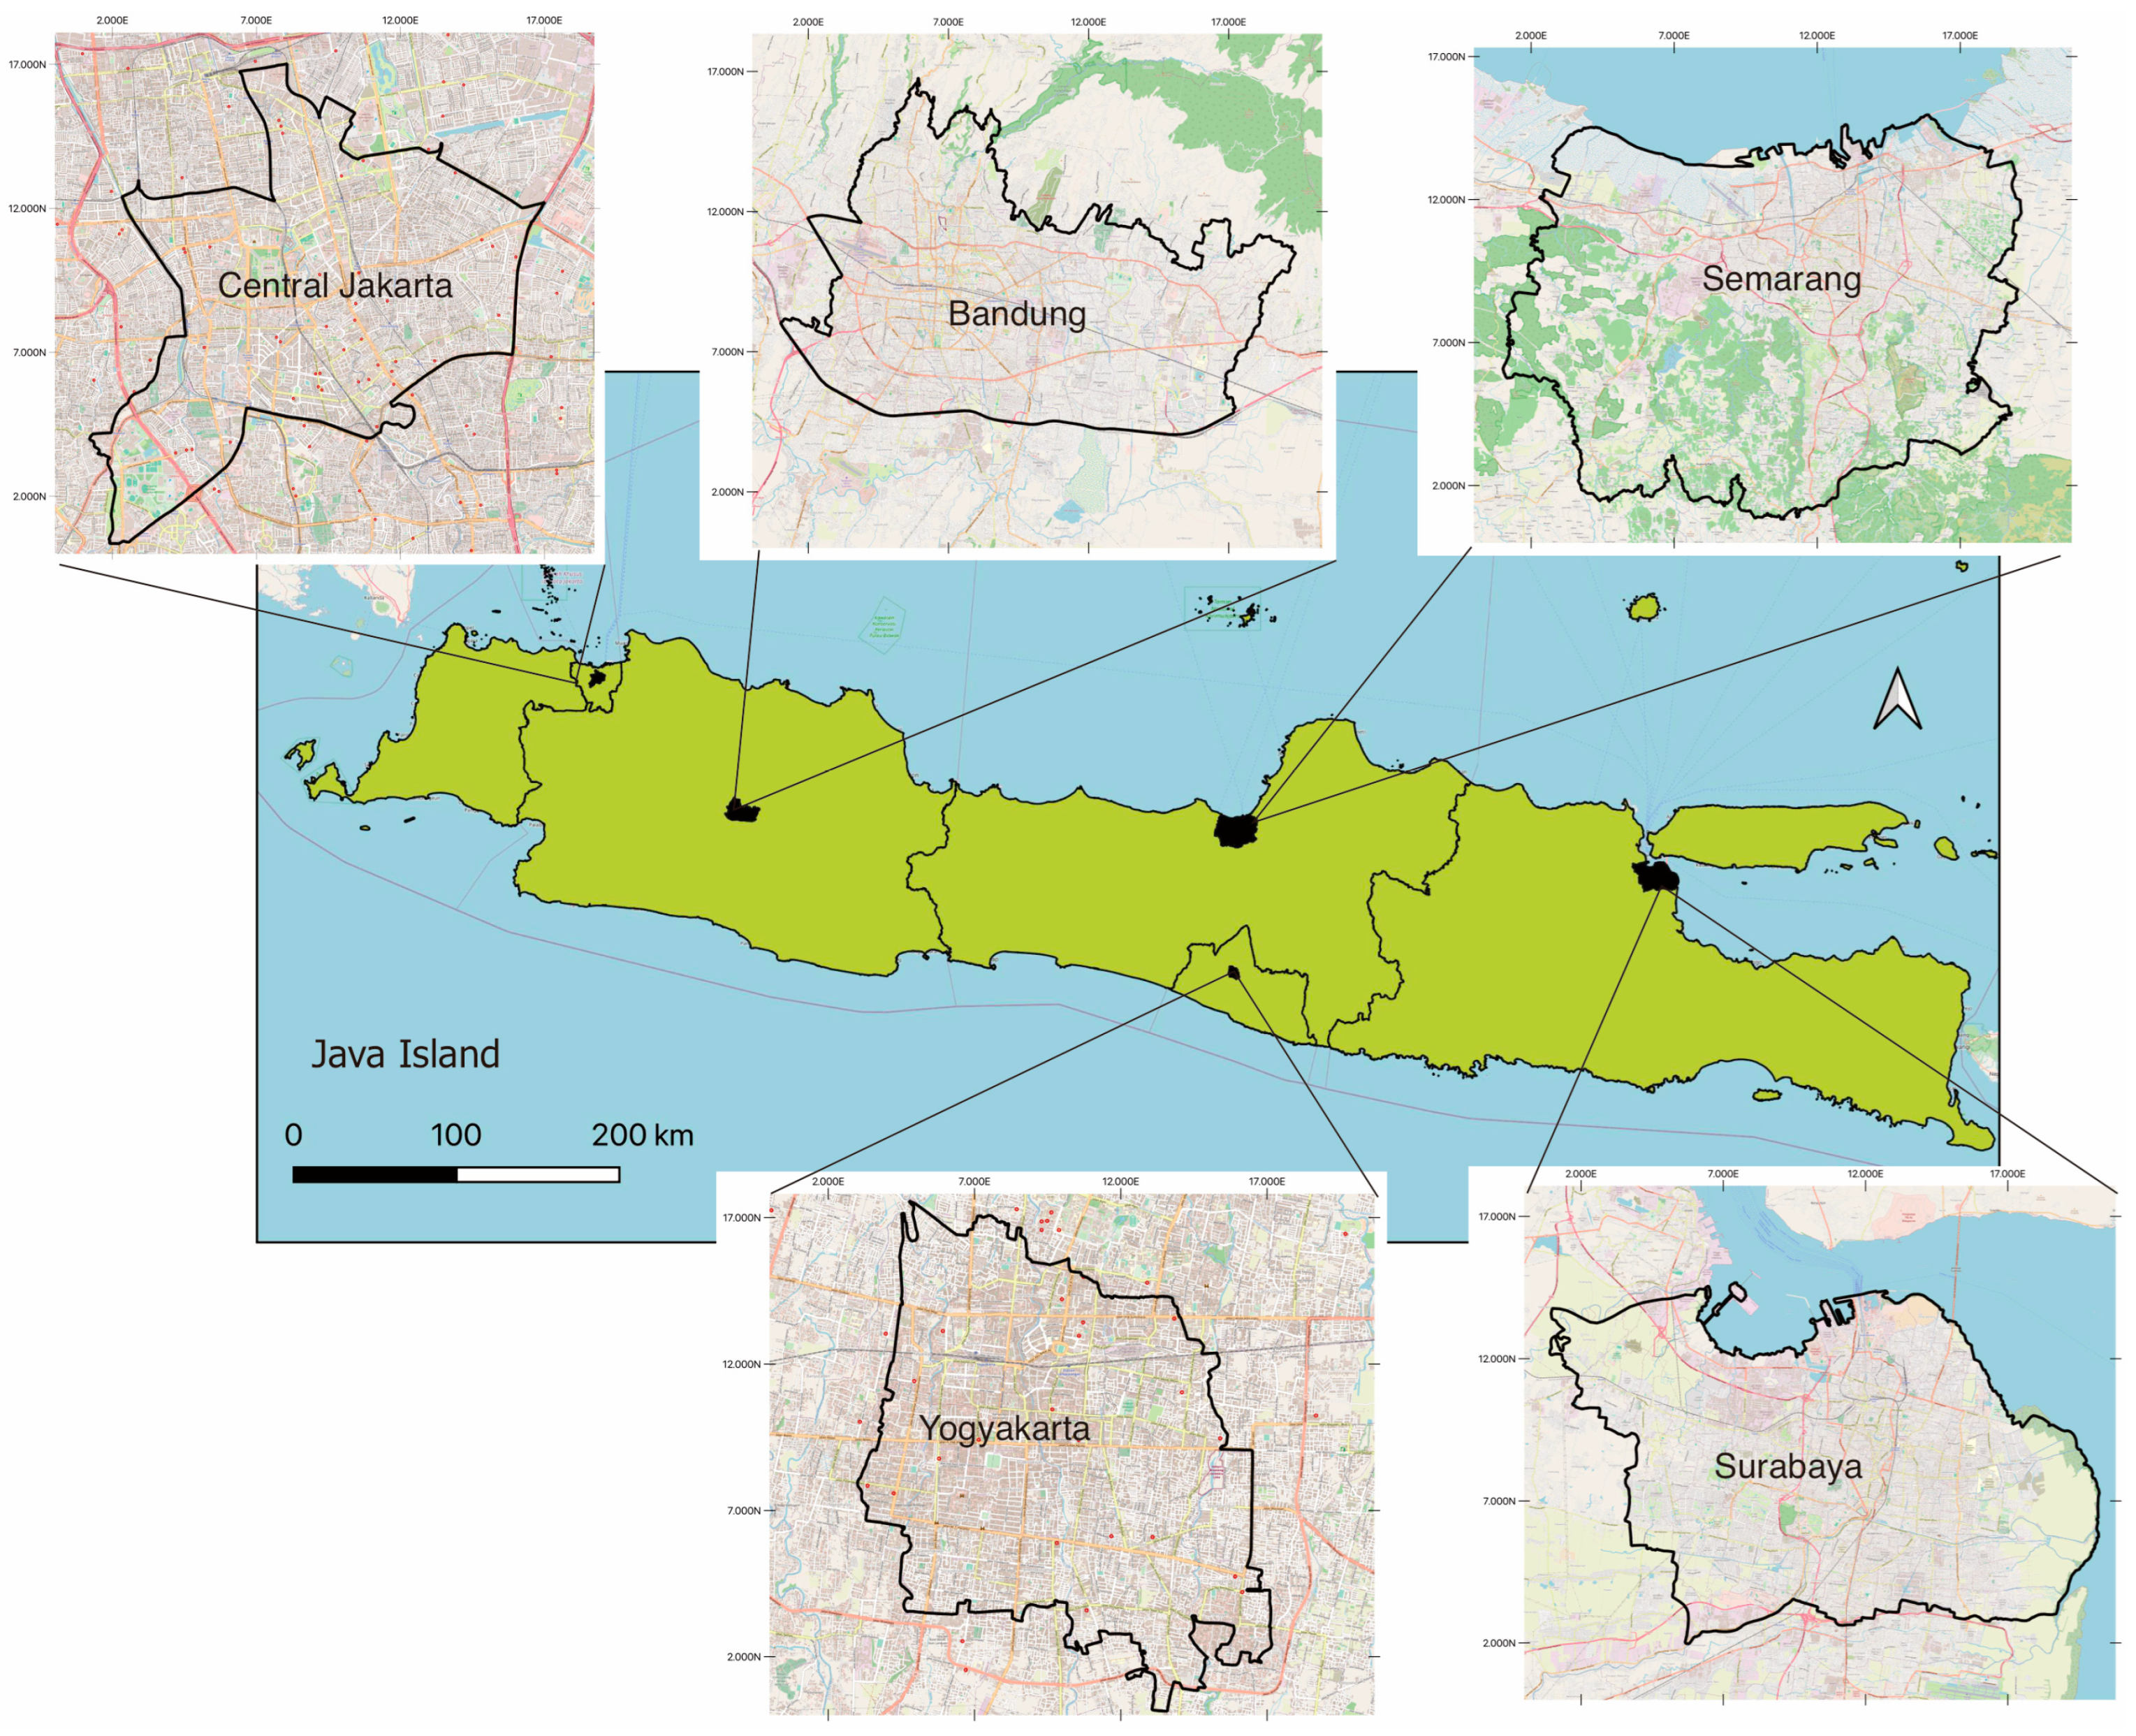
This study focused on five major cities in Indonesia, including Central Jakarta, Bandung, Yogyakarta, Surabaya, and Semarang—all of which are located on Java Island. These cities were selected due to their significant urbanization rates, diverse land use patterns, and varying environmental challenges, making them representative case studies for assessing urban green spaces in rapidly developing urban settings. Central Jakarta experiences extreme urban density, extreme urban density, with a population density of approximately 16,000 people per square kilometer, contributing to limited green space availability [
49]. In 2013, the city’s green open space was only about 4.65% of its total area, which is significantly below the 30% minimum recommended for urban areas [
50].
Bandung, which is known for its historical and cultural significance, is experiencing rapid urban sprawl that threatens its natural landscapes. Yogyakarta, a center of education and tourism, confronts similar pressures on its green spaces due to increasing infrastructure development [
51]. Surabaya, Indonesia’s second-largest city, combines intense industrial activity with coastal dynamics that influence land use patterns. Semarang, another coastal city, deals with challenges such as land subsidence and urban expansion [
52], impacting its green space management. See
Figure 2.
The geographical and socio-economic diversity of these cities provides a comprehensive basis for assessing urban green space distribution and its changes over time. Central Jakarta’s dense urbanization, Bandung’s creative economy, Yogyakarta’s cultural heritage, Surabaya’s industrial focus, and Semarang’s coastal challenges highlight varied urban dynamics. Their selection emphasizes the critical need for sustainable urban planning strategies that consider unique local contexts in Indonesia, ensuring tailored approaches to balance development with environmental preservation and green space management.
3.4. Data Analysis
The data analysis involved processing and interpreting remote sensing data to map and assess urban green spaces in Central Jakarta, Bandung, Yogyakarta, Surabaya, and Semarang. Sentinel-2 imagery, which was processed using GEE, provided high-resolution spectral data for calculating vegetation indices [
2,
18], such as NDVI and EVI. These indices were used to classify land cover and differentiate green spaces from impervious surfaces and other land use types [
23]. NDVI and EVI are used to classify land cover because they effectively highlight vegetation by measuring plant health and density. NDVI detects changes in vegetation, while EVI is less sensitive to atmospheric interference, making both suitable for distinguishing green spaces from impervious surfaces and other land uses [
41,
42,
46]. This study employed threshold-based classification methods to identify areas with varying vegetation densities, categorizing them into distinct classes such as high-density green space, low-density green space, and non-vegetated areas.
Temporal analyses were conducted for three periods (2019–2020, 2021–2022, and 2023–2024) to examine changes in green space coverage over time. Statistical techniques were applied to quantify these changes, including calculating the percentage loss or gain in green spaces within each city. Spatial patterns were analyzed using GIS (3.40) software to identify hotspots of green space reduction and areas where conservation or greening efforts could be prioritized. A comparative analysis between cities provided insights into regional trends and the impact of urbanization on green spaces. The results were visualized through maps, charts, and tables, enabling a clear representation of the dynamics of urban green spaces and supporting recommendations for sustainable urban planning.
4. Results
The remote sensing approaches applied, as well as NDVI and EVI analysis, played a key role in providing accurate comparative data. In addition to detecting vegetation, NDVI and EVI are sensitive to changes in land cover [
43,
44,
53,
54], making them valuable for monitoring urban growth and land use dynamics. NDVI is used for vegetation health and density, while EVI offers improved accuracy in areas with dense vegetation or atmospheric disturbances, providing clearer differentiation between green spaces, impervious surfaces, and other land use types [
47,
55,
56]. Together, these indices enhance the accuracy and reliability of land cover classification, supporting sustainable urban planning and management. These tools highlighted the complex interplay between urbanization and green space management in Central Jakarta, Bandung, Yogyakarta, Surabaya, and Semarang. By using these indices, the research provided a clear picture of how urban areas have evolved over time, revealing the dynamic relationship between built environments and vegetated landscapes. This comparative analysis aligns seamlessly with the overarching purpose of enhancing sustainable urban governance.
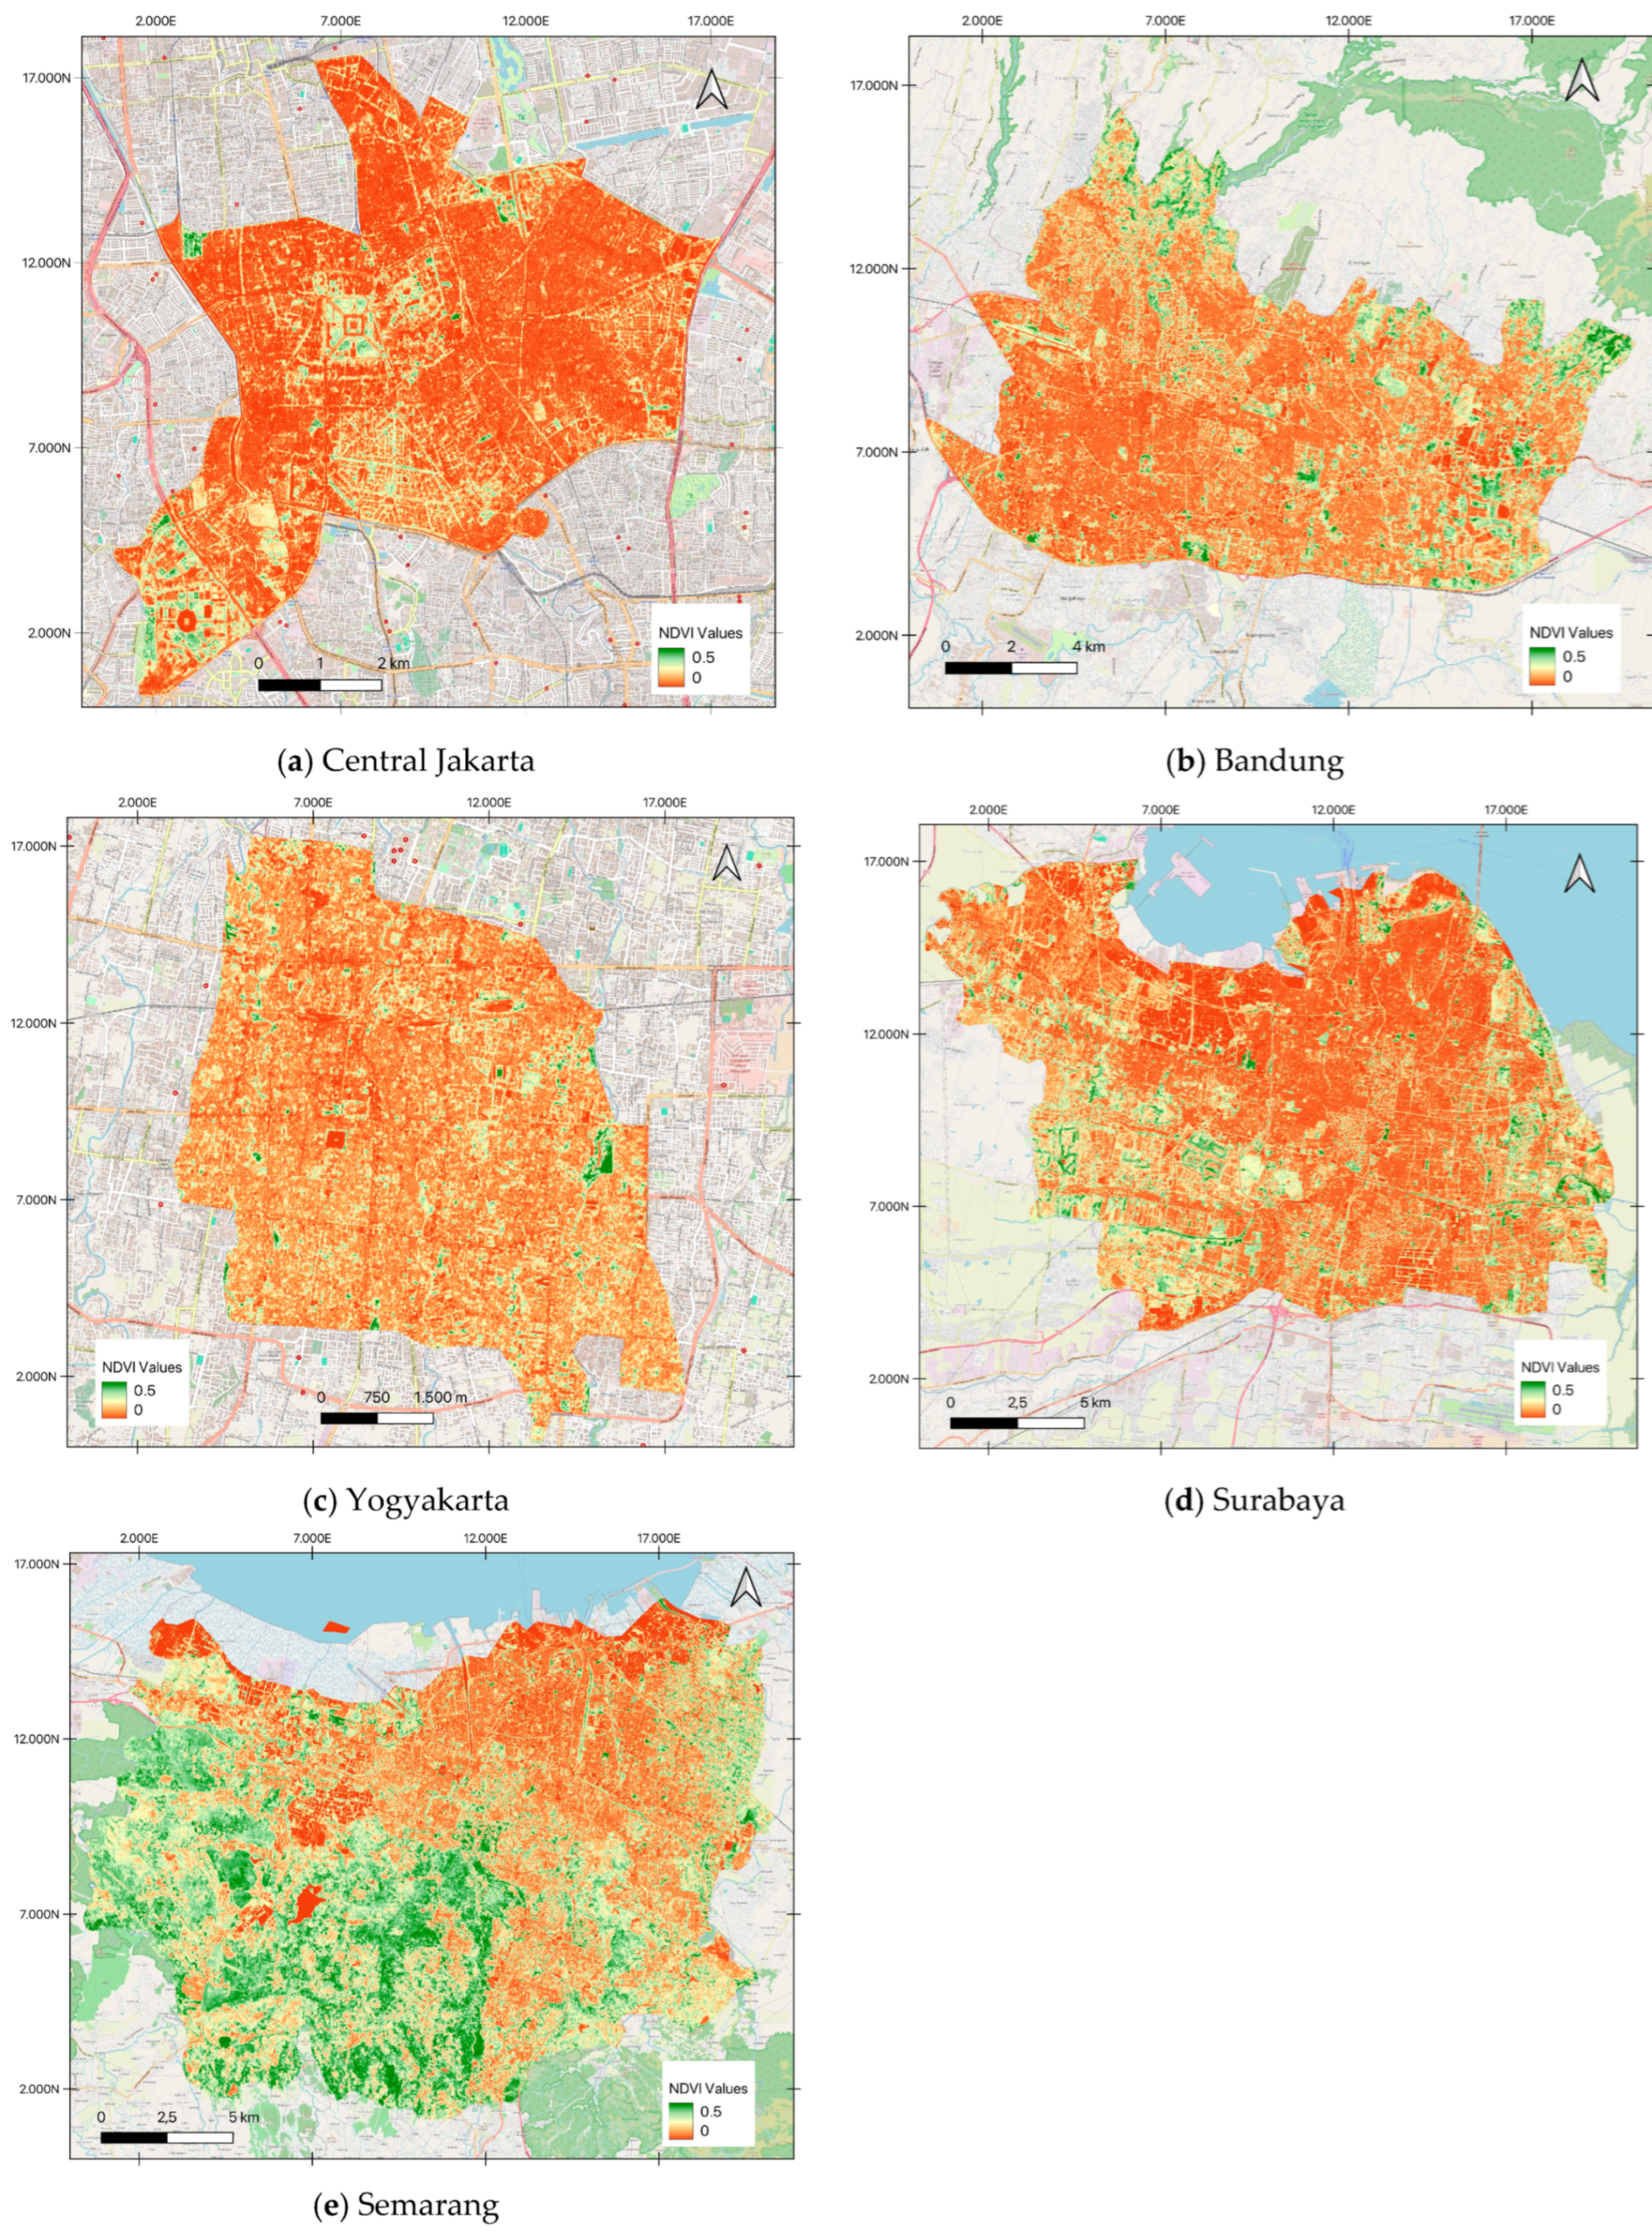
The approach of this study highlights the important role of integrating advanced remote sensing techniques into urban analysis. The combination of NDVI and EVI indices with Sentinel data enabled a nuanced understanding of urban green space dynamics, providing a replicable model for similar studies in other urban contexts. This approach highlights the potential of geospatial technologies to drive evidence-based policy, particularly for cities grappling with rapid urbanization and its environmental impacts. This trend indicates progress in urban planning strategies aimed at increasing green cover, possibly through reforestation, the development of urban parks, or green infrastructure initiatives. The inclusion of NDVI from Sentinel-2 data further enriched this study, providing spatially harmonized and high-resolution insights that capture minute variations in vegetation distribution (see
Figure 3).
The figure presents NDVI imagery data for five cities in Indonesia, including Central Jakarta, Bandung, Yogyakarta, Surabaya, and Semarang. Based on the analysis of urban green space density using Sentinel-2, Central Jakarta shows a highly dense urban environment with minimal green spaces, which is indicative of the city’s role as the capital and economic center of Indonesia, as the infrastructure and buildings dominate the landscape. The Bandung imagery reveals a mix of urban and vegetated areas, reflecting the city’s mountainous geography and status as a more environmentally conscious urban center. Yogyakarta exhibits a balanced blend of urbanized zones and agricultural or green areas, likely reflecting the city’s role as a cultural and academic hub. Further, Surabaya displays significant urban sprawl with some preserved vegetation, particularly in the southern and peripheral regions. Semarang is characterized by a mix of coastal development and inland green areas, demonstrating the challenges of balancing urbanization with environmental preservation.
The urban green areas appear more prominently in Bandung, Surabaya, and Semarang compared to Central Jakarta and Yogyakarta. Bandung’s prominence in terms of green areas can be attributed to its geography and policy focus on preserving its mountainous surroundings [
57]. Because it is situated in a highland region, Bandung benefits from natural vegetation cover and cooler temperatures compared to lowland urban centers [
57]. As coastal cities, Surabaya and Semarang also have mangrove ecosystems along their eastern coasts, particularly in areas that facilitate mangrove ecotourism. Both cities feature mangroves, which not only protect against flooding but also act as carbon sinks, improving air quality and contributing to climate resilience [
57]. Furthermore, the NDVI indicates a higher density of vegetation cover than in Jakarta and Yogyakarta. Increased vegetation can significantly impact the urban heat island phenomenon, which is characterized by localized temperature increases due to urbanization [
42,
58]. Meanwhile, Yogyakarta and Bandung show a more compact urban structure, reflecting their relatively smaller geographic and population sizes. Because they are also inland cities, they highlight a different urbanization style influenced by topography. However, the road networks are prominently visible in all cities, highlighting their connectivity. Central Jakarta and Surabaya, as major urban centers, exhibit more extensive transportation infrastructure.
4.1. Central Jakarta
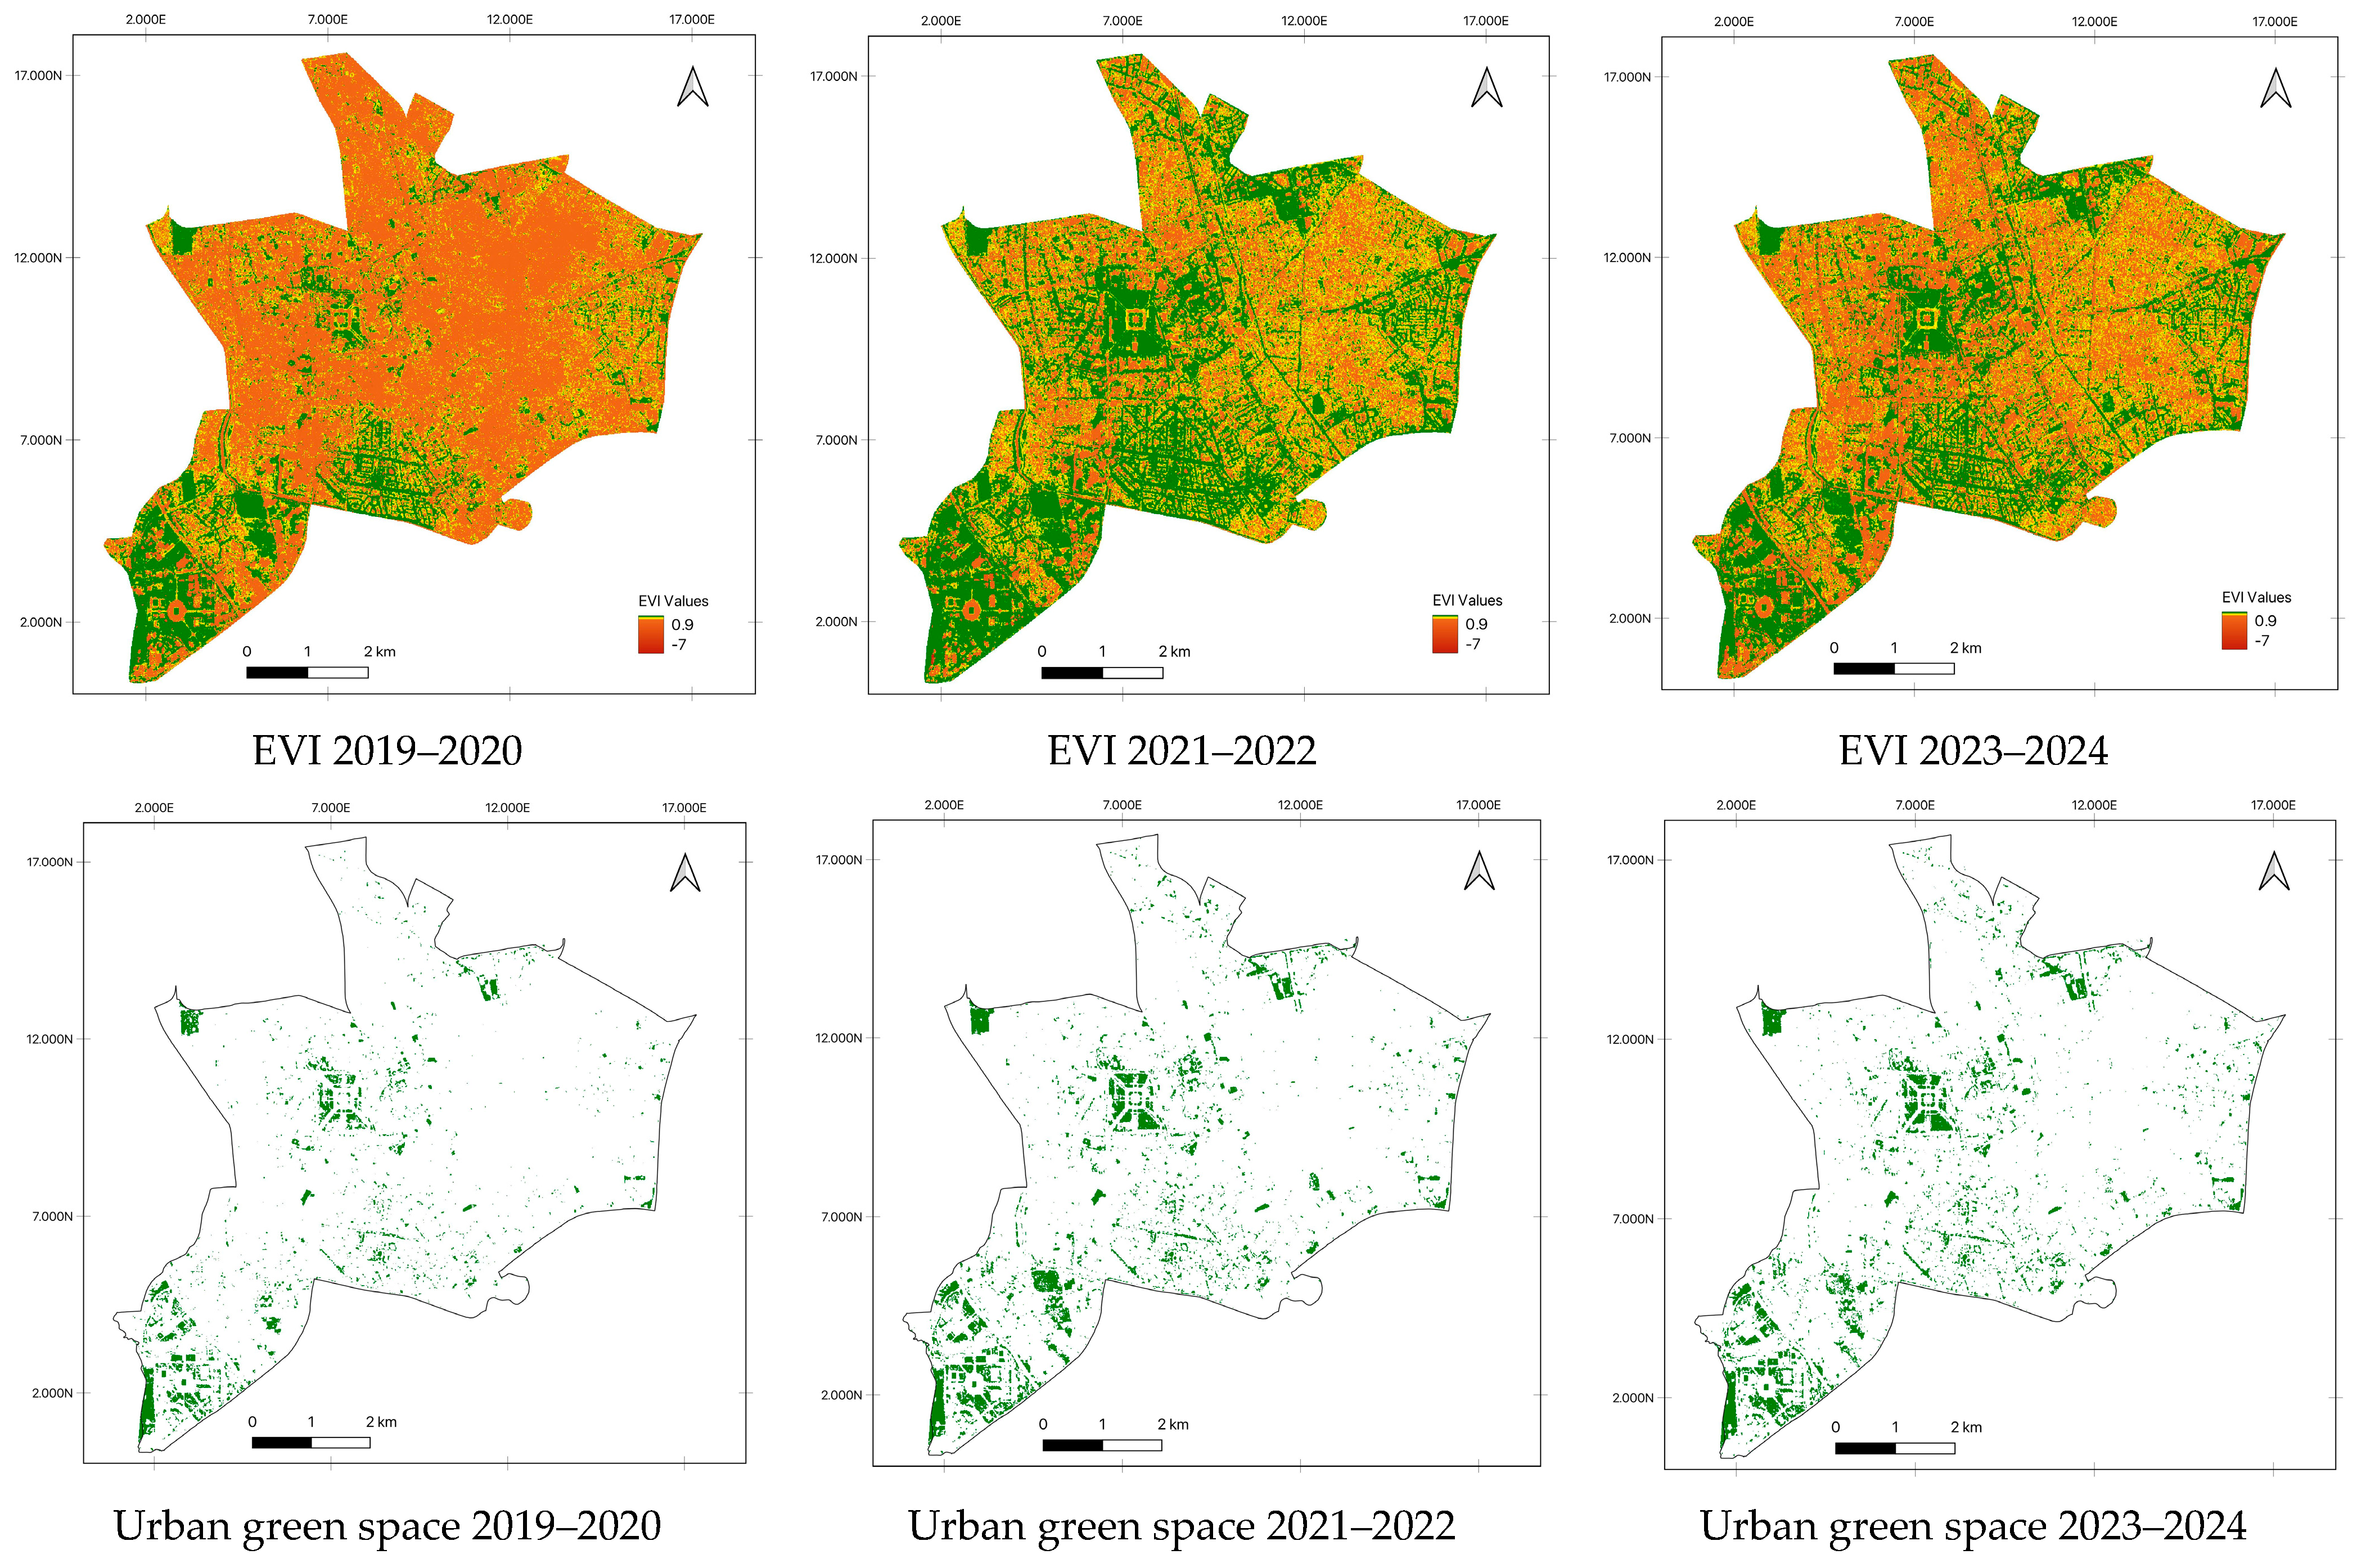
A detailed spatial analysis quantified the total green space area in Central Jakarta City lost over the study period to provide numerical evidence for urban planning decisions. This analysis highlights the critical need for sustainable urban planning to protect and enhance green spaces in Central Jakarta, ensuring long-term environmental impact evaluation.
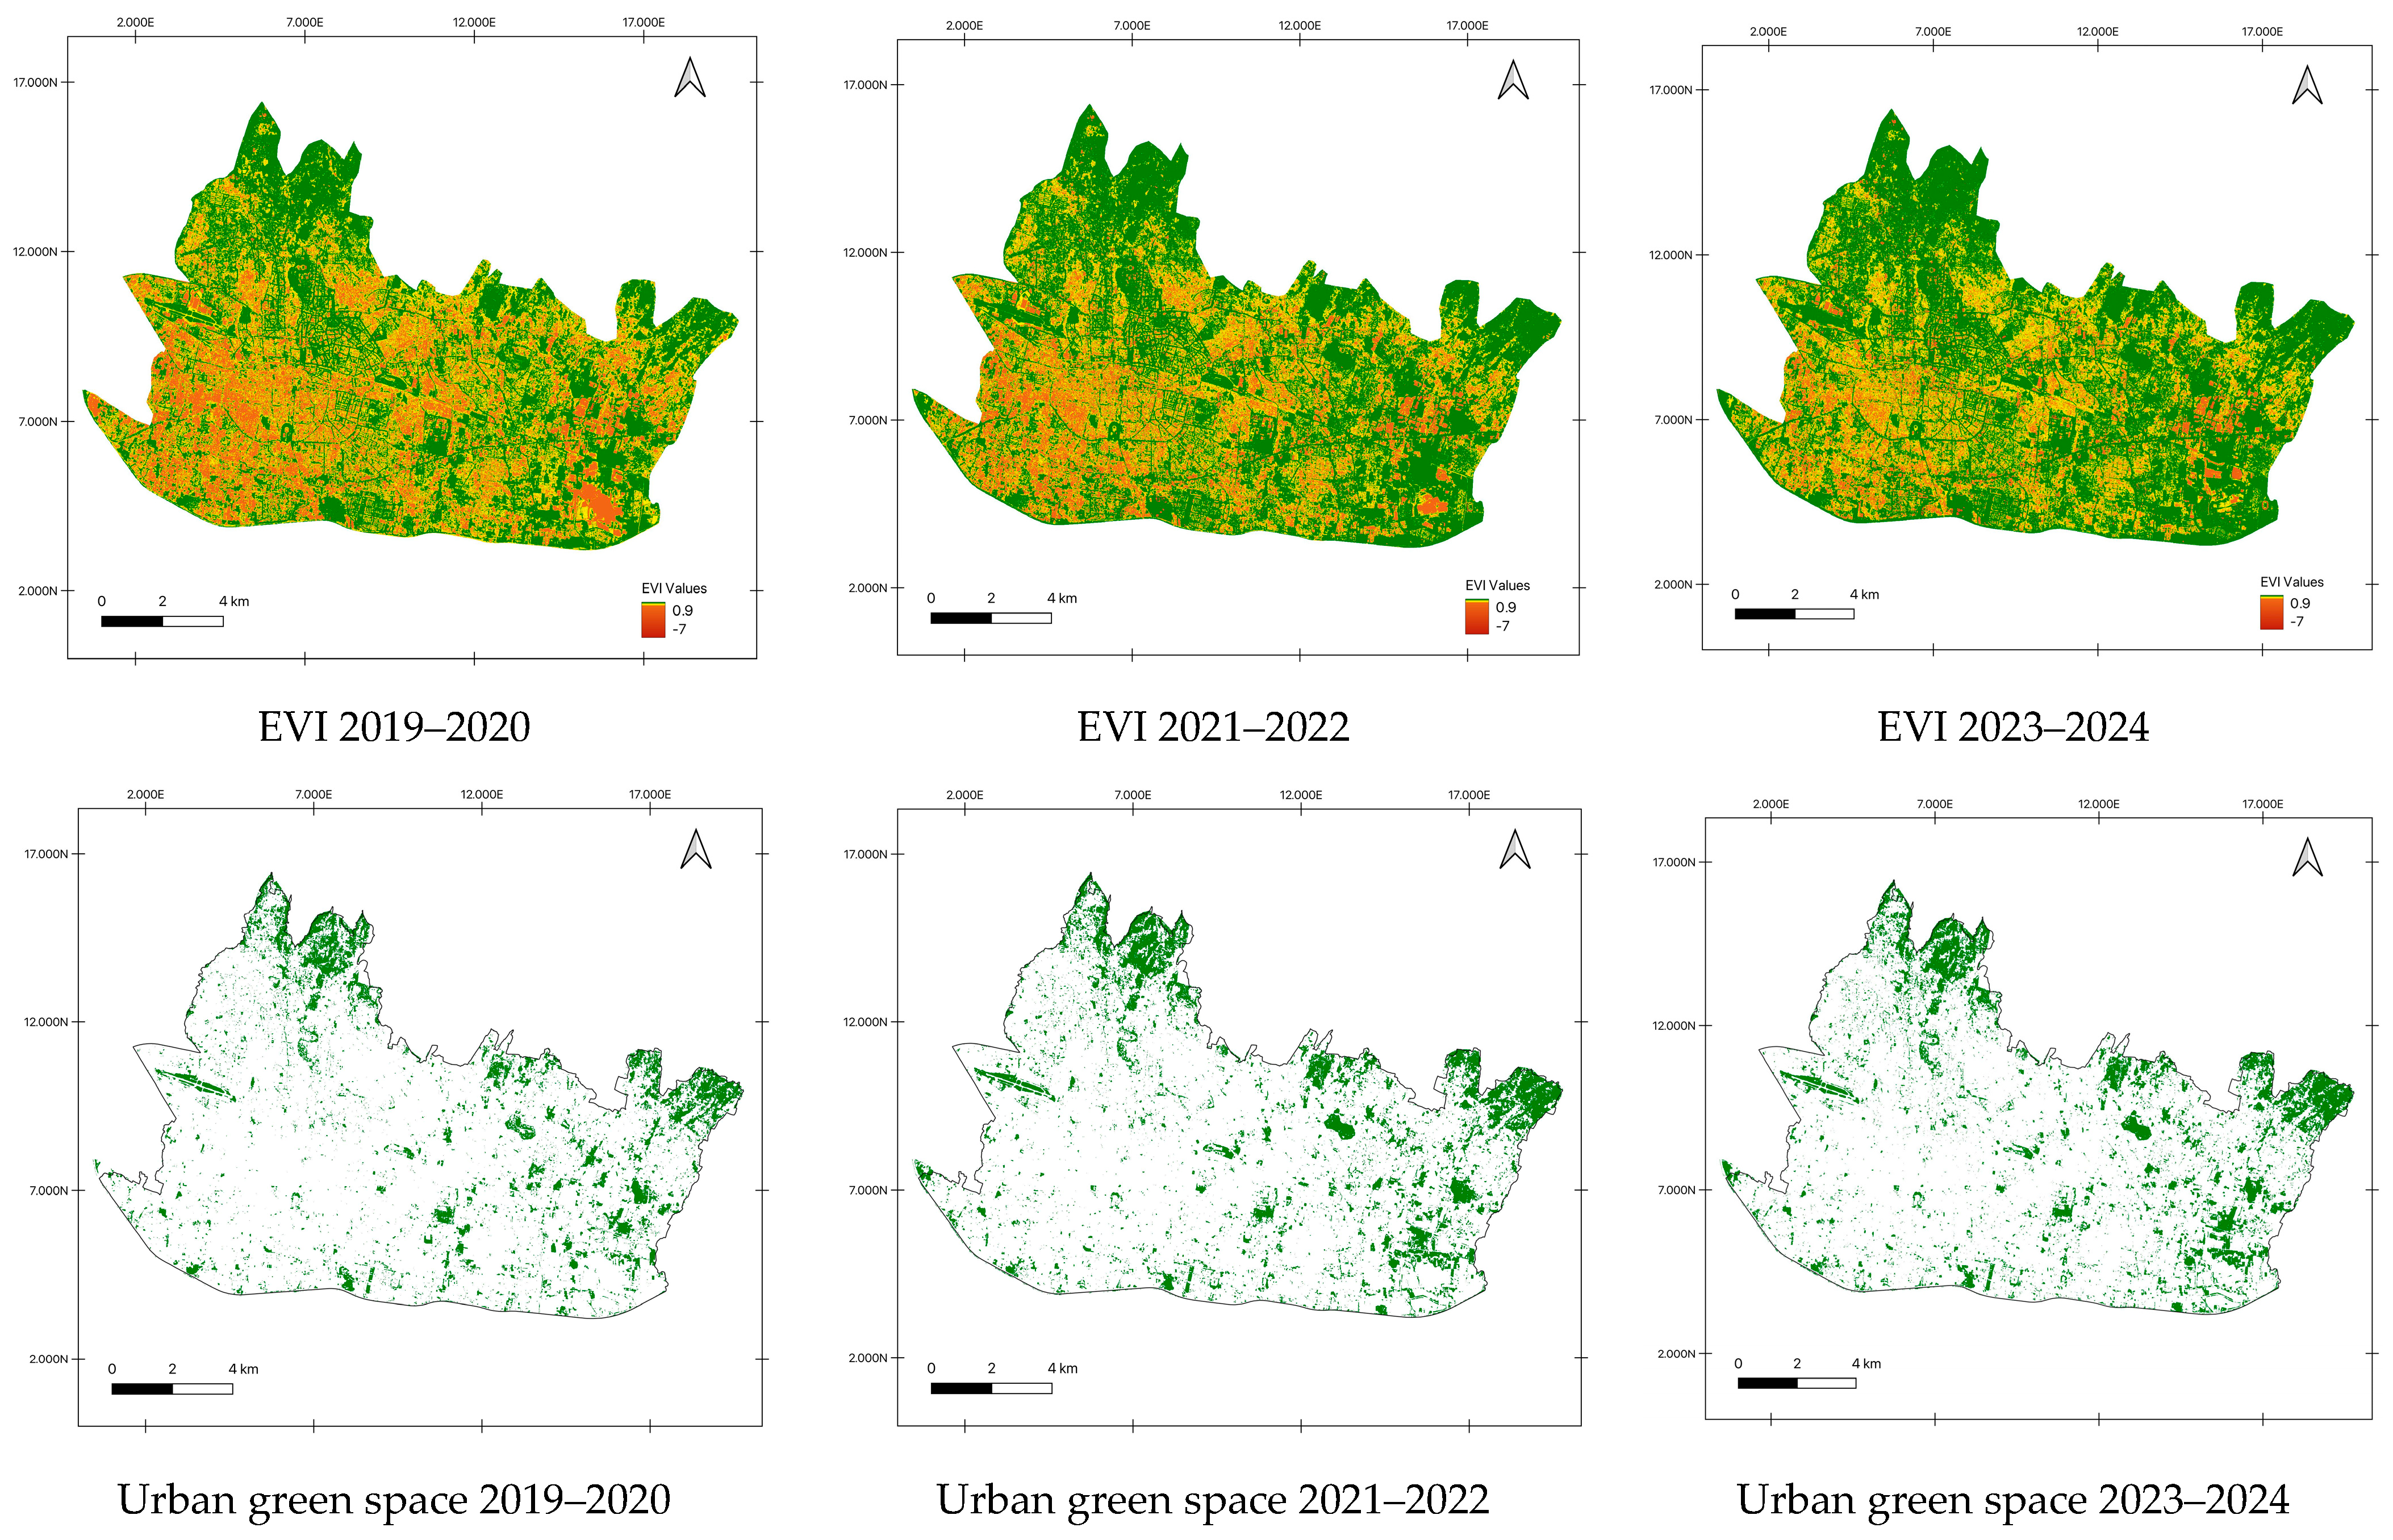
The overall green space data from 2019 to 2020, using EVI analysis, shows widespread green coverage in Central Jakarta. Urban green spaces are relatively fewer and more sparsely distributed. Green spaces tend to cluster around specific areas, such as parks or riverbanks, and these remain somewhat stable across the years, whereas peripheral areas show a decline. The intensity of the yellow-green shades (indicating higher EVI values) decreases over time. This indicates not only a decrease in the quantity of green space but also a potential decline in vegetation health that might be due to pollution, reduced water availability, or urban stresses [
33]. The peripheral areas that initially had moderate vegetation (2019–2020) have improved slightly in visibility over time, but not significantly. However, an increase in EVI-intense areas is noticeable, as visualized in urban green space in 2021–2022; the percentage can be seen in
Figure 4. The trend continues with further fragmentation of green spaces in 2023–2024, with noticeable concentration only in small clusters, such as parks or preserved areas. Urban expansion or infrastructure development may have led to this decrease. In this period, green spaces are more scattered and may indicate reduced vegetation density. The urban core of Central Jakarta has the least amount of green cover in all time periods, reflecting the high density of development in Central Jakarta.
4.2. Bandung City
The figure compares urban green spaces in Bandung City across three periods (2019–2020, 2021–2022, and 2023–2024) using the EVI based on Sentinel-2 satellite data.
Figure 5 presents the EVI, which measures vegetation density and health, enabling a detailed analysis of green space distribution and changes over time.
For the time period of 2019–2020, the EVI map shows extensive vegetation coverage, with significant green areas visible throughout Bandung’s outskirts and some urban regions. In the urban core, green spaces are already showing signs of fragmentation, likely due to urban infrastructure expansion. Urban development appears to have fragmented green spaces, particularly near the city center. However, there is a noticeable increase in green areas in 2021–2024 compared to the previous period. This increase might reflect initiatives like reforestation projects, greening efforts, or improved land management practices. However, the vegetation distribution becomes less uniform, with dense patches interspersed with more fragmented or sparsely vegetated areas, and green spaces become more concentrated in the peripheral regions, with a further decline in urban green zones.
The rebound in green spaces during 2019–2024 is evident in the peripheral areas, suggesting either reforestation or the natural regrowth of vegetation in less developed zones. However, urban zones highlight the challenges of maintaining greenery in high-density regions. The increase in green space is a promising sign of recovery or intervention, but the challenges of fragmentation and uneven vegetation density highlight the need for targeted policies. Strengthening urban greening efforts and maintaining peripheral vegetation can ensure that this positive trend continues while addressing disparities across regions.
4.3. Yogyakarta City
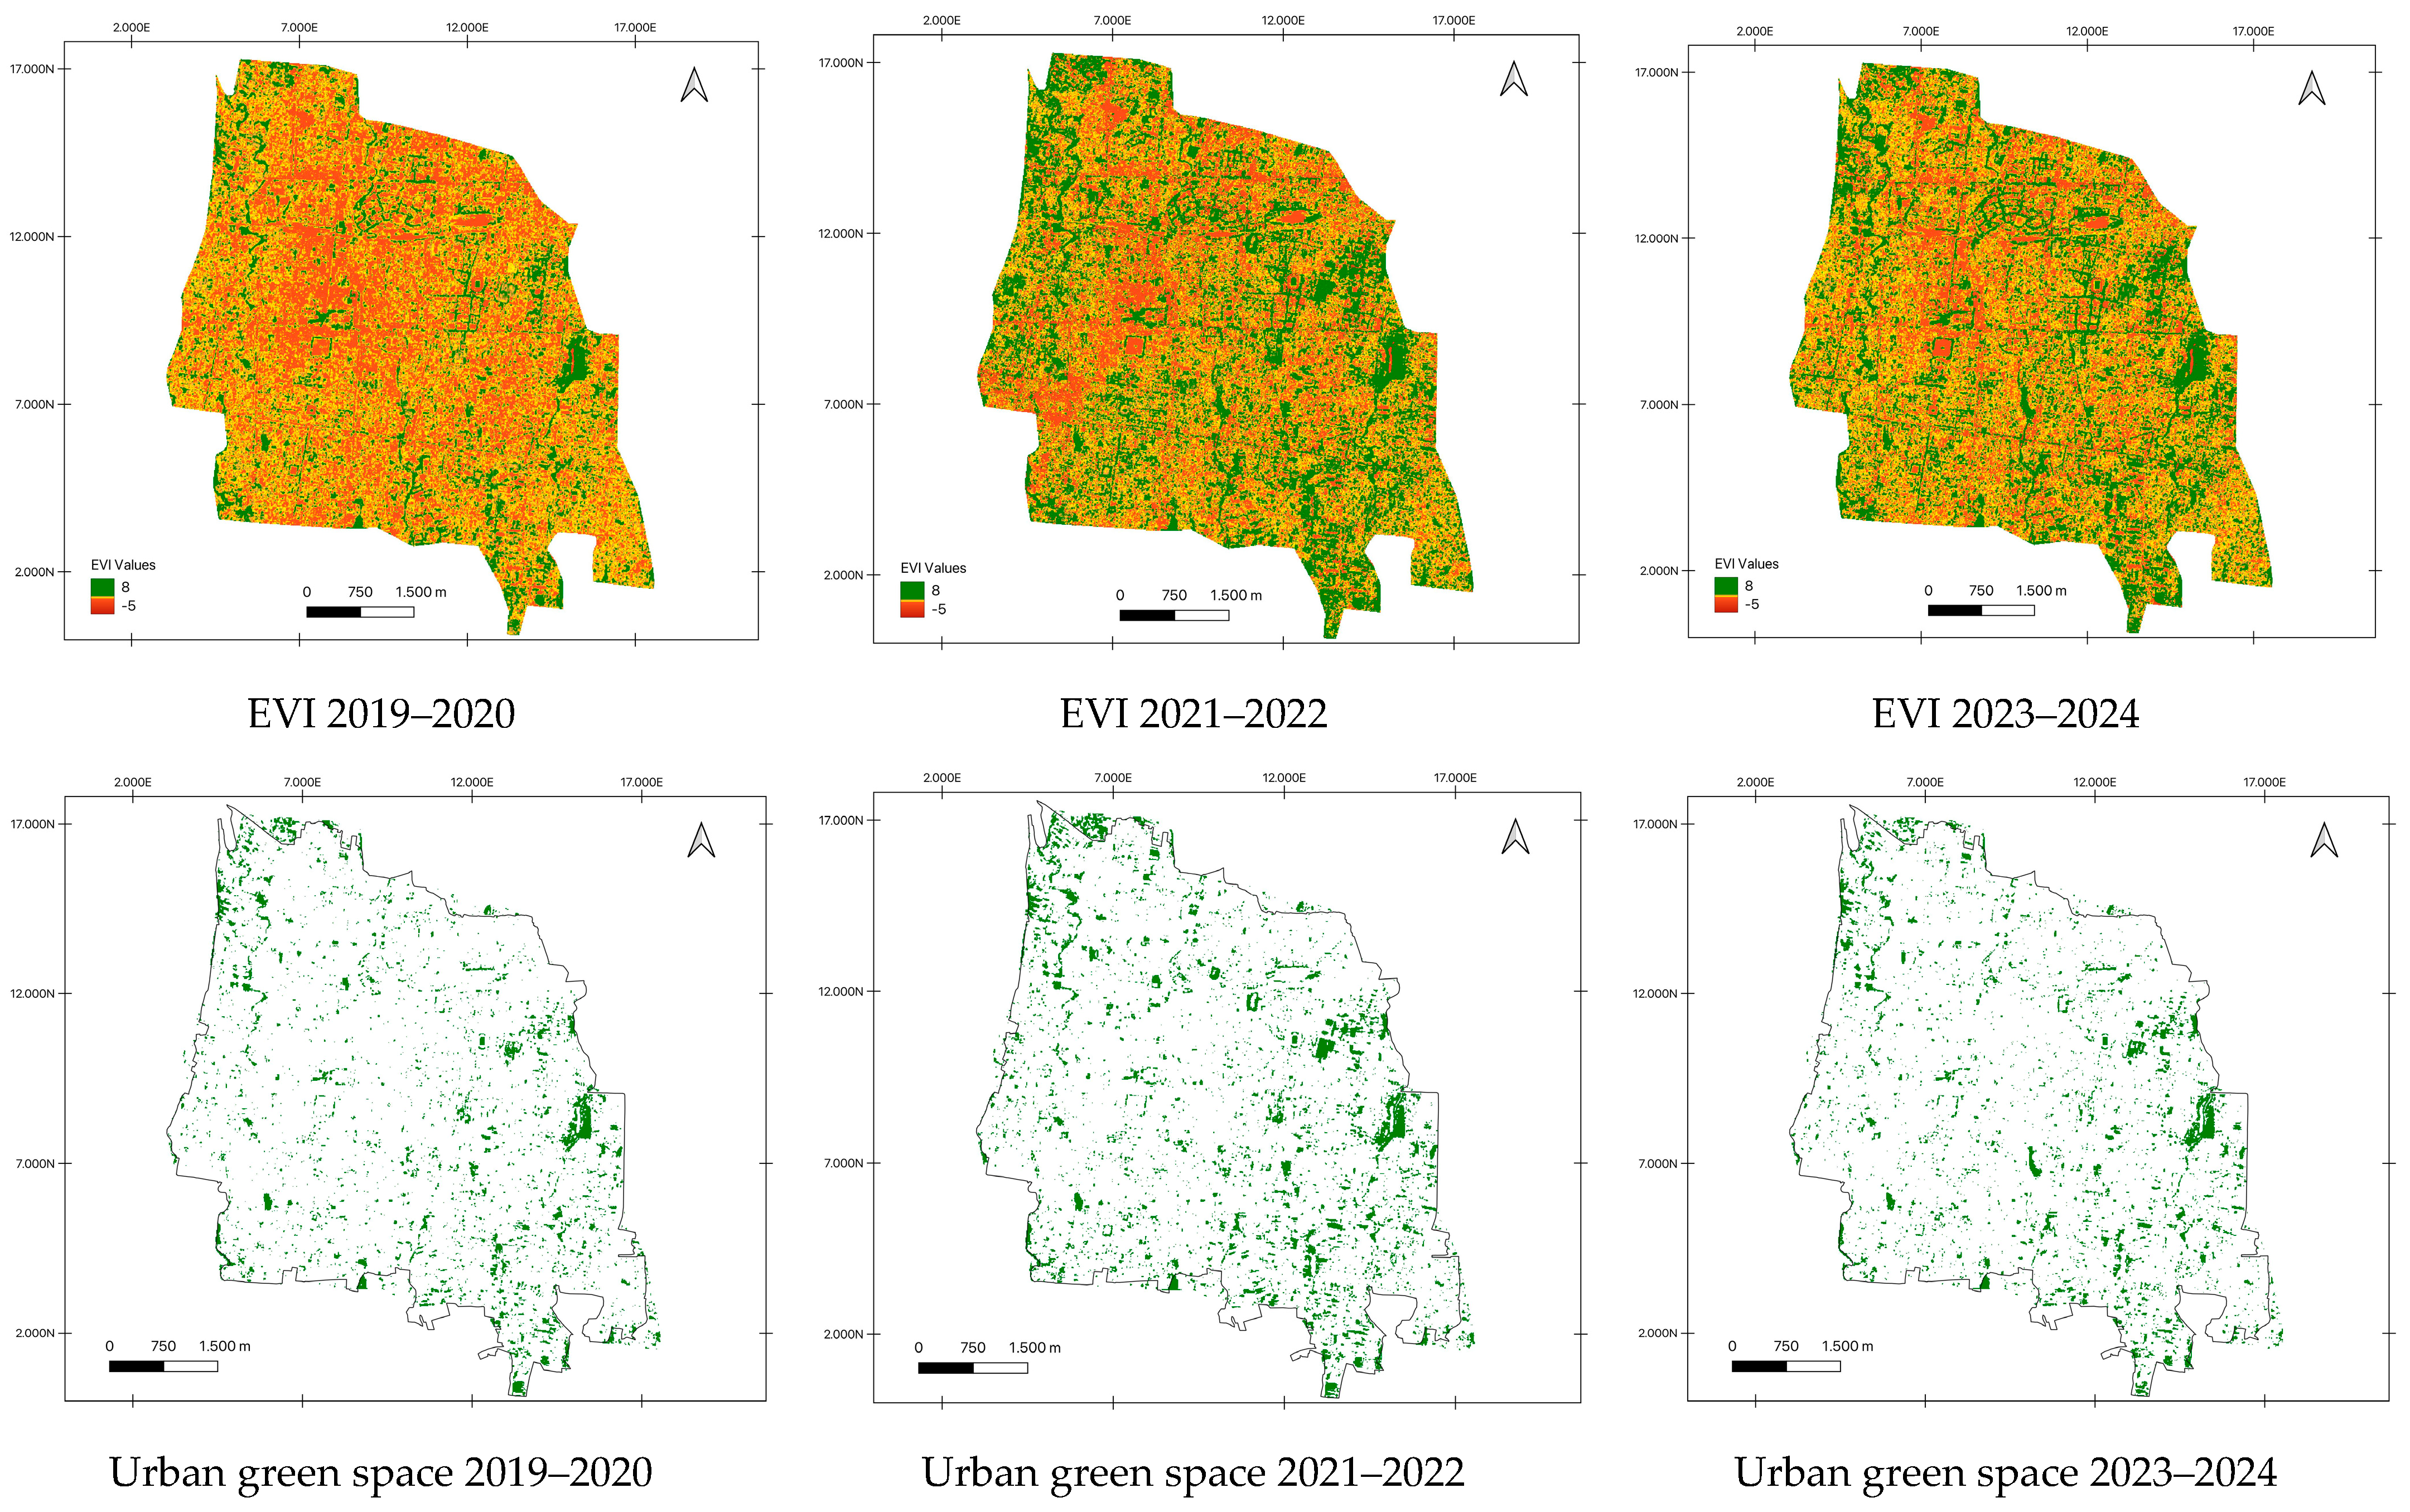
The figure shows a comparison of green areas in Yogyakarta City over three time periods (2019–2020, 2021–2022, and 2023–2024) using the Enhanced Vegetation Index (EVI). The analysis highlights significant changes in urban vegetation, reflecting the impact of urbanization and development trends.
Based on the analysis patterns in
Figure 6, the EVI map in 2019–2020 shows a relatively consistent green coverage across the city, particularly in the northern and central areas. Green areas appear dense and continuous, and urban green spaces are widespread and include larger, more concentrated patches. However, in 2021–2022, there appears to be a slight increase in the intensity of green cover in certain central and peripheral areas, suggesting minor urban expansion or degradation of vegetation. There is a visible decrease in the size and connectivity of green spaces, with more gaps between green patches.
The green coverage appears to be further fragmented in 2023–2024, with a lower overall intensity compared to previous years. This could indicate ongoing urban development and a decrease in green areas. The fragmentation of green spaces intensifies, with smaller, scattered patches dominating the map. This indicates a trend of urbanization significantly impacting the city’s green coverage. In particular, the southern and eastern parts of the city, which also border other regencies, show a progressive reduction in green areas, in line with patterns of urban sprawl. As the population in Yogyakarta and surrounding regencies continues to grow, the demand for residential and commercial spaces has escalated. This growth exerts pressure on green areas, with many being converted to urban uses.
These findings emphasize the need for sustainable urban planning that incorporates green space preservation. Efforts to balance economic development with environmental sustainability, such as creating urban parks and green roofs and enforcing zoning regulations, could mitigate the impact of ongoing urbanization. This comparison effectively visualizes the pressures of urbanization on green spaces and highlights the importance of monitoring tools such as EVI to inform policy and planning decisions.
4.4. Surabaya City
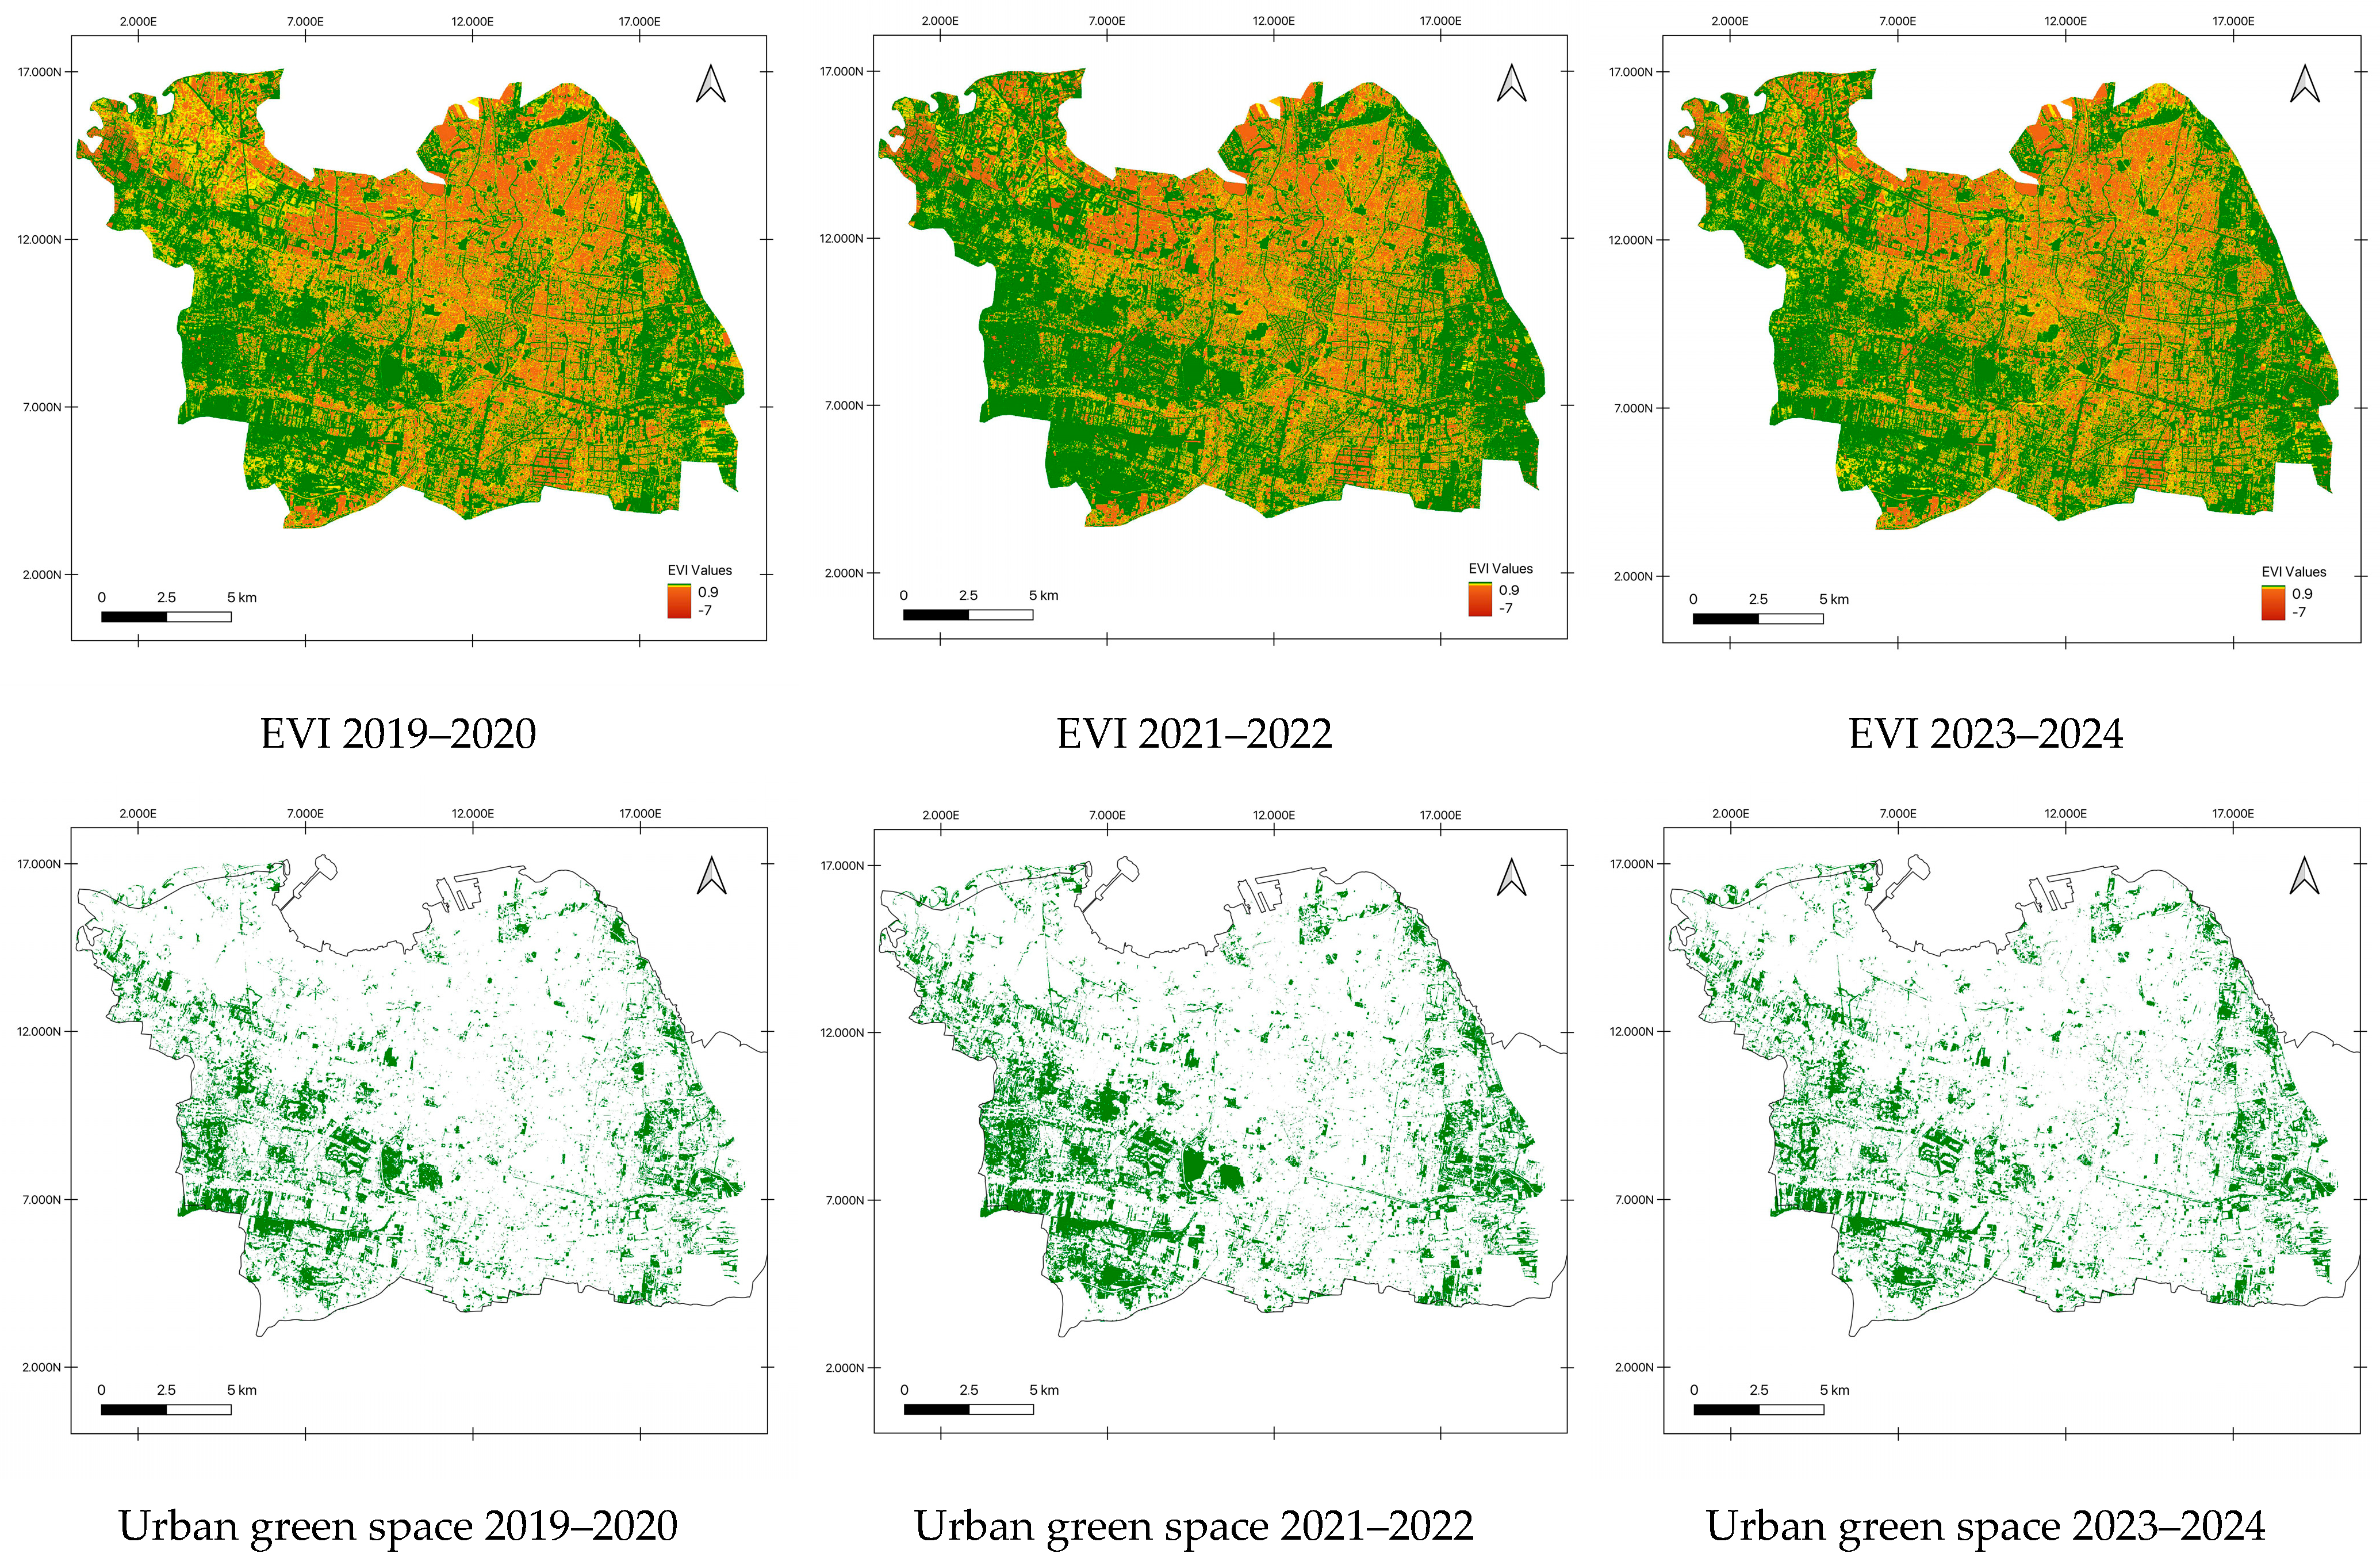
The figure shows a comparative analysis of the urban green space in Surabaya City over three periods: 2019–2020, 2021–2022, and 2023–2024. The Enhanced Vegetation Index (EVI) has been used to detect and map the changes in green areas, which highlights the trends in vegetation coverage in the city.
During 2019–2020, based on the EVI approach, Surabaya showed widespread vegetation, with a substantial green cover across the urban area, as shown in
Figure 7. The detailed urban green spaces, particularly in densely built-up areas, are shown to have decreased significantly. Peripheral areas still retain some green spaces, but their density appears to be steadily decreasing over time. There was also a moderate increase in vegetation in 2021–2022 compared to 2019–2020. The green area seems to be more concentrated in the periphery than in the urban core, indicating an expansion of green urban areas or an increase in green areas in central areas. Despite efforts to maintain parks and green spaces, these data reflect the challenges of balancing green spaces with economic and urban development purposes.
By 2023–2024, however, there is a reduction in green space, with urban development leading to a reduction in vegetation cover. Green areas are more fragmented, particularly in the central and northern parts of the city. The reduction in green space is in line with the ongoing urbanization of Surabaya, which is a fast-growing metropolitan center in Indonesia. The city’s expansion has been driven by increasing population, industrial growth, and infrastructure development projects [
59], resulting in the conversion of natural green areas into residential, commercial, and industrial zones. The encroachment of open space for residential and commercial purposes is likely to be a significant factor in the declining vegetation index. Surabaya has also been known for its initiatives to promote urban greenery, such as the development of parks and urban forests. However, the data suggest that these efforts may not be sufficient to offset the loss caused by rapid development. Strengthening land use regulations and incentivizing green buildings could contribute to addressing these challenges. This analysis highlights the ongoing struggle to maintain urban greenery in rapidly developing cities and demonstrates the need for stronger policy measures and community involvement.
4.5. Semarang City
The figure illustrates the changes in urban green space in Semarang City over three time periods (2019–2020, 2021–2022, and 2023–2024), using the Enhanced Vegetation Index (EVI) to monitor vegetation cover. Below is an analysis and discussion of these patterns contextualized with Semarang’s urban development.
The EVI maps for 2019–2020, as shown in
Figure 8, demonstrate significant green spaces across Semarang, with dense vegetation concentrated in the southern parts and around the urban periphery. Urban green spaces are widely distributed, with relatively dense and continuous coverage in both central and peripheral regions. In 2021–2022, a slight reduction in vegetation is observed compared to the earlier period. The loss seems concentrated in the city center and in areas close to coastal regions. There is a visible reduction in the density and connectivity of green spaces in developed areas, although some peripheral green spaces remain intact. Meanwhile, in 2023–2024, a further reduction of green areas was observed. The vegetation index indicates significant urbanization in central areas and reduced green cover in some peripheral areas. Urban green spaces are more fragmented, with noticeable losses in regions undergoing industrial or residential expansion.
In fact, Semarang, a major coastal city in Indonesia, has faced significant urban growth in recent years. This expansion has been driven by industrialization, infrastructure development, and population growth. This expansion has been mainly spurred by economic decentralization since 2001, leading to the establishment of numerous industrial zones and significant infrastructure projects (initiated in 2019) [
58,
60]. As a result, green spaces near industrial areas and densely populated urban centers have been considerably reduced. Another challenge for Semarang is land subsidence and coastal flooding, which has been exacerbated by rapid urbanization and the conversion of vegetated areas to impervious surfaces. The reduction in green space is likely to affect the city’s ability to mitigate flood risks through natural drainage and absorption systems. The decrease in urban green spaces has a negative impact on air quality and the urban heat island effect. With increasing urban sprawl, the remaining green spaces are under pressure, making sustainable urban planning an urgent priority. Semarang’s urban development has led to a decline in green spaces over time, as shown in the EVI and urban green space maps. Sustainable urban planning and the preservation of vegetation are crucial to balancing development and environmental health.
From this analysis, remote sensing data are potentially applicable in terms of urban planning and monitoring. The insights from these images can guide sustainable urban development, balancing infrastructure needs with green space preservation. In this context, environmental monitoring using remotely sensed data refers to identifying areas requiring afforestation or conservation to mitigate urban heat effects. Likely, variability in vegetation cover and urban density indicates the need for city-specific planning approaches. This includes the environmental pressure from urban expansion in the studied cities, which could demand stricter land use policies. In detail, the quantitative comparison between the total urban area and the green areas in the study areas can be seen in
Figure 9.
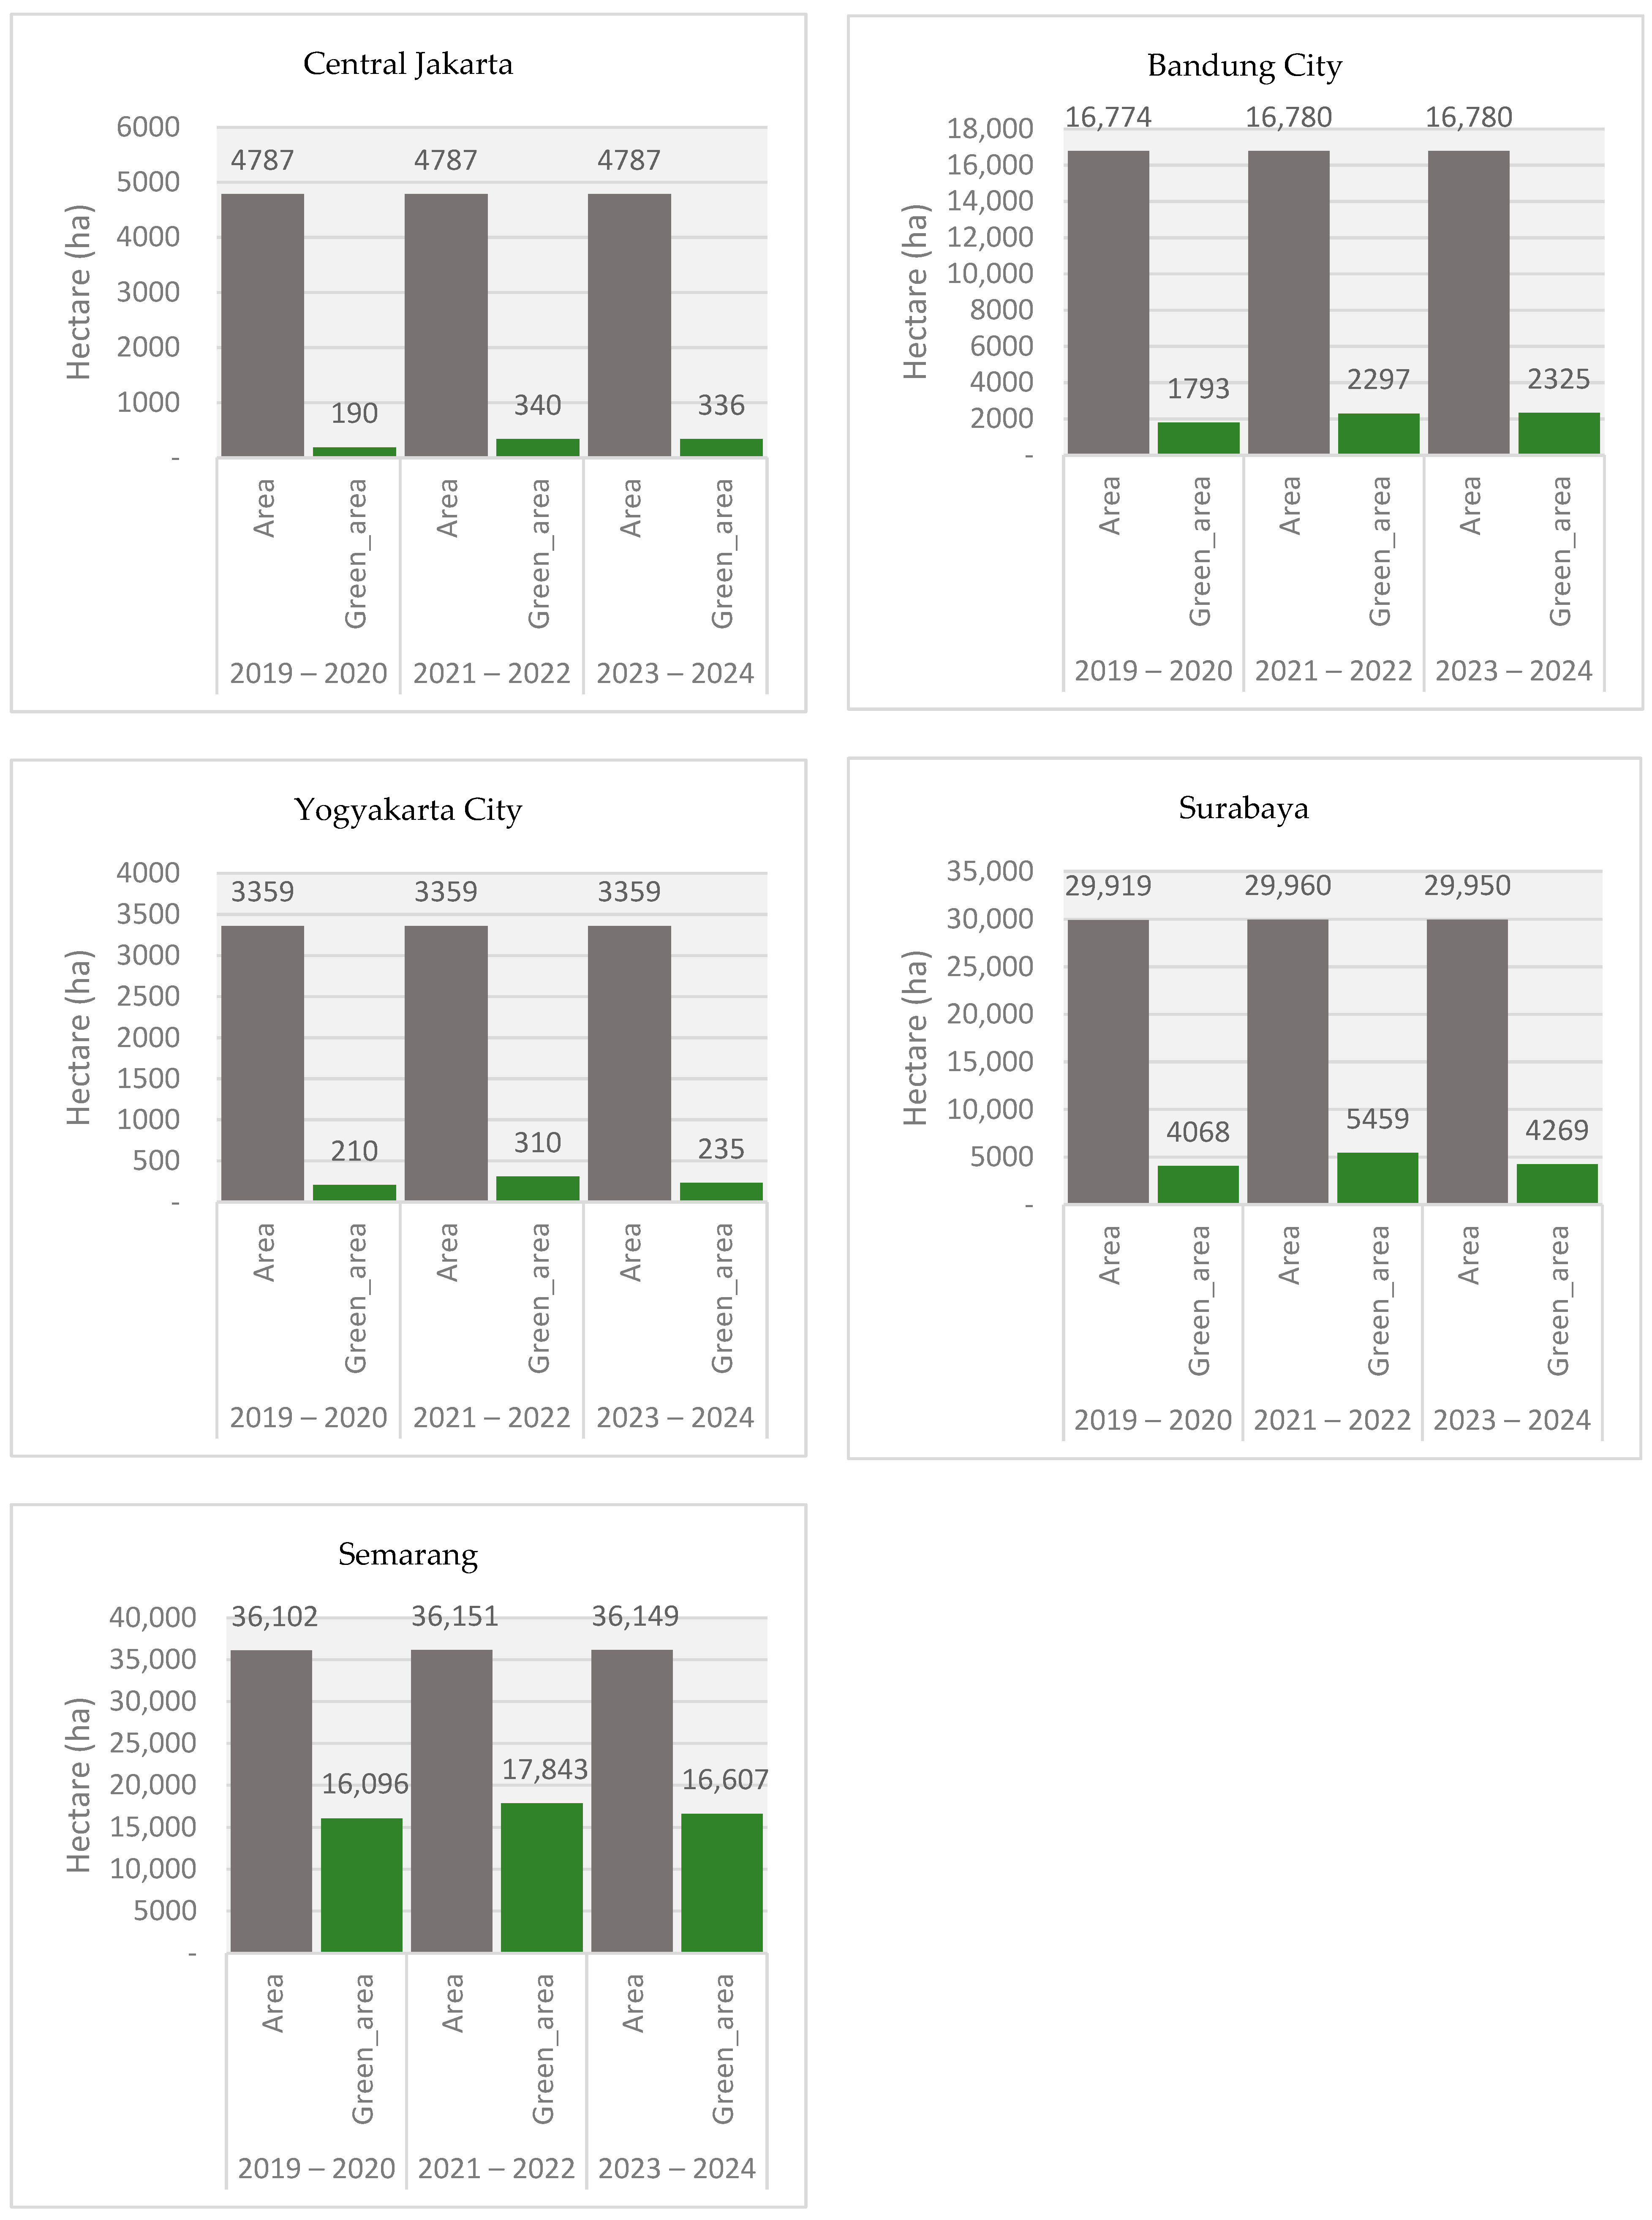
This figure shows a quantitative comparison between the total urban area and green areas (measured in hectares) for five cities, including Central Jakarta, Bandung, Yogyakarta, Surabaya, and Semarang, over three time periods: 2019–2020, 2021–2022, and 2023–2024. The data show changes in green space coverage relative to the total urban area. In Central Jakarta, the increase from 190 ha to 340 ha reflects efforts to increase green areas between 2019 and 2022. However, the slight decrease in green areas by 2024 indicates challenges in maintaining or expanding green areas within the dense urban core. Bandung shows consistent progress in green space development, with a significant increase (around 532 ha) between 2019 and 2024. This indicates a continued commitment to integrating green infrastructure alongside urban growth.
In the case of Yogyakarta, an increase in green areas from 2019 to 2022 reflects efforts likely driven by regional government programs focused on sustainable urbanization, such as the ‘Jogja Hijau’ initiative [
59,
61], which aims to create more community-based green spaces and urban forests. However, the decrease in green areas by 2024 may indicate competing priorities, such as urban expansion due to growing population demands and infrastructure projects. As it relates to the Special Region of Yogyakarta Development Plan (2022), tourism infrastructure was prioritized, potentially diverting resources from green space conservation. While Surabaya experienced an increase in green areas from 2019 to 2022, the sharp decrease by 2024—equivalent to a loss of about 1190 hectares—can be attributed to accelerated urban development, especially in industrial zones and residential complexes [
61]. Semarang initially increased its green area by 1747 ha between 2019 and 2022, partly due to policies such as the Green City Development Program and the Mangrove Rehabilitation Project along its coastline [
58]. However, much of the loss of green areas could be attributed to land conversion for housing developments and toll road projects [
60], which impacted coastal and urban green spaces.
5. Discussion
The results of this study demonstrate that Sentinel-2 data are a critical tool for monitoring urban green spaces, particularly in rapidly urbanizing contexts such as Indonesia. By quantifying vegetation change, this research highlights opportunities for competing land use priorities, requiring more inclusive urban policies. In addition, this study’s model shows that Sentinel-2 data are particularly effective for analyzing environmental conditions in rapidly developing urban areas [
30,
37,
44]. As shown in
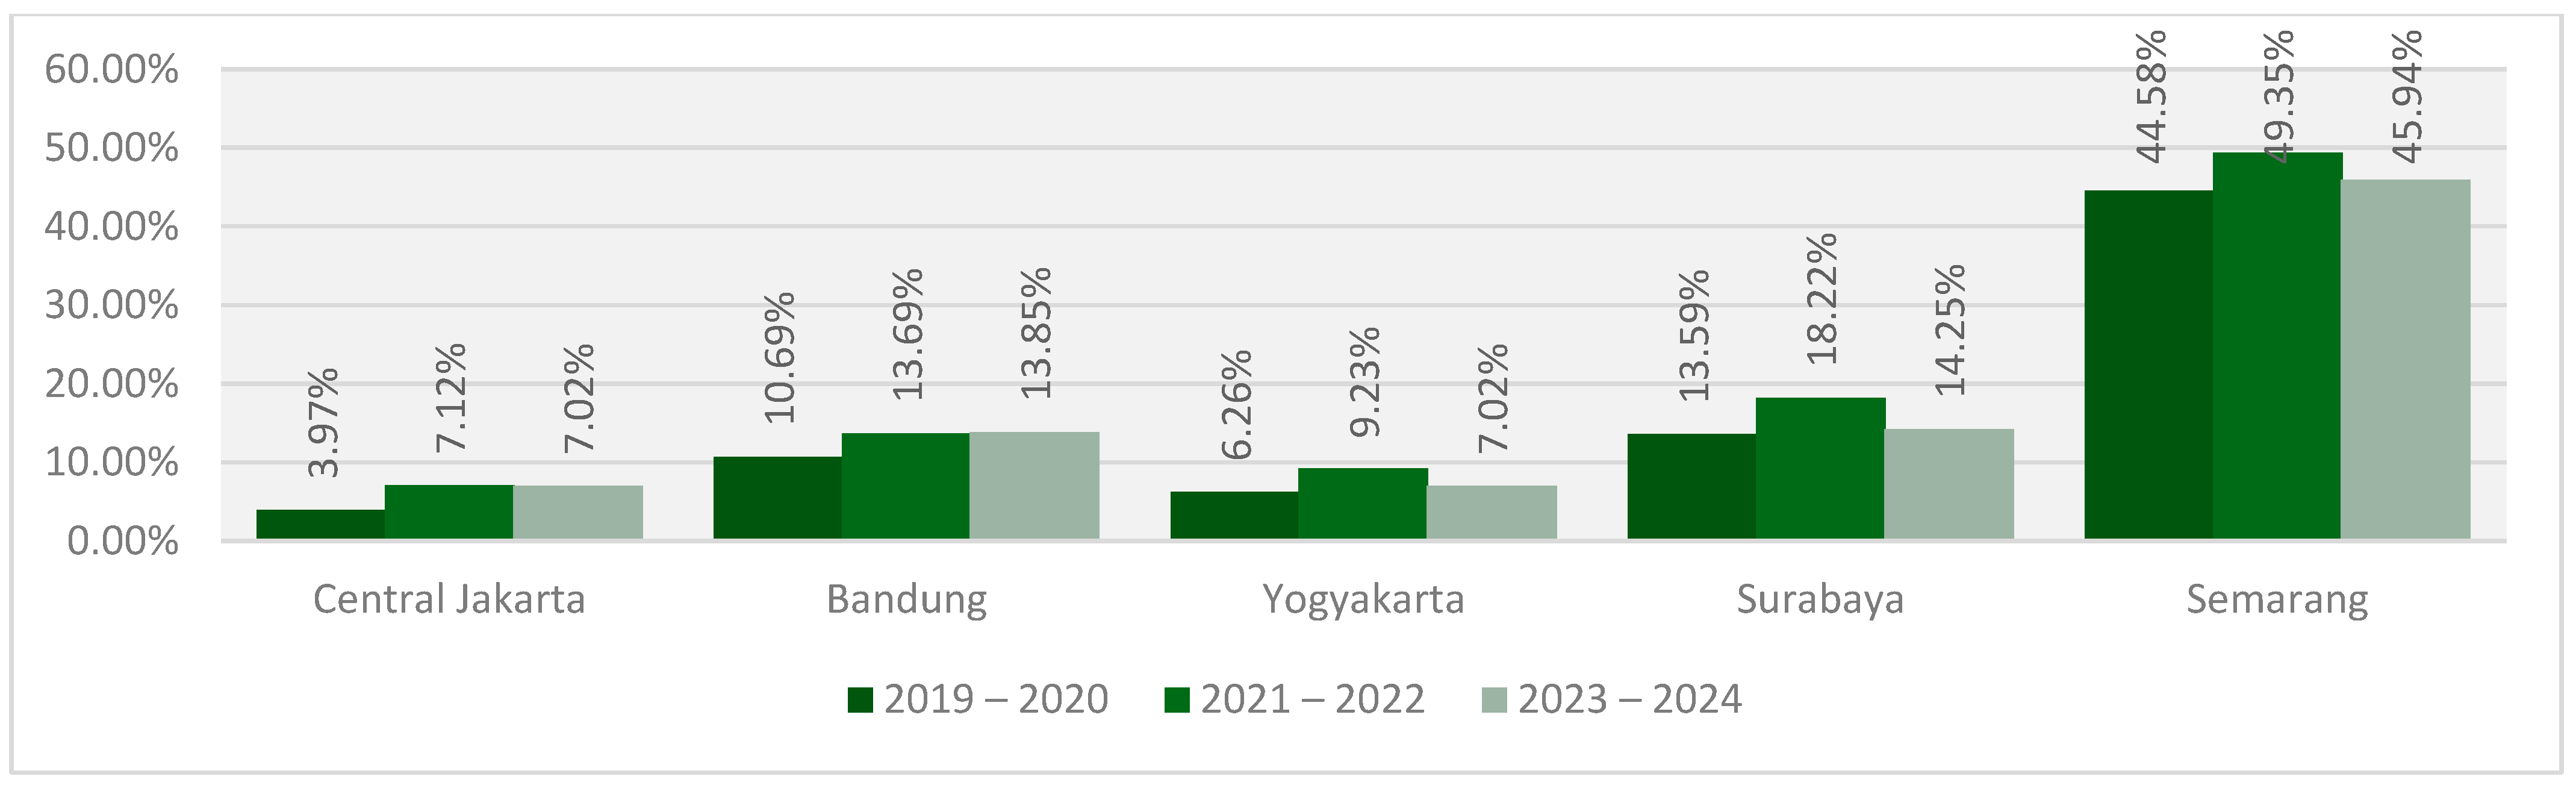
Figure 10, the percentage of green space changes in most cities. These changes are influenced by urban development pressures and environmental policy implementation, or lack thereof. While several cities have made considerable efforts to increase their green spaces, the declines observed in later periods highlight the critical need for consistent and long-term policies to protect these areas.
This comparative analysis provides a basis for cities to learn from each other and encourages the adoption of effective strategies adapted to local conditions. However, only small differences are observed in the detailed classification of vegetation and green open spaces, suggesting the need for further analysis to cluster and extract specific areas with greater precision. For instance, cities like Bandung and Semarang show higher percentages of green spaces compared to others, also due to the size of the total areas. Using Sentinel-2 data to spatially map these areas, heavily vegetated residential zones might stand out due to consistent vegetation cover. However, this analysis may not distinguish between different types of green spaces, such as public parks, private gardens, urban forests, or green belts around residential areas.
Additionally, this study demonstrates that Sentinel-2 data are particularly effective for analyzing environmental conditions in rapidly developing urban areas. However, this approach should be considered as a preliminary step. To develop a comprehensive understanding of urban dynamics, spatial mapping needs to be complemented with further analytical methods, first, these data do not capture finer details such as green space quality, tree density or species composition—factors that are essential for understanding the environmental and social value of urban vegetation. In addition, socio-economic factors influencing land use change, such as population growth and tourism policies, are not directly considered in this analysis. Second, the reliance on remote sensing data without field validation introduces potential inaccuracies in NDVI and EVI calculations, particularly in mixed land use areas. Third, this study does not delve into the socio-economic and policy drivers of green space changes, which could provide valuable context for urban planning. The present methodology’s granularity highlights a limitation that requires further refinement through additional tools and approaches. This is particularly important for cities such as Central Jakarta, Bandung, Yogyakarta, Surabaya and Semarang, where urban growth poses significant challenges to green space conservation. By mapping urban green spaces over time and incorporating diverse datasets, cities are enabled to replicate successful strategies and adjust them to their unique circumstances.
Despite this limitation, the research emphasizes that the availability and distribution of vegetative cover closely influence urban growth and green space management. Many cities have managed to maintain high levels of green cover without significant loss of vegetation, even as land uses have expanded [
37,
41]. Compared to similar studies, which have utilized NDVI for green space monitoring [
62,
63], the inclusion of Sentinel-2’s high-resolution SWIR bands [
42,
64] in this study has improved our understanding of vegetation health and land use changes [
65,
66]. The findings of this study show that analyzing green space through vegetation indices such as NDVI and EVI provides a reliable understanding of the distribution, density, and changes in green space. Conservation can be sustained alongside urban development if it is enabled by well-informed planning strategies. Comparative analyses of urban conditions in different cities can further refine these strategies, allowing policymakers to learn from successful examples while addressing the specific challenges unique to each complexity.
Remote sensing data have proven highly useful in mapping the extent of urban expansion and its encroachment on green spaces. Such tools can provide actionable insights for cities such as Central Jakarta and Yogyakarta, where maintaining or increasing green cover remains challenging. Without technologies such as remote sensing, cities may struggle to quantify green space loss accurately, thereby hindering the development of effective mitigation strategies. For cities with the lowest percentage of green space, remote sensing technologies can be instrumental in identifying underutilized areas that could be converted into green zones. In Bandung, the steady increase in green space reflects effective urban planning informed by geospatial data. Although the overall percentage of green space in many urban areas remains relatively low, the growing need for adequate green open space has become apparent. Remote sensing not only quantifies the current green space coverage but also supports the implementation of strategic policies to mitigate the impacts of urbanization.
The results of this study highlight the critical need to balance urban development with green space initiatives to achieve long-term environmental and social benefits. While satellite-based tools such as Sentinel-2 provide an essential foundation for monitoring urban conditions, they must be used alongside socio-economic and environmental assessments to develop comprehensive urban management strategies. As urbanization continues to reshape the landscapes of Central Jakarta, Yogyakarta, Surabaya, Semarang, and Bandung, it is imperative to focus on the equitable distribution of green spaces. Green spaces contribute to ecological resilience [
39], enhance urban livability [
65], and significantly benefit public health and well-being [
41,
64]. Therefore, the ability to effectively monitor and manage these spaces using remote sensing data remains a critical step in ensuring sustainable urban growth.
6. Conclusions
This study highlights the key role of urban green spaces in sustainable urban development and livability. By integrating advanced remote sensing techniques and Sentinel-2 data, this research effectively analyzed the dynamics of urban green spaces in five major Indonesian cities (located in Southeast Asia): Central Jakarta, Bandung, Yogyakarta, Surabaya, and Semarang. Using vegetation indices such as NDVI and EVI provided a reliable understanding of green spaces’ distribution, density, and changes over time.
The results show significant differences in green space coverage between cities, highlighting the unique challenges and opportunities each urban area faces. While some cities may have green spaces due to their size, others may face more significant difficulties due to dense urbanization and limited land availability. Also, several other factors contribute to the challenges of maintaining green city spaces, such as economic prioritization, policy and governance issues, and historical and cultural factors. These disparities highlight the need for adapted urban planning strategies that prioritize the preservation of green spaces.
Remote sensing data have been an essential tool for identifying trends in urbanization and green space change, providing a reliable basis for policymaking and urban management. However, this study also acknowledges the limitations of relying solely on satellite data, which do not capture finer details of green space quality or socio-economic factors influencing urban growth. Future research should integrate socio-environmental data and local planning frameworks to fill these gaps and provide a more comprehensive understanding of urban dynamics.
In conclusion, balancing urban development with the preservation of green spaces remains critical to achieving long-term environmental sustainability and social well-being. By utilizing the capabilities of remote sensing technologies together with holistic urban planning approaches, cities can improve ecological resilience, mitigate the impacts of rapid urbanization, and ensure equitable access to green spaces for all urban residents. This research provides a fundamental step toward informed decision-making and effective green space management in rapidly growing urban environments. This research also introduces remote sensing technologies combined with holistic planning to enhance green space management and foster ecological resilience and sustainable urban growth.


 ,
, 

