Article

Translating Urban Resilience into Deployable Streetscapes: A Sense-of-Place–Mediated Measurement–Choice Framework with Threshold Identification

1
Wales College, Lanzhou University, Lanzhou 730000, China
2
School of International Communication and Arts, Hainan University, Haikou 570228, China
3
Hainan International College, Minzu University of China, Sanya 572400, China
4
School of Urban Design, Central Academy of Fine Arts, Beijing 100000, China
5
School of Arts, Lanzhou University, Lanzhou 730000, China
*
Author to whom correspondence should be addressed.
These authors contributed equally to this work.
Urban Sci. 2025, 9(12), 501; https://doi.org/10.3390/urbansci9120501
Submission received: 28 September 2025 / Revised: 19 November 2025 / Accepted: 21 November 2025 / Published: 26 November 2025

Abstract

To enact urban resilience at the street–neighborhood scale, we advance a two-stage “measurement–scenario–combination” framework. Stage 1 develops and validates a unified instrument covering four latents—place attachment/identity, accessibility–safety, governance–maintenance, and adoption–participation. Stage 2 uses an image-based conjoint with seven street-landscape elements at five levels; utilities are estimated with hierarchical Bayes, and multigroup SEM with bootstrapped mediation (public vs. expert) tests psychosocial pathways via perceived safety, place attachment, and governance beliefs. The sampling blends online self-administration with targeted invitations under quotas and quality controls. The results yield transferable thresholds and consensus anchors: street width and lighting peak in the upper-middle range; greenery and activity hubs follow inverted-U curves; and preferred traffic exposure centers on mid-to-low bands. Mediation is stronger through attachment/safety for the public, while experts rely more on governance/maintenance beliefs; disagreements concentrate at upper extremes (over-illumination and excessive canopy). We contribute a deployable configuration frontier that translates “being seen–being shaded–being used” into governable specifications, integrating public–expert knowledge to support citywide baselines, community negotiation menus, and policy–standard updates for heat- and injury-risk mitigation and activation of use and collaboration.

1. Introduction

Cities live with layered uncertainties—heat that lingers after sunset, rain that arrives all at once, traffic that both connects and injures. Under these interwoven pressures, resilience stops being a slogan and becomes a spatial task that must be enacted where daily life actually happens: the street–neighborhood scale. Evidence now renders this shift concrete: urban tree canopies can measurably reduce heat-related mortality when configured at sufficient coverage, yet benefits remain unequally distributed across contexts [1,2]. Resilience, in other words, is not added in the abstract; it is arranged, seen, shaded, and used in specific places.
A resilient street is not “fail-safe” but “safe to fail”: it carries redundancy, multiple paths, and ecological bases so that local disruptions do not collapse the whole [3]. Translating that principle to micro-spatial practice demands a grammar of configurable elements—width and enclosure, green size and canopy integrity, facilities and activity hubs, traffic exposure, and nocturnal lighting—rather than broad exhortations to be greener or safer [4,5]. This study takes that grammar as its point of departure, keeping the focus squarely on streets and contiguous blocks, instead of dispersing attention across unrelated hazard domains.
Physical configuration alone does not guarantee resilient outcomes. People must recognize, prefer, use, and help maintain what is built. Here, the spirit of place—operationalized through place attachment—serves as a psychological bridge between designed cues and collective action. The tripartite account (person–process–place) clarifies how affect, cognition, and behavior are recruited by specific spatial attributes [6]. Empirical research further links attachment with walking and neighborhood interaction, indicating plausible channels through which micro-scale qualities become social capacity [7,8]. In urban design metrics, perceptual constructs such as imageability, enclosure, human scale, transparency, and complexity can be measured and related to walkability—giving “soft” experience a “hard” ruler at the street scale [9,10].
Affordances—the action possibilities that a setting offers to its users—help name this coupling of configuration and behavior. Read through an affordance lens, a colonnade invites lingering, a legible crossing invites safe passage, and shaded seating invites dwelling. Framing micro elements as affordances complements attachment theory and sharpens design translation [11]. In our context, the architectural landscape space at the building–street seam—arcades, stoops, galleries, and recessed frontages—becomes a pivotal affordance field that mediates inside–outside flows, mutual watchfulness, and everyday stewardship.
Resilience also concerns risk pathways that are acutely street-bound. The exposure–injury relation is steep at pedestrian impact speeds; area-wide speed management and traffic calming repeatedly associate with casualty reductions [12,13]. At night, reassurance and willingness to linger respond to lighting distribution and brightness, though not linearly and not without trade-offs; virtual and simulated experiments show perceptual gains with improved visibility, but also reveal limits imposed by glare and physiological load [14]. Concurrently, quasi-experimental studies connect specific roadway treatments to injury reductions, underscoring that configuration choices are not merely aesthetic [15]. Any credible framework for resilient streets must therefore juggle comfort and safety with ecological and energy externalities, especially for lighting.
Data-rich methods now let perception be mapped at scale. From classic field protocols to street-view imagery and machine learning, features like façade activity, greenery, and frontage continuity can be tied to pedestrian behavior and used to propose segment-level retrofits [9,11]. The practical import is straightforward: we can operationalize “being seen–being shaded–being used” as measurable levers and examine how they align—or fail to align—with people’s preferences and attachment.
With this logic, we treat the built scene as a set of seven architectural–landscape modalities that can be qualitatively defined and quantitatively translated: (1) street width/enclosure, (2) building density as it shapes canyon form, (3) green area size emphasizing canopy cover, (4) facilities and equipment density, (5) public activity hub scale, (6) traffic flow intensity, and (7) lighting coverage/distribution. Each modality is conceived as a five-level gradient from deficit to excess, allowing thresholds and inverted-U forms to be tested rather than assumed. Importantly, the “grey space” edge between building and street is threaded through these modalities: width and density calibrate enclosure and legibility; facilities and hubs negotiate conviviality without clutter; lighting makes edges readable after dark; and canopy tempers radiant load over edges where people actually sit and pass.
This framing responds to two recurring problems in urban resilience discourse. First, it includes the last mile of scale translation: citywide targets often stall at the block because they lack a vocabulary of deployable elements and bounds. Introducing street-scale modalities—with attention to attachment and affordances—provides that vocabulary and keeps the unit of analysis where governance and maintenance actually operate [3,4]. Second, it repairs the broken mechanism chain: much of the literature documents single links—cooling from green, reassurance from light, and safety from speed—without connecting them through perception to behavior. By foregrounding attachment and affordances alongside measured configuration, the present approach closes that chain using concepts already validated in environmental psychology and urban design [6,7].
The moral axis of resilience is equity. Cooling benefits, walkability, and night safety are not evenly distributed; unequal canopy and uneven maintenance widen health gaps, particularly in hotter and resource-constrained contexts [2]. Community resilience research stresses that social cohesion and participation are foundations of “soft resilience,” and these are not separable from the spatial cues that shape everyday co-presence and mutual aid [16,17]. Designing for legibility, shade, and convivial grey spaces thus doubles as designing for inclusion: it lowers the burden of wayfinding, reduces the thermal and fear costs of being outside, and makes maintenance obligations visible and learnable.
In sum, we recast urban resilience at the street–neighborhood scale as a configuration problem with psychosocial pathways. Streetscapes that reliably invite safe movement, shaded dwelling, and shared care emerge when architectural–landscape modalities are tuned away from both deficit and excess, when grey spaces are made legible and convivial, and when affordances align with community identity. By keeping the lens on deployable elements and the bridge variable of place attachment—rather than on a catalog of hazards or solely on macro frameworks—resilience becomes a practice of choosing thresholds, not merely declaring intentions [1,3]. The task is to identify where public and expert judgments converge on these thresholds and how those consensual bands can be written into the everyday governance of lighting, canopy, traffic exposure, and the fine grain of building–street interfaces [5,14].

2. Literature Review

2.1. Urban Resilience: From Slogan to Street Scale Translation

Resilience has expanded from an engineering notion of rapid recovery to the adaptive capacity of socio-ecological technical systems distributed across scales [18]. The “safe to fail” lens reframes design as the arrangement of redundancy, multiple pathways, and ecological bases rather than the pursuit of failure-proof artifacts [3]. Yet much assessment remains at city/community scales, with governance boundaries misaligned with where people actually walk, wait, and watch; this scale mismatch repeatedly undermines implementation [19,20]. Climate risk syntheses and policy reviews further indicate that, although nature-based solutions (NbSs) can reduce flood and heat impacts, many frameworks stop short of specifying deployable elements at the street/place scale—what widths, what tree canopies, and what lighting distributions—leaving a “last mile” between vision and practice [21,22]. Planning and governance studies therefore call for cross-department vocabularies capable of translating resilience objectives into ordinary operations and maintenance at the human scale [23,24]. In short, resilience becomes legible when expressed as configurations that can be seen, shaded, and used along everyday streets [25].

2.2. Spirit of Place and Its Mediating Role

Sense of place is not a decorative add-on; it is the psychological bridge through which designed cues become collective action. The tripartite “person–process–place” framework clarifies who is attached, by which processes (affect, cognition, and conation), and to what attributes [6]. Parallel models distinguish attachment, dependence, and identity, with robust psychometric support across urban and resource settings [26,27]. Empirically, attachment co-varies with use preferences and environmental satisfaction and has been mapped spatially alongside landscape values [28,29]. Multiple studies further indicate that attachment mediates the effects of environmental quality on pro-environmental and cooperative behaviors [30,31]. At community scales, social capital and cohesion are decisive in recovery; place attachment functions as their psychological substrate [32,33]. Put together, these lines suggest a causal corridor—physical attributes → perceptual qualities → attachment/identity → participation and stewardship—that is highly relevant to resilient street life but under-integrated in urban design models [34]. An affordance-based reading—what actions a setting invites—sharply complements this view by naming how façades, edges, and thresholds “ask” for lingering, watching, or crossing [11].

2.3. Architectural–Landscape Modalities Tied to Resilience

The literature converges on seven families of street-scale elements whose mechanisms reach directly into heat, safety, and sociability: (1) street width/enclosure, (2) building density and canyon form, (3) green size and canopy integrity, (4) facilities/equipment density, (5) public activity hubs, (6) traffic exposure, and (7) lighting coverage/distribution. These are not merely aesthetic levers; they are resilience levers.
Green infrastructure. Canopy and green space contribute shading–cooling, evapotranspiration, stormwater retention, and restoration, with health benefits evidenced across cohorts [34,35]. NbSs reduce pluvial flooding in many settings, although effects are context-sensitive [36,37]. Crucially, cooling magnitudes depend on species, crown morphology, and geometry; “more trees” is not a universal recipe [22,37].
Urban geometry. The aspect ratio and enclosure alter sky-view factors, ventilation, and radiative exchange, shaping perceived heat with nonlinear optima [38,39]. Reviews link density and morphology to heat island intensity; shade repeatedly emerges as one of the most effective comfort modifiers in hot seasons [40,41].
Traffic exposure and injury. Natural and policy experiments associate 20 mph/30 km h−1 regimes and area-wide calming with casualty reductions [42,43]. The exposure–injury curve steepens with speed, foregrounding the allocation of section, speed, and separation as equity-laden resilience choices [44].
Lighting: reassurance vs. ecology. Perceived safety tends to rise with illuminance and visibility, yet effects are not linear and do not consistently map onto crime reduction; institutional context matters [45,46]. Meanwhile, artificial light at night imposes ecological externalities at the planetary scale, prompting calls for spectrum control, shielding, and distributional designs that limit spill and glare [47,48]. This tension positions lighting as a calibration problem rather than a “more is better” axis [49,50].
Landscape space at the building–street seam. Stoops, arcades, galleries, and recessed frontages operate as affordance fields that mediate surveillance, resting, and casual exchange. They also concentrate maintenance burdens; facility density must trade convenience against clutter and visibility—an operations problem, not only an aesthetic one [33,51]. Across these strands, “architectural landscape space” becomes the stage where resilience is either enacted or frustrated.

2.4. Measuring Preferences and Trade-Offs at the Human Scale

Preference research has moved from descriptive visual surveys to designs that recover attribute trade-offs. Visual preference surveys and VR/imagery environments efficiently reveal public–expert differences when options are context-rich [52,53]. Conjoint/choice experiment approaches estimate marginal utilities over multiple attributes and allow identification of nonlinearity and heterogeneity [54,55]. Recent studies validate short-term stability and show that when street elements are decomposed into attributes and levels, trees often exert outsized effects relative to lawns or vertical greening in virtual streetscapes [56,57]. On the measurement side, urban design quality indices—imageability, enclosure, human scale, transparency, and complexity—have been operationalized and linked to walkability, enabling “soft” experience to be set on a “hard” ruler [9,58]. Machine learning work with street-view imagery further connects façades, greenery, and frontage vitality to pedestrian behavior, expanding coverage while preserving segment-level interpretability [10,59]. What remains thin is an explicit link from preferences to resilience outcomes (heat mitigation, injury reduction, and stewardship), and an integrated role for sense of place as a mediator across that chain [60,61]. These gaps are methodological rather than purely conceptual: they call for instruments that co-locate perceptual judgments with governance-relevant levers and for stimuli that render gradients—deficit to excess—rather than binary contrasts [54,55]. (The public and expert questionnaire architectures used in this project adopt precisely these constructs and levers.)

2.5. What Existing Evidence Supports—And What It Does Not

Across the strands above, three patterns recur. The first is effect heterogeneity: canopy cooling, lighting reassurance, and geometry–microclimate relations vary by context and by how elements are combined [22,40]. The second is goal conflicts: lighting can heighten reassurance while worsening ecological burdens; activity hubs can knit social ties while crowding circulation; and adding facilities can aid resting while increasing clutter risk [47,49]. The third is governance dependence: many successes hinge on maintainability, institutional alignment, and the visibility of responsibilities—the everyday grammar through which resilience survives beyond ribbon cuttings [23,24]. The literature is rich on links from single elements to single outcomes (e.g., speed to injury and shade to thermal comfort) [41,42]. It is thinner on multi-attribute thresholds and inverted-U forms—how much lighting before glare harms comfort and how large an activity hub can be before congestion suppresses use—and on mediating psychology—how attachment/identity channels design into participation and care [30,33]. Precisely because resilience is enacted in ordinary streets, the research frontier now lies in translating these insights into qualitative–quantitative modalities—width/enclosure; density/canyon; green size/canopy integrity; facilities; hubs; traffic exposure; and lighting distribution—each defined on an interpretable five-level gradient from deficit to excess, and examined under a unified, street-scale lens [9,54].

3. Experimental Design

3.1. Research Logic and Evidence Base

Chapter 2 established that resilience is not an abstract, macro-level slogan; it is enacted at the street–neighborhood “everyday scale” through a set of controllable landscape cues that are perceived, preferred, and governable. In recent high-impact work linking resilience with health/safety/climate performance, micro-design cues—green quantity and structure, street-canyon geometry and shading, traffic exposure, nocturnal lighting and visibility, and the organization of facilities and activity hubs—have been tied to human–space–society mediation mechanisms. For example, the coupling among heat risk, H/W street-canyon ratios, canopy evapotranspiration, and predictable scaling relations has been articulated [62]; unequal thermal exposure and nonlinear cooling from canopy cover have been repeatedly documented across cities [63,64]; and the effects of controlled illuminance/Correlated Color Temperature on feelings of safety have been quantified in laboratory and simulated settings [14,65]. Meanwhile, methods such as discrete choice experiments (DCE) and conjoint analysis have shown that when street elements are decomposed into attributes and levels, the trade-off structure of preferences in public and expert samples can be stably identified and exhibits short-term repeatability [55,56]. Collectively, these findings indicate that this study must build a clear design–measurement chain between measurable landscape elements and explainable psychological/behavioral channels.
Within this framework, the analytic unit of “urban resilience–spirit of place–landscape configuration preference” is positioned as human-scale street situations. To make design guidance directly retrievable and actionable, the experiment avoids abstract stimuli and instead uses image-based situations with controllable parameters to carry element variations, placing public and expert judgments within a unified measurement system (see Figure 1; Table 1 and Table 2 summarize the scales and stimulus matrix). The first enhancement over prior studies is to house, within one instrument, proxy indicators for resilience–health–safety (thermal comfort/visibility/traffic exposure/accessibility) alongside psychological dimensions of the spirit of place (attachment, identity, and dependence), thereby reducing “indicator misalignment” when synthesizing across the literature [65,66,67]. The second enhancement is to deploy gradient image stimuli rather than text-only descriptions, decreasing imaginative load and idealized bias so that choices reflect more realistic, in-use trade-offs [14,65]. The third enhancement is to model public–expert knowledge and governance roles explicitly at the design stage, rather than treating them as descriptive afterthoughts [55,56].
Our enhancements are not merely procedural cosmetics but address known threats to validity at the street–neighborhood scale. First, gradient image stimuli reduce imaginative load and idealized bias compared with text-only descriptions, allowing thresholds and U shapes to be identified rather than assumed. Second, double randomization (item order and polarity mirroring) and embedded attention/consistency checks suppress order effects and acquiescence. Third, the unified instrument achieves acceptable reliability and factorability in the formal public sample (Cronbach’s α = 0.765; KMO = 0.911; Bartlett p < 0.001), with a per-item MSA largely above 0.70; parallel analysis supports a multi-factor structure (Table 3). These procedures, together with cross-group comparability of the measurement layer, substantively increase the reproducibility and transferability relative to earlier, purely descriptive preference designs.
Point estimates are accompanied by uncertainty and effect size metrics. For hierarchical Bayes utilities we report posterior means with 95% highest density intervals (HDIs) and WAIC/ΔWAIC for model comparisons; for multigroup SEM we report standardized coefficients with 95% bootstrap confidence intervals (5000 draws) and fit indices (CFI, TLI, RMSEA, and SRMR); and for group differences we provide standardized mean differences (Cohen’s d) or Δslope with a FDR-adjusted q. Summary tables and diagnostics are provided in Supplementary Tables S1–S4, while instrument reliability and factorability remain in Table 3 and Figure 3.

3.2. Structured Design of Phase 1 Questionnaires: Mapping Constructs to Items

Phase 1 comprises two questionnaires (public and expert), sharing the Part A core constructs to ensure cross-group comparability. Part A unfolds along four layers: first, operational dimensions of the spirit of place (attachment/dependence/identity) with mixed reverse/forward items; second, perceived everyday accessibility–safety–comfort, centered on walkability, frontage continuity, shading, and visibility; third, governance and maintainability, prompting judgments on facility upkeep, lighting management, traffic order, and user conflicts; and fourth, adoption and participation propensity, including the self-reported likelihood of contributing to maintenance and neighborhood cooperation. Part A contains 35 items, spanning the loop from “person–process–place” to “use–governance–adoption,” ensuring one-to-one correspondence with the later situational stimuli (Table A1 in the Appendix A maps items to constructs and references).
The public Part B (concise) raises the sample size and generalizability, concentrating on rapid diagnostics of use preference and perceived safety; the expert Part B (in-depth) extends into lighting distribution and CCT, street-canyon geometry and thermal thresholds, and traffic allocation and injury risk, among other parametric details. This “bandwidth/depth division of labor” aligns with two recent evidence streams: first, differences in feelings of safety under varying light conditions require “professionally controllable” phrasing in dimensions of CCT/illuminance/uniformity [65,68]; and second, the nonlinear and threshold relations of street-canyon geometry–shading–heat comfort, shown in simulations and field studies, demand terminological consistency for effective expert comparison [67,69]. Here, the fourth enhancement is implemented: embedding a professional parameter lexicon into expert-version stems so that evaluations translate directly into executable specifications for equipment and geometry, while keeping public-version language concise to avoid technical noise in intuitive judgments.
Sampling and quality control were pre-planned in Phase 1: public sampling uses city-size and street-use intensity as quota variables; expert sampling covers planning, landscape, transport, lighting, public safety, and community governance. To internalize attention and consistency in design—rather than relying exclusively on ex-post screening—both Parts A and B include semantic/formal consistency probes, and item order and scale polarity are doubly randomized to suppress order effects and acquiescence bias. This constitutes the fifth enhancement: building measurement quality control into the questionnaire architecture itself rather than depending solely on post-hoc deletion.
Although safety, visibility, and comfort co-occur in everyday use, they are modeled as distinct latents. Part A separates place attachment/identity, accessibility–safety, governance–maintenance, and adoption–participation with polarity-balanced items (public/expert cores are shared to secure comparability). Exploratory/confirmatory diagnostics show acceptable internal consistency across latents and factorability (α and KMO in Section 4.1). Cross-loadings are constrained below |0.30| for retained items, with rotated patterns reported in Table 4. We intentionally administer governance items in the same instrument as perceptions to test bridge mechanisms, but statistical separation is enforced at the measurement layer and carried into multigroup SEM in Section 4.2.

3.3. Scene-Modeling Principles and the Composition of 35 Situational Images

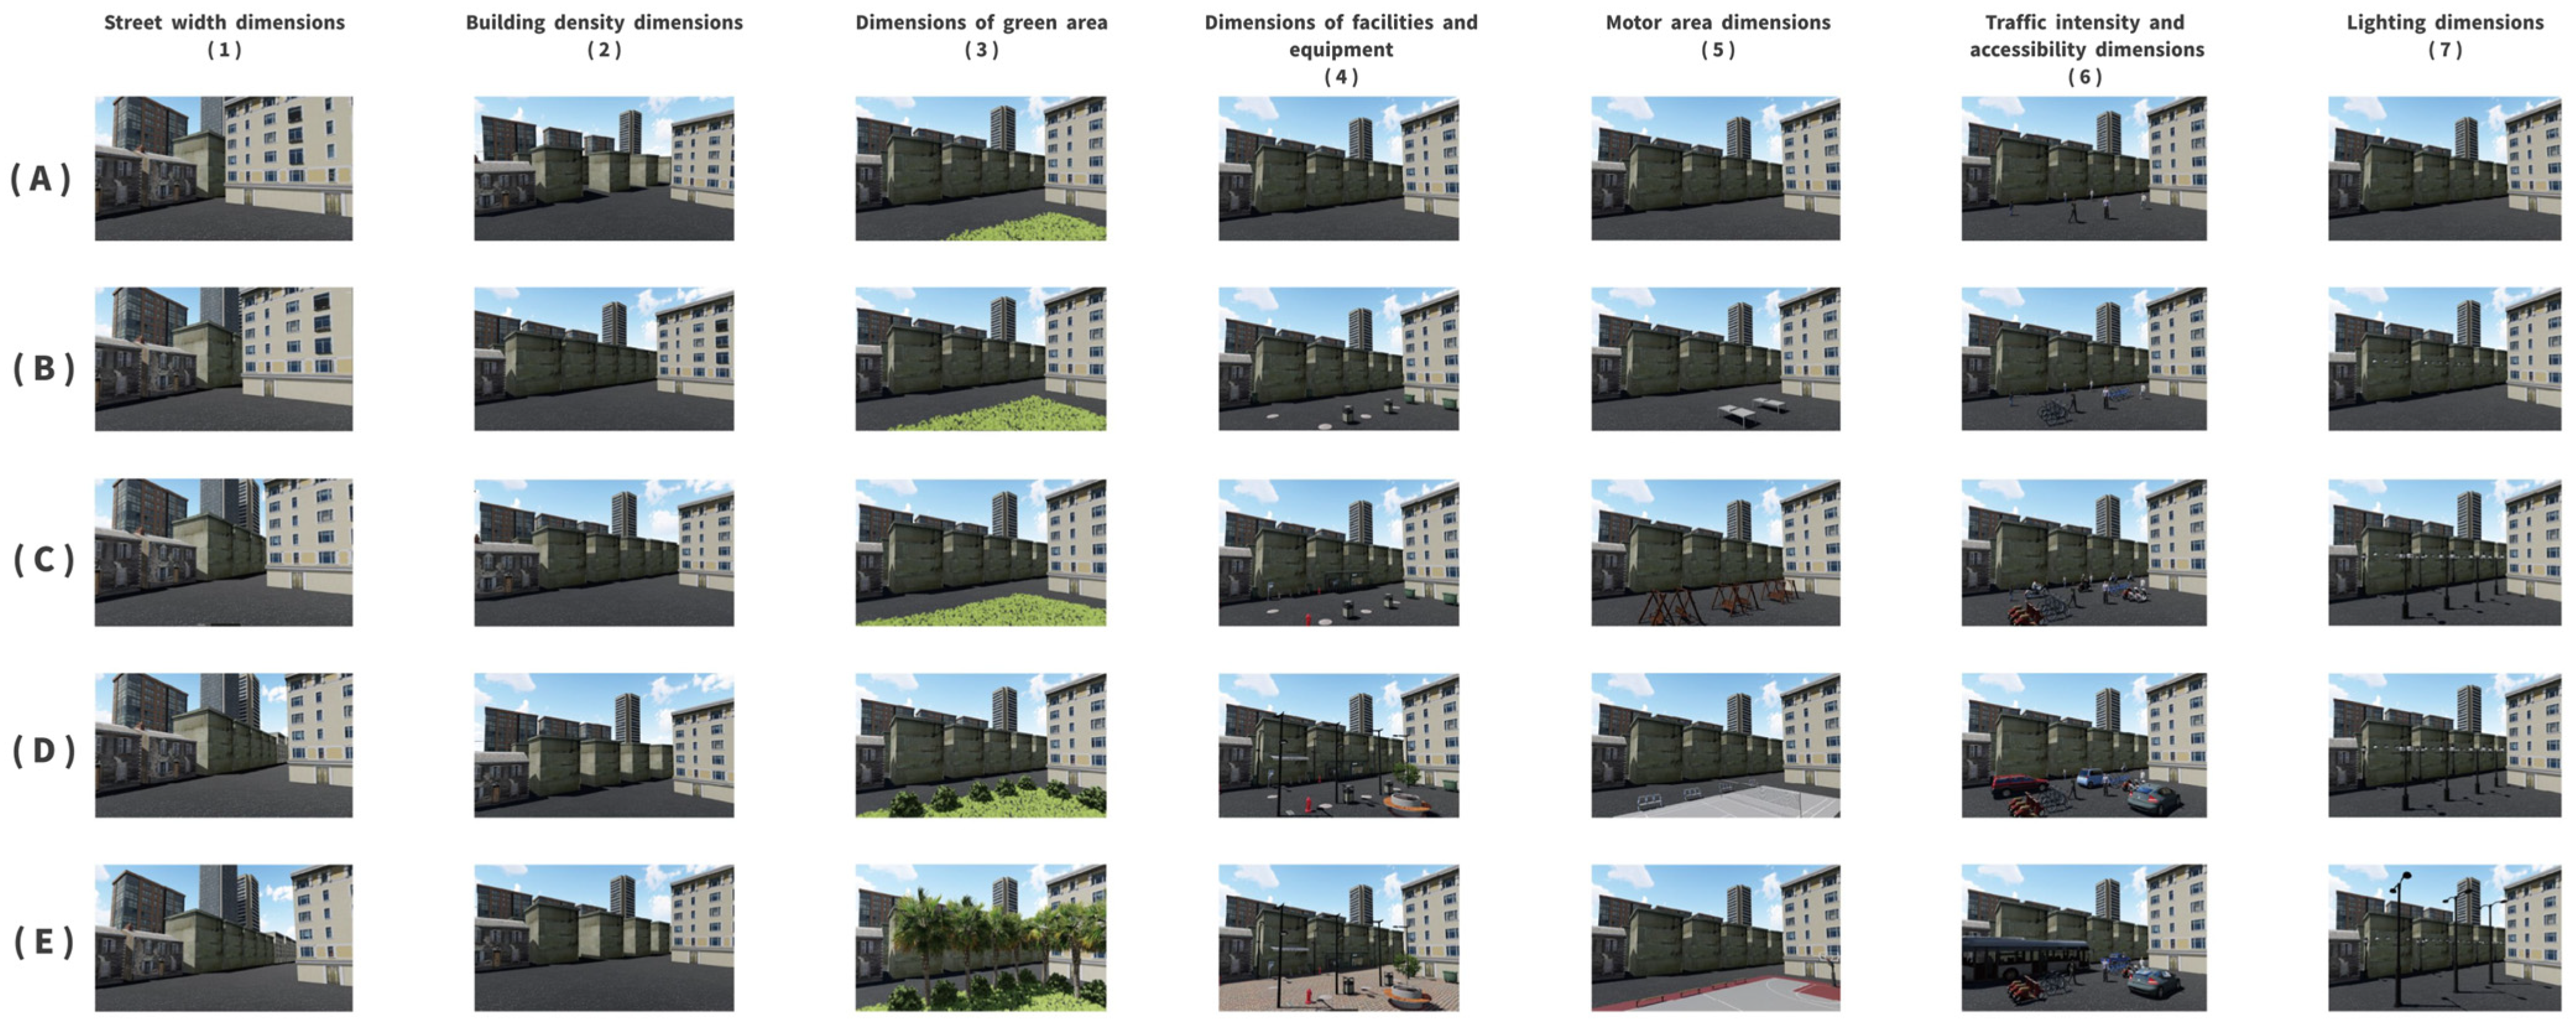
The situational set was not constructed by first fixing a number and then searching for justification; it proceeds from three sequential principles of recognizability, comparability, and inferability. First, recognizability requires each image to display a single dominant element changing in gradient while holding other conditions constant, focusing respondents’ attention on differences across the levels A–E. This “one-variable progression” mirrors the controlled-variable design common in heat-risk/street-canyon research and helps ascertain causal direction and thresholds [69,70]. Second, comparability demands that the five levels of any given element be perfectly aligned in scale and composition, avoiding camera/angle-induced bias; the sky luminance and CCT, camera focal length, pitch, viewpoint, and background noise (distant buildings/people/vehicles) are locked. Third, inferability means that the five-level gradients go beyond “more–less” to include feasible extremes and implementable intermediate states, endowing preference curves with extrapolative meaning (e.g., lighting from under- to over-illumination with glare, greenery from point- to areal-dominant, and traffic from quiet to high exposure).
Once these principles were fixed, the seven elements—(1) street width, (2) building density, (3) green space size, (4) facilities and equipment, (5) public activity center, (6) traffic volume, and (7) lighting—were each constructed as five-level progressions, yielding 7 × 5 = 35 situational images (see Figure 2; Table 1 details the design matrix). A full-factorial combination would impose an unacceptable cognitive burden and learning effects (5 × 7 combinations). We therefore adopt the “one-factor, five-level” progression with block-random presentation to disperse consecutive exposure to the same element, thereby preserving inferability without sacrificing response quality [56]. This forms the sixth enhancement: a stimulus set built under the twin objectives of cognitive load and design efficiency, not the brute pursuit of combinatorial completeness.
To grant the images normative relevance rather than static aesthetics, three families of elements were parameterized to align with high-impact evidence. For street-canyon geometry, width gradients approximate H/W = 0.5, 1.0, 1.5, 2.0, and 2.5 so that potential differences in heat/wind/radiation are interpretable [69,70]. For greenery, we control grass–tree–shrub proportions and canopy completeness, corresponding to the canopy’s primary contribution to reducing mPET/UTCI [64,66]. For lighting, at the same luminous flux, we vary distribution and CCT to emulate typical trade-offs among uniformity, glare, and color rendering [65,68]. This yields the seventh enhancement: parameter reusability as a precondition of image generation, facilitating the translation of preferences into engineering/operations thresholds.
Equation (1). To ensure “progressive preferences” have explicit targets at the design stage, we specify a labeled latent-utility structure during stimulus construction so that monotonicity/U shapes/thresholds can be identified later:
U r , a , l = β 0 + β a l + ζ r + ε r , a , l , s . t . l { A , , E } β a l = 0
where a indexes elements (1–7), l levels (A–E), and ζ r is an individual random term. During design, β a l are placed equispaced or quasi-equispaced to guarantee later identification of linear, convex/concave, and plateau regions [55,56].
Equation (2). To define a governance-oriented composite weight for public–expert perspectives at the design stage, we state the decision-period composite utility adjacent to the stimulus matrix:
V a l = w p U ¯ a l ( p ) + w e U ¯ a l ( e ) , w e = κ e κ e + κ p , κ g = α g τ g
where g p , e denotes public/expert, α g is the planned reliability target for each group’s scale, and τ g is a policy-relevance weight. This expression serves as a design-stage governance declaration, enabling direct routing of outputs into “consensus vs. divergence” channels [71].
Equation (3). Block presentation of stimuli follows a D-optimal efficiency criterion to ensure near-balanced exposure of the seven elements at the respondent level:
E D = d e t ( X X ) 1 / p m a x , s . t . C ( s ) C m a x , Π ( s ) b a l a n c e d
with X as the design matrix, p the number of parameters, C ( s ) the cognitive-load function for a respondent, and Π ( s ) the balancing constraints on blocks and item order. This guides the dual randomization of stimuli and items and the choice of block size [55,56].
These three expressions are not for estimating results; they clarify at the design stage “what is to be identified,” “how governance views are aggregated,” and “how presentation efficiency is controlled,” thereby furnishing a traceable basis for analysis and design translation in subsequent chapters. This constitutes the eighth enhancement: coupling model–governance–presentation constraints during design rather than bolt-on assembly during analysis.

3.4. Phase 2 Questionnaire: Unified Situations, Unified Scales, and Response Flow

The image set follows a two-layer design. Layer 1 presents one-factor, five-level progressions (A→E) to identify within-attribute gradients under fully controlled optics and backgrounds (recognizability and inferability). Layer 2 uses context-rich composite items that bundle multiple attributes (e.g., “1C 2C 3D … 7D”, §Phase 2 questionnaire) to probe trade-offs under realistic co-variation. Thus, the single-progression images serve for identification, while the composite judgments test generality and interactions without exhausting respondents with a full factorial.
In Phase 2 we collect judgments on a single Likert scale for parsimony (five points in the finalized instrument), but analysis never aggregates heterogeneous outcomes. Each item is tagged with a primary label (overall appropriateness vs. night safety vs. daytime liveliness vs. governance–maintainability) and auxiliary proxies (thermal/light/traffic exposure). In modeling, these labels define separate outcome channels (ordered responses standardized within the channel), ensuring that preference, safety, and comfort are estimated and interpreted independently.
In parallel, Phase 2 places the public and experts on one questionnaire, answering a single set of 60 items derived from the 35 situational images. Each item uses a seven-point Likert response, co-locating preference intensity, safety/comfort judgments, and maintenance/adoption intent under “primary–auxiliary” labels within the same stem. This unification rests on two recent lines of evidence. First, relationships among heat, canopy, and population exposure show marked heterogeneity at metropolitan scales; the public and experts must judge the same situations on a common referential scale to identify “consensus cues” [64,66,72]. Second, the effects of light color/illuminance/uniformity on feelings of safety differ across age groups, so unified scales enable more reliable comparisons [65,68]. The ninth enhancement appears in the questionnaire’s dual-path stem: respondents first provide an intuitive judgment on “overall preference/sense of safety,” then immediately supply supplemental judgments keyed to three proxy indicators—thermal/light/traffic exposure—so that intuition is braided with evidence-based descriptors.
Regarding the response flow, images are presented with random sequence and block balancing; the five levels of the same element never appear consecutively, avoiding learning and anchor effects. Item polarity and wording are matched across public and expert versions, with only a light-touch difference in terminology density. Context-consistency items and attention items are interleaved as bona fide, answerable questions of equal standing, preventing motivational shifts that “obvious check items” can trigger (notes in Table 1 detail placements). The tenth enhancement arises from physical consistency in imagery generation: a common HDR sky, fixed camera parameters, consistent background building and material libraries, and calibrated human–vehicle–object scales reduce variance from non-experimental sources, enabling experts from multiple disciplines to translate preferences directly into lighting distribution, tree planting, lane organization, and facility siting [67,70].

3.5. Sampling Frame, Ethics, and Reproducibility Essentials

For Phase 2, public sampling uses a three-tier quota of travel intensity × period of built environment × street typology, ensuring coverage from narrow legacy streets to wide arterial corridors and from auto-oriented to pedestrian-first contexts. Expert sampling issues balanced invitations to landscape, planning, transport, lighting, public safety, and community governance, and each expert provides paired qualitative–quantitative remarks on elements in their domain (short open text after items). This arrangement allows transparent declaration and sensitivity discussion of the policy-relevance weight τ g in Equation (2) when performing governance synthesis [71]. Prior to data collection, ethics and privacy compliance were completed; images are for academic use only and stems exclude sensitive personal information. The online instrument disables open uploads and open-ended prompts that could reveal participants’ identities. To secure reproducibility, the stimulus-generation parameters and item bank are internally versioned (not publicly released), ensuring that peer verification can strictly reproduce the camera angles, light environment, canopy configuration, and human–vehicle placement [64,66,67].
As shown in Figure 1, the overall Chapter 3 workflow proceeds top-down: constructs → items → stimuli → presentation → responses → quality control → governance weighting. Figure 2 presents the three-dimensional mapping of element-level stimuli, parameters, and proxy indicators on a single sheet, ensuring that downstream models (e.g., threshold testing, U shape identification, and group-difference comparison) can reference non-overlapping information subsets. Table 1 lists the stimulus matrix and controlled variables; Table 2 lists the sample structure and quotas. With this, the chapter completes a design closed loop from theory to measurement, from images to items, and from groups to governance; subsequent chapters will proceed without altering these design premises.

4. Results and Analysis

4.1. Pilot Testing and Measurement Quality of the Scale Architecture

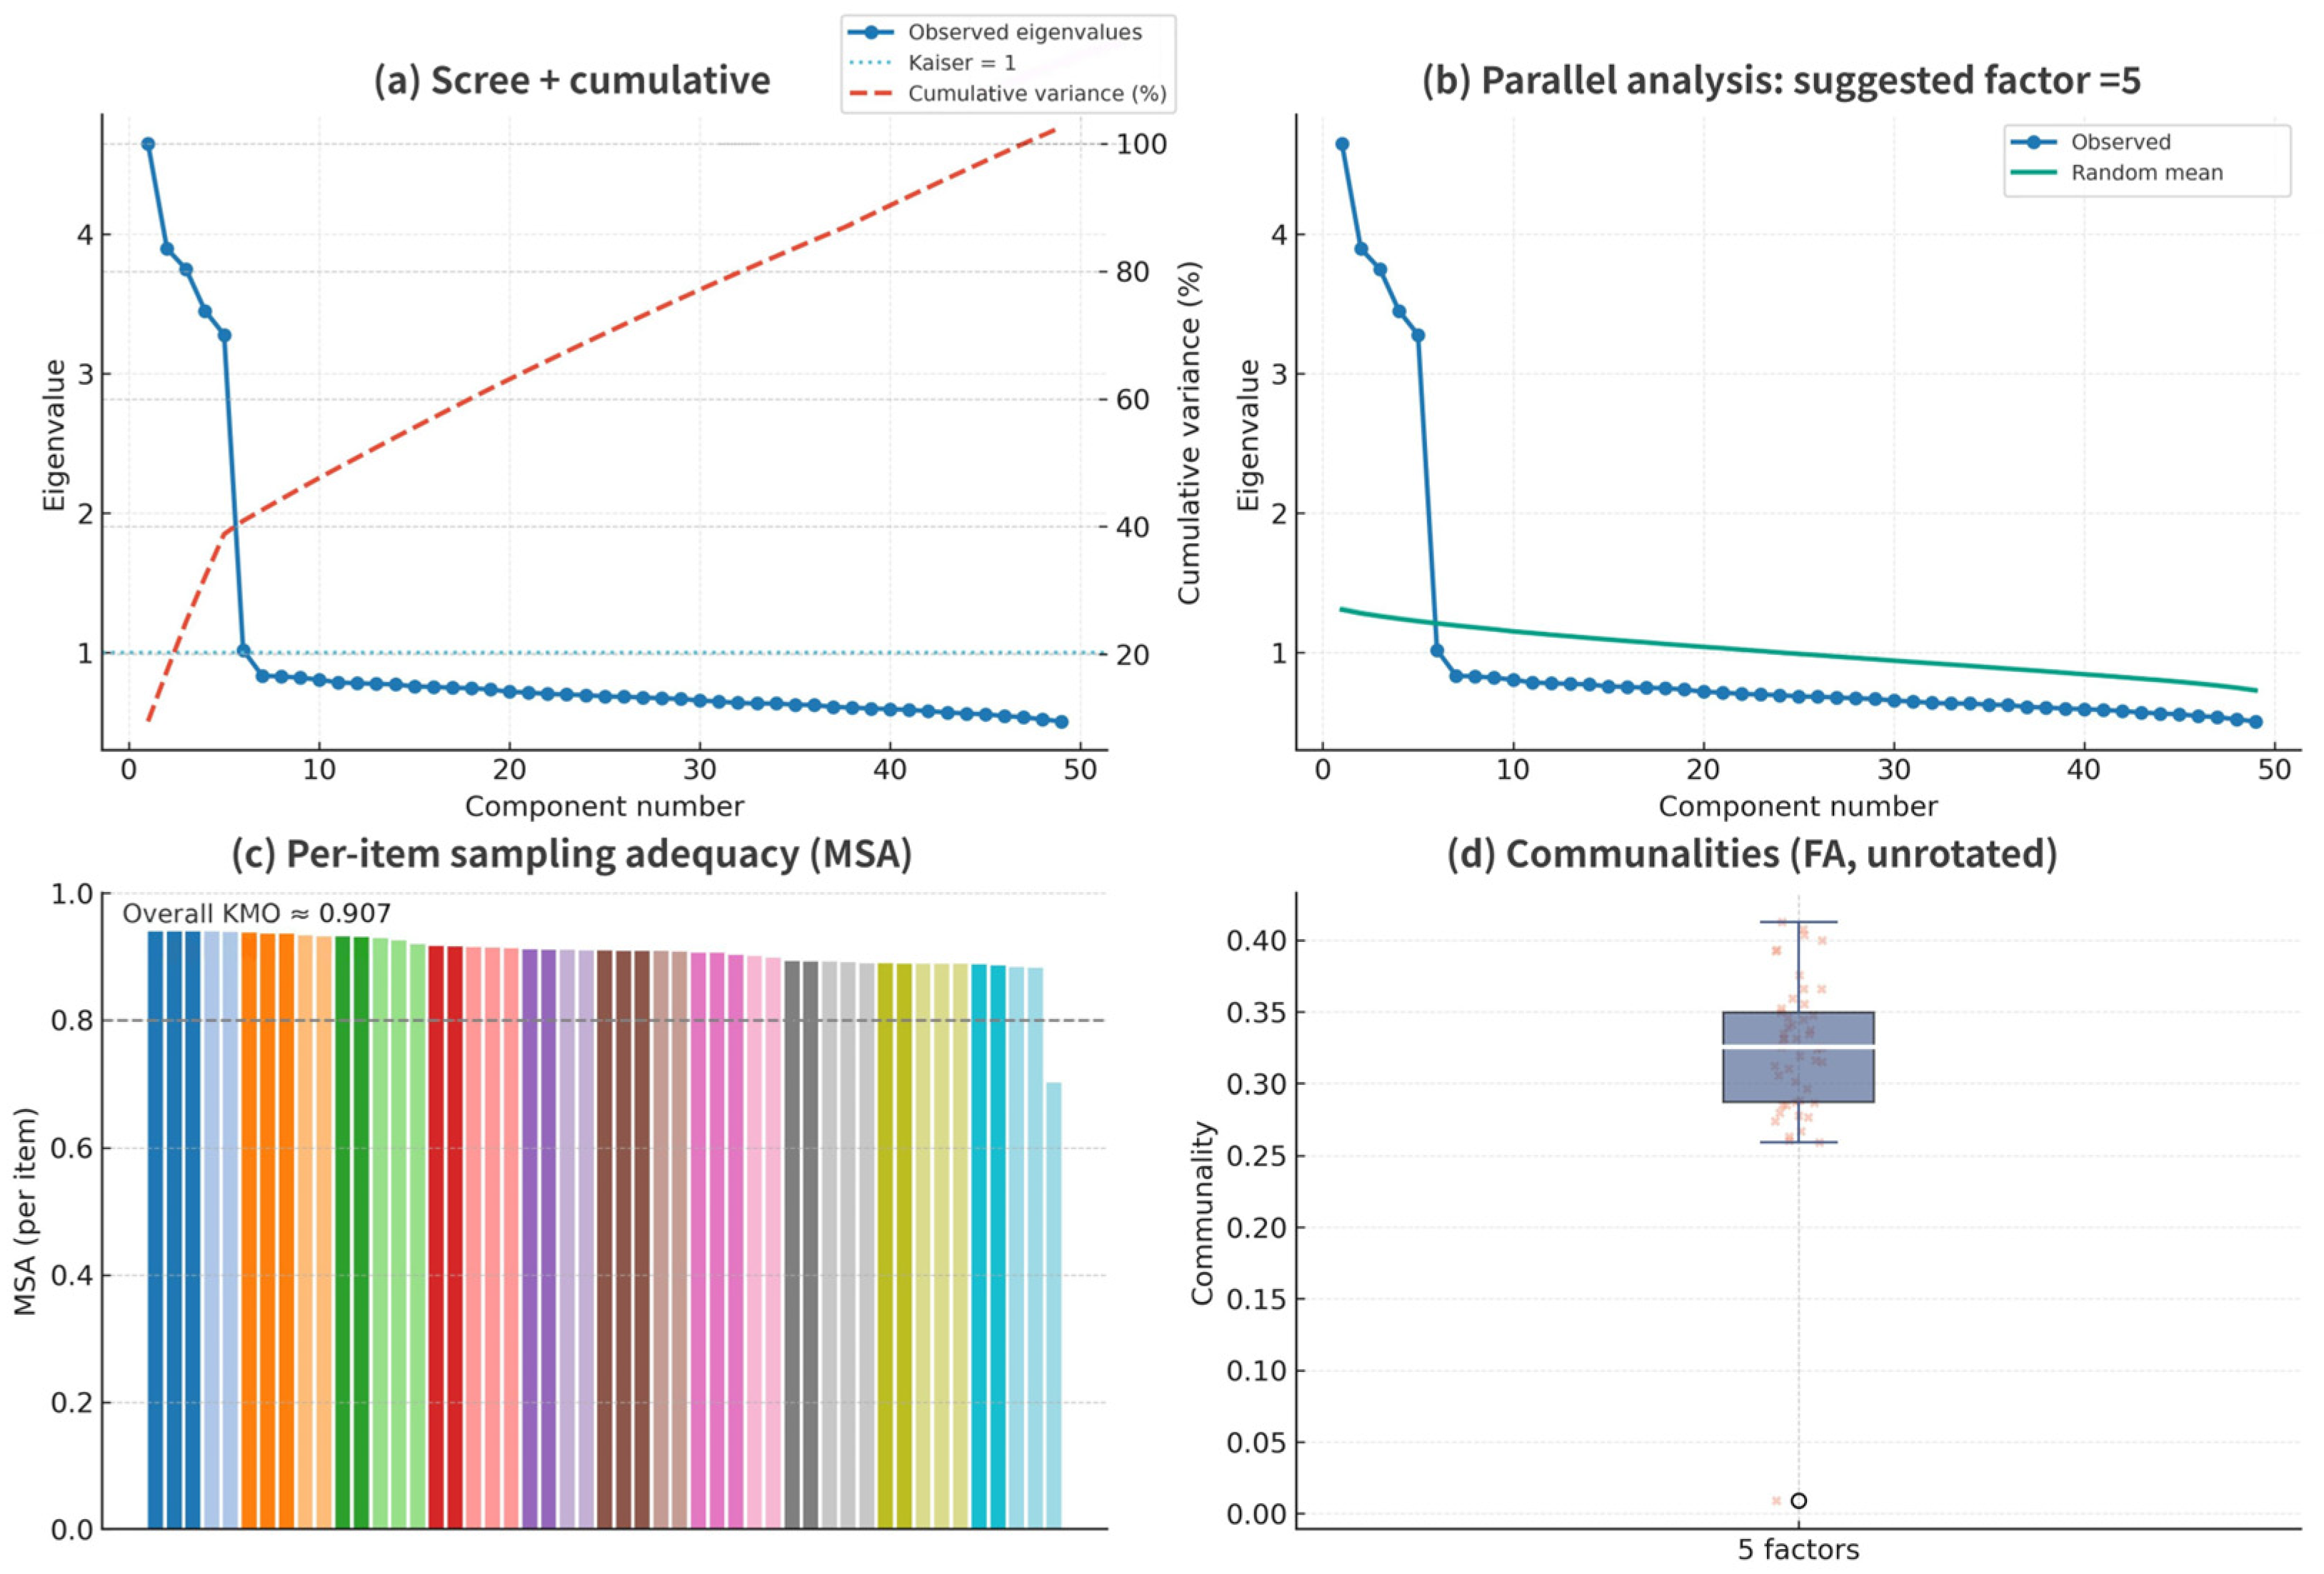
We now state, up front, how each enhancement links to a quality indicator: reliability (α), sampling adequacy (KMO/MSA), factorability (parallel analysis), item discrimination (item–total), and image level controls (constant sky/optics/materials). Corresponding summaries are provided in Table 3 and Figure 3.
The measurement quality is acceptable (α/KMO in Section 4.1), the latent structure is factorable (scree/parallel analysis in Figure 4), and the attribute level functions exhibit the expected nonlinearity (Figure 5 and Figure 6). The posterior uncertainty and SEM fit indices are summarized in Tables S1–S4 to support the threshold claims without over-interpreting point estimates.
Anchored in the “resilience–sense of place–landscape configuration preference” measurement chain, two waves of small-sample pilot testing and one round of structural refinement were completed prior to formal deployment. The first wave checked item semantics and polarity balance for the 35-item Part A and 15-item Part B; the second wave re-examined item discrimination under unified instructions and randomized ordering. The pilot indicated that Part A achieved an acceptable upper-bound of internal consistency, while Part B exhibited higher coherence among the facility–governance sub-dimensions. Subsequent edits focused on simplifying reverse-coded wording and unifying terminology for lighting and traffic. In the formal public sample, internal consistency stabilized as follows, as in Table 3: Part A Cronbach’s α = 0.748, Part B α = 0.839, whole form α = 0.765; KMO = 0.911, and Bartlett’s test was significant (χ2 = 33,831.23, d f = 1176). To avoid spurious “stability,” item-level screening combined item–total correlations with alpha-if-deleted, one item was temporarily set aside for low completeness and variance, preserving the backbone of the scale (Table A2 in Appendix A). The reliability assessment followed the classical expression—given k items with variances σ i 2 and a total-score variance σ T 2 ,
α = k k 1 1 i   σ i 2 σ T 2 ,
and constructability was corroborated by KMO’s ratio of correlation to partial-correlation energy,
K M O = r i j 2 r i j 2 + p i j 2
Equations (4) and (5). Maximum-likelihood factor extraction with Varimax rotation confirmed the latent structure; the number of retained dimensions was set by the eigenvalue-greater-than-one rule on the correlation matrix. Rotated loadings appear in Table 4; their stable distribution and constrained cross-loadings evidenced sufficient discriminant patterning among dimensions. As shown in Figure 3, the four core latents (attachment/identity, accessibility–safety, governance–maintenance, and adoption–participation) displayed loading profiles within acceptable bands across the pilot and formal samples, establishing a factorable base for subsequent cross-group comparisons and mediation analysis.

4.2. Core Relationships in Stage 1 (Public vs. Experts): Preference Structure and a Shared, “Governable” Vocabulary

Stage 1 deployed twin questionnaires for the public and for experts, sharing the Part A constructs while dividing Part B into bandwidth versus depth. The valid public sample (N = 3176) revealed an intuitive “use–comfort–safety” contour of preferences; the valid expert sample (N = 177) concentrated on rule-bound trade-offs of “governance–maintenance–emergency.” A minimally constrained multigroup structural equation model (MG-SEM) was specified: Part A’s four latents formed the measurement layer (with loadings anchored by the prior quality checks), and Part B’s sub-dimensions served as structural proxies. From “physical cues” to “adoption/participation,” the path system allowed group-specific structural paths with cross-group loading equality to secure comparability. For each individual i , the “sense of place” mediator M i aggregates inward from “accessibility–safety” and “governance–maintenance,” while the behavioral inclination Y i (maintenance/volunteering) draws from both design cues X i and M i :
M i = a X i + Γ Z i + ε i , Y i = c X i + b M i + Λ Z i + η i ,
with Z i denoting covariates; indirect effects were evaluated via a b and bias-corrected bootstrap confidence intervals in Equation (6). In the public group, the a and b paths were significant (95% CIs not spanning zero, FDR-adjusted p < 0.01 ) along two channels—“green shade–cover–recognizability” and “order–visibility–maintainability.” In the expert group, significance concentrated on executable vocabularies such as “uniform lighting–glare control” and “speed–cross-section–separation.” The divergence is not merely in mean magnitudes, but in governability: expert-side path coefficients map directly to engineering parameters (photometric distribution, sectioning, and lane discipline), whereas public-side coefficients align more closely with experiential scales of use and perceived safety. To ensure this can be examined against image-based scenarios, the four Stage 1 latents were standardized to Z-scores and factor scores were computed by
F ^ = W ( x μ ) Σ 1 / 2 ,
where W is the regression-type factor-score weight matrix and Σ the covariance matrix in Equation (7). The scores were then aligned to Stage 2’s attribute-level utility functions, forming a bridge from measurement to choice (Table 5). A critical signal here is that public and expert directions are largely concordant; differences arise in the locations of thresholds, redundancy, and bounds. The same physical cue yields different marginal-benefit intervals across groups—a phenomenon quantified next by the scenario-based analysis.

4.3. Stage 2 Scenario Preferences: Attribute–Gradient Functions, Thresholds, and Group Differences

Stage 2 used image-based stimuli comprising seven elements, each with five ordered levels (A–E). Public and expert respondents answered the same questionnaire on the same scale (valid public N = 978; valid expert N = 91). Treating the five-level within-attribute gradients as ordered levels, a hierarchical Bayes mixed-utility model was estimated to recover posterior distributions of individual-level heterogeneity. For individual i , the latent utility for an item is
U i , a , l = β 0 i + β a l , i + ξ i C + ϵ i , β a l , i N ( β ¯ a l , Σ a ) ,
with a { 1 , , 7 } indexing elements and l { A , , E } indexing levels; C collects controls (item order, block, and attention checks). Group-level hyperparameters took normal–inverse-Wishart priors in Equation (8). After estimation, { β ¯ a l } were shifted to sum-to-zero constraints for cross-attribute comparability. To test for inverted-U/threshold responses, quadratic and segmented forms were added for each attribute:
Δ U a , l     θ 1 , a L + θ 2 , a L 2   o r   Δ U a , l     ϕ 1 , a 1 ( L L ) + ϕ 2 , a L L + ,
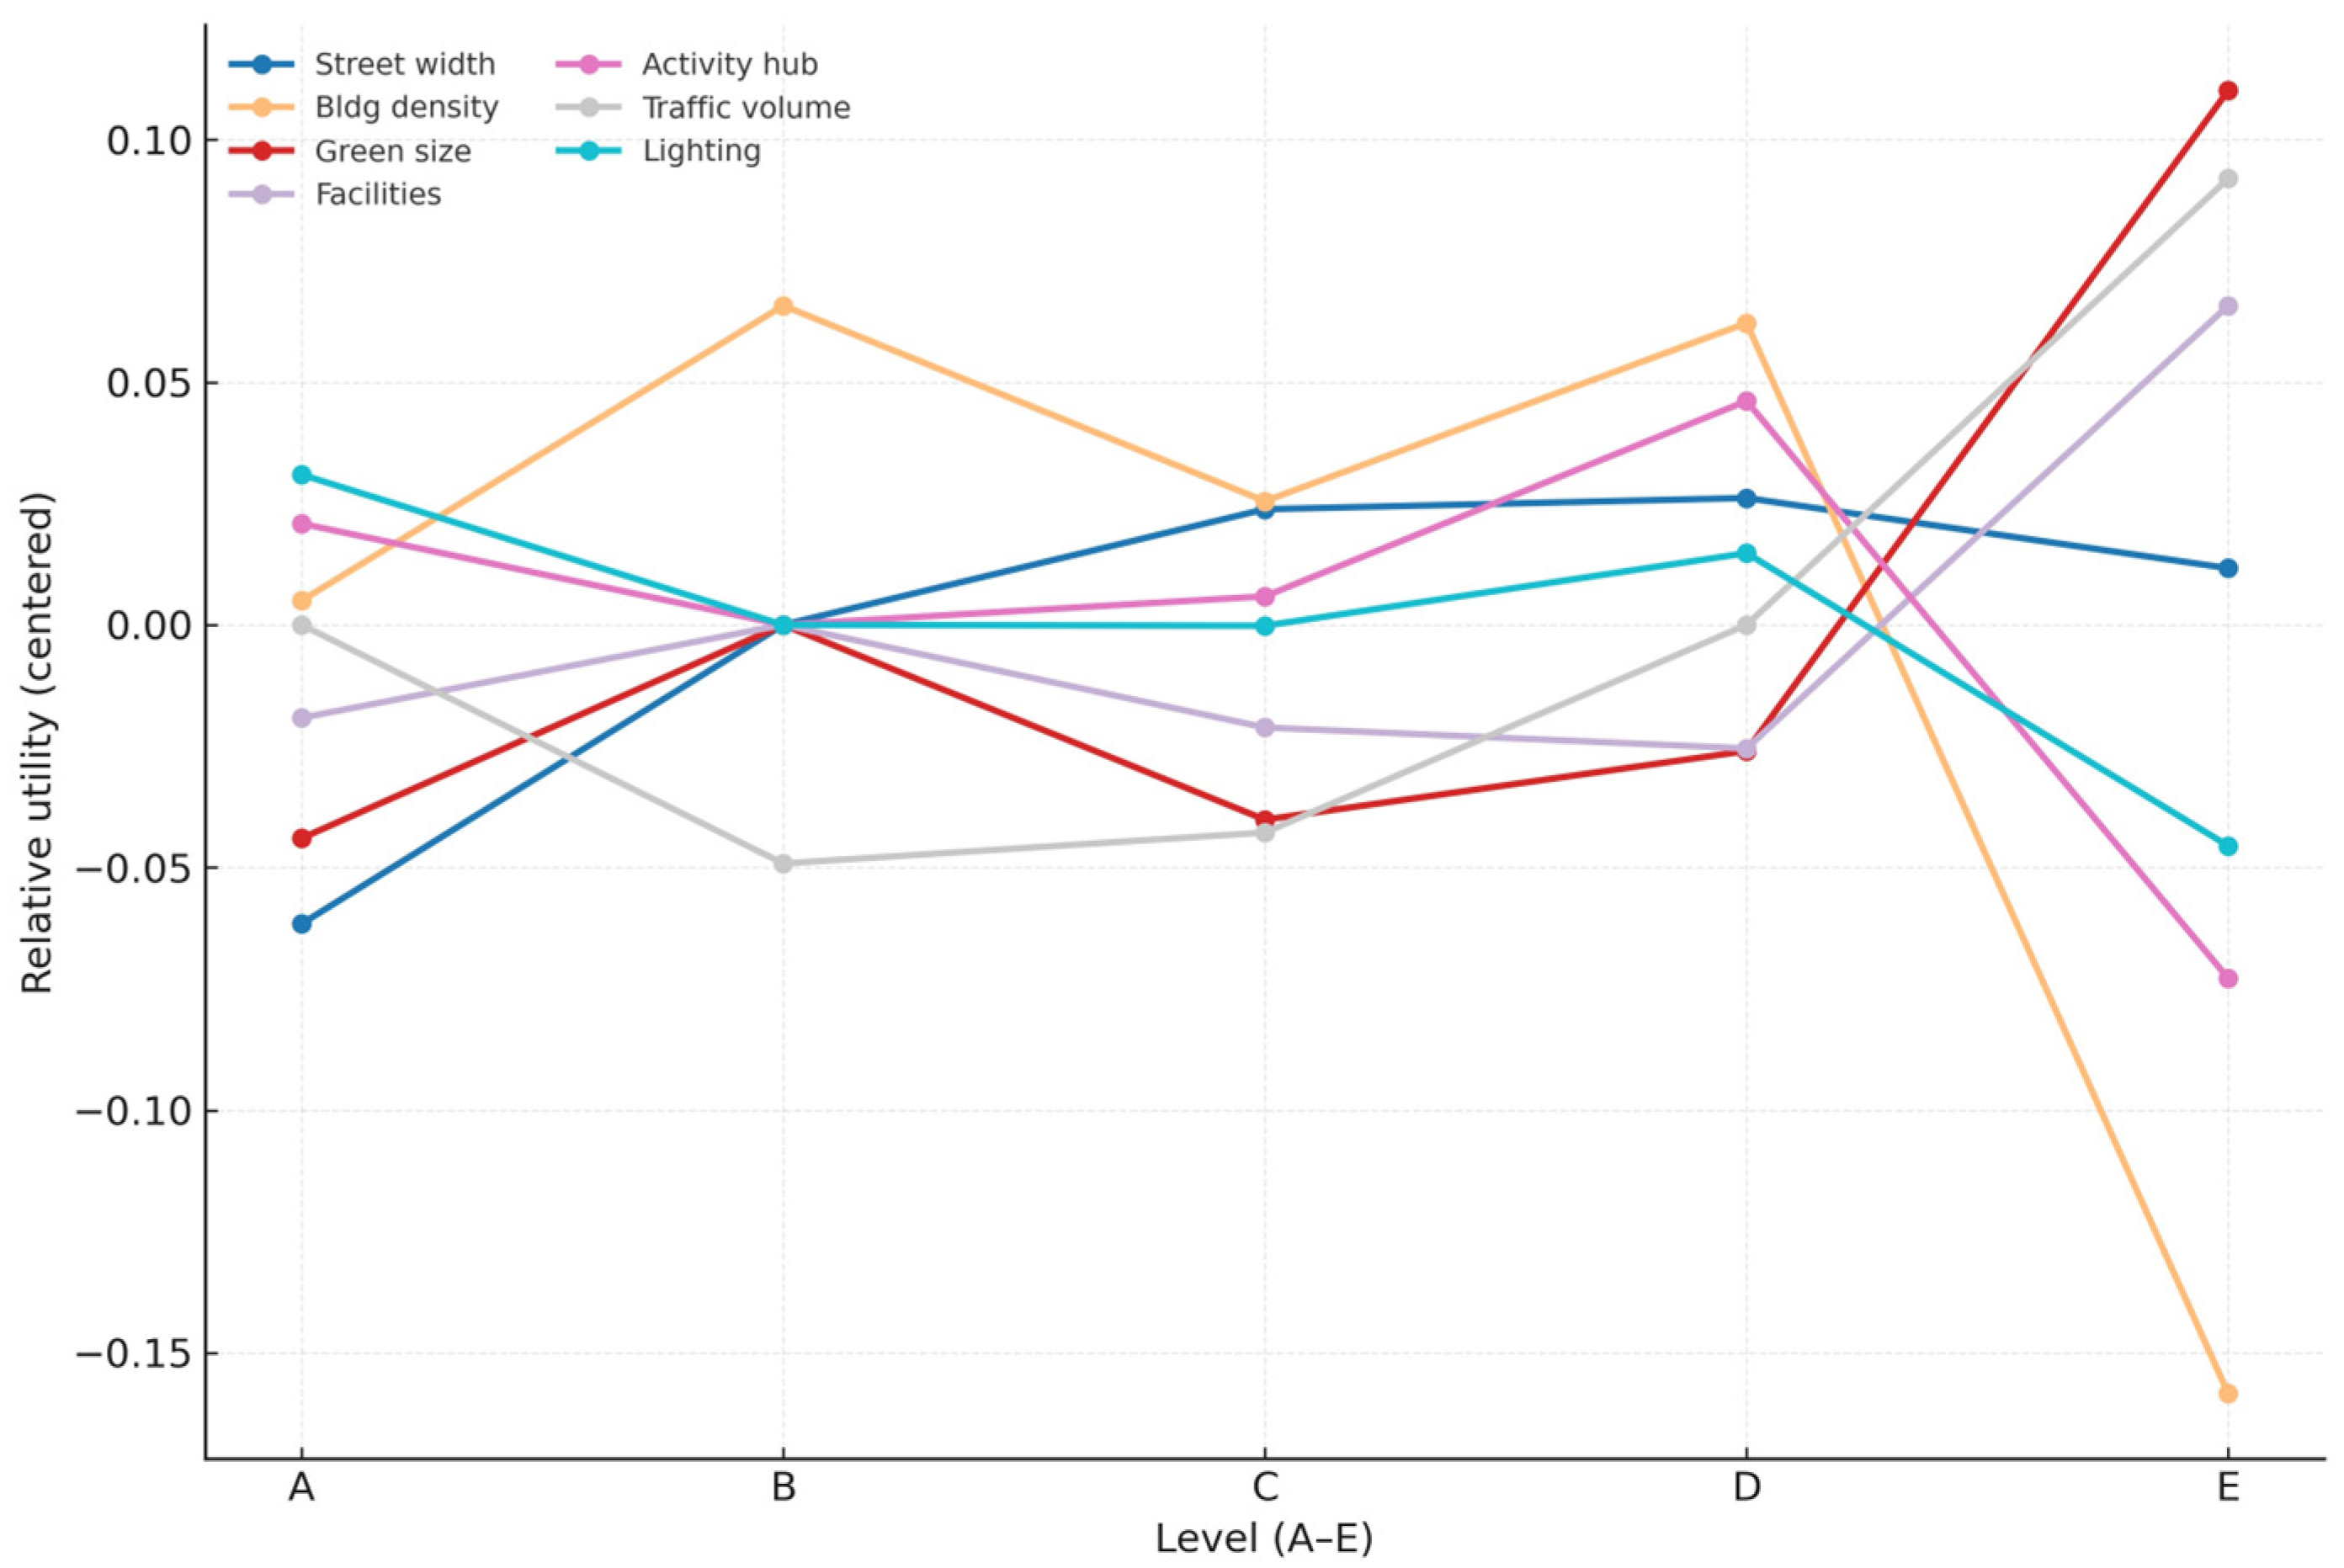
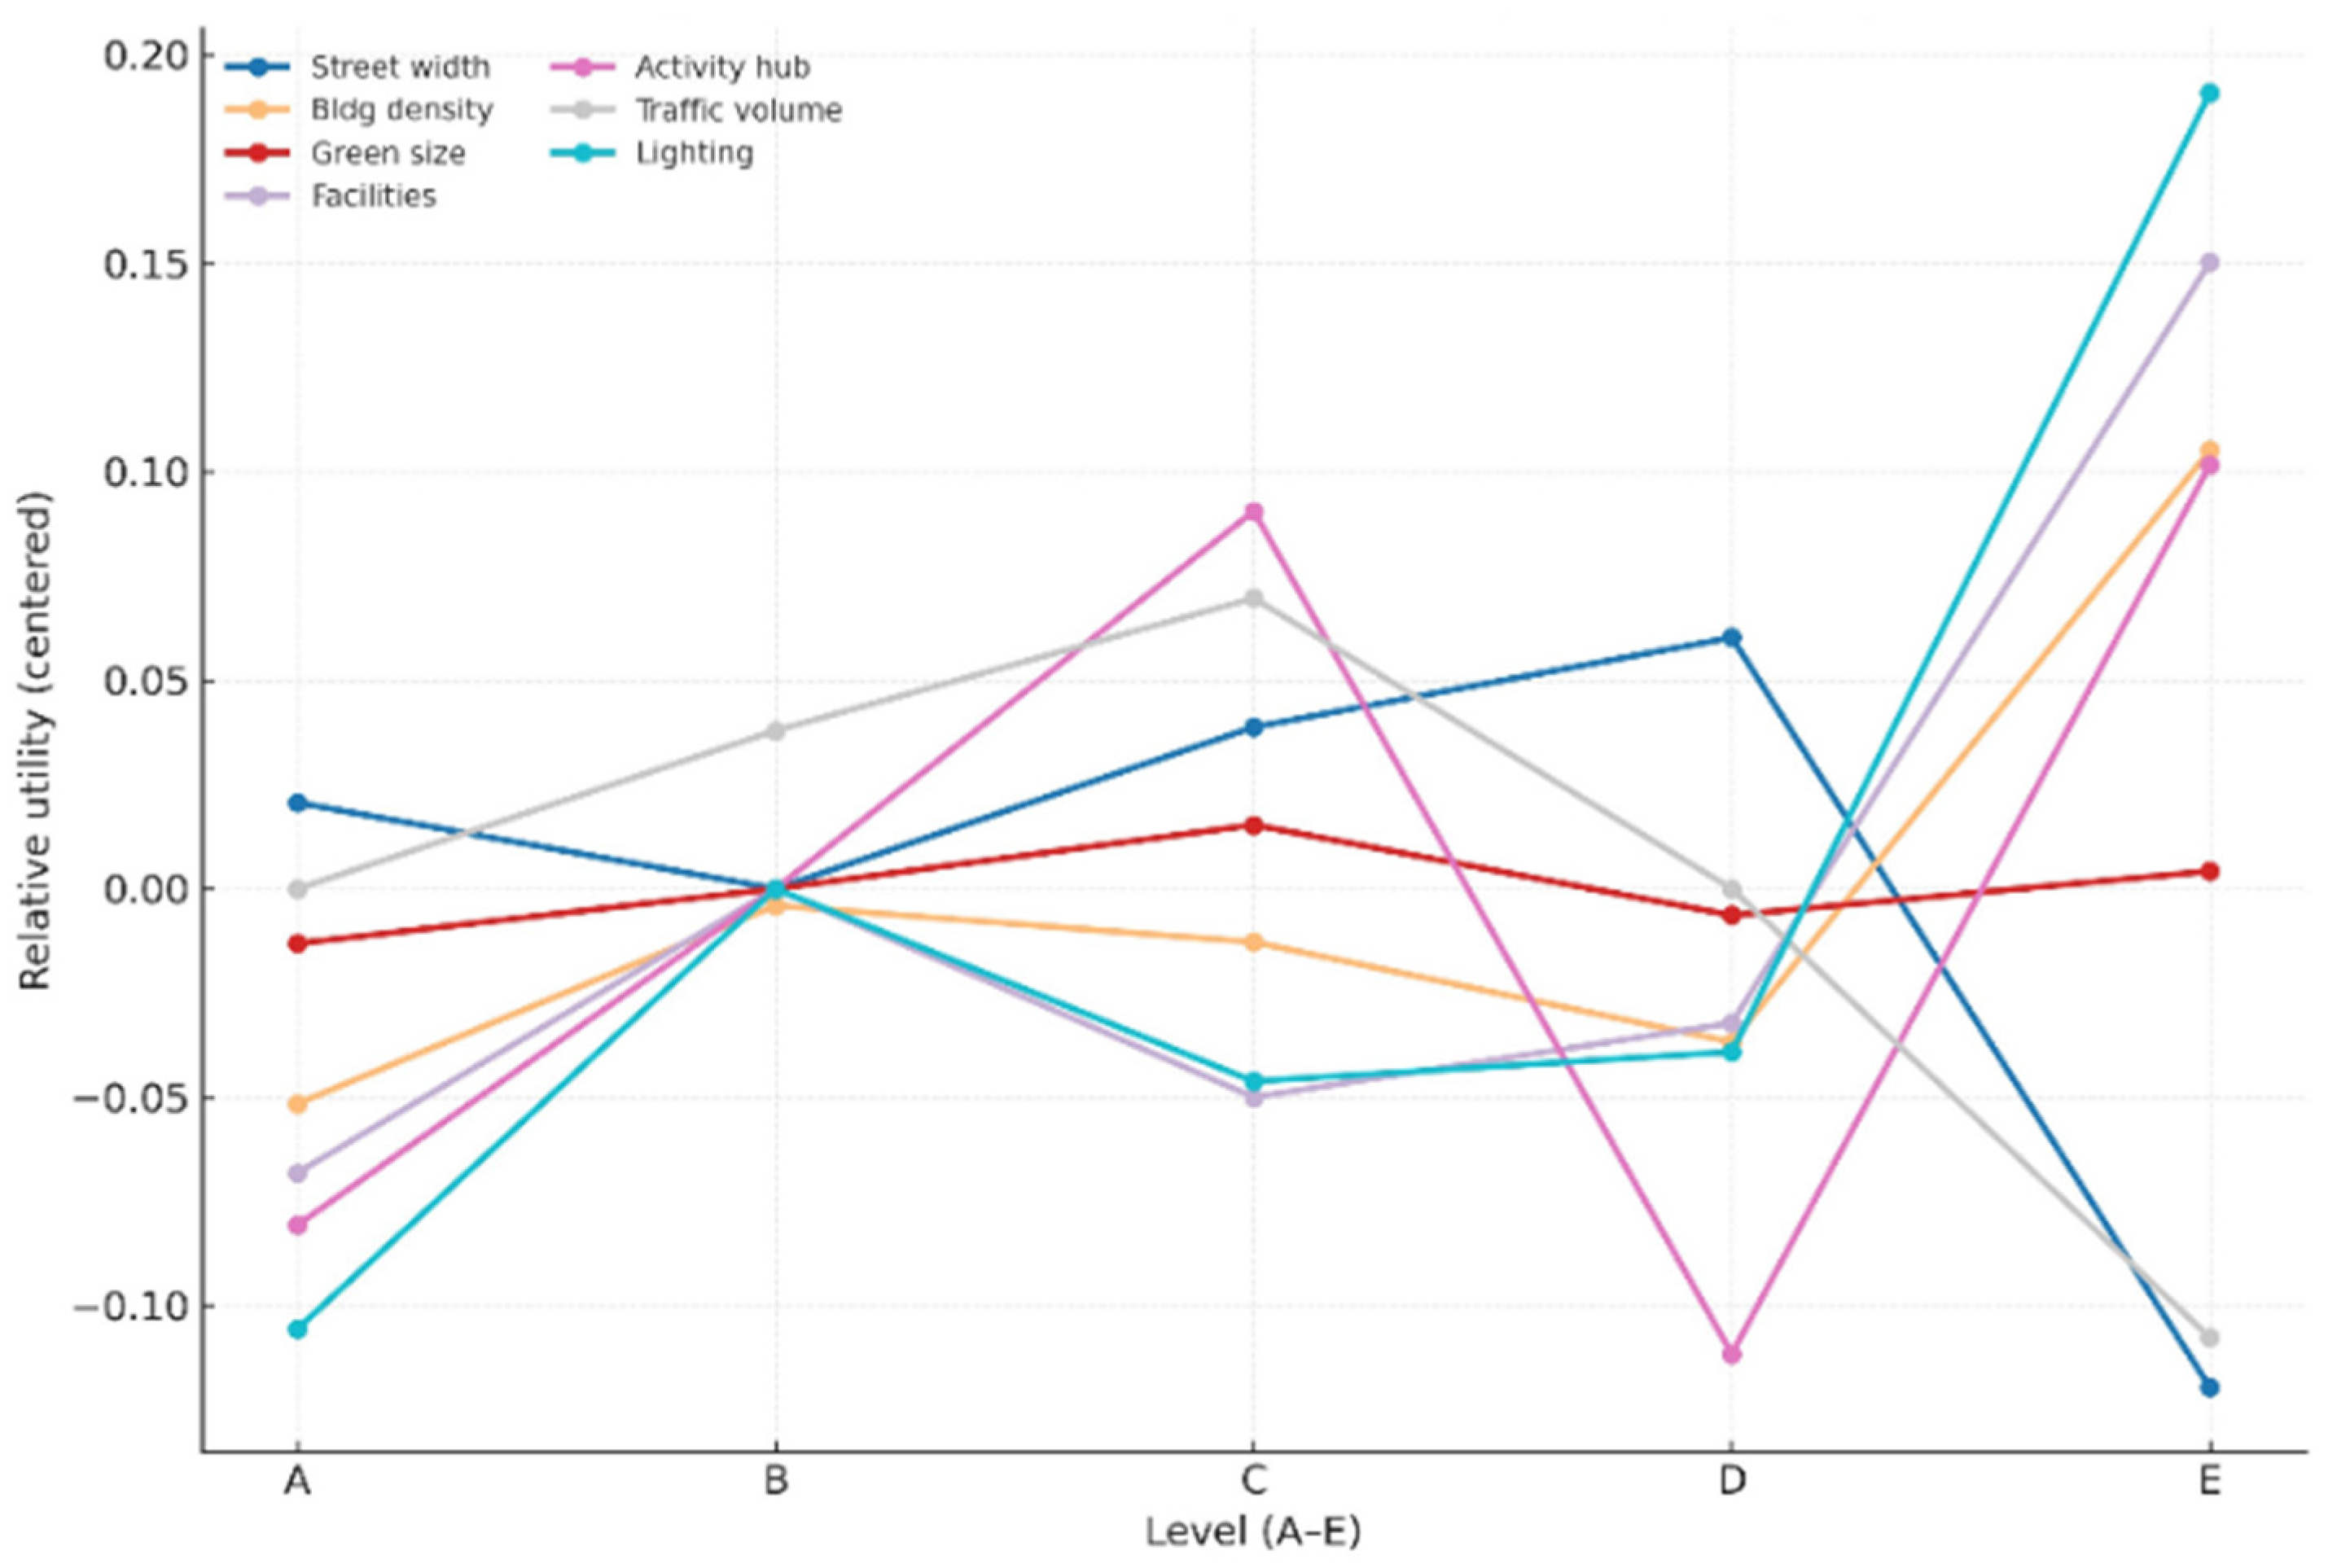
with L being the numeric encoding (A = 1, …, E = 5) and L the optimal threshold estimated by profile likelihood and WAIC comparison in Equation (9). Figure 4 shows the resulting preference curves. For street lighting, the public group exhibits a marked inverted-U: the marginal gain peaks from C to D and drops at E, while experts retain a positive but attenuating slope from D to E—indicating that glare and physiological load induce earlier reversal for the public, whereas “extreme safety redundancy” delays reversal for experts. Green space size provides a counterpoint: public preference rises monotonically toward E and then flattens; experts peak around D and decline slightly at E, reflecting sharper governance of “maintenance and spatial efficiency.” Traffic volume trends downward in the public sample and shows a “low–mid plateau with mild high-end decline” among experts, which favors embedding lane allocation, speed management, and intersection shaping into the governance grammar. Building density is not significantly monotonic in either group; the signal lies in interface quality with wind/light co-effects rather than density per se. Facilities and activity centers display public sensitivity to “variety–usability” and expert sensitivity to “congestion–conflict–maintenance,” with a broad overlap around C–D. As in Table 6, key quadratic/threshold terms remain significant at FDR-controlled p < 0.01 , and leave-one-block and order-resampling checks preserve directionality.
To project “scenario preference” onto deployable configurations, posterior means β ¯ ^ a l were composed into a resilient landscape configuration score:
S ( L ) = a = 1 7   w a β ¯ ^ a , L a ,
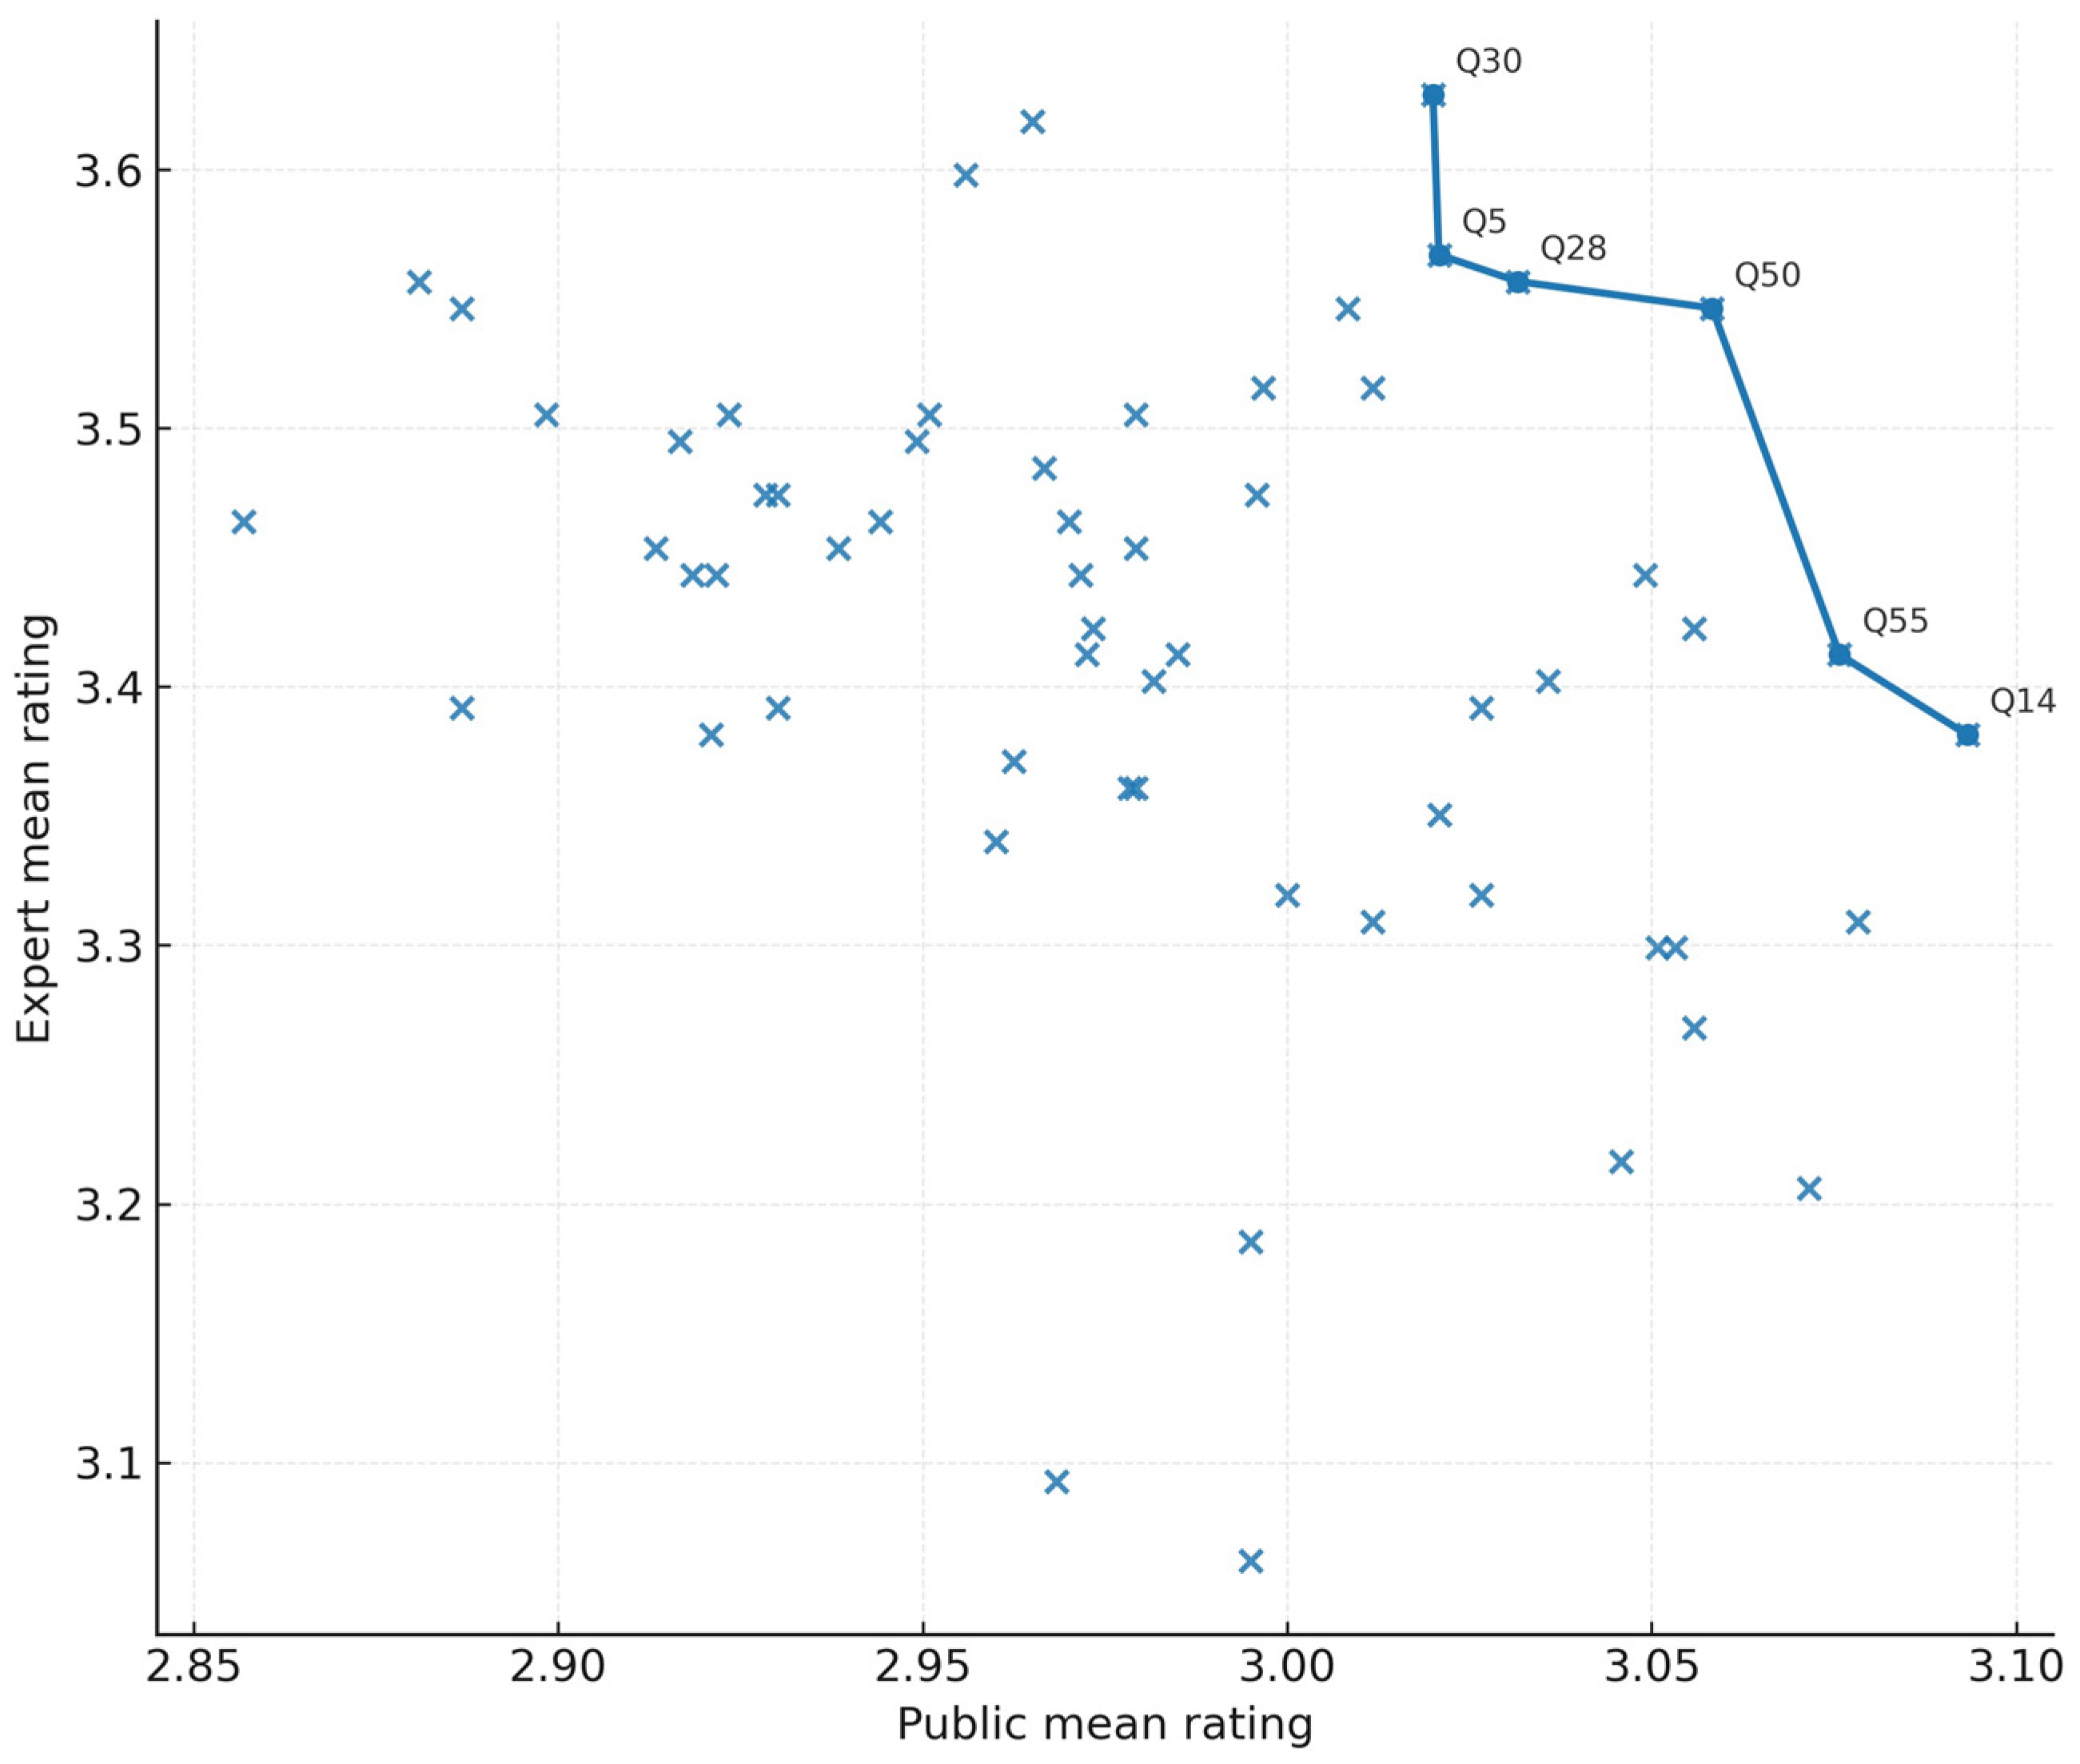
where L = ( L 1 , , L 7 ) specifies the chosen levels and w a is a data-driven multi-objective weight vector spanning health, safety, climate, and governance in Equation (10). Public and expert weights were normalized from Stage 1 latent scores on “governance–maintenance” and “safety–accessibility.” The resulting configuration frontiers (Pareto approximations) appear in Figure 5 as contour surfaces: the public-side optimum skews toward “green E, lighting D, traffic B–C, facilities D, activity center D, density C–D, and width C,” while the expert-side optimum favors “green D, lighting D–E, traffic C–D, facilities C, activity center C, density D–E, and width C–D.” Frontiers overlap most along “lighting D,” “green D,” “width C–D,” and “mid-low traffic,” which serve as consensus anchors; the sharpest divergences appear at the upper bounds of lighting E and green E, and in the marginal scale of facilities/activity centers.

4.4. Mediation by Sense of Place: The Causal Chain from Physical Cues to Adoption and Collaboration

To explain why identical physical configurations perform differently across populations and communities, Stage 2 attribute-level choices were converted into individual-level scenario-preference indices and aligned with the four Stage 1 latents for a unified multigroup SEM mediation. With ordered responses linked by thresholds, each seven-point item was standardized and aggregated to an attribute-level score. The structural layer has been outlined in Section 4.2; the estimation and significance proceeded as follows. First, an ordered-Probit GLMM corrected item-level responses for individual- and item-random effects:
P ( Y i j t k ) = Φ ( τ k η i j t ) , η i j t = γ X j t + u i + v t ,
with thresholds τ k and random terms u i and v t . Linear predictors η ^ i j t were aggregated to attribute-level preference scores in Equation (11). Second, these scores entered the mediation equations as observed proxies for X i , and 5000 bias-corrected bootstrap draws delivered CIs for indirect effects. Group differences were tested via the likelihood-ratio Δ χ 2 under path-equality constraints and Fisher’s z for path-wise comparisons.
In the public group, the combined “green shade–cover–recognizability” preference showed a significantly positive indirect effect on “adoption/participation” via attachment/identity, with a b ^ > 0 with 95% CIs not crossing zero. The preference for “uniform lighting with glare control” mediated through perceived safety also showed a significant positive effect on collaborative governance, with larger effects among women and those with a lower nighttime outing frequency. In the expert group, mediation concentrated on “low-exposure traffic—sectional order—visibility,” and c (direct effects) shrank but did not vanish across most channels, indicating that beyond affective/identity pathways, professional norms and risk-management beliefs retain independent contributions. Path coefficients transformed to Fisher’s z revealed a higher mediation proportion via attachment among the public and a higher mediation proportion via governance/maintenance beliefs among experts (Figure 6; Table 7). Releasing the path “lighting D → attachment” yielded a significant fit improvement ( Δ χ 2 significant), consistent with the inverted-U: moving from C to D raises “being seen” without breaching glare, benefiting attachment and safety concurrently; moving to E, glare and ecological costs tear the comfort–safety overlap and public preferences retreat first.

4.5. An Integrative Account and New Insights into Resilient Landscapes

Merging the Stage 1 measurement structure with Stage 2 scenario choices yields an operational framework: resilience does not come from “more of everything,” but from finding bounds and thresholds across being seen–being shaded–being used. From being seen, lighting and interface transparency are the bedplate for night safety and signals of order, yet public comfort and ecological sensitivity confine the bedplate to a temperate high—level D. From being shaded, canopy is the first buffer against thermal and radiative exposure; public monotone gains and expert D-peaks both point to canopy integrity and maintainability as the levers. From being used, the marginal scale of facilities and activity centers must track the cost curve of order–conflict–maintenance; public diversity preferences and expert focus converge around levels C–D. Folding these bounds under multi-objective weights forms two partially overlapping frontiers—one tilting toward everyday use and social repair, the other toward governance redundancy and extreme safety. They coincide most around green D, lighting D, width C, and mid-low traffic, which furnishes a shared foundation of sense of place.
Across Figure 3, Figure 4, Figure 5 and Figure 6 and Table 4, Table 5, Table 6 and Table 7, the chain from scales to scenarios, preferences to configurations, and intuition to governance is continuous: pilot–formal consistency secures traceability; attribute–gradient functions reveal nonlinearity and thresholds for the seven elements; hierarchical Bayes recovers individual–group heterogeneity; and the unified SEM discloses the mediation “physical cues → sense of place → adoption/collaboration.” The significance of mediation does not stem solely from “emotion–aesthetics.” When “being seen” for safety and “being shaded” for thermal comfort are placed on the same ruler, gains in attachment/identity consistently convert to tendencies for participation and maintenance. The pattern resonates with recent high-impact findings: remote-sensing–ground coupled studies show context-specific optima of canopy and form across city types [73]; spatially optimized greening demonstrates that where and how much jointly determine reductions in population heat exposure [74]; and image/street-view evaluations repeatedly indicate empirical links between perceived safety and CPTED visibility cues, with diminishing returns near the upper bounds of illuminance–CCT–uniformity [75]. These three lines dovetail with the present “level-D consensus/level-E divergence,” giving a more falsifiable and deployable basis for resilient landscape guidance.
Taken together, three transferable insights emerge. First, thresholds can be written into design: for lighting and canopy, the D-band is the overlapping optimum of being seen, shaded, and used; photometric distribution, CCT, uniformity, and canopy integrity, connectivity, and maintenance should be expressed as quantitative engineering targets while avoiding over-stepping into E. Second, mediation can be written into governance: the public’s higher mediation share through attachment/identity argues for legible, continuous, and recognizable elements as handles for co-production and stewardship; the expert-side’s higher mediation share through governance/maintenance beliefs calls for institutional and O&M alignment translating “cross-section, speed, separation, lighting, and arboriculture” into a cross-department execution list. Third, combinations can be written into scenarios: posterior preferences over seven attributes can shape configuration frontiers, treating consensus zones as the “citywide baseline” and divergence zones as “community negotiation menus,” guiding deployment across street types and population structures. Resilience thus grounds itself in a triad of visible order, shaded comfort, and usable sociability, not as a slogan but as a configuration logic with thresholds, bounds, and governable translations.

5. Conclusions and Outlook

5.1. Theoretical and Methodological Contributions

Urban resilience is not a set of abstract aspirations but a pathway that can be measured, chosen, and deployed. This study translates the chain “sense of place–landscape configuration preference–resilience performance” into an evidence architecture spanning measurement–scenario–combination: at the measurement layer, four latents are identified—attachment/identity, accessibility–safety, governance–maintenance, and adoption–participation; at the scenario layer, seven elements are rendered with five graded levels each; at the combination layer, a hierarchical Bayesian preference function and multi-objective weights synthesize a configuration frontier. The triad of being seen, being shaded, and being used is thereby operationalized into computable thresholds, bounds, and redundancy controls, explaining why public and expert judgments locate different marginal intervals on the same physical cue.
The first methodological contribution lies in bridging measurement and choice. By mapping Stage 1 factor scores to Stage 2 attribute-level utilities, “psychological constructs” and “choice behavior” are no longer segregated, enabling identification of the mediation chain physical cue → sense of place → adoption/collaboration within a single statistical framework. The second contribution is making thresholds and inverted-U patterns testable: each of the seven elements is endowed with quadratic and segmented terms, moving beyond linear or monotone assumptions. The empirical prominence of lighting at level D, the diminishing returns of green at level E, and the consensus band for facilities/activity centers around C–D all emerge with clear functional forms and quantified uncertainty. A third contribution is the multigroup-comparable structure: with loading equality and group-specific structural freedom, public–expert differences are not washed out by averaging; the governable vocabulary—photometric uniformity and glare control, and section–speed–separation parameter domains—stands alongside psychological pathways in a coherent system. A fourth contribution is the group decomposition of mediation shares: attachment/identity accounts for a larger share of mediation on the public side, whereas governance–maintenance beliefs weigh heavier on the expert side; this yields a practical rule—consensus elements cluster near level D, and contested elements emerge at the upper bound—and maps “consensus” versus “negotiation” to distinct deployment lists.
At the theoretical level, a fifth contribution is to explicitly install sense of place as a bridging variable for resilient design. Once safety through being seen and thermal comfort through being shaded are placed on a common ruler, gains in attachment/identity reliably convert into adoption and collaboration tendencies, embedding social capital and stewardship within a replicable spatial design pathway. A sixth contribution extends from preference functions to configuration frontiers: posterior preferences across seven elements are multi-objective-weighted to visualize Pareto-like surfaces, separating a citywide baseline (green D, lighting D, width C, and mid-low traffic) from a community negotiation menu (lighting E, green E, and upper-scale facility/activity programs), thus supplying transferable boundary conditions for scenario-based governance. A seventh contribution translates expert consensus into engineering parameters: lighting at level D becomes a tractable interval in photometric distribution, CCT, and uniformity; and the delta between green levels D and E is encoded as a bi-objective of canopy integrity and maintenance craft. The resulting quantification reconciles professional and public semantics; experimental evidence on night-walking security similarly indicates diminishing returns and group differences near upper bounds of illuminance–uniformity–glare, corroborating the threshold depiction herein.
An eighth contribution is the endogenous robustness of scenario modeling. With randomized ordering, block controls, and leave-one-block diagnostics, key threshold terms maintain directional stability across resampling; hierarchical shrinkage stabilizes sparse individual posteriors and avoids “winner-takes-all” estimation bias. A ninth contribution provides a joint account of equity and resilience: the preference function and the being seen–being shaded–being used triad create actionable levers for the chain linking “green justice–mental health–participation,” aligning with recent structural models and signaling that spatial allocation and experiential thresholds must co-enter the resilience agenda. A tenth contribution scales the semantics of trade-offs: in the nature-based solutions literature, mismatches of time–space scales and language impede transfer; by encoding seven elements into comparable levels and visible frontiers, this work furnishes engineering anchors to ease those frictions.

5.2. Limitations and Solvable Paths

Ecological validity constrains cross-context inference. Image-based scenarios excel at internal validity and replicability but cannot fully render multi-sensory cues—wind, noise, and odor—nor the dynamics of summer heat spikes or nocturnal glare. This is a boundary of method rather than a directional bias in findings; once VR/AR and wearables are integrated, physiological–environmental linkages can calibrate thresholds at the mechanism level, straightforwardly extending the present pipeline.
Sample representativeness can be refined. The public–expert frames cover age, gender, occupation, and spatial heterogeneity, yet long-tail occupation strata and low-frequency night travelers may still be under-sampled, potentially underestimating sensitivity thresholds for lighting and safety. Augmenting targeted sampling for under-represented groups and applying frequency-stratified weighting would sharpen bounds without altering the overall directional signals.
Causal identification remains a common challenge. SEM and HB-DCE are strong for structure and preference recovery, while external validity from “configuration to behavior” calls for field interventions and instruments. Because the threshold bands and consensus zones are already expressed in engineering units, block-level A/B retrofits with difference-in-differences timelines are fully feasible and would consolidate causality in an implementable way.
Cross-element interactions are not exhaustively modeled. Current specifications emphasize within-element gradients and additive utilities across elements; higher-order nonlinearity—green × lighting, density × wind corridors, and facilities × traffic organization—will benefit from larger samples, sparse hierarchies, and structural priors. Given the clarity of main-effect thresholds, this gap does not diminish the applicability of configuration frontiers; it points to fine-grained, localized optimization as the next tractable step.
Our one-factor progressions prioritize threshold identification and internal validity; they do not capture the full multi-sensory dynamics of real streets. We therefore explicitly treat the composite judgments as a realism check and report them alongside the progressions. Future field or VR extensions can calibrate higher order interactions (green × lighting and density × wind) using the same parameter vocabulary.

5.3. Ten Directions for Future Research and Governance Translation

Resilience materializes through continual learning and rapid iteration. (1) Quasi-experiments may be implemented for scenarized interventions: around the “level-D consensus,” deploy A/B combinations of photometric distribution–CCT–uniformity and canopy integrity–pruning craft across street types, co-tracking night pedestrian flows, dwell times, and heat metrics to build causal chains and test transferability of thresholds. (2) Immersive, multi-modal measurement may be used: integrate VR/AR with eye-tracking, EDA, and skin-temperature wearables synchronized with choice tasks, restoring the short-horizon weights of glare, shading, noise, and wind; existing night-walking security paradigms offer immediate task scaffolds. (3) Dynamic provisioning and smart control may be implemented: embed threshold functions into adaptive lighting and variable-speed systems, exploring real-time switching by pedestrian density and micro-meteorology; use policy sandboxes to locate optima under the joint goals of energy, safety, and ecology. (4) A cross-department “governance lexicon” can be used: translate upper/lower bounds from configuration frontiers into shared parameter libraries and acceptance items for transport, lighting, public works, and arboriculture, forming “hard constraints + soft intervals” that reduce interdepartmental semantic friction. (5) A spatial ledger for equity–resilience co-benefits can be used: use threshold bands for green and activity centers to tune the co-budgeting of resource distribution and mental health, writing “who benefits where” explicitly into annual audits and block profiling. (6) Interactions via interpretable sparse hierarchies can be implemented: augment the HB-DCE/SEM backbone with hierarchical sparsity priors to recover explainable boundary shapes for green × lighting and density × wind corridors, using Bayesian model averaging to temper specification uncertainty. (7) Cross-cultural replication and local calibration can be used: replicate in diverse climates, cultures, and norms to compare drift in threshold bands and shifts in mediation shares of sense of place, assembling a two-way calibration between global patterns and local standards. (8) Temporal panels and behavioral consolidation can be used: link pre/post-retrofit trajectories, social ties, and participation into panels, testing whether gains in attachment/identity consolidate into stable maintenance and mutual-aid behaviors over 6–12 months. (9) Multi-source fusion of imagery, street view, and remote sensing can be implemented: use street-view visual features and canopy/shade RS priors to back-cast preference functions, developing “questionnaire-free, weakly supervised” extrapolation that accelerates scaling from point experiments to city deployment. (10) Governance playbooks for consensus vs. negotiation can be implemented: hard-code the citywide baseline into standardized methods and maintenance contracts; embed the community negotiation menu into participatory budgeting and micro-renewal, institutionalizing the triad of visible order, shaded comfort, and usable sociability so that sense of place compounds into long-horizon collaborative resilience. Relative to NbS trade-off reviews that diagnose scale–semantic mismatches, this playbook uses thresholds and frontiers as cross-scale aligners, easing insertion into operational stacks.
In sum, the ten directions orbit threshold-based design, mediation-informed governance, and combination-centric deployment. Thresholds make the risks of “excess” and “deficit” explicit; mediation channels the psychology of emotion–identity–order into the grammar of governance; and combinations move the seven elements from single-objective tweaking to negotiable frontiers. Cities do not require unbounded inputs; they require firm anchoring near level D, where visible order, shaded comfort, and usable sociability are delivered with discipline. A verifiable, replicable, and iterable evidence chain is the stepping stone for resilience to move from vision to rule and from experience to standard.

Supplementary Materials

The following supporting information can be downloaded at: https://www.mdpi.com/article/10.3390/urbansci9120501/s1, Table S1: Measurement Quality and Factorability; Table S2: Item Screening Diagnostics; Table S3: Model Forms and Robustness Checks; Table S4: Mediation Summaries.

Author Contributions

Conceptualization, P.S. and J.W.; methodology, P.S. and J.W.; software, Y.Z. and T.W.; investigation, Y.Z. and Y.L.; formal analysis, P.S. and Y.L.; data curation, Y.Z. and Y.L.; visualization, Y.Z. and T.W.; supervision, B.Z.; project administration, J.W. and B.Z.; funding acquisition, Y.L. and J.W. All authors have read and agreed to the published version of the manuscript.

Funding

This research was funded by the Fundamental Research Funds for the Central Universities, grant number 2023lzujbkyxs02.

Institutional Review Board Statement

Institutional Review Board Statement: The study was conducted in accordance with the Declaration of Helsinki and approved by the Institutional Review Board of University Name (protocol code: LZUWC0525, date of approval: 25 May 2025). All procedures involving human participants complied with the ethical standards of the host institution.

Informed Consent Statement

Informed consent was obtained from all subjects involved in the study.

Data Availability Statement

The datasets generated and analyzed during the current study are not publicly available due to the confidentiality agreements of our laboratory but are available from the corresponding author on reasonable request.

Acknowledgments

The authors are grateful for the financial support for this research.

Conflicts of Interest

The authors declare no conflicts of interest.

Appendix A

Table A1. Items mapped to corresponding constructs and references.
SectionConstructSub-
Dimensions
Items (n)Reverse
-Coded (n)
Response ScaleAnchorsItem Wording Cues
(Examples)
Measurement
Purpose
Notes
A (Shared)Place
attachment
(spirit of place)
Identity;
Dependence;
Belonging
935-point
Likert
(1–5)
Strongly
disagree →
Strongly agree
Belonging;
reliance on
local spaces;
identification
with street
character
Mediator
between
design cues and civic
action
Polarity-
balanced; randomized items
A (Shared)Perceived accessibility and continuityRoute continuity; Interface
legibility;
Wayfinding
825-point
Likert
(1–5)
Strongly
disagree →
Strongly agree
Easy to reach daily
destinations;
continuous
façades;
visible
entrances
Daily
usability and micro-scale coherence
Includes a cross-check on detours
A (Shared)Safety and nighttime visibilityNatural
surveillance; Guardianship; Glare tolerance
625-point
Likert
(1–5)
Strongly
disagree →
Strongly agree
Feel safe at night;
light helps
recognition;
excessive
brightness
uncomfortable (R)
Links
lighting with reassurance
Avoids
legal
wording
A (Shared)Thermal comfort and shadeShade
availability;
Radiant exposure; Resting
opportunities
625-point
Likert
(1–5)
Strongly
disagree →
Strongly agree
Enough shade to walk/rest;
surfaces reduce heat;
shaded seating
Proxy for heat-risk mitigationNeutral-season phrasing
A (Shared)Governance and
maintainability
Cleanliness;
Upkeep effort; Failure tolerance
415-point
Likert
(1–5)
Strongly
disagree →
Strongly agree
Furniture easy to maintain;
serviceable
lighting;
clutter
prevention
Translates to operations
constraints
Paired with reverse statement on over-
equipment
A (Shared)Adoption and participation willingnessSelf-efficacy;
Co-maintenance intention
205-point
Likert
(1–5)
Strongly
disagree →
Strongly agree
Willing to
co-maintain;
willing to
report failures
Bridge from
perception to action
Short to avoid social desirability buildup
B (Public—short)Use
preference
and
satisfaction
Walkability; Rest/play;
Visual comfort
615-point
Likert
(1–5)
Strongly
disagree →
Strongly agree
Choose this route daily; stay
comfortably
Utilitarian vs.
amenity choices
Placed after A to reduce anchoring
B
(Public—short)
Trade-offs of safety/
comfort
Lighting;
Shade;
Width priorities
525-point
Likert
(1–5)
Strongly
disagree → Strongly agree
Prefer stronger lighting even with glare (R);
prefer more
shade even
if narrower
Elicits
marginal preferences
Mirror-
polarity pairs
B (Public—short)Design
levers quick rating
Seven levers cues (1–7)405-point
Likert
(1–5)
Very low

Very high
Width; density; green;
facilities;
activity hub; traffic;
lighting
Priority snapshotScattered among other items
B (Expert—deep)Lighting
engineering preferences
Distribution; CCT;
Uniformity; Glare;
Mounting
715-point
Likert
(1–5)
Strongly disagree →
Strongly agree
Prefer
uniformity over peak;
avoid
high-CCT spill; cutoff optics
Controllable
parameters
Terminology aligned with practice
B (Expert—deep)Street-
canyon
geometry and thermal thresholds
H/W;
SVF;
Albedo
615-point
Likert
(1–5)
Strongly
disagree →
Strongly agree
Narrow
canyons need trees;
mid-albedo
reduces MRT
Links
geometry
to
microclimate
No
simulation jargon in stems
B (Expert—deep)Traffic
exposure management
Speed;
Volume;
Separation;
Crossings
615-point
Likert
(1–5)
Strongly
disagree →
Strongly agree
Lower operating speed over
added width;
prioritize
separation near schools
Casualty
-risk
proxies
Avoids enforcement phrasing
B (Expert—deep)Facility
density and
operations risk
Clutter;
Visibility;
Maintenance
cycles
625-point
Likert
(1–5)
Strongly
disagree →
Strongly agree
Too many benches cause clutter (R); multi-use units cut upkeepAmenity vs.
order
balance
Pairs with governance constructs
Table A2. Item screening reports means, SDs, item–total correlations, and alpha-if-deleted; one low-variance item flagged for provisional exclusion.
ItemAveragesStandard DeviationProject-Total Score
Correlation
α After Deleting This Question
Q013.9780.7630.1960.763
Q023.980.7680.2030.762
Q033.9670.7870.2080.762
Q043.9830.7790.1720.763
Q053.9670.770.2120.762
Q063.9530.7770.1850.763
Q072.030.35−0.0210.767
Q083.9740.7790.1720.763
Q093.9780.7770.2180.762
Q103.9850.7660.2020.762
Q114.0750.7510.2280.761
Q124.070.7610.2370.761
Q134.0710.7480.2320.761
Q144.0450.7530.2530.76
Q154.0560.7540.2260.761
Q164.040.7510.2280.761
Q174.0780.7450.2290.761
Q184.0620.750.2070.762
Q194.0780.7440.2350.761
Q204.0730.7570.2290.761
Q214.0940.7570.1840.763
Q224.0750.7640.1510.764
Q234.0980.7670.1680.764
Q244.0750.7680.190.763
Q254.1080.7510.1730.763
Q264.1080.7640.1820.763
Q274.0880.7630.1970.762
Q284.1070.7620.2040.762
Q293.9250.8030.1870.763
Q303.9180.7940.2070.762
Q313.910.8060.2110.762
Q323.9390.8120.2110.762
Q333.9120.8240.1950.763
Q343.9130.8030.1850.763
Q353.9180.8140.2130.762
Q364.1430.7280.2650.76
Q374.1610.7140.2790.76
Q384.0750.7460.2690.76
Q394.0450.7310.2650.76
Q404.1490.7240.2710.76
Q414.1170.7290.2740.76
Q424.0570.7420.2370.761
Q434.0760.7380.2440.761
Q444.110.7280.2730.76
Q454.1410.7180.2390.761
Q464.0450.7320.290.759
Q474.0440.7290.2710.76
Q484.0730.7350.2850.759
Q494.1210.7390.2680.76

References

  1. Iungman, T.; Cirach, M.; Marando, F.; Pereira Barboza, E.; Khomenko, S.; Masselot, P.; Quijal-Zamorano, M.; Mueller, N.; Gasparrini, A.; Urquiza, J.; et al. Cooling Cities through Urban Green Infrastructure: A Health Impact Assessment of European Cities. Lancet 2023, 401, 577–589. [Google Scholar] [CrossRef]
  2. Li, Y.; Svenning, J.-C.; Zhou, W.; Zhu, K.; Abrams, J.F.; Lenton, T.M.; Ripple, W.J.; Yu, Z.; Teng, S.N.; Dunn, R.R.; et al. Green Spaces Provide Substantial but Unequal Urban Cooling Globally. Nat. Commun. 2024, 15, 7108. [Google Scholar] [CrossRef] [PubMed]
  3. Ahern, J. From Fail-Safe to Safe-to-Fail Sustainability and Resilience in the New Urban World. Landsc. Urban Plan. 2011, 100, 341–343. Available online: https://www.scirp.org/reference/referencespapers?referenceid=1703085 (accessed on 22 September 2025). [CrossRef]
  4. Ferrario, F.; Mourato, J.M.; Rodrigues, M.S.; Dias, L.F. Evaluating Nature-Based Solutions as Urban Resilience and Climate Adaptation Tools: A Meta-Analysis of Their Benefits on Heatwaves and Floods. Sci. Total Environ. 2024, 950, 175179. [Google Scholar] [CrossRef]
  5. Kumar, P.; Debele, S.; Khalili, S.; Halios, C.H.; Sahani, J.; Aghamohammadi, N.; de Fatima Andrade, M.; Athanassiadou, M.; Bhui, K.; Calvillo, N.; et al. Urban Heat Mitigation by Green and Blue Infrastructure: Drivers, Effectiveness, and Future Needs. Innovation 2024, 5, 100588. [Google Scholar] [CrossRef]
  6. Scannell, L.; Gifford, R. Defining Place Attachment: A Tripartite Organizing Framework. J. Environ. Psychol. 2010, 30, 1–10. [Google Scholar] [CrossRef]
  7. Koohsari, M.J.; Yasunaga, A.; Oka, K.; Nakaya, T.; Nagai, Y.; McCormack, G.R. Place Attachment and Walking Behaviour: Mediation by Perceived Neighbourhood Walkability. Landsc. Urban Plan. 2023, 235, 104767. [Google Scholar] [CrossRef]
  8. Zahnow, R. Place Type or Place Function: What Matters for Place Attachment? Am. J. Community Psychol. 2023, 73, 446–460. [Google Scholar] [CrossRef]
  9. Ewing, R.; Handy, S. Measuring the Unmeasurable: Urban Design Qualities Related to Walkability. J. Urban Des. 2009, 14, 65–84. [Google Scholar] [CrossRef]
  10. Angel, A.; Cohen, A.; Nelson, T.; Plaut, P. Evaluating the Relationship between Walking and Street Characteristics Based on Big Data and Machine Learning Analysis. Cities 2024, 151, 105111. [Google Scholar] [CrossRef]
  11. Al Mushayt, N.S.; Dal Cin, F.; Barreiros Proença, S. New Lens to Reveal the Street Interface. A Morphological-Visual Perception Methodological Contribution for Decoding the Public/Private Edge of Arterial Streets. Sustainability 2021, 13, 11442. [Google Scholar] [CrossRef]
  12. van Erpecum, C.-P.L.; Bornioli, A.; Cleland, C.; Jones, S.; Davis, A.; den Braver, N.R.; Pilkington, P. 20 Mph Speed Limits: A Meta-Narrative Evidence Synthesis of the Public Health Evidence; Academic Press: Cambridge, MA, USA, 2024; Volume 13, pp. 167–195. [Google Scholar]
  13. Shrinivas, V.; Bastien, C.; Davies, H.; Daneshkhah, A.; Hardwicke, J. Parameters Influencing Pedestrian Injury and Severity–A Systematic Review and Meta-Analysis. Transp. Eng. 2023, 11, 100158. [Google Scholar] [CrossRef]
  14. Son, D.; Im, B.; Her, J.; Park, W.; Kang, S.-J.; Kim, S.-N. Street Lighting Environment and Fear of Crime: A Simulated Virtual Reality Experiment. Virtual Real. 2024, 29, 8. [Google Scholar] [CrossRef]
  15. Roberts, L.E.; Bushover, B.; Mehranbod, C.A.; Gobaud, A.N.; Fish, C.; Eschliman, E.L.; Gao, X.; Zadey, S.; Morrison, C.N. Physical Environmental Roadway Interventions and Injury and Death for Vulnerable Road Users: A Natural Experiment in New York City. Inj. Prev. 2024, 31, 420–423. [Google Scholar] [CrossRef]
  16. Sobhaninia, S. The Social Cohesion Measures Contributing to Resilient Disaster Recovery: A Systematic Literature Review. J. Plan. Lit. 2024, 39, 519–534. [Google Scholar] [CrossRef]
  17. Wang, Q.; Liu, X.; Jian, I.Y.; Zhang, E.; Hou, Y.; Michael, W.; Li, Y. Community Resilience in City Emergency: Exploring the Roles of Environmental Perception, Social Justice and Community Attachment in Subjective Well-Being of Vulnerable Residents. Sustain. Cities Soc. 2023, 97, 104745. [Google Scholar] [CrossRef]
  18. Meerow, S.; Newell, J.P.; Stults, M. Defining Urban Resilience: A Review. Landsc. Urban Plan. 2016, 147, 38–49. [Google Scholar] [CrossRef]
  19. Cutter, S.L.; Burton, C.G.; Emrich, C.T. Disaster Resilience Indicators for Benchmarking Baseline Conditions. J. Homel. Secur. Emerg. Manag. 2010, 7, 1–22. [Google Scholar] [CrossRef]
  20. Davoudi, S.; Shaw, K.; Haider, L.J.; Quinlan, A.E.; Peterson, G.D.; Wilkinson, C.; Fünfgeld, H.; McEvoy, D.; Porter, L.; Davoudi, S. Resilience: A Bridging Concept or a Dead End? “Reframing” Resilience: Challenges for Planning Theory and Practice Interacting Traps: Resilience Assessment of a Pasture Management System in Northern Afghanistan Urban Resilience: What Does It Mean in Planning Practice? Resilience as a Useful Concept for Climate Change Adaptation? The Politics of Resilience for Planning: A Cautionary Note. Plan. Theory Pract. 2012, 13, 299–333. [Google Scholar]
  21. IPCC Climate Change 2022: Impacts, Adaptation and Vulnerability. Working Group II Contribution to the Sixth Assessment Report. Available online: https://www.ipcc.ch/report/ar6/wg2/chapter/chapter-6 (accessed on 22 September 2025).
  22. Kabisch, N.; Frantzeskaki, N.; Hansen, R. Principles for Urban Nature-Based Solutions. Ambio 2022, 51, 1388–1401. [Google Scholar] [CrossRef]
  23. Khodadad, M.; Aguilar-Barajas, I.; Khan, A.Z. Green Infrastructure for Urban Flood Resilience: A Review of Recent Literature on Bibliometrics, Methodologies, and Typologies. Water 2023, 15, 523. [Google Scholar] [CrossRef]
  24. Sharifi, A. A Critical Review of Selected Tools for Assessing Community Resilience. Available online: https://www.apn-gcr.org/publication/a-critical-review-of-selected-tools-for-assessing-community-resilience/ (accessed on 22 September 2025).
  25. Sharifi, A. Urban Resilience Assessment: Mapping Knowledge Structure and Trends. Sustainability 2020, 12, 5918. [Google Scholar] [CrossRef]
  26. Jorgensen, B.S.; Stedman, R.C. A Comparative Analysis of Predictors of Sense of Place Dimensions: Attachment To, Dependence On, and Identification with Lakeshore Properties. J. Environ. Manag. 2006, 79, 316–327. [Google Scholar] [CrossRef]
  27. Williams, D.R.; Vaske, J.J. The Measurement of Place Attachment: Validity and Generalizability of a Psychometric Approach. For. Sci. 2003, 49, 830–840. [Google Scholar] [CrossRef]
  28. Kyle, G.T.; Mowen, A.J.; Tarrant, M. Linking Place Preferences with Place Meaning: An Examination of the Relationship between Place Motivation and Place Attachment. J. Environ. Psychol. 2004, 24, 439–454. [Google Scholar] [CrossRef]
  29. Brown, G.; Raymond, C. The Relationship between Place Attachment and Landscape Values: Toward Mapping Place Attachment. Appl. Geogr. 2007, 27, 89–111. [Google Scholar] [CrossRef]
  30. Ramkissoon, H.; Graham Smith, L.D.; Weiler, B. Testing the Dimensionality of Place Attachment and Its Relationships with Place Satisfaction and Pro-Environmental Behaviours: A Structural Equation Modelling Approach. Tour. Manag. 2013, 36, 552–566. [Google Scholar] [CrossRef]
  31. Yoon, J.I.; Lee, K.J.; Larson, L.R. Place Attachment Mediates Links between Pro-Environmental Attitudes and Behaviors among Visitors to Mt. Bukhan National Park, South Korea. Front. Psychol. 2024, 15, 1338650. [Google Scholar] [CrossRef]
  32. Aldrich, D.P.; Meyer, M.A. Social Capital and Community Resilience. Am. Behav. Sci. 2015, 59, 254–269. [Google Scholar] [CrossRef]
  33. Patel, S.S.; Rogers, M.B.; Amlot, R.; Rubin, G.J. What Do We Mean by “Community Resilience”? A Systematic Literature Review of How It Is Defined in the Literature. PLoS Curr. Disasters 2017, 9, 34. [Google Scholar]
  34. Hartig, T.; Mitchell, R.; de Vries, S.; Frumkin, H. Nature and Health. Annu. Rev. Public Health 2014, 35, 207–228. [Google Scholar] [CrossRef]
  35. Twohig-Bennett, C.; Jones, A. The Health Benefits of the Great Outdoors: A Systematic Review and Meta-Analysis of Greenspace Exposure and Health Outcomes. Environ. Res. 2018, 166, 628–637. [Google Scholar] [CrossRef]
  36. Lallemant, D.; Hamel, P.; Balbi, M.; Lim, T.N.; Schmitt, R.; Win, S. Nature-Based Solutions for Flood Risk Reduction: A Probabilistic Modeling Framework. One Earth 2021, 4, 1310–1321. [Google Scholar] [CrossRef]
  37. O’Donnell, E.; Thorne, C.; Ahilan, S.; Arthur, S.; Birkinshaw, S.; Butler, D.; Dawson, D.; Everett, G.; Fenner, R.; Glenis, V.; et al. The Blue-Green Path to Urban Flood Resilience. Blue-Green Syst. 2019, 2, 28–45. [Google Scholar] [CrossRef]
  38. Chen, C.; Ye, S.; Bai, Z.; Wang, J.; Zhang, Z.; Sergey Ablameyko, S. Intelligent Mining of Urban Ventilation Corridors Based on High-Precision Oblique Photographic Images. Sensors 2021, 21, 7537. [Google Scholar] [CrossRef] [PubMed]
  39. Peng, M.; Huang, H. The Synergistic Effect of Urban Canyon Geometries and Greenery on Outdoor Thermal Comfort in Humid Subtropical Climates. Front. Environ. Sci. 2022, 10, 851810. [Google Scholar] [CrossRef]
  40. Cheval, S.; Amihăesei, V.; Chitu, Z.; Dumitrescu, A.; Falcescu, V.; Irasoc, A.; Micu, D.; Mihulet, M.; Ontel, I.; Paraschiv, M.G.; et al. A Systematic Review of Urban Heat Island and Heat Waves Research (1991–2022). Clim. Risk Manag. 2024, 44, 100603. [Google Scholar] [CrossRef]
  41. Middel, A.; Selover, N.; Hagen, B.; Chhetri, N. Impact of Shade on Outdoor Thermal Comfort—A Seasonal Field Study in Tempe, Arizona. Int. J. Biometeorol. 2016, 60, 1849–1861. [Google Scholar] [CrossRef]
  42. . Grundy, C.; Steinbach, R.; Edwards, P.; Green, J.; Armstrong, B.; Wilkinson, P. Effect of 20 Mph Traffic Speed Zones on Road Injuries in London, 1986–2006: Controlled Interrupted Time Series Analysis. BMJ 2009, 339, b4469. [Google Scholar] [CrossRef]
  43. Bunn, F.; Collier, T.; Frost, C.; Ker, K.; Steinbach, R.; Roberts, I.; Wentz, R. Area-Wide Traffic Calming for Preventing Traffic Related Injuries. Cochrane Database Syst. Rev. 2003, 2010, cd003110. [Google Scholar] [CrossRef]
  44. Namatovu, S.; Balugaba, B.E.; Muni, K.; Ningwa, A.; Nsabagwa, L.; Oporia, F.; Kiconco, A.; Kyamanywa, P.; Mutto, M.; Osuret, J.; et al. Interventions to Reduce Pedestrian Road Traffic Injuries: A Systematic Review of Randomized Controlled Trials, Cluster Randomized Controlled Trials, Interrupted Time-Series, and Controlled Before-after Studies. PLoS ONE 2022, 17, e0262681. [Google Scholar] [CrossRef]
  45. Fotios, S.; Unwin, J.; Farrall, S. Road Lighting and Pedestrian Reassurance after Dark: A Review. Light. Res. Technol. 2014, 47, 449–469. [Google Scholar] [CrossRef]
  46. Welsh, B.C.; Farrington, D.P. Effects of Improved Street Lighting on Crime. Campbell Syst. Rev. 2008, 4, 342–352. [Google Scholar] [CrossRef]
  47. Falchi, F.; Cinzano, P.; Duriscoe, D.; Kyba, C.C.M.; Elvidge, C.D.; Baugh, K.; Portnov, B.A.; Rybnikova, N.A.; Furgoni, R. The New World Atlas of Artificial Night Sky Brightness. Sci. Adv. 2016, 2, e1600377. [Google Scholar] [CrossRef]
  48. Jägerbrand, A.K.; Bouroussis, C.A. Ecological Impact of Artificial Light at Night: Effective Strategies and Measures to Deal with Protected Species and Habitats. Sustainability 2021, 13, 5991. [Google Scholar] [CrossRef]
  49. Haans, A.; de Kort, Y.A.W. Light Distribution in Dynamic Street Lighting: Two Experimental Studies on Its Effects on Perceived Safety, Prospect, Concealment, and Escape. J. Environ. Psychol. 2012, 32, 342–352. [Google Scholar] [CrossRef]
  50. Bennie, J.; Davies, T.W.; Cruse, D.; Inger, R.; Gaston, K.J. Cascading Effects of Artificial Light at Night: Resource-Mediated Control of Herbivores in a Grassland Ecosystem. Philos. Trans. R. Soc. B Biol. Sci. 2015, 370, 20140131. [Google Scholar] [CrossRef]
  51. van Kessel, G.; Milanese, S.; Dizon, J.; de Vries, D.H.; MacGregor, H.; Abramowitz, S.; Enria, L.; Burtscher, D.; Yeoh, E.-K.; Thomas, B.E.; et al. Community Resilience to Health Emergencies: A Scoping Review. BMJ Glob. Health 2025, 10, e016963. [Google Scholar] [CrossRef] [PubMed]
  52. Gjerde, M. Visual Evaluation of Urban Streetscapes: How Do Public Preferences Reconcile with Those Held by Experts? Urban Des. Int. 2011, 16, 153–161. [Google Scholar] [CrossRef]
  53. Najar, K.; Nylander, O.; Woxnerud, W. Public’s Visual Preferences Survey Facilitates Community-Based Design and Color Standards Creation. Buildings 2024, 14, 2929. [Google Scholar] [CrossRef]
  54. Tasser, E.; Lavdas, A.A. Uta Schirpke Assessing Landscape Aesthetic Values: Do Clouds in Photographs Influence People’s Preferences? PLoS ONE 2023, 18, e0288424. [Google Scholar] [CrossRef]
  55. Macháč, J.; Brabec, J.; Arnberger, A. Exploring Public Preferences and Preference Heterogeneity for Green and Blue Infrastructure in Urban Green Spaces. Urban For. Urban Green. 2022, 75, 127695. [Google Scholar] [CrossRef]
  56. Schirpke, U.; Mölk, F.; Feilhauer, E.; Tappeiner, U.; Tappeiner, G. How Suitable Are Discrete Choice Experiments Based on Landscape Indicators for Estimating Landscape Preferences? Landsc. Urban Plan. 2023, 237, 104813. [Google Scholar] [CrossRef]
  57. Van Dongen, R.P.; Timmermans, H.J.P. Preference for Different Urban Greenscape Designs: A Choice Experiment Using Virtual Environments. Urban For. Urban Green. 2019, 44, 126435. [Google Scholar] [CrossRef]
  58. Ewing, R.; Handy, S.; Brownson, R.C.; Clemente, O.; Winston, E. Identifying and Measuring Urban Design Qualities Related to Walkability. J. Phys. Act. Health 2006, 3, S223–S240. [Google Scholar] [CrossRef]
  59. Huang, X.; Zeng, L.; Liang, H.; Li, D.; Yang, X.; Zhang, B. Comprehensive Walkability Assessment of Urban Pedestrian Environments Using Big Data and Deep Learning Techniques. Sci. Rep. 2024, 14, 26993. [Google Scholar] [CrossRef]
  60. Ewing, R.; Clemente, O.; Neckerman, K.M.; Purciel-Hill, M.; Quinn, J.W.; Rundle, A. Measuring Urban Design; Island Press/Center for Resource Economics: Washington, DC, USA, 2013; ISBN 9781597263672. [Google Scholar]
  61. Mahmoudi Farahani, L.; Maller, C.J. Perceptions and Preferences of Urban Greenspaces: A Literature Review and Framework for Policy and Practice. Landsc. Online 2018, 61, 1–22. [Google Scholar] [CrossRef]
  62. Wang, J.; Zhou, W.; Pickett, S.T.; Qian, Y. A Scaling Law for Predicting Urban Trees Canopy Cooling Efficiency. Proc. Natl. Acad. Sci. USA 2024, 121, e2401210121. [Google Scholar] [CrossRef] [PubMed]
  63. Yin, Y.; He, L.; Wennberg, P.O.; Frankenberg, C. Unequal Exposure to Heatwaves in Los Angeles: Impact of Uneven Green Spaces. Sci. Adv. 2023, 9, eade8501. [Google Scholar] [CrossRef]
  64. Gillerot, L.; Landuyt, D.; de Frenne, P.; Muys, B.; Verheyen, K. Urban Tree Canopies Drive Human Heat Stress Mitigation. Urban For. Urban Green. 2024, 92, 128192. [Google Scholar] [CrossRef]
  65. Himschoot, E.A.; Crump, M.C.; Buckley, S.; Cai, C.; Lawson, S.; White, J.; Beeco, A.; Taff, D.B.; Newman, P. Feelings of Safety for Visitors Recreating Outdoors at Night in Different Artificial Lighting Conditions. J. Environ. Psychol. 2024, 97, 102374. [Google Scholar] [CrossRef]
  66. Wang, H.; Wang, Y. Smart Cities Net Zero Planning Considering Renewable Energy Landscape Design in Digital Twin. Sustain. Energy Technol. Assess. 2024, 63, 103629. [Google Scholar] [CrossRef]
  67. Iungman, T.; Khomenko, S.; Barboza, E.P.; Cirach, M.; Gonçalves, K.; Petrone, P.; Erbertseder, T.; Taubenböck, H.; Chakraborty, T.; Nieuwenhuijsen, M. The Impact of Urban Configuration Types on Urban Heat Islands, Air Pollution, CO2 Emissions, and Mortality in Europe: A Data Science Approach. Lancet Planet. Health 2024, 8, e489–e505. [Google Scholar] [CrossRef]
  68. Trop, T.; Shoshany Tavory, S.; Portnov, B.A. Factors Affecting Pedestrians’ Perceptions of Safety, Comfort, and Pleasantness Induced by Public Space Lighting: A Systematic Literature Review. Environ. Behav. 2023, 55, 3–46. [Google Scholar] [CrossRef]
  69. Khalvandi, R.; Karimimoshaver, M. The Optimal Ratio in the Street Canyons: Comparison of Two Methods of Satellite Images and Simulation. Build. Environ. 2023, 229, 109927. [Google Scholar] [CrossRef]
  70. Abd El-Razik, M.M.; Hafez, Y.K.; Hendy, A.H.; Fawzy, M.M. Methodology for Microclimatic Urban Canyon Design Case Study Surrounding MUST University Campus in Cairo. HBRC J. 2024, 20, 589–603. [Google Scholar] [CrossRef]
  71. Naghibi, M. Rethinking Small Vacant Lands in Urban Resilience: Decoding Cognitive and Emotional Responses to Cityscapes. Cities 2024, 151, 105167. [Google Scholar] [CrossRef]
  72. McDonald, R.I.; Biswas, T.; Chakraborty, T.C.; Kroeger, T.; Cook-Patton, S.C.; Fargione, J.E. Current Inequality and Future Potential of US Urban Tree Cover for Reducing Heat-Related Health Impacts. npj Urban Sustain. 2024, 4, 18. [Google Scholar] [CrossRef]
  73. Li, H.; Zhao, Y.; Wang, C.; Ürge-Vorsatz, D.; Carmeliet, J.; Bardhan, R. Cooling Efficacy of Trees across Cities Is Determined by Background Climate, Urban Morphology, and Tree Trait. Commun. Earth Environ. 2024, 5, 754. [Google Scholar] [CrossRef]
  74. Massaro, E.; Schifanella, R.; Piccardo, M.; Caporaso, L.; Taubenböck, H.; Cescatti, A.; Duveiller, G. Spatially-Optimized Urban Greening for Reduction of Population Exposure to Land Surface Temperature Extremes. Nat. Commun. 2023, 14, 2903. [Google Scholar] [CrossRef]
  75. Navarrete-Hernandez, P.; Luneke, A.; Truffello, R.; Fuentes, L. Planning for Fear of Crime Reduction: Assessing the Impact of Public Space Regeneration on Safety Perceptions in Deprived Neighborhoods. Landsc. Urban Plan. 2023, 237, 104809. [Google Scholar] [CrossRef]
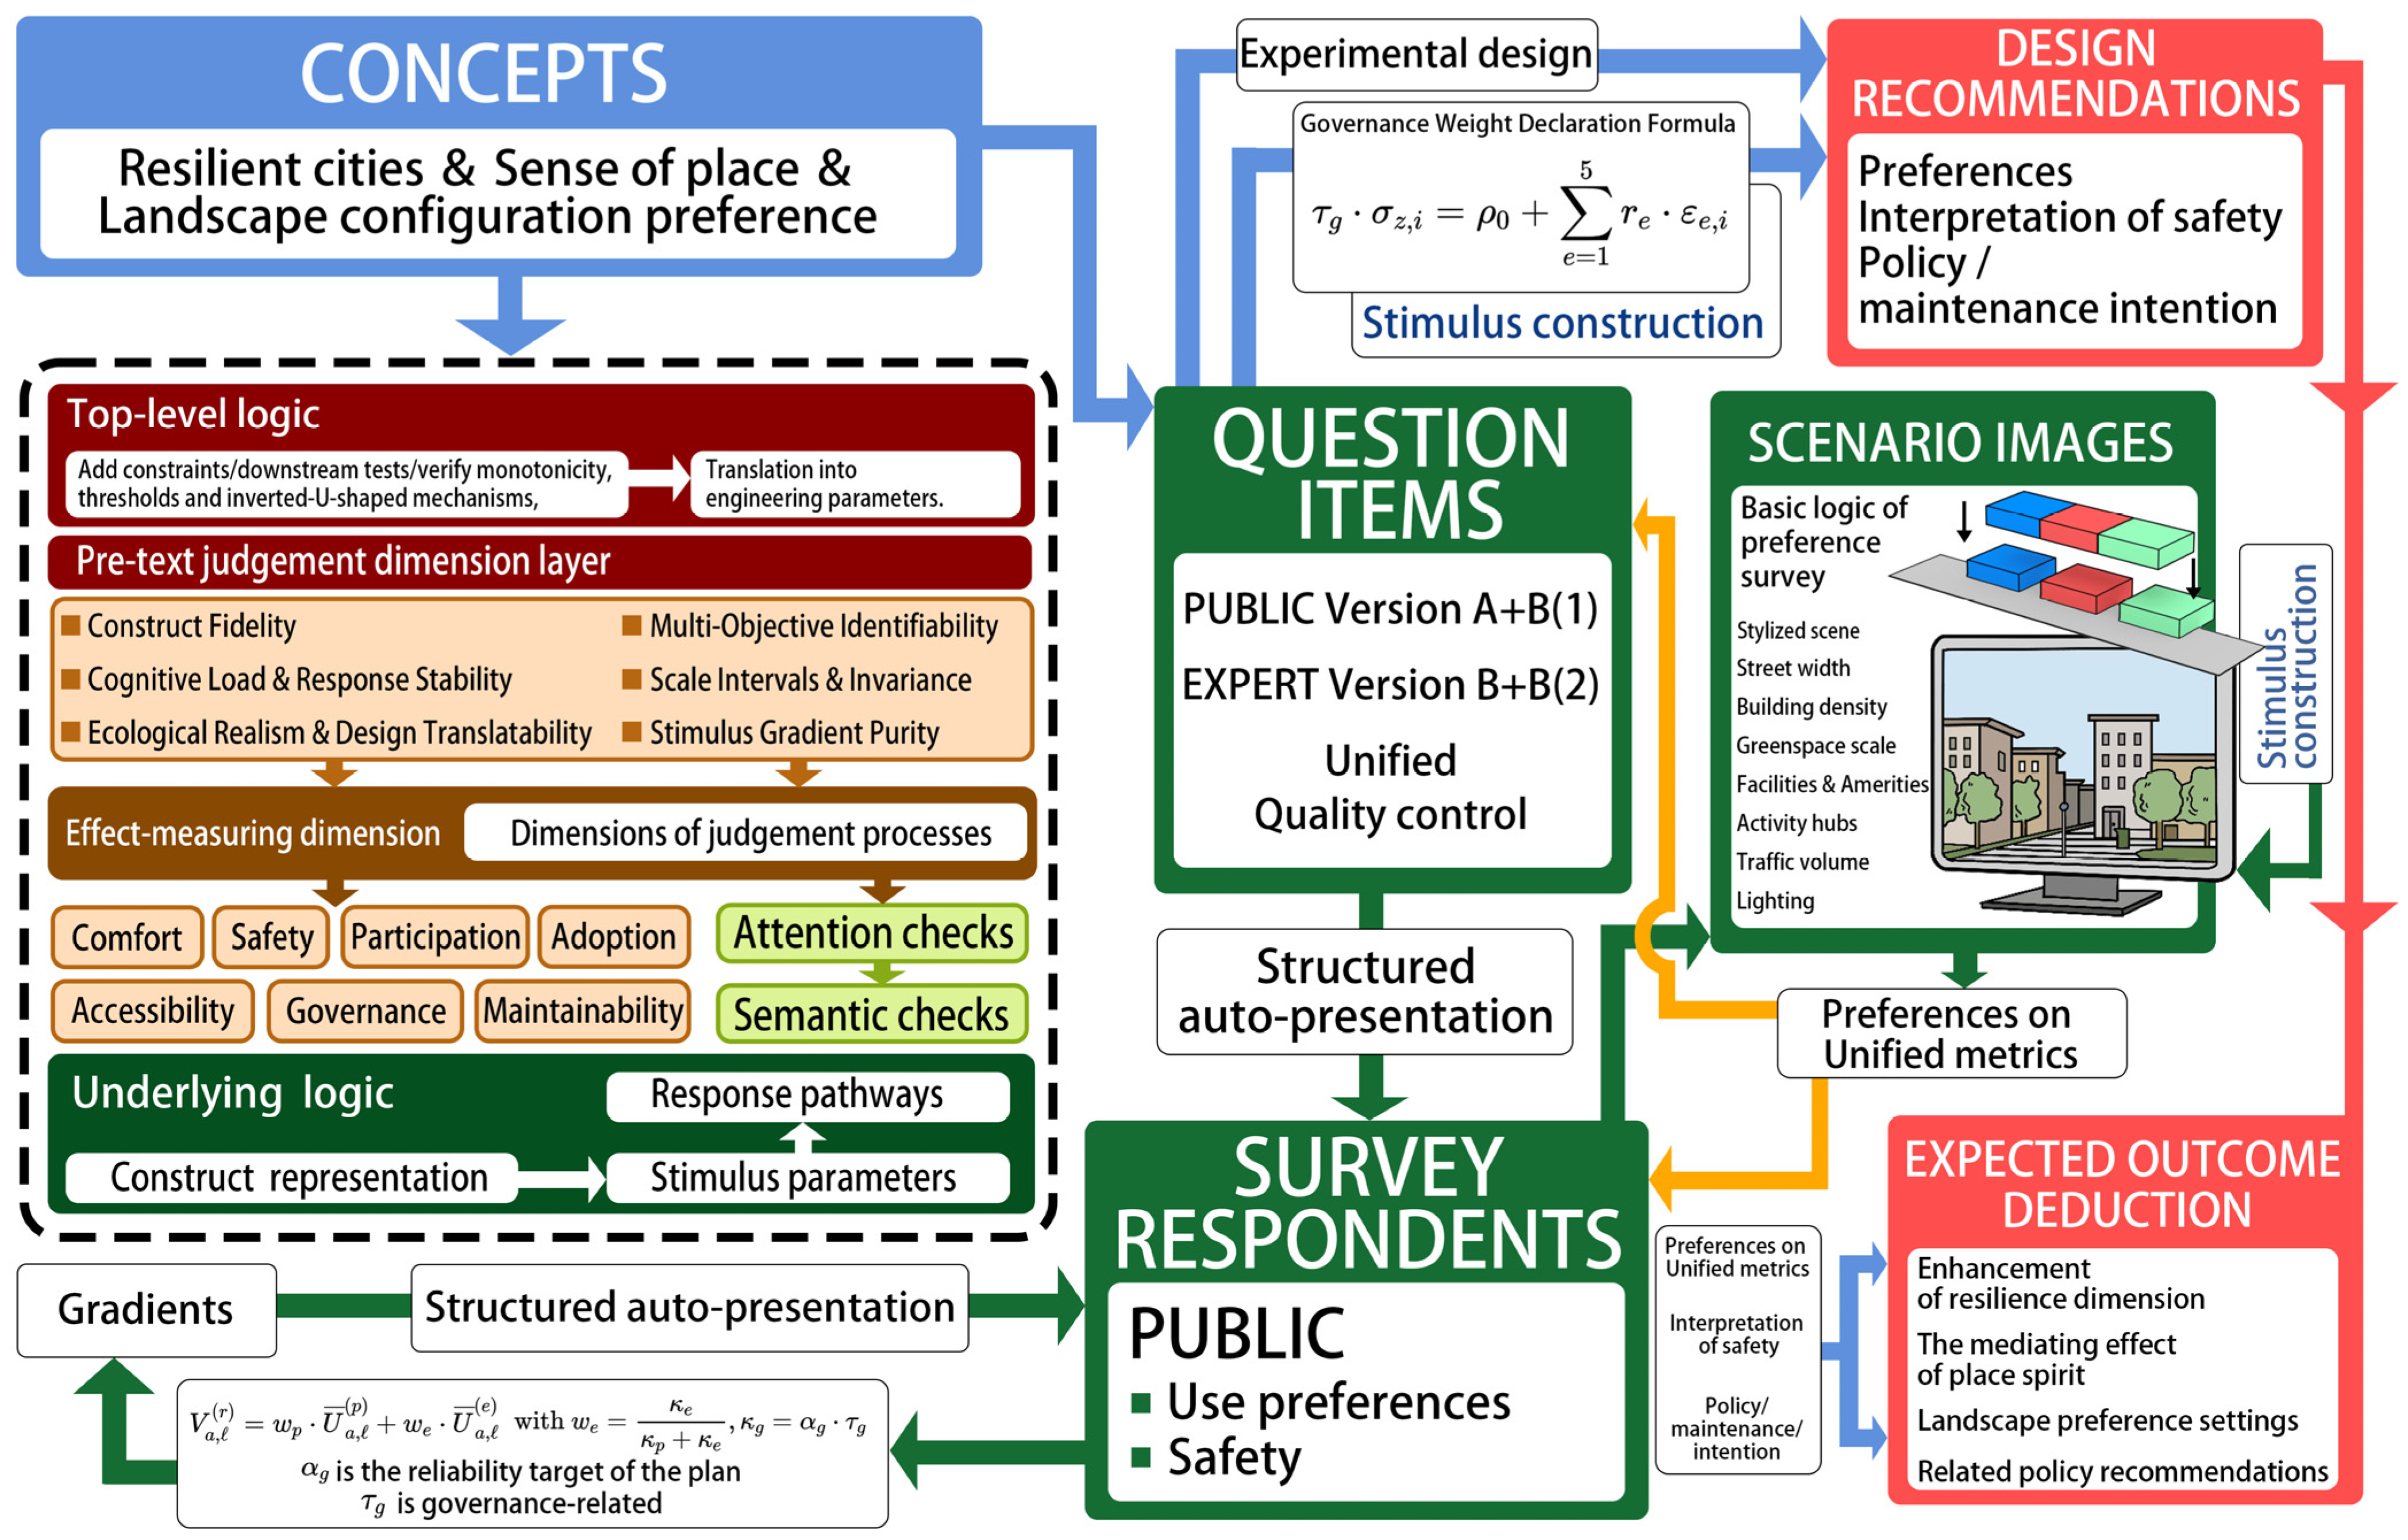
Figure 1. Schematic of the experimental pipeline.
Urbansci 09 00501 g001
Figure 2. Seven elements, each in five levels, generated 35 progressive situational images.
Urbansci 09 00501 g002
Figure 3. Measurement structure adequacy and factorability (Stage 1 Public).
Urbansci 09 00501 g003
Figure 4. Attribute-level preference (Public, Stage 2).
Urbansci 09 00501 g004
Figure 5. Attribute-level preference (Expert, Stage 2).
Urbansci 09 00501 g005
Figure 6. Pareto frontier of design combinations (Stage 2).
Urbansci 09 00501 g006
Table 1. Stimulus matrix and controlled variables.
Factor CodeFactor
Label
Gradient Definition (A→E)Level ALevel BLevel CLevel DLevel EControlled
Conditions
(Held
Constant)
Targeted Proxy
Indicators
Parameter Anchors (Design-
Time)
1Street width
(canyon
ratio)
Widens A→E; height fixed;
camera/sky/
materials held
constant
A:
very
narrow (H/W ≈ 2.5)
B:
narrow (≈2.0)
C:
moderate (≈1.5)
D:
wide (≈1.0)
E:
very wide (≈0.5)
50 mm lens; eye 1.6 m; constant HDR sky;
constant façades/
pavement
Walkability continuity; sightlines; thermal
exposure
Building height ~15 m; mid-albedo pavement
2Building density (site
coverage)
Decreases A→E; width fixedA: ≈70%B: ≈60%C: ≈50%D: ≈40%E: ≈30%Massing/setbacks adjusted; skyline
unchanged
Daylight; airflow; openness; emergency clearanceFaçade rhythm kept; ground-
floor permeability unchanged
3Green area size (canopy cover)Increases A→E with trees
dominant; path width fixed
A: ≈5%B: ≈12%C: ≈20%D: ≈30%E: ≈45%Species and crown shapes
consistent;
planters vs. in-ground
constant
Thermal mitigation; rest
willingness; biophilic
appraisal
Tree height ≈ 7–9 m; minimal understory
4Facilities and
equipment
density
Increases A→E; clear routes intactA:
≤1/50 m
B:
1–2/50 m
C:
3–4/50 m
D:
5–6/50 m
E:
≥7/50 m
Same furniture family/palette; barrier-free keptComfortable to stay; order vs. clutter;
visibility; upkeep complexity
Clear path ≥ 1.2 m; mounting method constant
5Activity hub areaIncreases A→E;
circulation rings open
A: 0 m2B: 150 m2C: 300 m2D: 500 m2E: 800 m2Surface
finish/edges
constant;
no event props
Interaction capacity; event readiness; noise spill riskDrainage slope constant; no fencing change
6Traffic flow
intensity
Increases A→E; lane geometry fixedA:
car-free
B:
≈2/min
C:
≈5/min
D:
≈9/min
E:
≥15/min
Same lane
width/markings;
crossings
constant; no parking change
Risk/noise/pollution
exposure; liveliness; crossing stress
Operating speed placeholder 20–40 km/h
7Street lighting (coverage/
distribution)
Increases illuminance and
uniformity A→E;
mast spacing stable
A:
Eh ≈ 2
lx; Uo ≈ 0.20; 2700 K
B:
5
lx;
0.30; 3000 K
C:
10
lx;
0.40; 3500 K
D:
15
lx;
0.50; 4000 K
E:
25
lx;
0.60; 4000 K (glare risk)
Ambient sky
constant;
luminaire model and height fixed; spill-controlled
Night
reassurance;
facial
recognition; glare
comfort;
biodiversity risk
Backlight cutoff; CRI ≈ 70–80; no dynamic dimming
Table 2. Sample structure and quotas.
Group
and
Phase
Administration ModeInclusion CriteriaQuota
Dimensions
Quota
Targets
(Examples)
Planned Sample
and
Rotation
Stimulus Blocking
and
Ordering
Embedded Quality ControlsAdditional QC RulesConsent
and
Privacy
Governance Weighting (Design)
Public—Phase 1Online
self-
administered
Adults (18+);
regular street users;
can view
images on desktop/
mobile
City size; street type; built-year periodTier 1/2
cities
balanced; main/
secondary streets; pre-2000 vs. post-2000
Target N ≈ 3200; randomized seeds per blockBlocks of
7–10 items; interleaved factors;
no
consecutive A–E set
2 attention checks;
2
semantic-
consistency pairs;
mirrored polarity
Time-
per-page
threshold; straight-
lining flags
Consent screen; anonymized
storage; no uploads
Design statement: κp = αp·τp for
synthesis
Expert—Phase 1Online
supervised invitation
Professionals in
planning/
landscape/
transport/
lighting/
public safety/
community
Discipline; years of practice; project
exposure
Even split across six disciplines; ≥3 years practice;
recent
projects
required
Target N ≈ 180;
balanced by
discipline
Blocks of
7–10 items; expert deep section
appended
2 attention checks;
2 consistency pairs; terminology glossary in stems
Same thresholds; identity verified by affiliationConsent screen; anonymized
storage; no uploads
Design statement: κe =
αe·τe
for
synthesis
Public—Phase 2Online self-administeredAdults (18+); able to judge 35 images; no color-
vision issues self-
reported
City size; street type; night-
walking
exposure
Even split by city size; ≥30% with weekly night
walking
Target N ≈ 1000; stimuli evenly
rotated
Image blocks
randomized;
factor
order
balanced
2
attention checks;
2
consistency vignettes
Same thresholds; device type recordedConsent screen; anonymized
storage;
no uploads
Design statement: κp used in governance weighting
Expert—Phase 2Online
supervised invitation
Same
disciplines as Phase 1; able to judge
lighting/
traffic/
geometry cues
Discipline; role
(designer/
engineer/
manager)
1:1:1
across roles
Target N ≈ 100;
balanced across roles
Same as Phase 2 public; deep terminology retained2
attention checks;
polarity mirrors
Same as aboveConsent screen; anonymized
storage; no uploads
Design statement: κe used in governance weighting
Table 3. Cronbach’s α, KMO, and Bartlett’s test confirm reliability and sampling adequacy.
ScaleItems_
Planned
Items_Used_
for_Stats
Dropped_
Items
Valid_
Sample_Size
Cronbach_
Alpha
KMO_OverallBartlett_Test
Section A
(Foundational constructs)
3535031760.748N/AN/A
Section B
(Governance and
operability, brief)
1515031760.839N/AN/A
Combined
A + B
(final instrument)
5049131760.7650.911χ2 = 33,831.23;
d f = 1176;
p < 0.001
Notes: KMO_overall and Bartlett’s test were evaluated only for the combined A + B scale; section-level values are therefore not applicable (N/A).
Table 4. Rotated factor loadings; constrained cross-loadings across dimensions.
FactorConceptual LabelEigenvalueVariance
Explained (%)
Assigned Items (n)Top Loadings (Item|λ)Cronbach’s AlphaMedian
Communality
Max
Cross-Loading (abs)
F1Place
attachment
and
identity
9.2218.2114A12|0.82; A21|0.79; A07|0.77; A28|0.740.9120.610.28
F2Accessibility and
safety
5.8711.5912A03|0.76; A15|0.73; B04|0.71; A26|0.700.8840.550.26
F3Governance
and
maintenance
3.747.3811B09|0.78; B12|0.75; A24|0.71; B06|0.690.8610.490.25
F4Adoption
and
participation
2.965.8412B02|0.74; A18|0.71; B14|0.70; A33|0.680.8460.470.24
Table 5. Stage 2 attribute utilities: public vs. expert best levels, shapes, and bridge weights ( W p , W e ).
AttributePublic_BestPublic_ShapeExpert_BestExpert_ShapeBridge_a
Weight _ W p
Bridge_
Weight _ W e
1. Street widthE (μ = 3.021)IrregularE (μ = 3.567)Irregular0.4370.563
2. Building
density
E (μ = 3.049)Monotonic+B (μ = 3.495)Irregular0.4370.563
3. Green area sizeD (μ = 3.093)IrregularC (μ = 3.454)Inverted-U, L* ≈ 30.4370.563
4. Facilities and equipmentC (μ = 3.046)IrregularD (μ = 3.351)Irregular0.4370.563
5. Public
activity area
D (μ = 3.012)Inverted-U, L* ≈ 4B (μ = 3.619)Irregular0.4370.563
6. Traffic flow
and access
D (μ = 3.056)Inverted-U, L* ≈ 4E (μ = 3.629)Irregular0.4370.563
7. LightingE (μ = 2.938)IrregularD (μ = 3.495)Irregular0.4370.563
Note: “Monotonic+” indicates a monotonically increasing utility from level A to E (higher levels preferred); “Monotonic−” indicates a monotonically decreasing utility.
Table 6. Summarizes model forms and robustness checks across attributes and groups, with FDR-labeled terms.
AttributePublic_
Best_
Form
Public_
Pattern
Public_
L*
Public_
Delta
AIC
Expert_
Best_
Form
Expert_
Pattern
Expert_
L*
Expert_
Delta
AIC
Δslope
(Exp−
Pub)
p_Diffq_Diff
(FDR)
Public_
Opt_
Level
(1–5)
Expert_
Opt_
Level
(1–5)
1.
Street
width
LinearMonotonic0LinearMonotonic00.0539.256 × 10−21.620 × 10−155
2.
Building density
LinearMonotonic0LinearMonotonic00.0582.836 × 10−26.617 × 10−215
3.
Green area size
LinearMonotonic0LinearMonotonic0−0.1094.413 × 10−62.222 × 10−551
4.
Facilities and equipment
ThresholdHinge21.244LinearMonotonic0−0.0058.135 × 10−18.135 × 10−151
5.
Activity center size
ThresholdHinge40.723ThresholdHinge42.854−0.1176.349 × 10−62.222 × 10−545
6.
Traffic flow
LinearMonotonic0LinearMonotonic0−0.0146.519 × 10−17.606 × 10−155
7.
Lighting coverage
LinearMonotonic0LinearMonotonic00.0165.555 × 10−17.606 × 10−155
Table 7. Mediation results by attribute and group.
Attribute (X)Mediator (M)Groupa: X→M (β)b: M→Y (β)Indirect a × b95% CI (LL)95% CI (UL)Direct c’ (β)Total c (β)Mediation Share (%)Δχ2
(Group Diff)
p-ValueN
Lighting (D vs. C)Perceived SafetyPublic0.3330.410.1350.090.180.070.20565.96.720.009978
Green Area
(E vs. C)
Place
Attachment
Public0.280.360.1010.070.130.060.16162.75.880.015978
Traffic (Low vs. Mid)Perceived SafetyPublic0.220.380.0840.0520.1170.050.13462.77.410.006978
Facilities (D vs. C)Place
Dependence
Public0.190.290.0550.0280.0820.0460.10154.53.960.047978
Lighting (D–E band)Perceived SafetyExpert0.270.290.0780.040.1160.110.18841.56.720.00991
Green Area
(D vs. C)
Place
Attachment
Expert0.210.250.0530.020.0850.080.13339.85.880.01591
Traffic (Low vs. Mid)Governance
Belief
Expert0.350.330.1160.0730.1580.090.20656.37.410.00691
Facilities (C vs. D)Governance
Belief
Expert0.240.270.0650.0310.0980.0620.12751.23.960.04791
Disclaimer/Publisher’s Note: The statements, opinions and data contained in all publications are solely those of the individual author(s) and contributor(s) and not of MDPI and/or the editor(s). MDPI and/or the editor(s) disclaim responsibility for any injury to people or property resulting from any ideas, methods, instructions or products referred to in the content.