Systematic Review

Shaping Future Urbanization: A Systematic Review of Predictive and Preventive LUC Indicators for Sustainable New City Development

by
Achmad Ghozali
1,2,* and
Walter Timo de Vries
1
1
Chair of Land Management, School of Engineering and Design, Technical University of Munich (TUM), 80333 Munich, Germany
2
Urban and Regional Planning, Institut Teknologi Kalimantan (ITK), Balikpapan 76127, Indonesia
*
Author to whom correspondence should be addressed.
Urban Sci. 2025, 9(11), 484; https://doi.org/10.3390/urbansci9110484 (registering DOI)
Submission received: 10 October 2025 / Revised: 9 November 2025 / Accepted: 13 November 2025 / Published: 17 November 2025

Abstract

New city developments (NCDs) have significantly increased around the globe, especially in developing countries, to accommodate population growth and foster economic development. However, the uncertain footprint of NCDs often introduces trade-offs between urban expansion and sustainability, underscoring the need for integrated land use change (LUC) management. This study adopts a system-level perspective on LUC modeling to identify indicators and formulate a predictive–preventive framework for sustainable urbanization in NCDs. A bibliometric and Systematic Literature Review (SLR) of Scopus-indexed studies was conducted to extract and classify relevant indicators. The results identified fifty-six predictive indicators across five domains—physical geography, climate environment, socio-economic, urban attraction, and policy and regulation—and two preventive dimensions—environmental sustainability and urban inequality. Predictive indicators reveal how internal urban dynamics drive land expansion, while preventive indicators address ecological vulnerability, spatial equity, and sustainability constraints. This cohesive framework enhances understanding of interrelated factors in urbanization across both city-scale and regional contexts. These insights support more adaptive and proactive land management strategies, have the potential to improve future LUC simulation accuracy, and provide theoretical and practical guidance for sustainable NDC.

Graphical Abstract

1. Introduction

The design and construction of new and well-planned cities according to contemporary city ideals has increased in recent decades, particularly in the Global South. The New Cities Map indicates that there have been 164 New City Developments (NCDs) announced and built from scratch since the 2000s in developing countries to foster modernization and prosperity [1]. These emerging cities have grown markedly, often developed on greenfield sites, expanded beyond major urban centers, and transformed villages into metropolitan areas [2]. NCDs are widely regarded as a crucial strategy for urban branding, hubs of economic growth, improvement in urban quality of life, environmental sustainability, and national identity [2]. Nevertheless, they have given rise to a multitude of concerning outcomes, such as social exclusion and inequalities, spatial fragmentation, and environmental issues related to climate change driven by the new urbanization in rural areas [3].
Recent studies on NCDs have examined their political, economic, and spatial dynamics, as well as the associated challenges of large-scale urban growth. Ref. [3] emphasized that NCDs represent state-led experiments in neoliberal urbanism, functioning as instruments for modernization and territorial restructuring rather than merely as responses to urban congestion. Refs. [4,5] further demonstrated that while new cities aim to decentralize metropolitan pressures, they often reproduce spatial inequalities and environmental trade-offs. For instance, the Forest City in Malaysia exemplifies ambitious sustainability and socio-spatial inequality branding but has also triggered ecological disruption in seagrass fields and adjacent mangroves [6]. Egypt’s new desert administrative capital aims to alleviate Cairo’s overcrowding and modernize infrastructure, yet simultaneously intensifies spatial disparities as development-driven growth diverts resources from metropolitan areas [7]. Similarly, the relocation of Indonesia’s capital from Jakarta to East Kalimantan aims to establish a green, innovative, and inclusive urban center in a forested region, but also raises concerns regarding ecological impacts, rapid population growth, and socio-economic transitions in ecologically sensitive landscapes [8]. These examples underscore the fact that, despite addressing current urban challenges, NCDs profoundly impact ecological balance and regional equity, which potentially reproduce the very urban issues they aim to resolve.
The rapid development characteristics of these projects also introduce intense uncertainty due to numerous poorly understood factors affecting urban growth [9]. Recent reviews show that studies on NCDs commonly evaluate transformation factors through comparative analyses of planning models, development impacts, and spatial relations between parent and new cities [10]. However, most NCD research remains conceptual or policy-driven, with limited empirical evaluation of land transformation processes and how NCD implementation reshapes regional land use. Consequently, monitoring and forecasting LUC in emerging urban developments is an essential endeavor for sustainable planning, environmental sustainability, and socio-economic advancement. Understanding the potential transformation of land use patterns is fundamental for effective resource allocation, preventing environmental degradation, and ensuring sustainable development. LUC should not only reveal how urbanization accelerates, but also how it corresponds to population dynamics, economic development, and ecological impacts [11].
Previous studies have highlighted the importance of assessing LUC from diverse perspectives, including socioeconomic and environmental implications [11], urban climate effects [12], energy demands [13], and hydrological changes [14]. However, previous research has primarily concentrated on the narrowly defined urban areas, neglecting spill-over impacts on broader surrounding regions. This research gap hinders a comprehensive understanding of how various factors interplay to shape land transformation across the wider region, especially in the NCD context, characterized by uncertainty and rapid change [15]. Instead of treating LUC merely as a consequence of urban expansion, it should be studied as a central driver in shaping urban form, equity, and sustainability.
Epistemologically, current research suffers from inconsistencies in how LUC is measured, interpreted, and applied. Despite advances in LUC research using remote sensing, spatial modeling, and socio-ecological assessments that utilize multiple drivers [16], debate persists over the most representative factors of land transformation. Factor selection is often based on subjective criteria, shaped by individual researcher perspectives, data availability, or methodological convenience [17]. As a result, the indicators used to analyze LUC may not fully capture the complex interactions of urban components. Certain researchers advocate for the inclusion of complex urban factors to enhance accuracy [18], while also addressing urban issues that emerge in land dynamics [19]. This inadequate methodological framing constrains the ability of urban planners to interpret LUC in ways that support responsive land use strategies.
Addressing these conceptual and methodological inconsistencies is therefore essential to advance a more systematic understanding of urban land transformation. The study introduces a methodology for responsible urbanization in NCDs by systematically identifying the key LUC indicators at the system level through predictive and preventative approaches. The innovation of this study lies in integrating these perspectives within a single framework to assess urbanization in NCDs, linking spatial drivers of land transformation with socio-ecological risks. While predictive measures capture dynamic processes of spatial change, preventive thinking involves adaptive factors that moderate land transformation to sustain ecological and social resilience. Unlike conventional LUC studies that focus solely on urban expansion intensity, this study emphasizes system-level indicator interactions for responsible urbanization in newly developing regions.
This paper first synthesizes previous scientific studies to identify and prioritize indicators that influence LUC and anticipate urban challenges for sustainable future development. More specifically, this study addresses the following research questions to support the development of the framework: (RQ1) Which spatial driving forces predict LUC? (RQ2) Which issues or challenges in LUC need to be anticipated for the future urbanization in NCD? By answering these questions, this study aims to derive a conceptual framework for integrating predictive and preventive LUC indicators to measure urbanization within the context of NCDs. Such an approach would allow better strategic land use management and planning, thereby facilitating a more accurate response to urbanization and promoting sustainable urban growth.

2. Theoretical Foundation

The concept of urban expansion is essentially rooted in physical development outward, driven by socio-economic dynamics and infrastructural development that exceeds city boundaries. This phenomenon inevitably results in irregular and sprawling growth in rapidly developing areas, effectively transforming rural landscapes into NCDs [20]. Such expansion into adjacent rural areas not only intensifies land use trade-offs and ecological degradation but also reinforces economic agglomeration and spatial dependencies within metropolitan areas [21]. Several scholars have confirmed that urban sprawl contributes to habitat destruction, as well as water, food, and energy scarcity [22,23]. These drawbacks ultimately worsen the quality of urban life and regional inequality, requiring effective land management strategies. Therefore, urban expansion must be examined to effectively manage urbanization trajectories, necessitating an understanding of physical spatial processes to mitigate the effects of urban development.
In response to urban expansion, new town constructions have become prevalent strategies to address population density, traffic congestion, environmental challenges, and stimulate economic growth [10,24]. Unfortunately, investigations into rapid NCDs in the Global South over the past two decades have underscored the significant socio-economic, environmental, and politico-institutional challenges. These projects are frequently associated with speculative development and spatial exclusion [3,25]. Similar governance and spatial tensions have been evident in Europe, where peri-urbanization and new-town initiatives confront fragmented governance and socio-spatial inequalities, even within mature planning frameworks [26]. In Germany, for example, greenfield developments reveal contested planning processes and trade-offs between housing demand, sustainability, and social inclusion [27]. Collectively, these cases demonstrate that large-scale development projects, regardless of context, often exacerbate spatial fragmentation and urban inequality, thereby fostering spatial consumption that is misaligned with long-term sustainability goals [28]. Many NCDs are frequently designed as comprehensive, self-contained enclaves that lack urban diversity [28,29]. As [30] argued, urban transformation should not be viewed as fixed entities or isolated projects, but rather as a multiscale process shaped by macro-structural forces and local dynamics that define evolving urban patterns and pathways. Previous research has highlighted the insufficient understanding of the long-term sustainability of NCDs and their implications for urban planning [25]. Therefore, longitudinal studies are crucial for comprehending their spatial dynamic impacts to guide scenario-based planning towards long-term sustainability [15,20].
In this regard, the sustainable land management (SLM) perspective offers a crucial framework for directing responsible urban expansion. This approach emphasizes the importance of balancing ecological services, economic functions, and social equity, which are crucial for shaping spatial structures and influencing land use decisions in NCD [31]. Despite its potential application in urban land systems, recent reviews by [32] highlighted that SLM research still faces significant methodological and conceptual limitations, including a lack of harmonized indicators and limited adoption of vulnerability-oriented assessments.
Research on SLM increasingly aligns LUC and urbanization studies, prompting scholars to utilize more specific models and indicators to promote sustainable urban development [16]. However, the lack of integrated data, analytical tools, and methodological frameworks for effectively monitoring future urban development continues to hinder the translation of sustainability principles into actionable strategies supported by empirical data and spatial analysis [32,33]. While many LUC models successfully predict urban growth, they largely reflect mature urban systems with established socio-political structures and long historical datasets. These models tend to simulate spatial expansion based on physical determinants or urban attractions, yet overlook crucial sustainability dimensions, such as governance effectiveness, ecological vulnerability, and socio-spatial disparities [34,35]. Consequently, a persistent gap remains between predictive land use modeling and preventive sustainability assessment.
In this way, predictive modeling (identifying where spatial change may occur) is strengthened by preventive land-management thinking (i.e., how spatial change interacts with long-term resilience). As synthesized in Figure 1, the theoretical foundations of this study are based on interlinking the concepts of urban expansion, SLM, and NCD. It illustrates how the conceptual focus, theoretical orientation, and methodological requirements of each domain collectively inform the formulation of an integrated predictive–preventive approach.
In the context of NCDs, the unpredictability of socio-political decisions, speculative land markets, and the absence of historical urban dynamics complicate the evaluation of long-term sustainability outcomes [25,36]. As a result, urban challenges that persist in future development should be considered for responsible land governance and adaptive urban policy. This approach is essential for ensuring that NCDs are not only efficient and well-planned but also sustainable, resilient, and inclusive land governance. A comprehensive understanding of the physical spatial processes underlying urban growth in NCD is essential for planners and policymakers to formulate sustainable strategies for future development and to minimize the risks.

3. Materials and Methods

3.1. Systematic Literature Review

A systematic literature review (SLR) identifies how previous researchers rank and prioritize the factors that influence LUC and how they utilize these factors. Additionally, SLR aims to unveil the relationships between drivers. From these inter-relational indicators, we developed a conceptual framework of interrelated LUC indicators for NCD. The SLR approach evaluates the substance of the content. It synthesizes results from each piece of literature, facilitating a critical analysis that offers a comprehensive overview of a specific topic pertinent to the research question [37]. Following the Preferred Reporting Items for Systematic Reviews and Meta-Analyses (PRISMA) 2020 guidelines, the review was conducted in accordance with recognized systematic review standards to ensure transparency and reproducibility [38]. The completed PRISMA 2020 checklist for this review is available in Supplementary File S2.
To support effective literature searches using specified keywords, the study implemented the Population, Intervention, Comparison, Outcome, and Context (PICOC) criteria to decompose the objectives of SLR into searchable keywords and develop relevant search terms [39]. PICOC guidelines identify and screen the articles to be included in the study, as defined in Table 1. The study also limited the literature selection to peer-reviewed English publications between January 2014 and October 2024, and only selected articles published in the field of Urban and Regional Development following the qualification of the Scopus repository, as this provides an extensive coverage resource, rigorous indexing, and analytical capabilities to conduct literature reviews on land use.
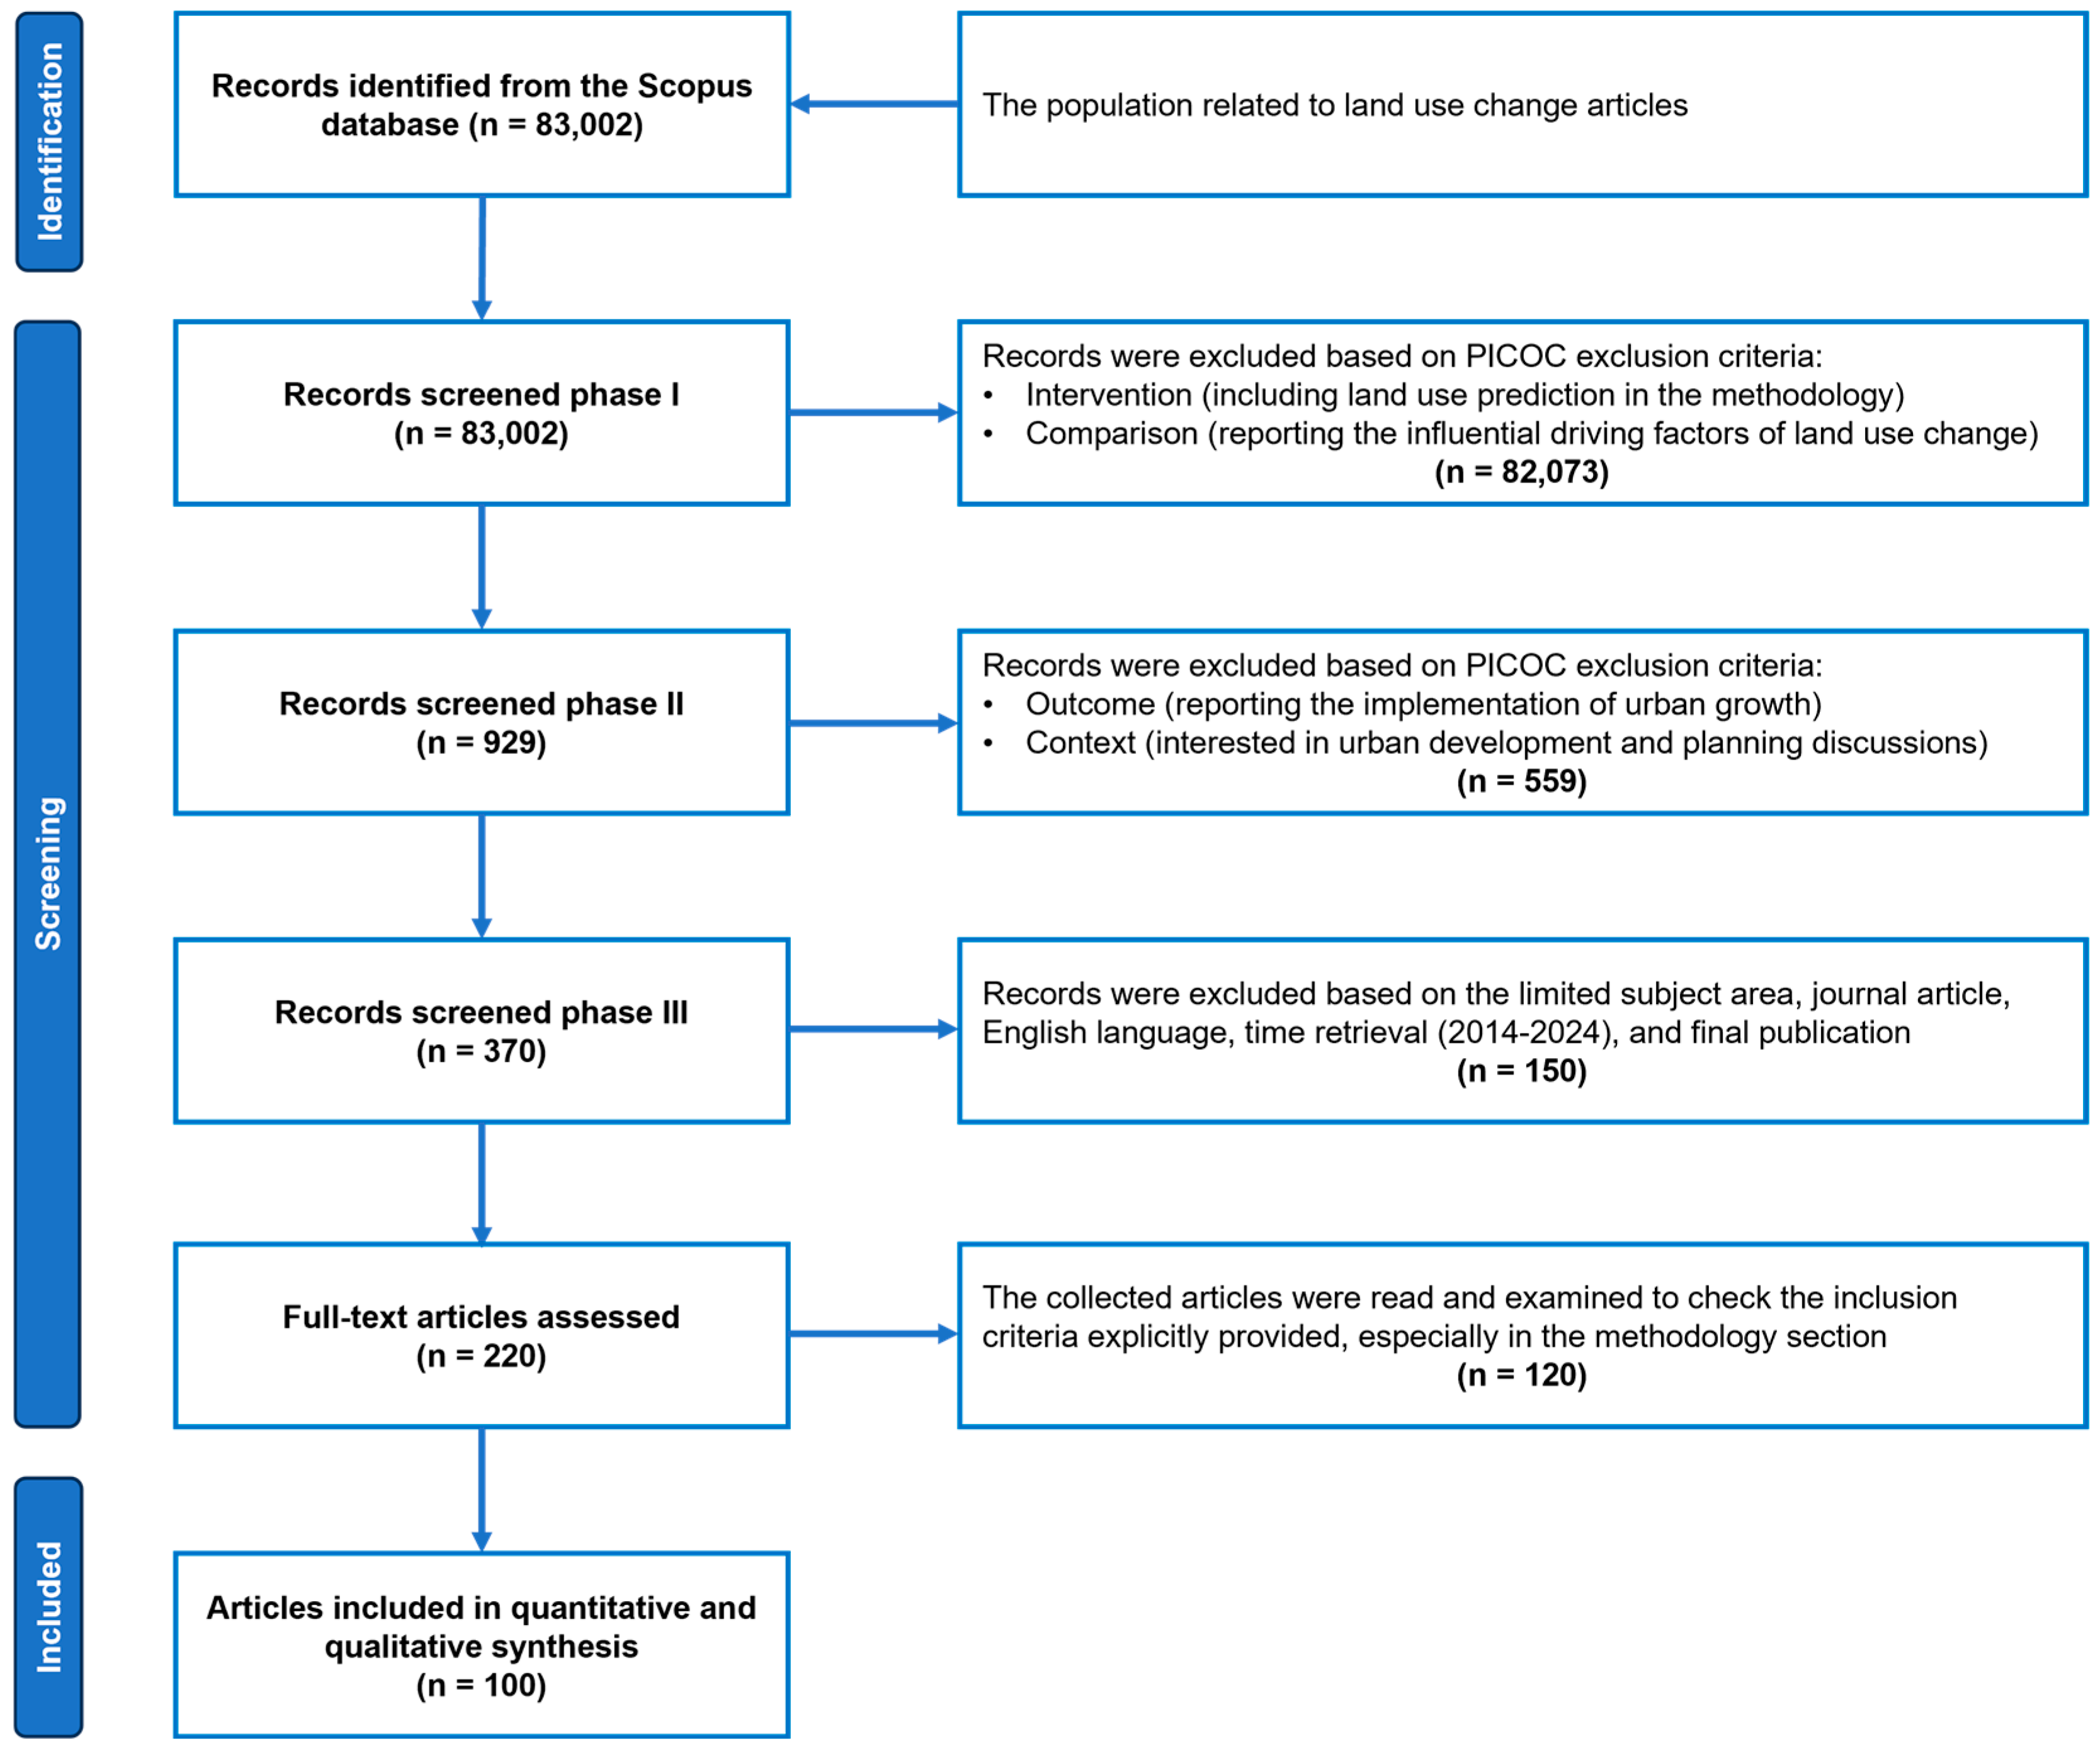
The SLR phases adopted the PRISMA flow diagram, as presented in Figure 2, which summarizes the number of records identified, screened, and excluded based on inclusion criteria. The final query string, detailed in Table S1 of the Supplementary File S1, resulted in 220 documents with titles, abstracts, and keywords. The collected articles were read and examined to verify the explicit inclusion criteria provided in the methodology section. The final screening resulted in 100 articles for subsequent analysis, which are listed in Table S2. Each article was further categorized, coded, and reviewed to address the research questions.
Although the reviewed articles applied varying spatial and temporal resolutions, this study harmonized the indicator terminology to ensure conceptual consistency. Several studies referred to identical LUC factors using different terms, which were standardized under unified indicator labels during the coding and clustering process based on their analytical meaning. This conceptual harmonization minimizes inconsistencies in indicator definitions across studies and alleviates potential bias from terminological or methodological heterogeneity, without altering the original analytical scale. It should be noted that this review focused on identifying and synthesizing relationships among LUC indicators from previously published articles, rather than employing a causal identification design. Any causal terms cited from prior studies were interpreted as associative relationships within the synthesized framework.

3.2. Bibliometric Analysis

Bibliometric analysis functions as a quantitative approach to assess the research trends and contributions in the field. This analysis aims to quantitatively evaluate the literature on publication trends, keyword co-occurrence, and thematic clusters. This technique enables the acquisition of descriptions, data statistics, research hotspots, and absences [40]. The collected articles from the final screening were imported into the VOSviewer version 1.6.20 for constructing and visualizing bibliometric trends [41]. Co-occurrence analysis was performed to identify emerging hotspot trends by assessing the frequency of keywords (nodes) in the articles [40].

4. Results and Analysis

4.1. References Profile Analysis

Figure 3 shows the contribution of journal publications as reference sources in SLR analysis. In general, 100 articles are distributed in 34 journals. The top 5 leading journals with over five records of scholarly articles published on the subject are Land (MDPI), Remote Sensing (MDPI), Journal of Environmental Management (Elsevier), Land Use Policy (Elsevier), and Science of the Total Environment (Elsevier).
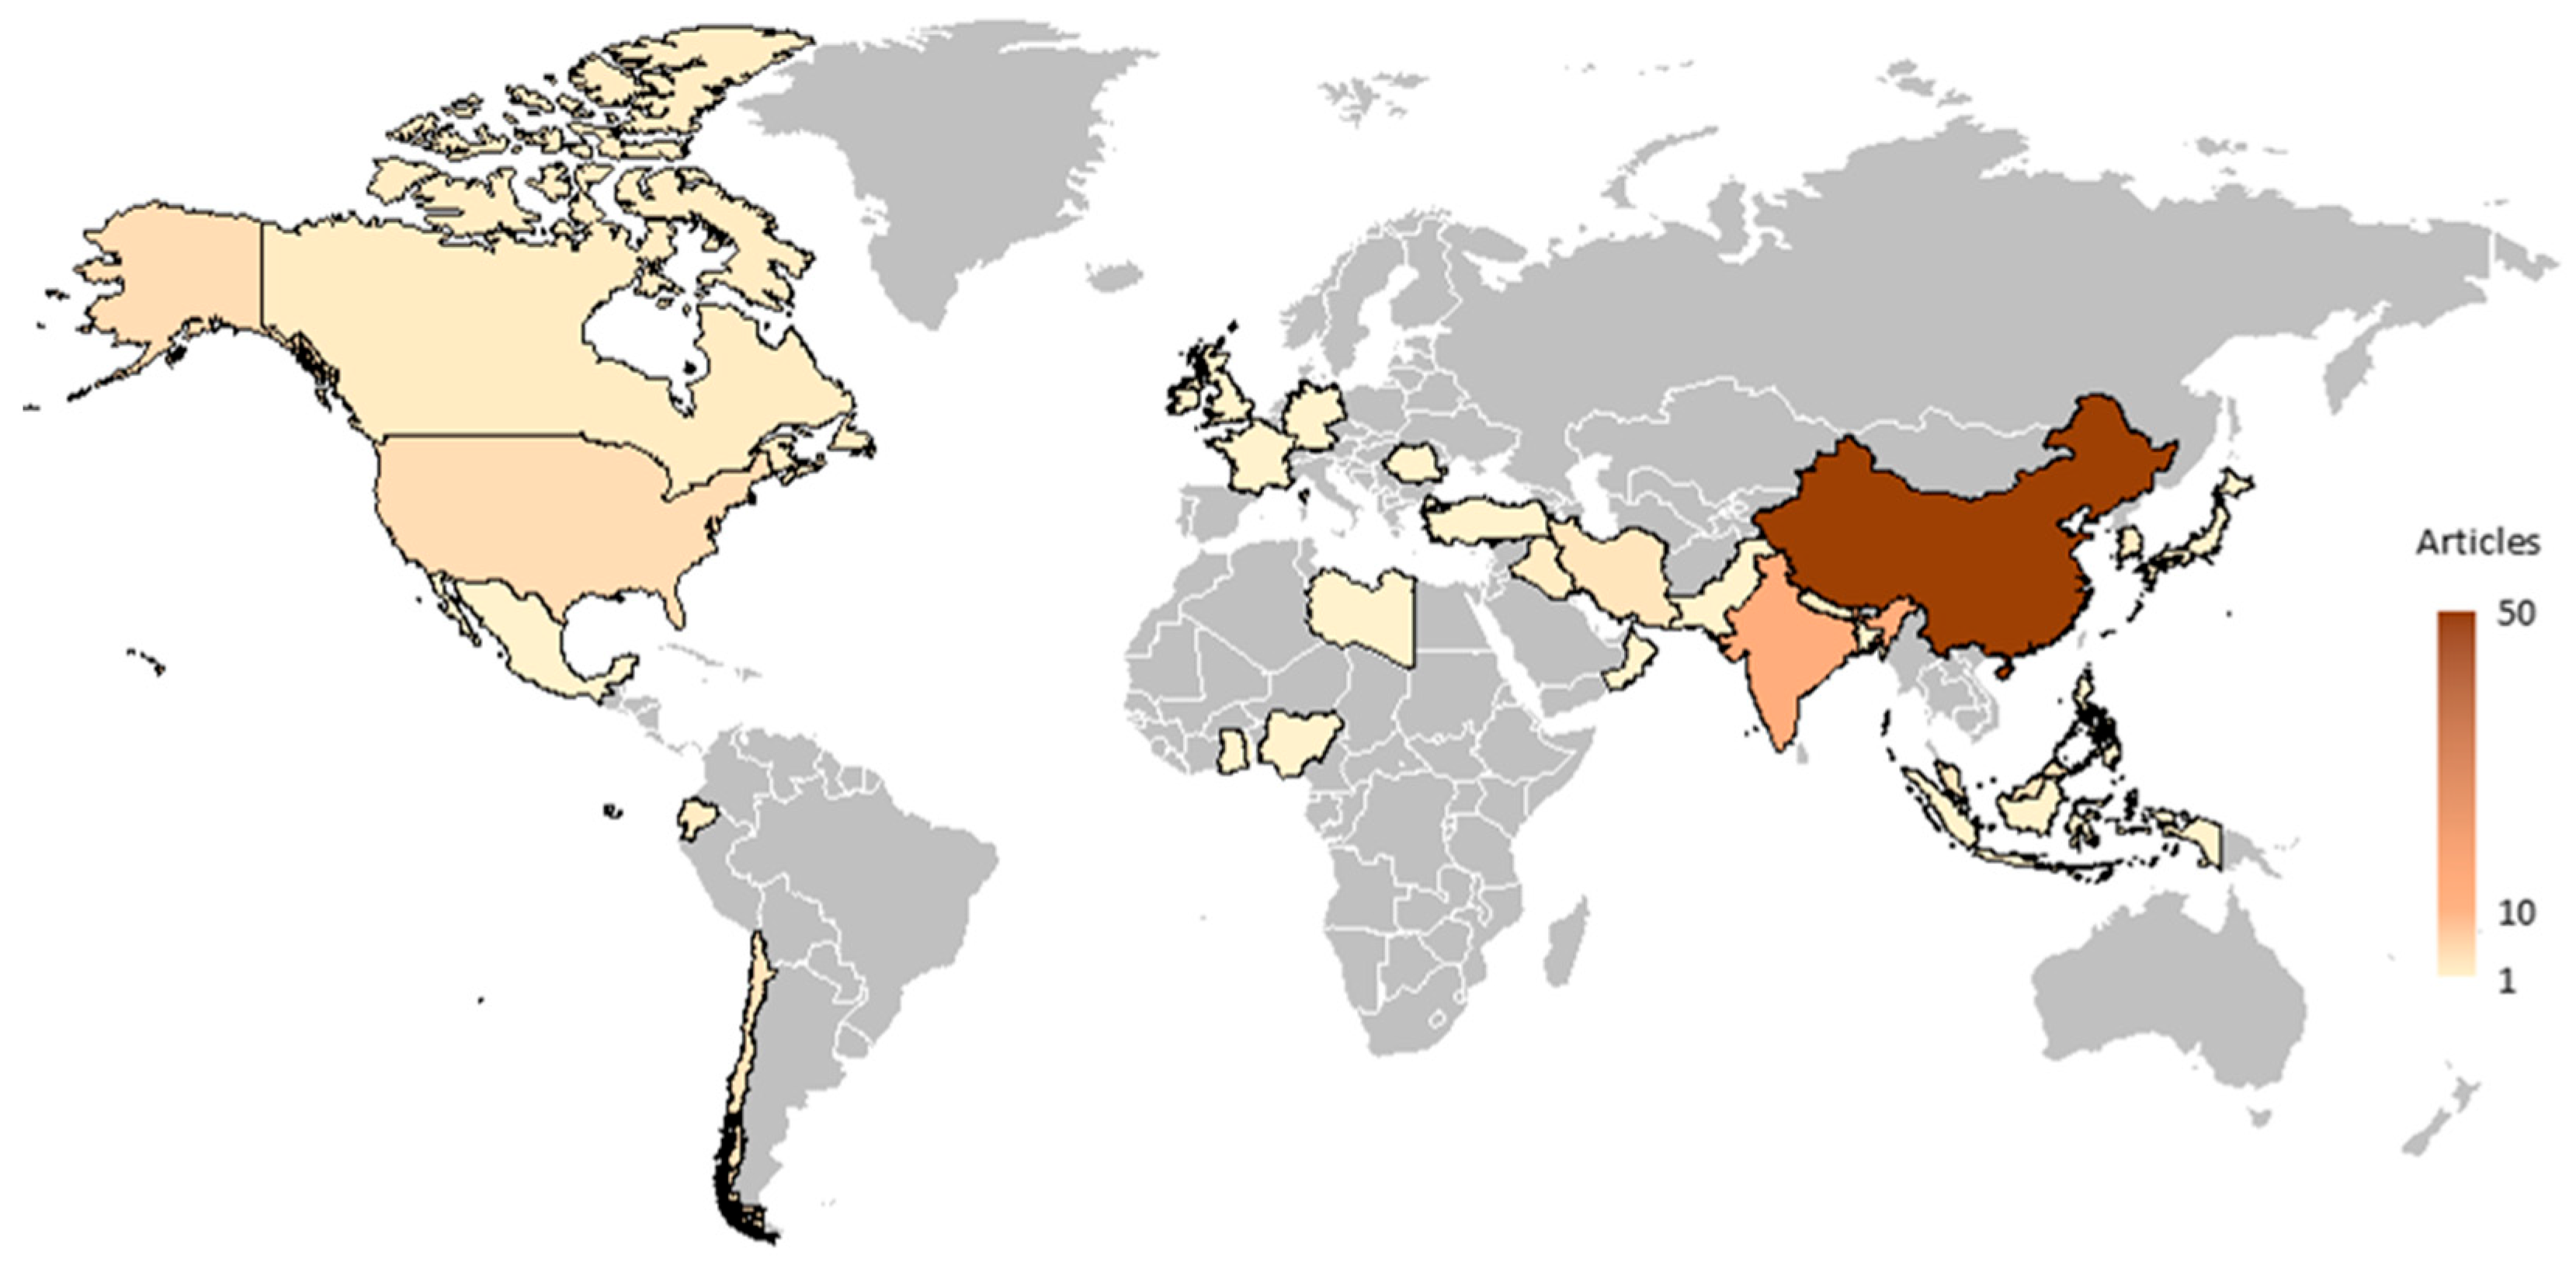
As shown in Figure 4, the selected articles originate from case studies across Asia, America, Africa, and Europe, offering diverse perspectives on the current study. However, the distribution within each region appears to be disproportionate. Mainland China is the most frequently observed case study location, associated with almost half of all cases. In addition, LUC analysis location from India accounted for 12 articles, the United States for four articles, while case studies from Chile, Malaysia, and Iran each had three articles. Furthermore, according to the analysis scope, the selected articles predominantly include regional units, comprising 44%, encompassing metropolitan areas, watersheds, provincial, and national units. Research conducted at the city administration constitutes 43%, while the remainder uses small towns as case studies.
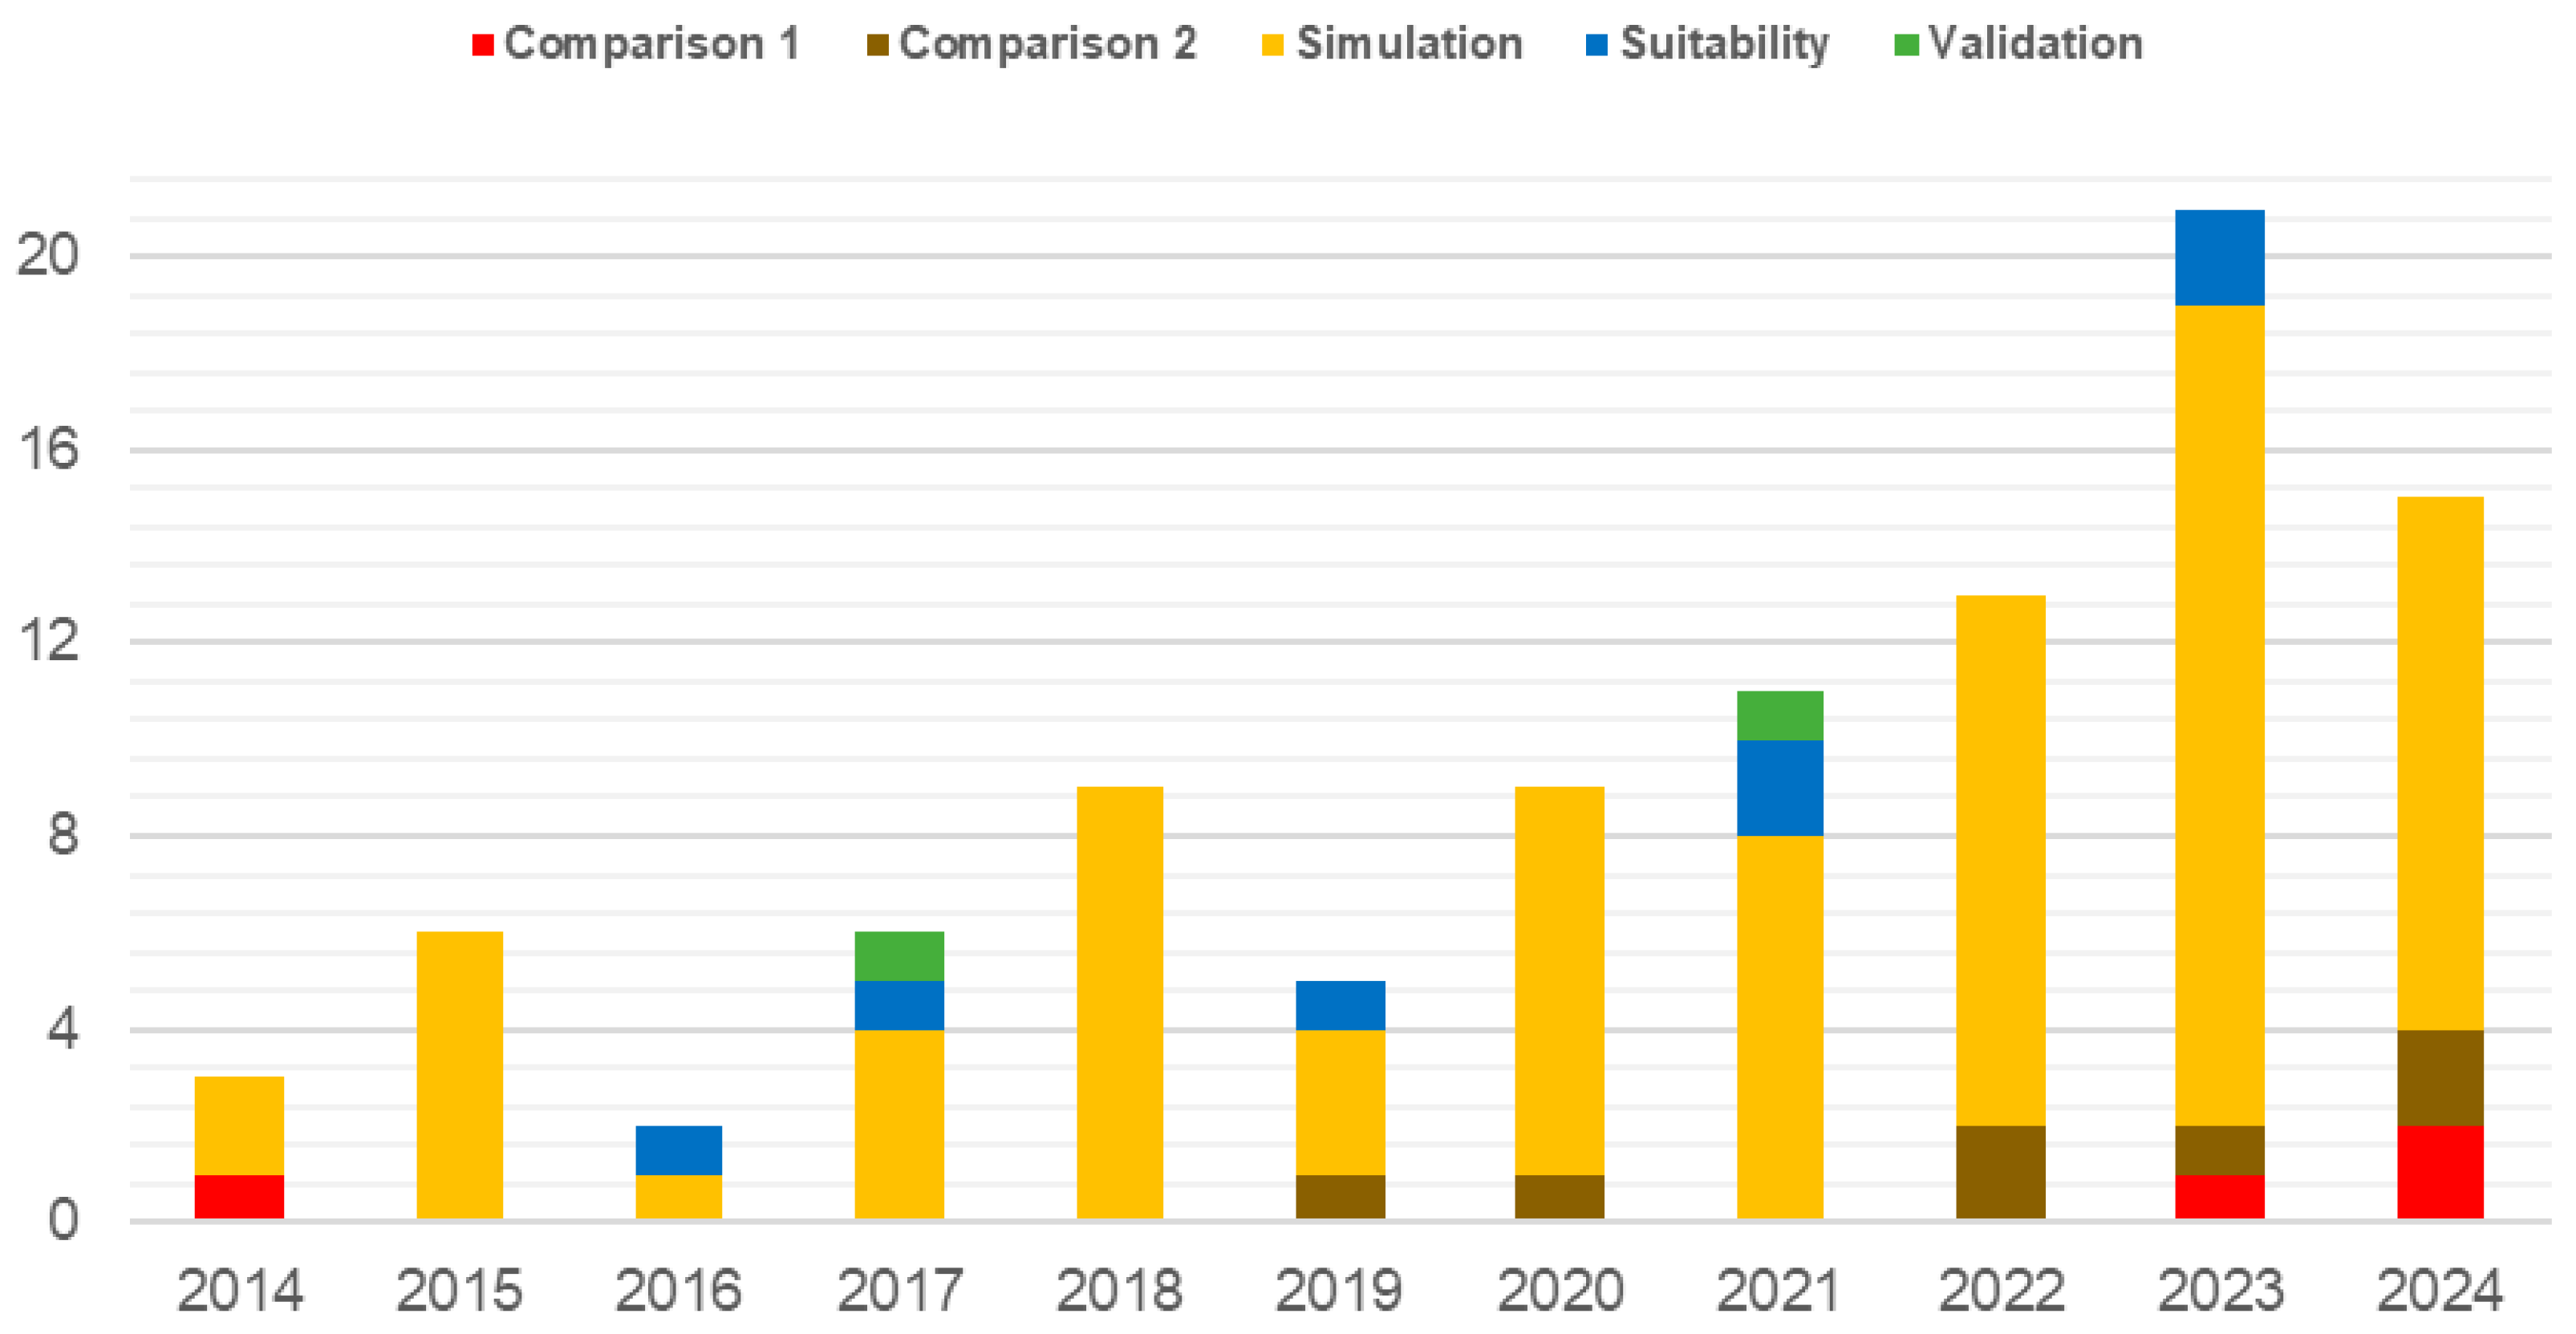
Finding the substantial development in LUC references and their classification based on model type is another source of analysis, as illustrated in Figure 5. The rise in quantity is accompanied by a discernible temporal distribution, categorized into five analytical models. The simulation-type articles are almost half, which analyze LUC patterns, project urban growth over time, and assess its implications under various policy scenarios. Since 2016, only 1–3 studies have focused on the Suitability model, assessing the potential of different land areas for various uses of urban development and non-urban land based on multiple drivers and constraints. There are 1–2 Validation model articles that evaluate the accuracy and reliability of growth rules in land use transformation, ensuring that the predictions produce accurate results closely aligned with real-world data. Moreover, Comparison Model 1 evaluates multiple simulation methods at each stage, whereas Comparison Model 2 assesses the accuracy of simulations generated by various factor weighting techniques.

4.2. Review Results

4.2.1. Primary Concept of Predictive Indicators

Concerning indicators that influenced future LUC from research trends, Figure 6 shows hotspots and connections in LUC indicators based on factors used (nodes) in articles. In the red and green clusters, urban attraction sites and accessibility are inspected. These indicators provide convenience for public service needs and ensure appropriate transportation for daily mobility [42]. Physical geography indicators, which consider land surface stability under urban structure [18], and socioeconomic indicators that encourage the flow of people into an urban region for work [43] are included in the blue cluster. The climate–environment parameters primarily associated with climate risk for urban development belong to the green group [44].
Slope and elevation are primary factors representing indicators in the physical geography category, frequently analyzed by researchers, and are essential in assessing land changes. These two factors are typically considered natural constraints on the expansion of constructed land [45,46]. This indicator exhibits the highest link strength, indicating a robust relationship, and is frequently integrated with other factors in LUC studies. Socio-economic indicators, such as population density and GDP, often reflect social distribution and economic activity, significantly affecting land demand [47]. Variability in factors is evident in the urban attraction indicator, particularly concerning proximity to activity centers and road networks. Activity centers are typically linked to urban areas, urban centers, and central business districts. Alongside general roads, numerous researchers have examined the classifications and types of road networks to elucidate their impact on land use dynamics. Environmental indicators, including precipitation and temperature, exhibit strong correlations with the growth of green areas [48].
The clustering derived from the frequency observed in the literature offers a distinct preliminary overview of the factors involved. However, the results produced by VOS Viewer exhibit a biased definition that can be attributed to the combined form of inconsistent factors. Consequently, the identified factors related to LUC indicators were systematically categorized into five distinct categories for subsequent analysis.

4.2.2. Physical Geography Category

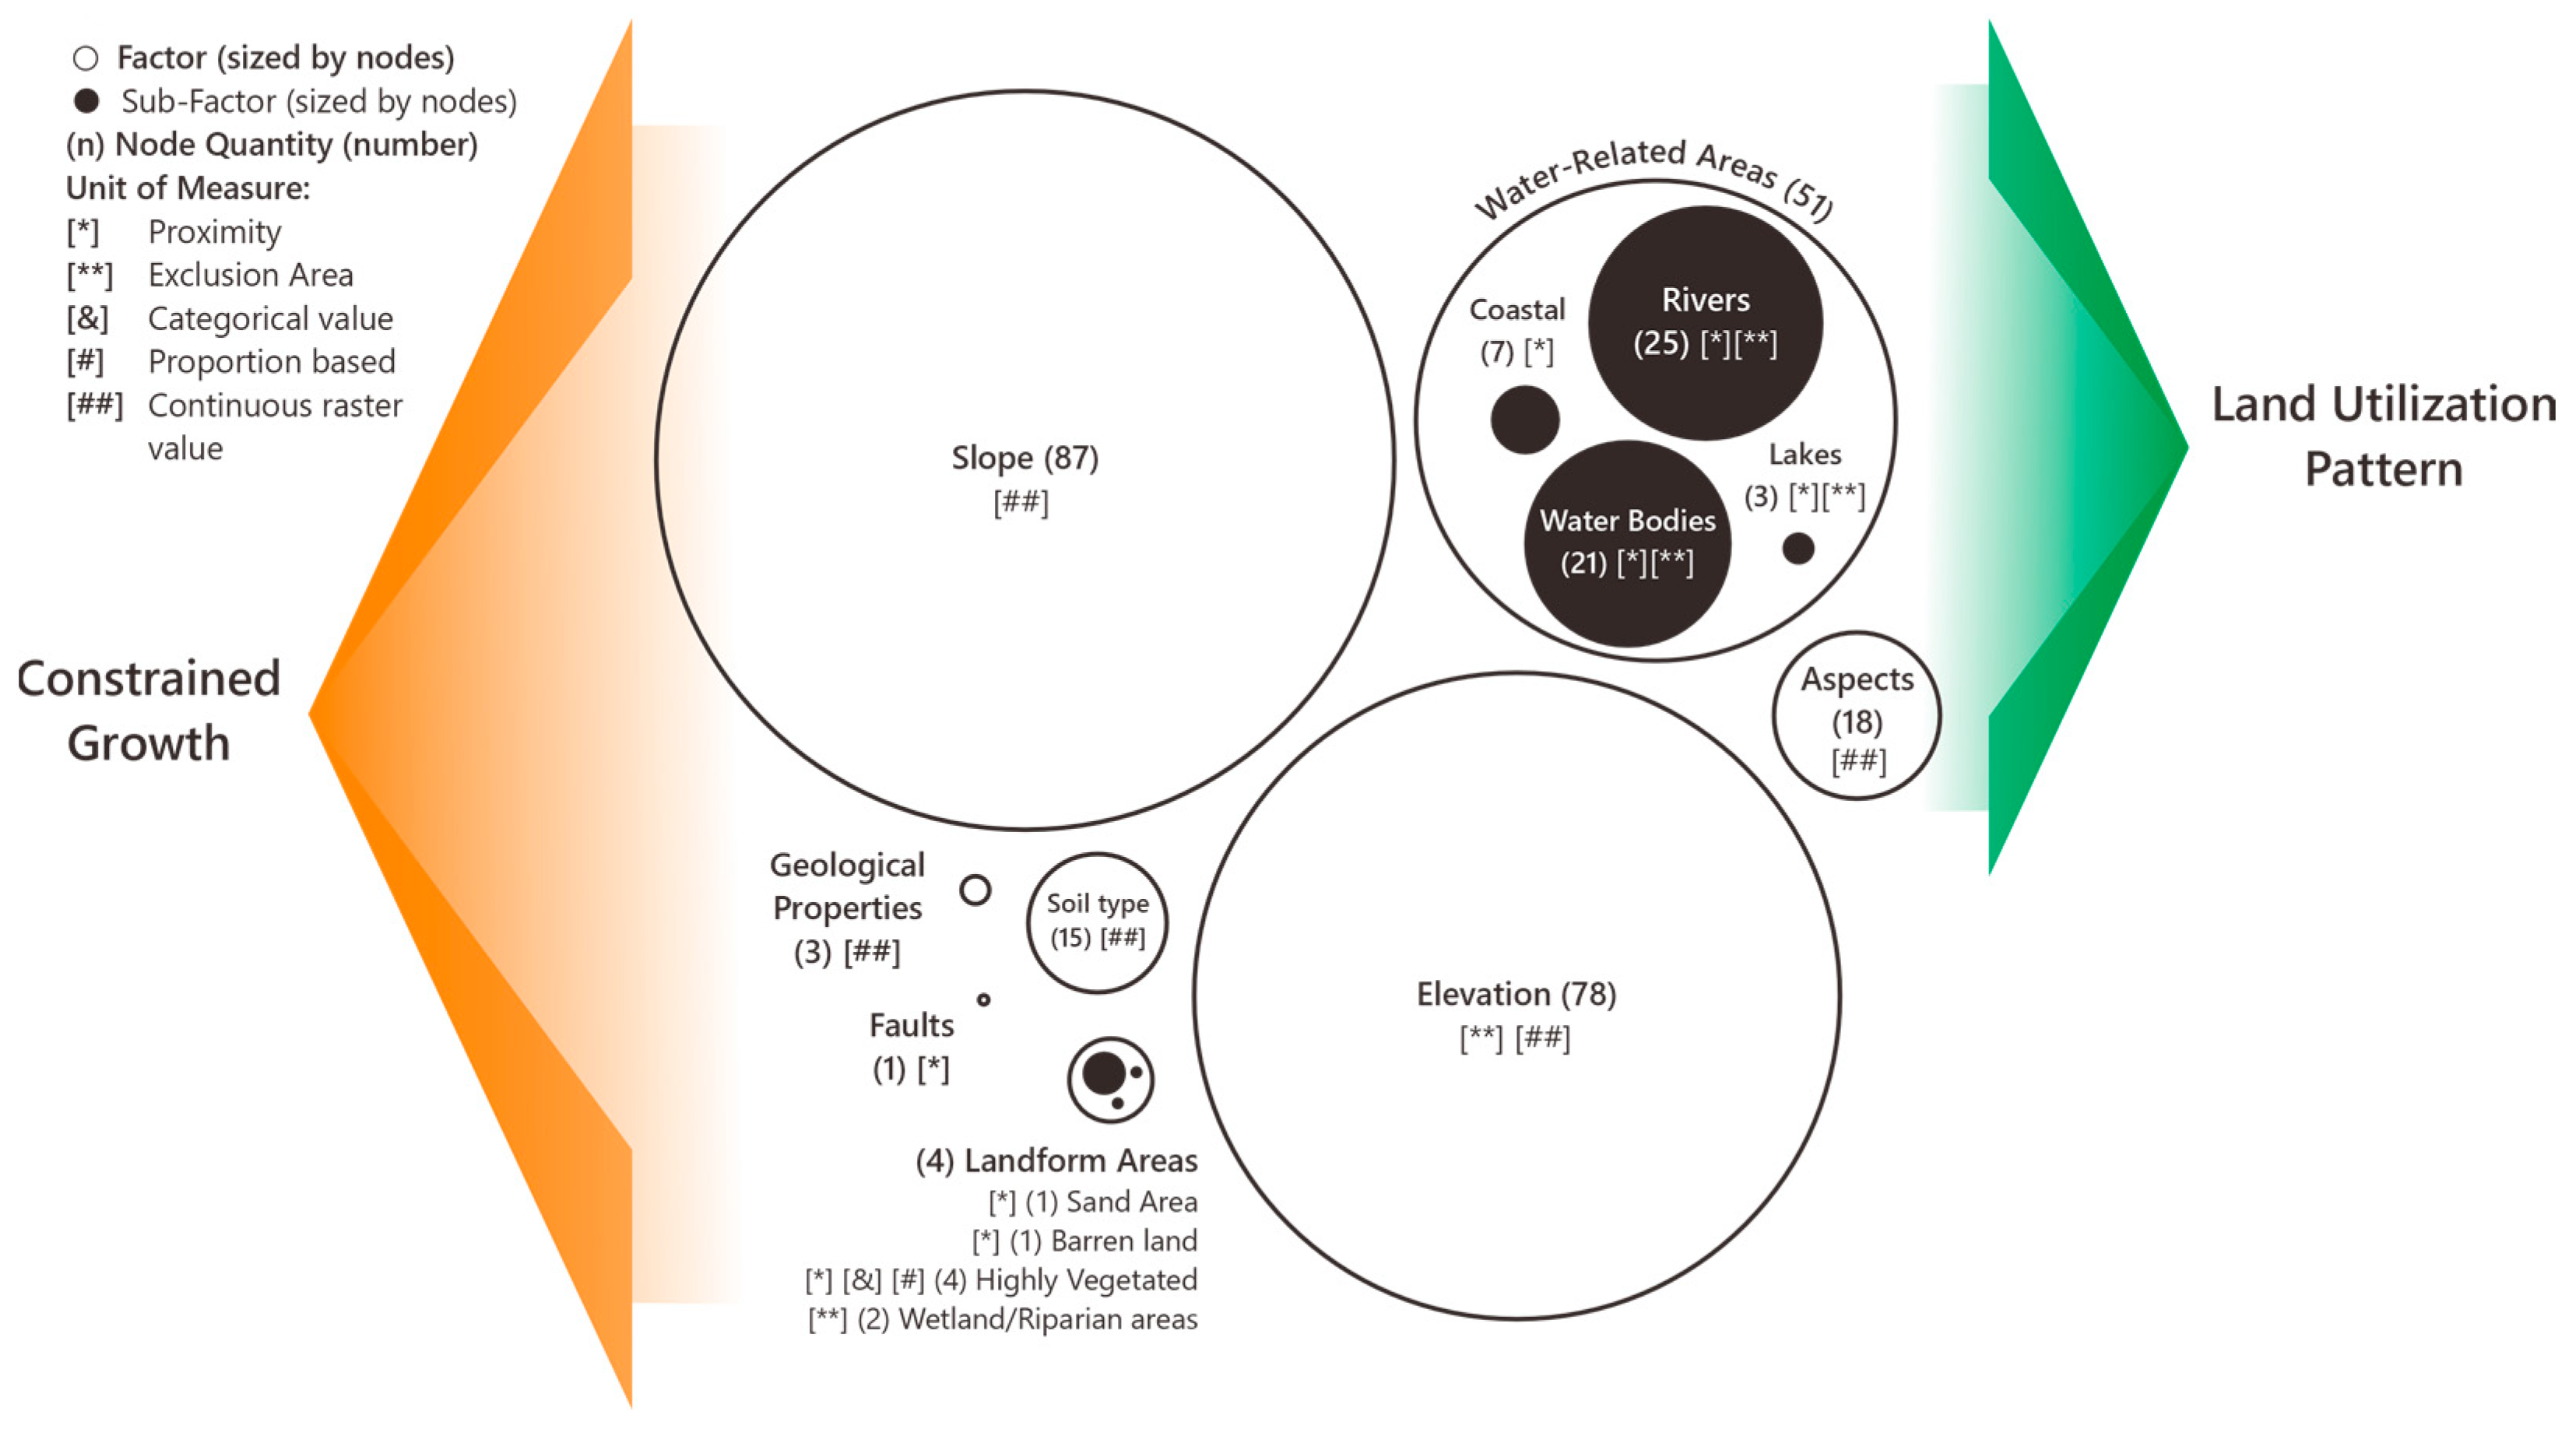
Physical geography encompasses natural elements, including landforms, vegetation, and geomorphic processes, which are essential for understanding LUC. The findings present eight factors in this category, as shown in Figure 7 and described in Table S3. Slope and elevation are the most frequently considered factors in this group. Almost all factors identified in the literature act as constraints on urban expansion, including slope, geological properties, soil type, distance to faults, and distance to ecological landform areas, as indicated by the orange arrows in Figure 7. These constraints help delineate ecological strengths and vulnerabilities to mitigate the adverse impacts of LUC [49], supporting responsible and sustainable land management.
Elevation and slope are critical determinants because they influence accessibility and construction feasibility [50,51]. Urban areas generally prefer lower altitudes and flat surfaces due to reduced construction costs and a lower risk of landslides [52]. Similarly, evaluating ground stability based on soil and geological conditions is vital for measuring soil erosion and earthquake risks [53]. Areas adjacent to waterbodies and wetlands are frequently prioritized for agricultural and regulated land use to mitigate flood risks, thereby preventing increased surface runoff resulting from the expansion of impervious surfaces [54]. Therefore, steep slopes, elevated elevations, and susceptible ground properties can delineate fragile areas and vegetation growth, which is crucial for the preservation of ecological resource services, the mitigation of natural hazards, and the maintenance of microclimate [55,56]. Additionally, this aspect has been reported to influence land use decisions, as south-facing slopes in the Northern Hemisphere receive more sunlight and may be more suitable for specific crops or development types [44,57].
Although most indicators in this category limit urban growth, some studies have identified anomalies. As indicated by the green arrows in Figure 7, elevation, proximity to water bodies, and aspect have been found to form specific land use patterns, especially for residential and agricultural land that are highly dependent on environmental services. For example, residential development has historically been more common near lakes, rivers, and coastal areas due to the accessibility of water resources for sanitation, agriculture, and transportation [58]. Moreover, the presence of aesthetic natural landscapes led to the concentration of urban sites in hilly regions and along coastlines [49,59]. Further research is needed to incorporate these elements into more contextually relevant LUC models, facilitating better land management techniques and sustainable development.

4.2.3. Climate Environment Category

Climate-environment interactions significantly influence LUC, shaping ecosystems, biodiversity, and atmospheric conditions. This category comprises nine indicators distributed in meteorological conditions and climate-related hazards, as shown in Figure 8. These indicators are characterized by shifts in temperature, precipitation, and extreme weather events that compel land users to adapt, which alter land use patterns.
Precipitation and temperature are the most frequently reported factors, indicated by the larger nodes in Figure 8. Solar radiation and temperature are vital to determining soil quality and crop yield [12,60]. Precipitation, on the other hand, directly affects land use decisions related to water management. Areas with higher precipitation may support more intensive agricultural activities, while regions with less rainfall might see a shift towards less water-dependent land uses [61,62]. Shifts in precipitation and rising temperature trigger agricultural land conversion into urban areas, particularly under conditions of water scarcity and economic pressure [63,64]. Evaporation, representing the moisture and energy exchange in land–atmosphere interactions, has often been analyzed as an indicator to measure LUC impacts. Changes in evaporation rates due to deforestation can alter weather patterns and water availability, heightening flood and drought risks [65]. Furthermore, the use of the PM2.5 factor in LUC prediction was evidenced by [66], but its correlation with LUC remains unexplained. However, Ref. [67] asserted that urban areas tend to have a higher PM2.5 concentration while vegetated landscapes show lower levels. This factor denotes the intensity and typology of land development and has implications for public health and environmental quality.
In contrast, the group of climate-related disasters functions as an environmental constraint, illustrated by the orange arrows in Figure 8. Researchers frequently emphasized the proximity to flood areas as a significant LUC factor because climate change intensifies flood occurrences. In addition, several researchers have confirmed that disaster-prone areas should be protected from urban growth, as it exacerbates hazards and increases the potential for infrastructure damage and loss [68]. Consequently, Floods and other natural disasters should be integrated into land use planning to enhance urban safety and security, thereby promoting urban resilience in development practices.
In summary, climate-related variables remain undervalued in many LUC studies, as indicated by insignificant nodes in each group. However, inclusion of this indicator category in LUC models is essential for aligning urban expansion with existing environmental thresholds and climate change risks [11]. The conceptualization in Figure 8 illustrates that two groups play different roles. The meteorological conditions, including precipitation, temperature, evaporation, solar radiation, and air quality, shape the land use pattern and suitability for agriculture and urban areas. Four indicators in natural and climate-related hazards delineate environmentally sensitive regions. Incorporating these indicators into responsible land management enhances spatial decision-making, builds resilience to climate impacts, and fosters adaptive and ecologically sustainable urban developments.

4.2.4. Socioeconomic Category

It has been found that population growth and demographic structures drive urban expansion by increasing demand for housing, infrastructure, and services [61,69]. Cited studies often assessed demographic characteristics using density rather than growth metrics to capture sprawling development and social sustainability. Although population growth solely indicates variation in population size within administrative boundaries, Ref. [70] employed the urbanization rate to anticipate urban decline due to declining national population growth. Furthermore, demographic trends may also be illustrated by specific components, such as migration rates, the elderly population, and the educated residents. The rise in out-migration to adjacent regions drives peri-urbanization [53], while the welfare population, labor force, and educational attainment expedite urbanization by enhancing mobility and economic activities [71]. In contrast, the elderly population typically demonstrates diminished demand for urban growth [70].
Employment growth and economic development are observed as another central role in LUC. Urban areas with higher employment rates and job opportunities attract migrants, expanding both population and built-up land [71]. The transition from low-productivity agriculture to higher-productivity land use in suburban areas raises employment ratios in secondary and service sectors, thereby enhancing living standards and income, and contributing to urban growth [43]. This influx of workers can stimulate local economies and contribute to overall GDP growth, reflecting regional productivity and investment capacity [47]. On a micro level, Ref. [72] discovered that household income levels exhibit a significant correlation with residential density, indicating that wealthier families prefer lower-density areas and induce new settlement growth in rural regions. Regional economic development has been represented by nighttime light intensity (NTL). While not a direct measure of land use, NTL brightness reveals the spatial distribution of urban development and economic intensity, offering essential insights for land use planning and management [73].
Leading to economic activities and development, the urban area generates market power, likely to undergo future urban expansion. Market power significantly influences the spatial structure of land use by altering land prices, infrastructure development, and housing demands. Land price, a frequently referenced factor, reflects both current and potential land use development and is highly sensitive to legislative and economic changes [74]. Policies related to the deregulation of green belts to stabilize housing prices in metropolitan areas have increased land value and led to extensive land acquisition on the outskirts [75]. Therefore, government policies that influence land price fluctuations and infrastructure investment, as well as market demands in housing, have become the primary determinants of sustainable LUC.
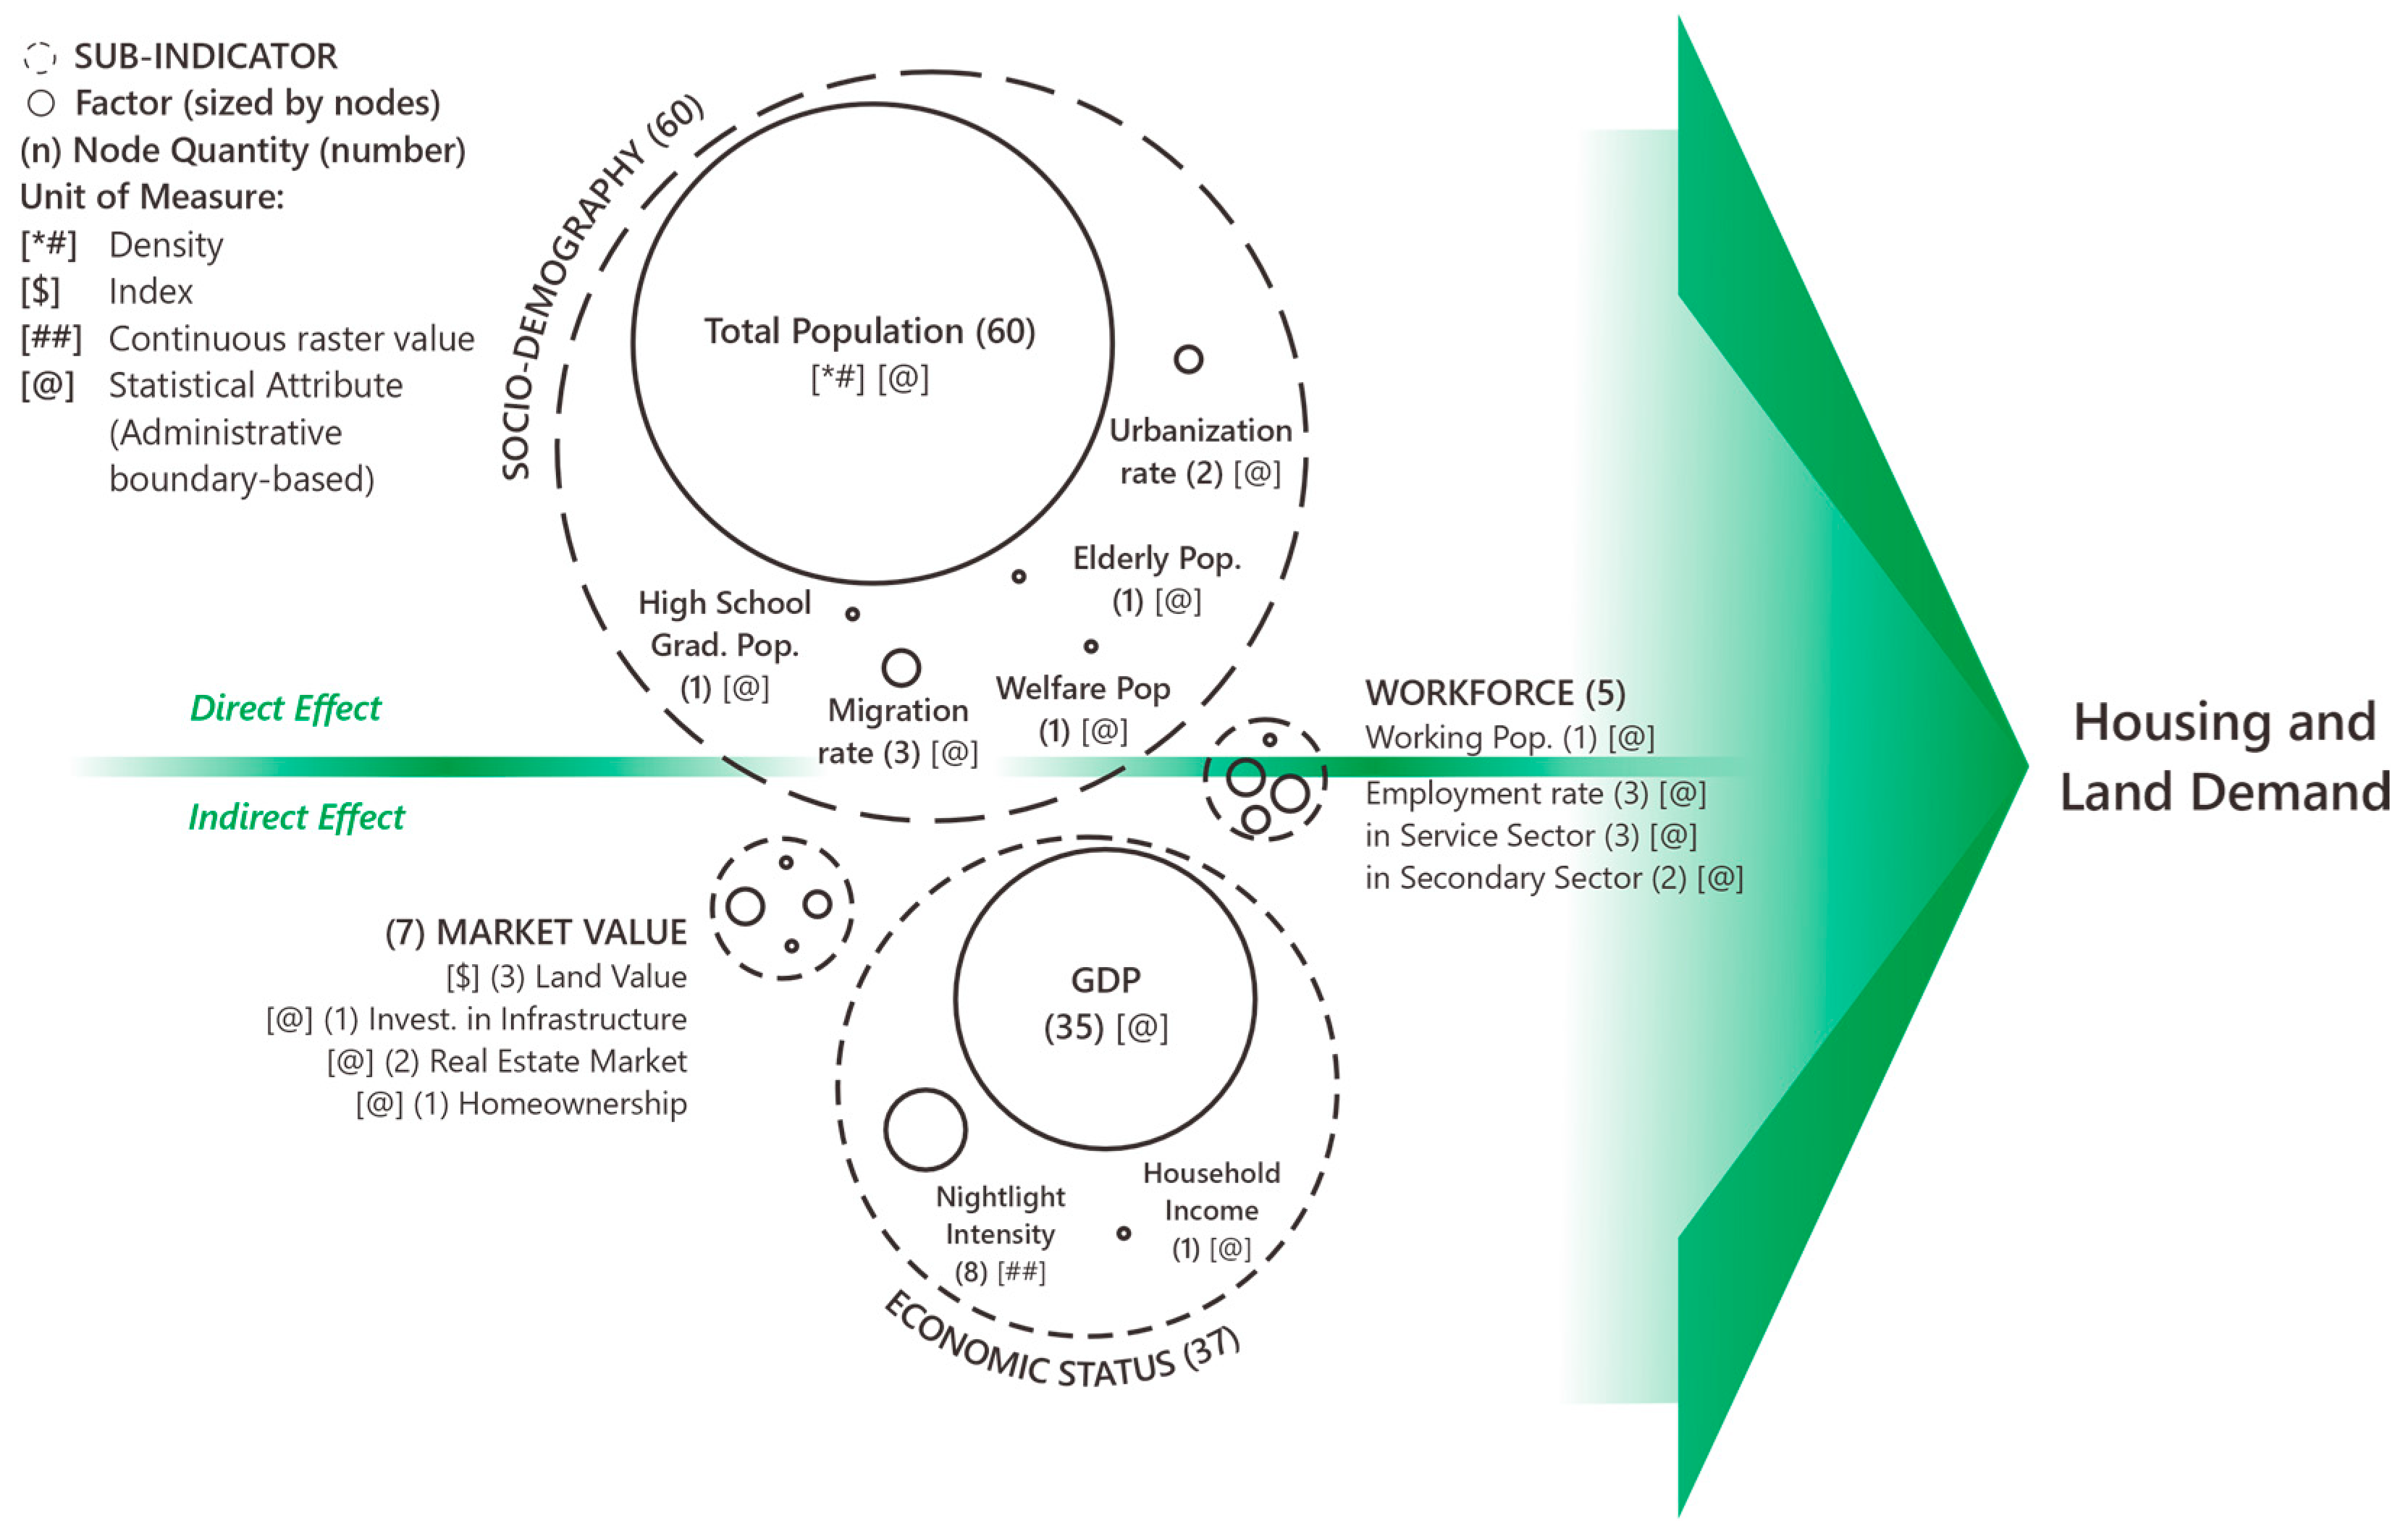
Based on the findings, indicators in the socioeconomic category create a feedback loop where socio-demographic, workforce, economic status, and market value mutually reinforce each other, accelerating economic development and population dynamics, as conceptualized in Figure 9 and listed in Table S5. The socio-demographics (6 indicators) capture residential pressure and spatial dispersion. On the other hand, while seven indicators of economic status and workforce reliably exert indirect effects on shaping urban expansion based on regional productivity, four indicators of market value illustrate a development pattern derived from economic market orientation. Understanding the land dynamics of interrelated socio-economic indicators is essential to assess future LUC, reflecting the socio-economic demand that influences spatial transformation. Their integration into sustainable land management strategies enables the ability to forecast development trends and formulate policies that promote economic growth and social equity.

4.2.5. Urban Attraction Category

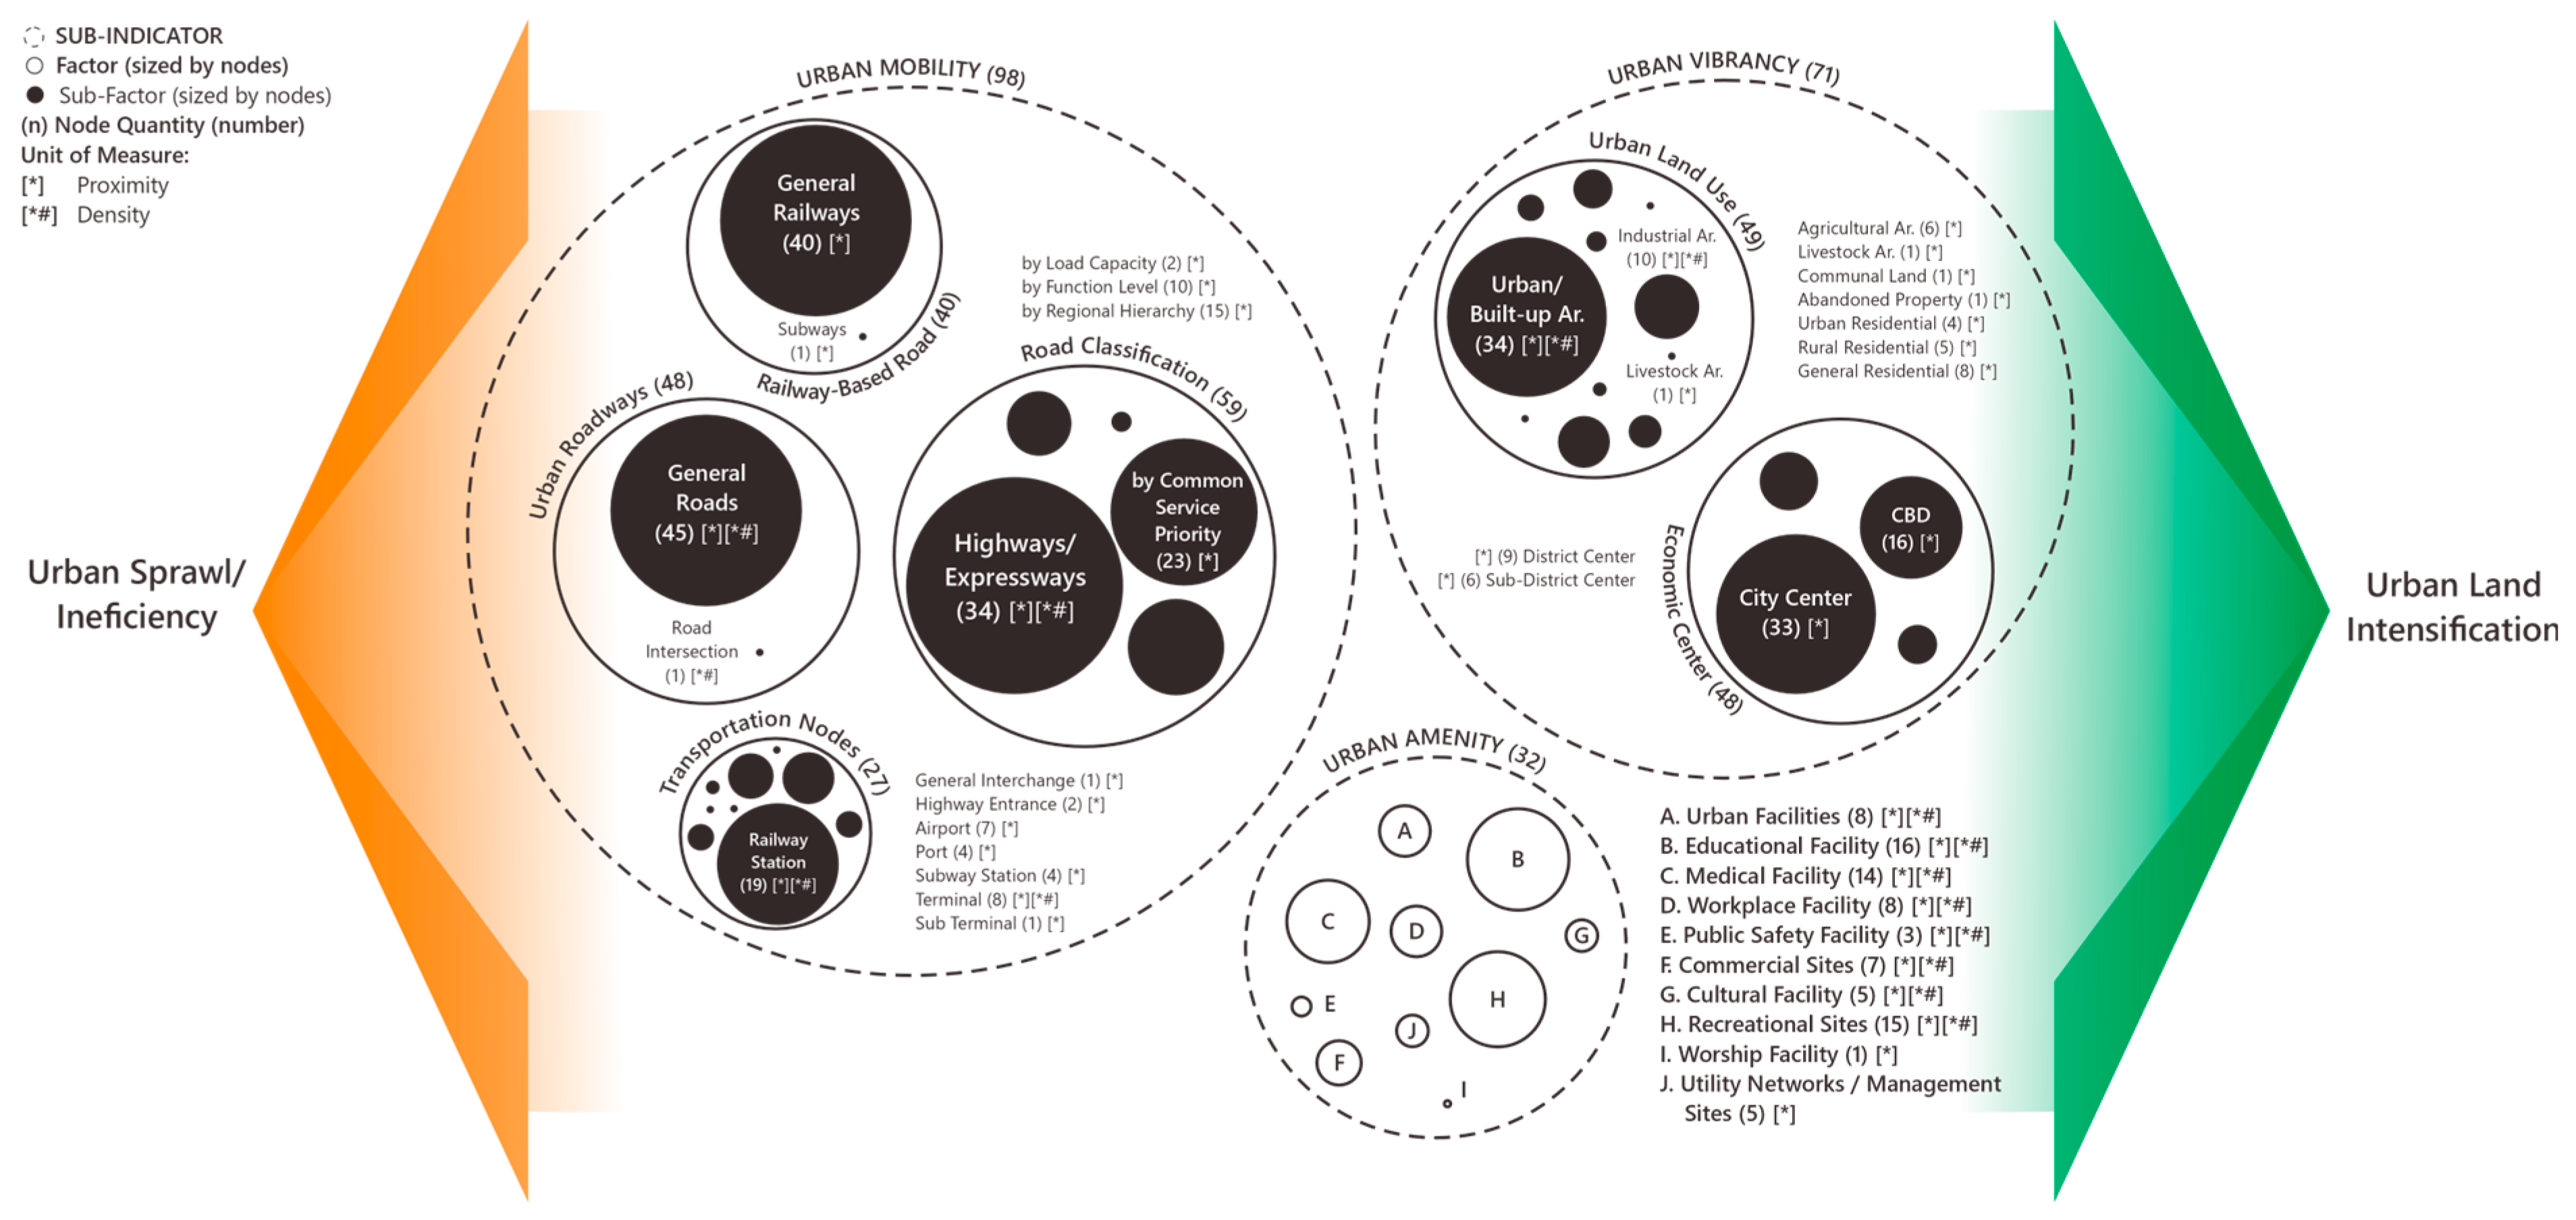
The urban attraction, as presented in Figure 10 and detailed in Table S6, consists of 16 indicators that transform urban spatial structure. This category can be distributed into three main groups: urban vibrancy (2 indicators), amenity (10 indicators), and mobility (4 indicators). The findings indicate that urban attraction can increase land intensity within the urban boundary, as illustrated by the green arrows in Figure 10. Conversely, the orange arrows illustrate that several factors can identify outward infrastructure development and new urban formations.
Urban vibrancy encapsulates the city’s vitality, represented by high population density, dense building structures, and economic exchanges. Most studies assess urban vibrancy through distance to urban centers, which are well-defined as the geographic center of a city, the government center at various levels, and commercial and business activities. However, despite this variation, the urban centers consistently correspond to areas with the highest-density activities, infrastructure availability, and accessibility. Urban growth tends to be concentrated closer to the urban center, generating a gravitational field strength that diminishes with distance [76]. Area closer to the center attracts compact development, while areas further from the city experience slower urbanization rates, often leading to more fragmented land use [76]. A specific vibrant zone often emerges from a particular land use agglomeration, as development tends to cluster around similar land uses, resulting in distinct functional fragmentation and neighborhood effects [77]. Therefore, the most intense LUC occurs close to existing developed areas or residential zones, which is considered an essential factor in land transformation [78]. Dispersed rural residential areas can help elucidate urban sprawl into the outskirts, whereas the proximity to the city center adequately encapsulates the growth of formal residential estates [79].
On the other hand, despite having a lower vibrancy level, urban expansion into rural areas forms sub-vitality zones and contributes to different LUC, mainly due to manufacturing and natural resource extractions. For instance, the boom in the real estate industry attracts businesses and workers, leading to increased demand for residential and commercial land in the vicinity and triggering the growth of new centers [80]. In some cases, areas near industrial, livestock, and mining sites present a negative correlation with residential growth due to environmental pollutants [42,43,81]. In contrast, agricultural land, along with unproductive and low-intensity lands such as communal land [43] and brownfield sites [58], is frequently targeted for conversion. However, massive and uncontrolled urban expansion may still occur in areas with environmental sensitivity and high levels of pollution, necessitating zoning controls [82].
The second component of urban attraction in LUC is generated from amenities. Areas with better facilities, infrastructure, and transportation options were more desirable for residents and businesses, ultimately driving investment and growth. The urban amenities in LUC modeling are often assessed using proximity parameters, delineating the gradation of urban development likelihood. Nonetheless, several researchers employed density to characterize the variation in the vitality of urban amenities [49].
Different types of amenities offer unique attractions, highlighting their diverse impacts on urban development and preferences in land use. Basic urban services, such as educational and medical facilities, contribute positively to population concentration and housing demand as they enhance livability [74]. Commercial and business spaces, including supermarkets, restaurants, and offices, provide economic vitality and attract more workers and educated populations [74]. Cultural amenities, such as museums, galleries, and sports buildings, are often linked to the location decisions of innovative and creative sectors [83]. In addition, recreational sites, such as parks, green spaces, and tourist attractions, improve the overall city aesthetics and attract visitors [84]. Social safety and community security are other concerns for many residents [85,86]. Furthermore, local culture can influence land use preferences, as demonstrated by [86], who highlighted the proximity to spiritual sites, community buildings, and cemeteries, indicating that religion has a profound impact on cultural practices and urban development.
Urban accessibility and connectivity are other fundamental amenities that shape urban expansion, ensuring convenient intra-city commuting and regional movement. Consequently, many researchers frequently utilize proximity to road networks to assess mobility effects on LUC, indicated by higher nodes in Figure 10. Some scholars also considered road density, classification, and travel time to the city center to reflect how varying traffic conditions, road design, and location attractiveness affect accessibility and urbanization level. Various road classifications are frequently employed to elucidate different road attractions, encompassing those categorized by controlled-access, common service priority (major–minor), regional hierarchies (national–district), function (primary–tertiary), and regulatory load classes (first–third class). While roads remain the primary consideration for assessing LUC from a mobility perspective, rail-based transportation and public transit hubs are gaining recognition. The rail network, including railways, subways, and stations, provides continuous transit despite increasing traffic congestion, improving commuting, and economic endeavors [54]. The proximity to public transport interchanges, including stations, terminals, bus stops, airports, and ports, significantly impacts the concentration of development land by providing access via diverse transportation modes.

4.2.6. Policy and Regulation Category

Government land use policies tend to affect LUC by influencing spatial structure. The planned urban development zones have a more substantial effect on directing urban growth toward designated areas for new constructions, encouraging compact urban forms [87]. In some cases, these zones are established as emerging satellite towns [88,89], commonly located in the outer suburbs. These new towns are constructed with independent amenities and sufficient transportation through road networks [81], highways [88], and railway systems [71], thereby fostering regional integration and emerging as pivotal areas for future growth.
The other form of new development zone often functions as a new political center or special economic zone (SEZ) for modernization. SEZs aim to balance regional economies in underdeveloped areas by encouraging investment in industrial, trade, and services sectors [81,90]. For instance, Shenzhen, Tianjin, and Xiong’an in China have expanded construction land to become regional economic agglomeration centers following the establishment of SEZs [11,75]. Another form of SEZ in the city center of London has been established as the Central Activities Zone and Intensification Points to intensify commercial, business, government, cultural, and residential uses in an infilling and compact development approach [58]. These emergent cases highlight the important roles of policy in shaping land use structures and directing expansion.
Besides their catalytic effects, factors in this category also exhibit repressive effects on urban growth, preserving ecological services, food availability, and cultural resources. Biodiversity protection emerges as the primary regulatory objective, as uncontrolled land conversion in ecologically sensitive zones can lead to floods, landslides, and droughts. Policy interventions are needed in ecological land preservation zones, including forest areas in high, topographic plains [43,81], water protection areas [55,89], wildlife habitats [52,91], natural heritage sites [47,56], and a marine–land transitional zone [54]. Furthermore, policies aimed at protecting agricultural land are another vanilla concern to secure food resources [92,93]. Similarly, cultural heritage areas restrict LUC to maintain historical integrity and cultural assets [50,54].
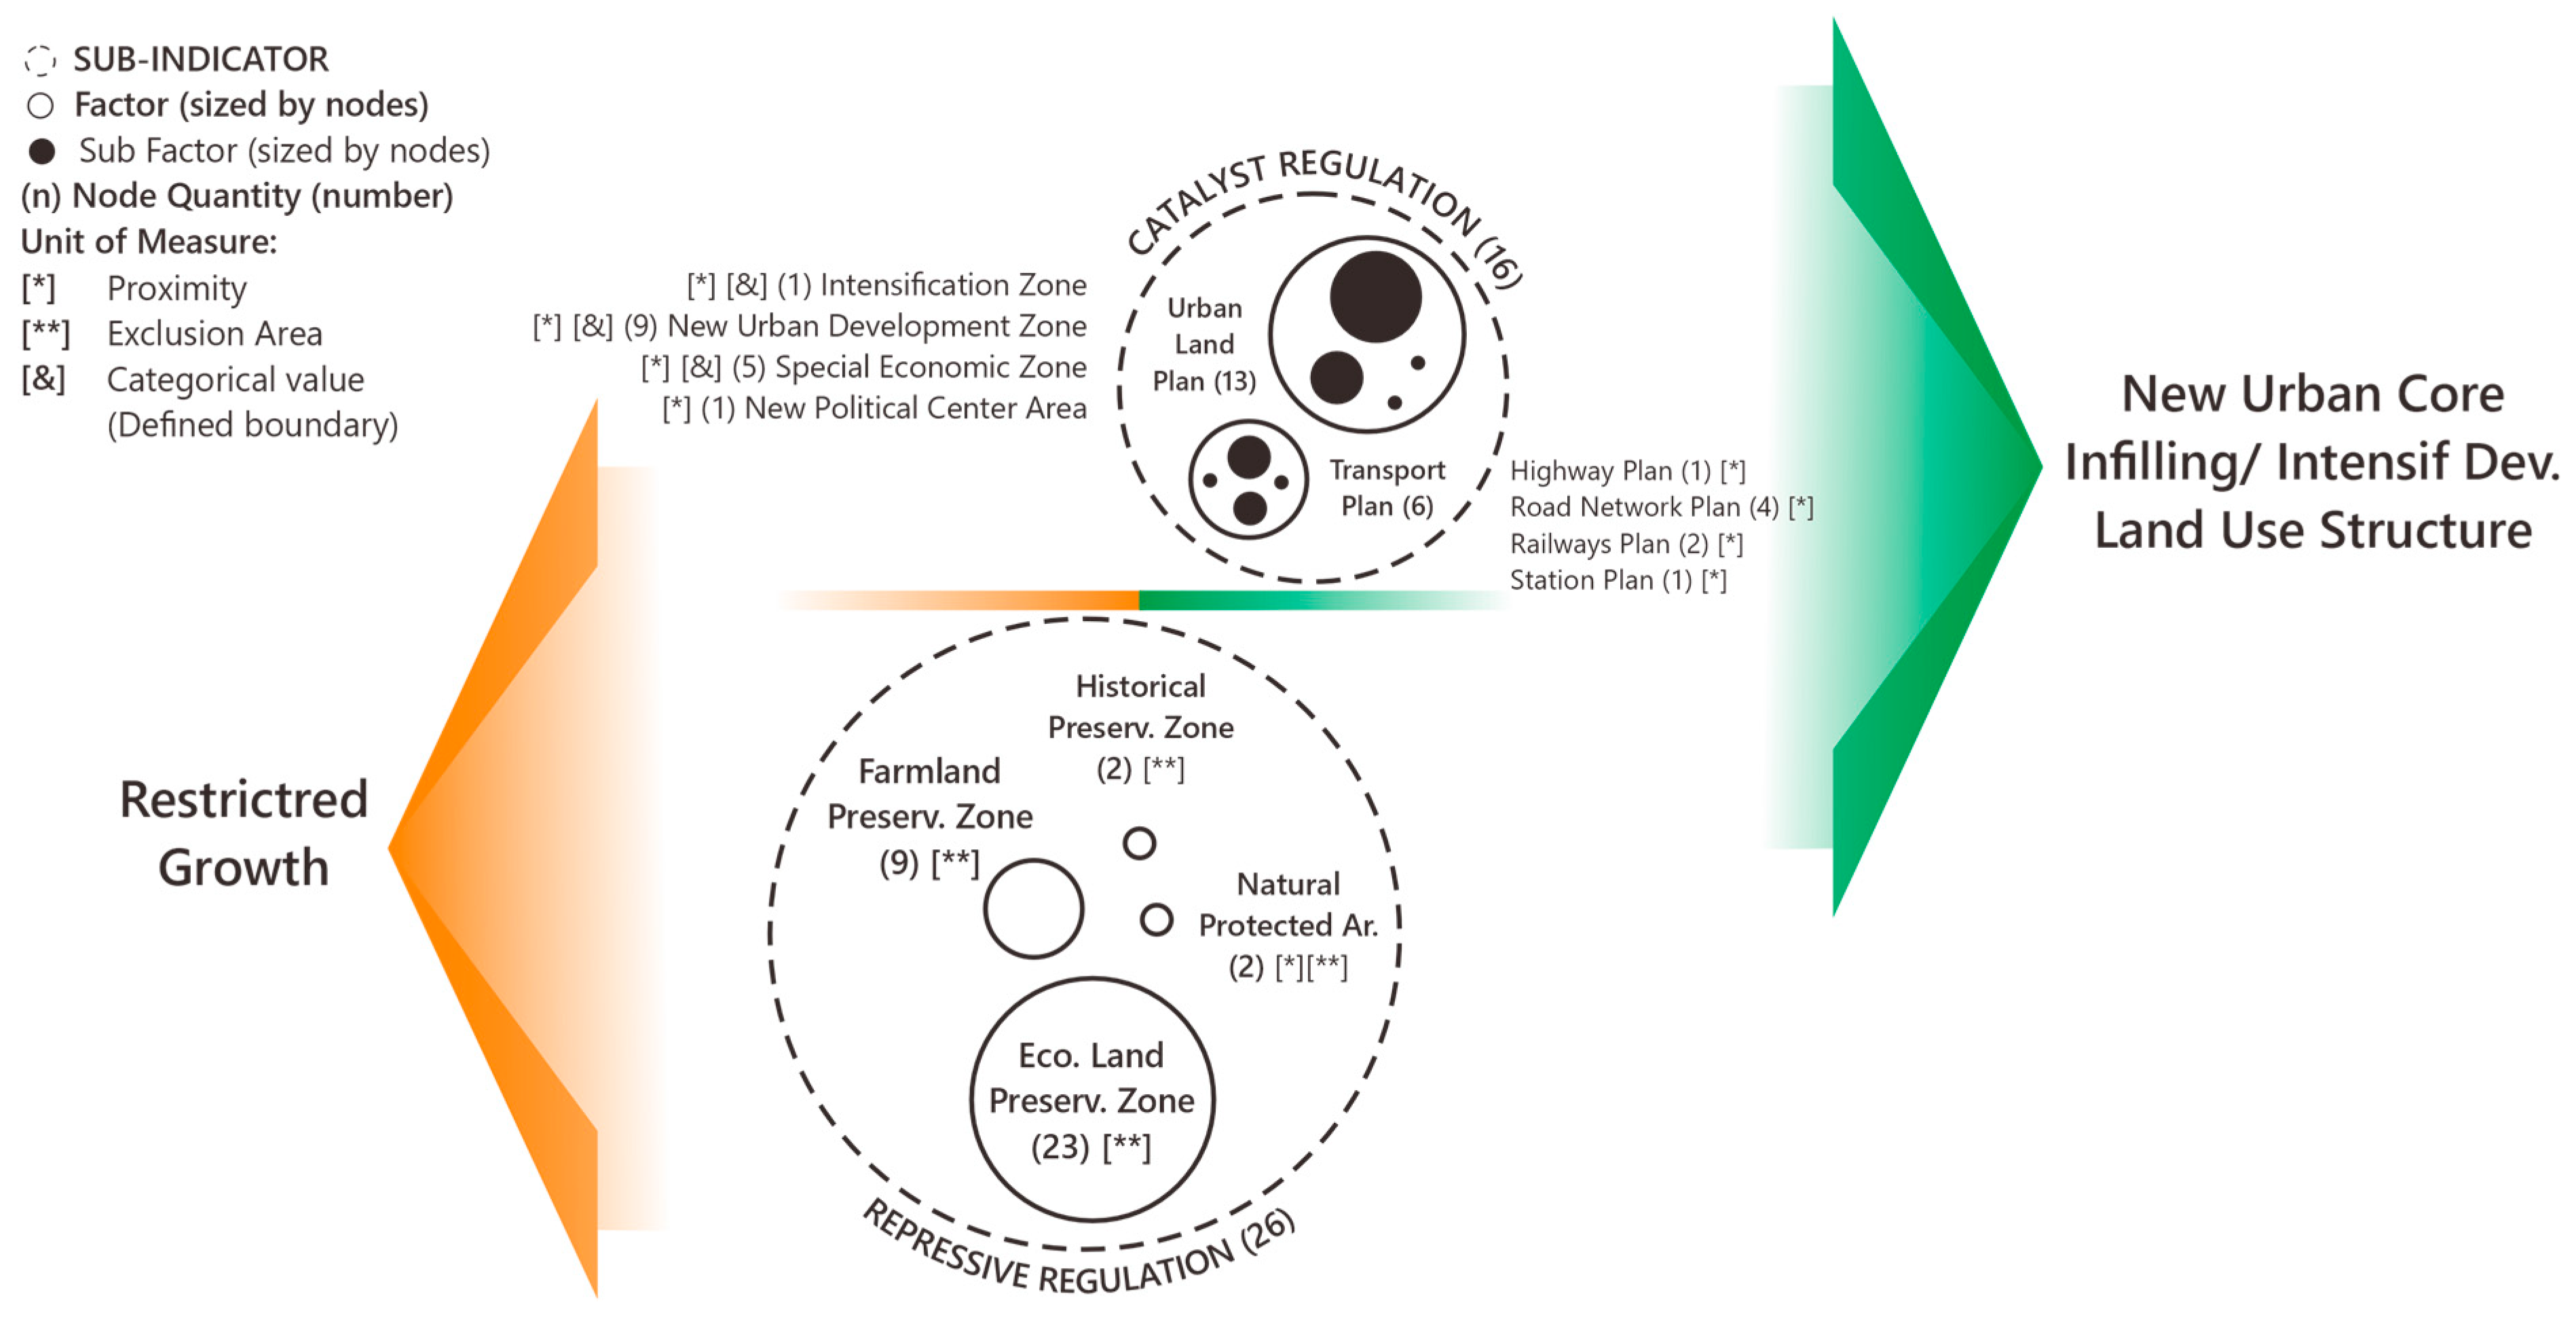
Figure 11 synthesizes findings of the aforementioned dual role of the policy and regulation category in LUC. Based on the node size, repressive regulation, which encompasses four indicators, was frequently employed as an exclusionary measure to limit urban expansion and preserve ecological, agricultural, and cultural assets, as indicated by the orange arrow. Conversely, urban development zones and infrastructure and transportation development plans act as catalytic measures, intensifying urban development, extending urbanized boundaries, and reinforcing urban functions (green arrow). This conceptualization underscores that the indicators, further described in Table S7, do not merely react to urban growth but actively shape the spatial management system. Understanding the interaction between these forces is crucial for predicting land use trajectories and developing sustainable land management strategies.

4.3. Future Urbanization Challenges as Preventive Indicators

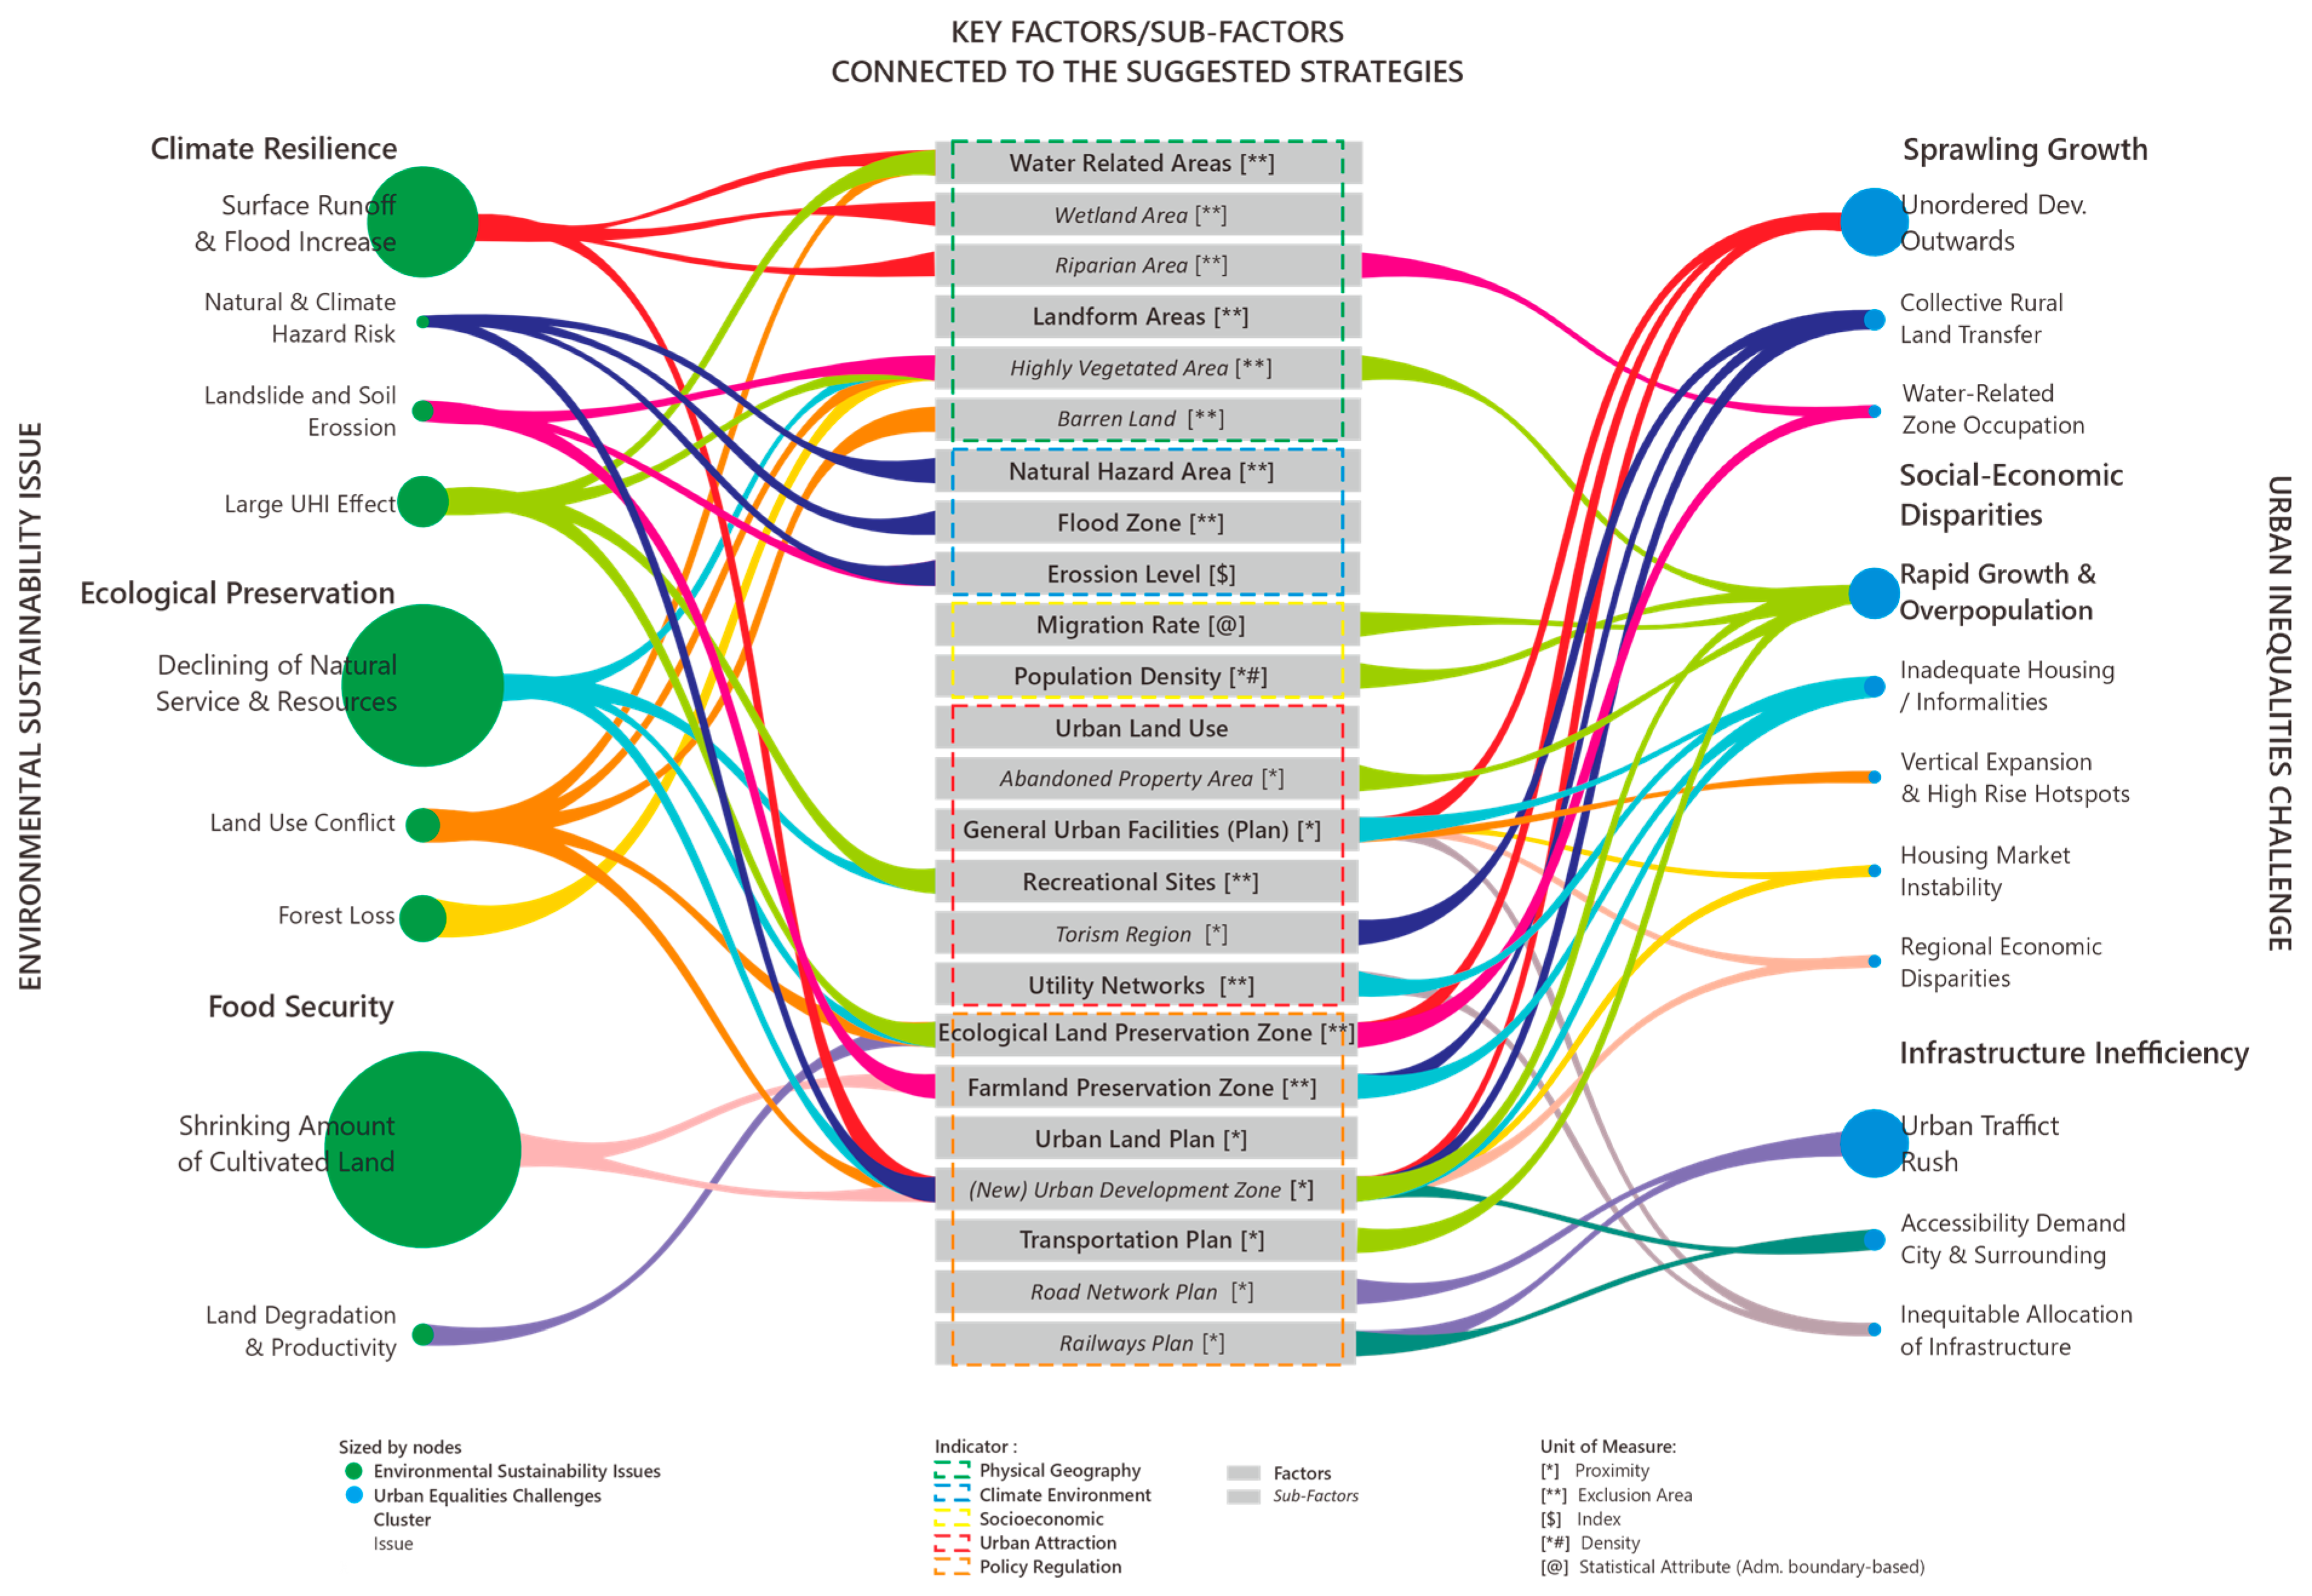
Urbanization presents significant challenges to environmental sustainability, as uncontrolled urban expansion in disaster-prone and resource-rich areas exacerbates the impacts of climate change. Future urban growth must prioritize climate resilience through adaptive planning and development strategies to mitigate risks in vulnerable areas and resource depletion [94]. Zoning restrictions in hazard-prone areas are a common factor in addressing these challenges, particularly regarding the intensity of natural hazard risks, such as floods and soil erosion [81]. A further challenge identified is the necessity to enhance urban resilience in response to increasing greenhouse gas emissions and diminishing ecosystem services, which necessitates the protection of natural areas and ecological land rehabilitation [12,95]. The exclusion of development in highly vegetated areas, parks, riparian zones, wetlands, natural green spaces, and water-related areas contributes to a healthier environment and better living conditions. Similarly, urbanization may result in competition for land among agriculture, forestry, and natural resources, presenting considerable risks to food security [96]. Inclusion areas classified as basic and capital farmland can help mitigate the conversion of extensive cultivated land into urban areas [92]. As shown in Figure 12, all the above-mentioned indicators serve as spatial constraints, protective regulations, and preventive filters in LUC simulations, guiding development away from vulnerable areas and maintaining urban resilience and environmental sustainability.
A distinct approach employed by some LUC researchers, however, advocates for a comprehensive integration of sustainability measures by considering both intercity interaction and environmental capacity. Table 2 and Table S8 present various integrated indicators in the LUC model, along with their corresponding urban issues from the literature. These integrated indicators are not merely conceptual but operate as quantifiable indices representing sustainability and inequality dimensions. For instance, Ref. [76] proposed an ERQ indicator that integrates soil erosion sensitivity, biodiversity service, and water-retention capacity into a normalized resistance score to indicate ecological exposure levels across the region and limit built-up expansion. Correspondingly, Refs. [19,93] included UDLS and LUCP to measure the adaptive cyclic development stage, ranging from conservation, reorganization, and exploitation areas. These indicators assess spatial suitability and environmental constraint by combining multiple weighted factors—such as elevation, slope, accessibility, and ecological fragility—into composite indices that guide where development should be prioritized or restricted. Strict limitations on human activities are applied in conservation areas, while reorganization zones preserve the high ecological value of natural forests. In contrast, exploitation areas facilitate urban expansion into lands with greater economic opportunity and diminished environmental value [19]. Similarly, Ref. [42] has integrated UCD into model prediction, incorporating urban land density, mixed-use development, and land use intensity indicators, to generate a final suitability map that guides urban development toward urban intensification.
On the other hand, urban inequality, driven by population growth, is another frequently anticipated problem by scholars. Within urban areas, the issue exacerbates social and economic disparities, such as housing market instability and declining residential standards, leading to overcrowding and an unhealthy environment. Population decentralization through satellite town developments remains a critical strategy to relieve overpopulation and protect ecological land [71,95]. However, this strategy unintentionally leads to scattered development outward, increases infrastructure demands, and escalates the conversion of natural ecosystems. The demands of newly decentralized areas place a significant strain on rural systems, exposing infrastructure inefficiencies and service gaps [85,99]. A further identified strategy involves optimizing urban land through redevelopment, reusing abandoned construction sites, and implementing disincentives for low productivity and inefficient land use [90,100]. Additionally, the distribution of public infrastructure services and transportation coverage would promote rational development and reduce regional disparities.
Unfortunately, implementing these abovementioned strategies in LUC models is more complex than merely articulating the theory. These strategies are typically presented as recommendations derived from LUC evaluations and predictions. Nonetheless, a more comprehensive approach is evident in the literature, which integrates generic predictive indicators within urban attraction and policy categories, alongside exclusion zones for farmland and ecological regions, as shown in Figure 12.
While most studies focused on cities as an independent entity, some researchers have incorporated specific indicators related to urban inequality issues into models, as depicted in Table 2 and detailed in Table S8. This approach transitions LUC impacts theories into implementation in land use dynamics. For example, Ref. [50] has integrated TDA into the LUC model to evaluate the sustainable capacity for tourism activities in urban areas, as tourism has a significant impact on urban growth. Other comparable indicators are simulated through SDH, which quantifies spatial inequality by measuring the variance of driving factors such as accessibility, infrastructure density, and demographic distribution, as unbalanced urbanization levels and uneven development speeds exist among different zones [98]. Correspondingly, UGI has been conducted by some scholars to measure the strength of inter-regional connections by integrating city influence, flows, and distances, which reflects the uneven distribution of urban attractiveness and opportunity. For instance, Ref. [76] demonstrated the use of this indicator in LUC prediction by integrating city influence indicators, human, traffic, and information flow factors among regions to generate spatial field intensity zones of urban inflow and outflow. In a slightly different technique, Ref. [85] computes local and zonal accessibility factors using travel survey data. Ultimately, these indicators reveal nuances of imbalances and differences in inter-regional land conversion probabilities that require attention in LUC simulation.
The literature review suggests that future challenges in LUC simulation are centered on two overarching issues: environmental sustainability and urban inequality, each requiring targeted preventive measures. Besides policy-based restriction factors, integrated environmental sustainability indicators can guide development toward low-impact zones by assessing specific regional functions based on ecological carrying capacity. Generic predictive indicators from infrastructure development plans are complemented by spatial development heterogeneity, urban gravitational interaction, and urban compactness to capture regional disparities in land development, service access, and growth dynamics. By combining these results, this study offers a practical preventive framework that mitigates future urbanization challenges and serves as both a regulatory tool and predictive mechanism for reducing future LUC risks. This directly addresses RQ2 on the indicators required to promote sustainable urban land management in the face of future urbanization.

5. Synthesis and Discussion

5.1. Conceptual Framework of Interconnected Indicators for Future Urbanization in NCD

5.1.1. Internal Predictive Structure in City Scale

Although many NCDs are built from scratch, they do not typically emerge in isolation. Instead, they are often integrated with existing urban areas through economic and spatial connections. Urbanization in NCDs can therefore be analyzed from two perspectives. First, NCDs frame numerous projects as prospective urban attractions, transforming green landscapes into residential, commercial, business, and urban infrastructures [8]. This finding corresponds with the discussion in Section 4.2.5, which highlighted that prospects for all proposed urban infrastructures will undoubtedly become a central focus for new urbanization destinations. With population growth, NCDs are expected to attract skilled workers, increasing demand for housing and facilities within and surrounding areas [2].
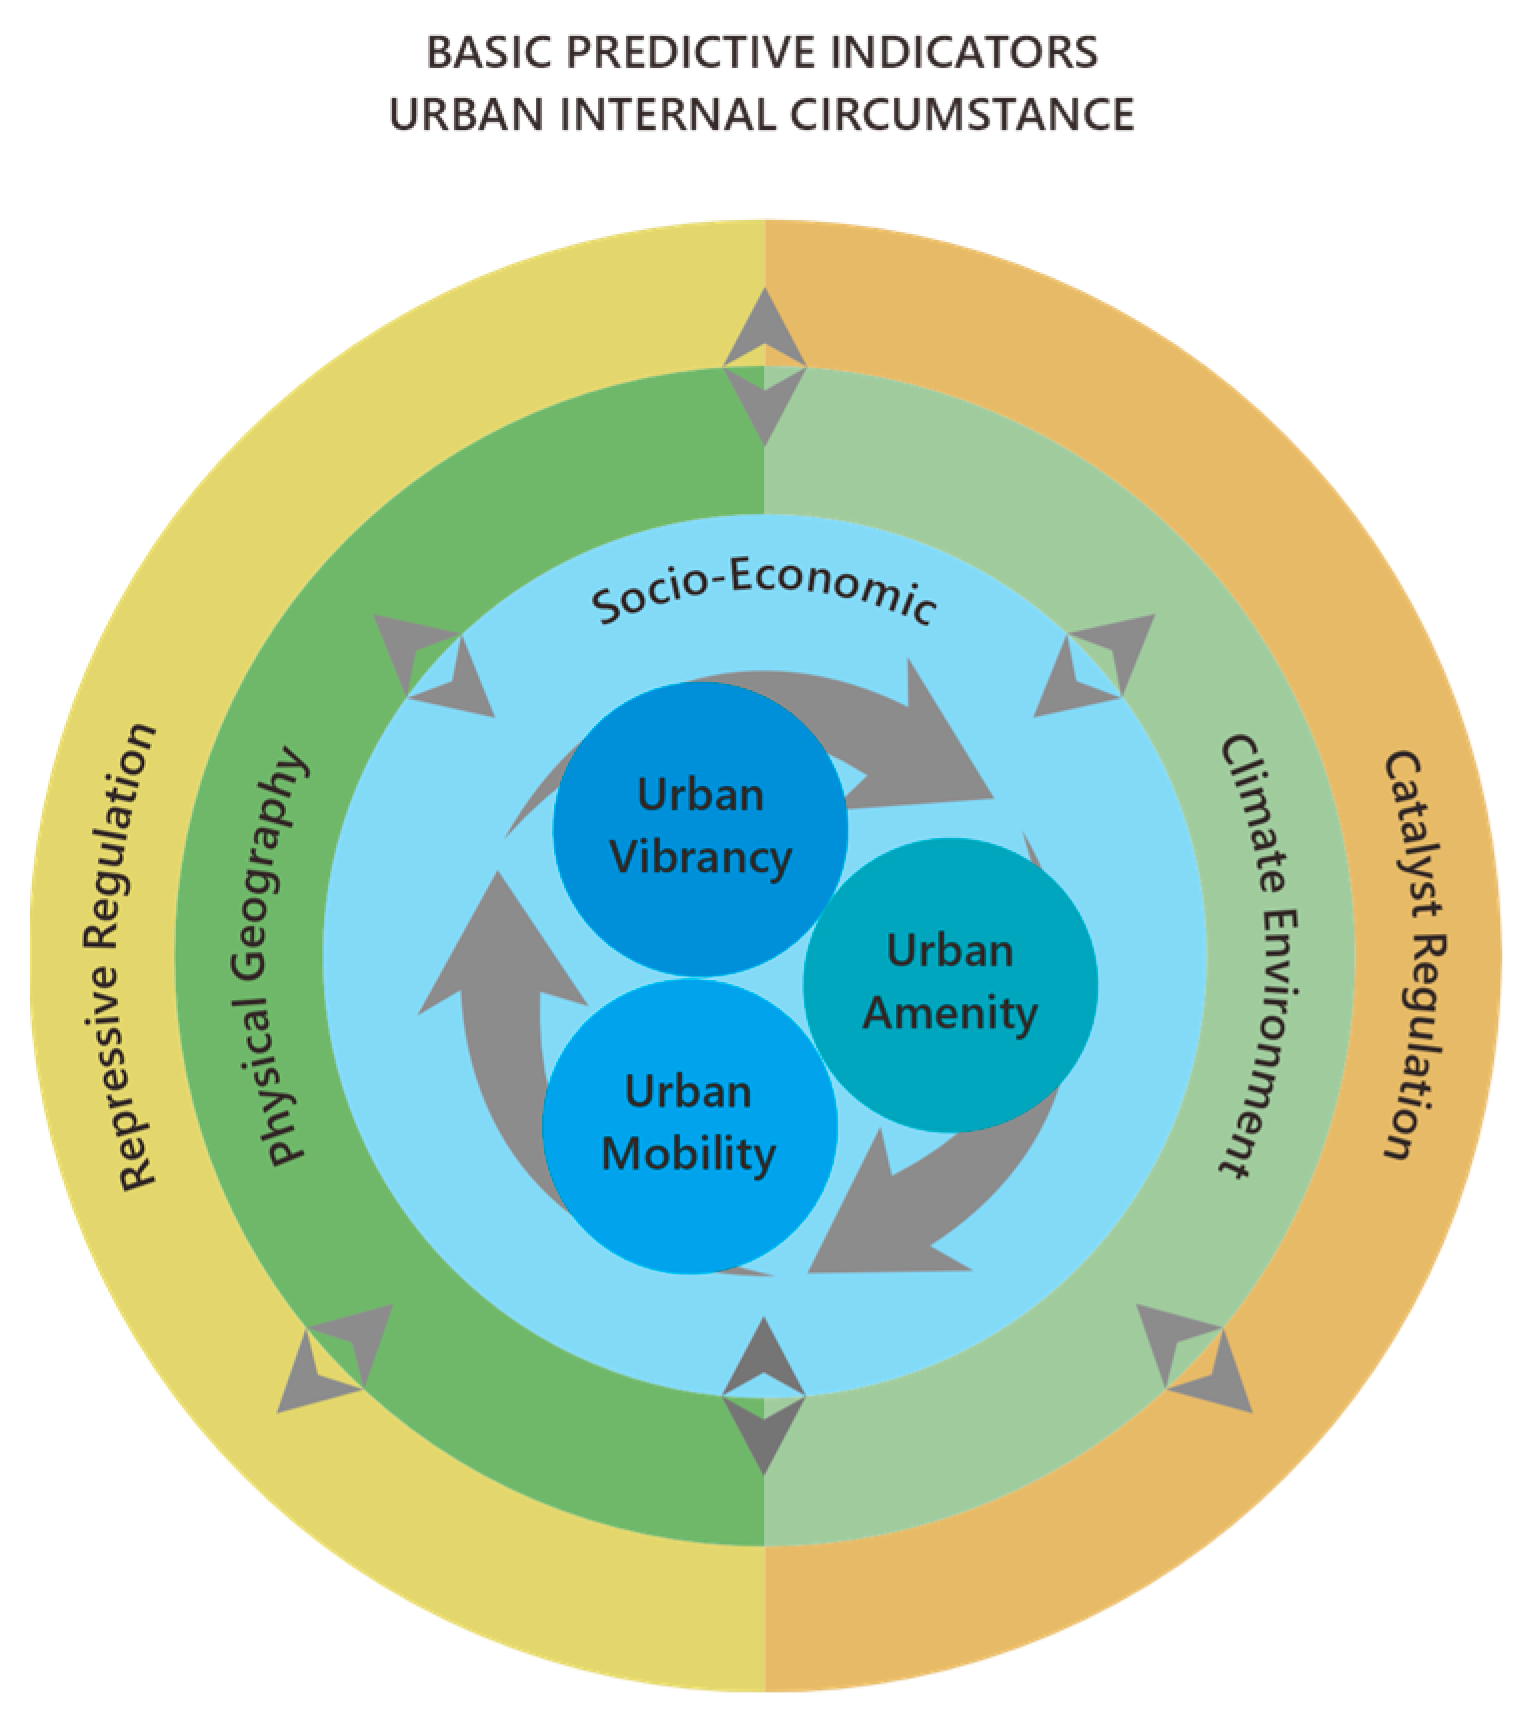
Despite new attractions from NCDs’ infrastructure enhancements, established cities also have inherent attractions. Both conditions delineate internal urbanization within each city, as depicted in Figure 13. The arrows in Figure 13 reflect conceptual directional interactions among indicator groups, emphasizing how each component influences and reinforces the others within the internal predictive structure. Urban mobility, vibrancy, and amenity reinforce urban attraction with adequate urban infrastructure and transportation, and tend to generate significant economic growth and a dense population. Therefore, indicators associated with urban attractions and socio-economic circumstances stemming from the internal structure of each established city are primary determinants of urbanization. However, urban growth should adapt to ecological characteristics and constraints. Thus, indicators in the physical geography category provide a foundation for understanding basic environmental conditions constraining urban growth, while climate–environment indicators can identify land suitability for specific land use (e.g., agriculture, industry, and urban settlement) to align with associated climate-related risks. Policies and regulations maintain the balance between urban development and environmental sustainability by incentivizing specific actions while restricting others. The indicators within the catalyst regulation group are likely to promote new growth and equitable urban development, while repressive regulation tends to constrain and direct growth to safeguard essential assets for urban sustainability.

5.1.2. Regional Preventive Structure in Agglomeration Framework

An economic development strategy that links the NCD projects with adjacent towns and cities is likely to be associated with greater urbanization, incorporating shared infrastructure, commuting patterns, and economic interdependence to attract a broader labor market and population [101]. The meticulous development planning in NCDs frequently lacks corresponding policies in surrounding areas, potentially resulting in the risk of uncontrolled urban expansion outwards [102]. Consequently, the future of urbanization in NCDs must be comprehensively understood in a broader context, considering regional interconnectedness and land transformations in surrounding cities. At the regional scale, NCDs and their surrounding areas will constitute an agglomeration region through roads, highways, and rail networks. Consequently, infrastructure development policies, including plans for facilities, utilities, and transportation networks and hubs, are another essential driver [71,90]. Urban expansion along road corridors tends to coincide with metropolitan formation, as development priorities emphasize connectivity within and around the NCDs [101].
The agglomeration region will also encounter comparable urban challenges outlined in Section 4.3. Urban functions will be allocated and specialized within an interconnected regional framework. To support regional sustainability, indicators of ERQ, LUCP, and UDLS can be applied to measure the interaction between urban land dynamics and ecological constraints within a complex and evolving natural–socioeconomic system [76]. Section 4.3 demonstrated that conventional strategies merely limit urban growth using predictive indicators to address environmental concerns. However, sustainable urban growth should not be simplified as a binary choice between ecological protection and economic development. One-sided emphasis often necessitates compromising potential benefits from other urban systems, resulting in spatial imbalances and land use conflicts [19]. Thus, preventive indicators become essential for accurately revealing the interaction between human activities and the ecological system, offering an enhanced framework for early risk identification and adaptive management of urban growth under ecological constraints.
On the other hand, the agglomeration region faces another urban issue due to differential regional capacity, including infrastructure and economic opportunities. This condition presents a challenge to urban inequality among subregions in future urbanization. To comprehensively understand and mitigate uneven development, understanding regional heterogeneity is essential for promoting innovative indicators in LUC assessment, which addresses this issue and enhances decision-making processes for sustainable development [90,98]. While the traditional approach discussed in Section 4.3 emphasizes the use of policy and regulation indicators, including transportation and infrastructure plans, to address urban inequality in assessing future LUC, the preventive approach focuses on the differences in urban interactions and regional capabilities. For example, understanding the degree of urbanization across various subregions using UGI and SDH enables the adaptation of future scenarios concerning urban land management to align with regional characteristics, facilitating intensification, regulating growth, and promoting harmonious development.
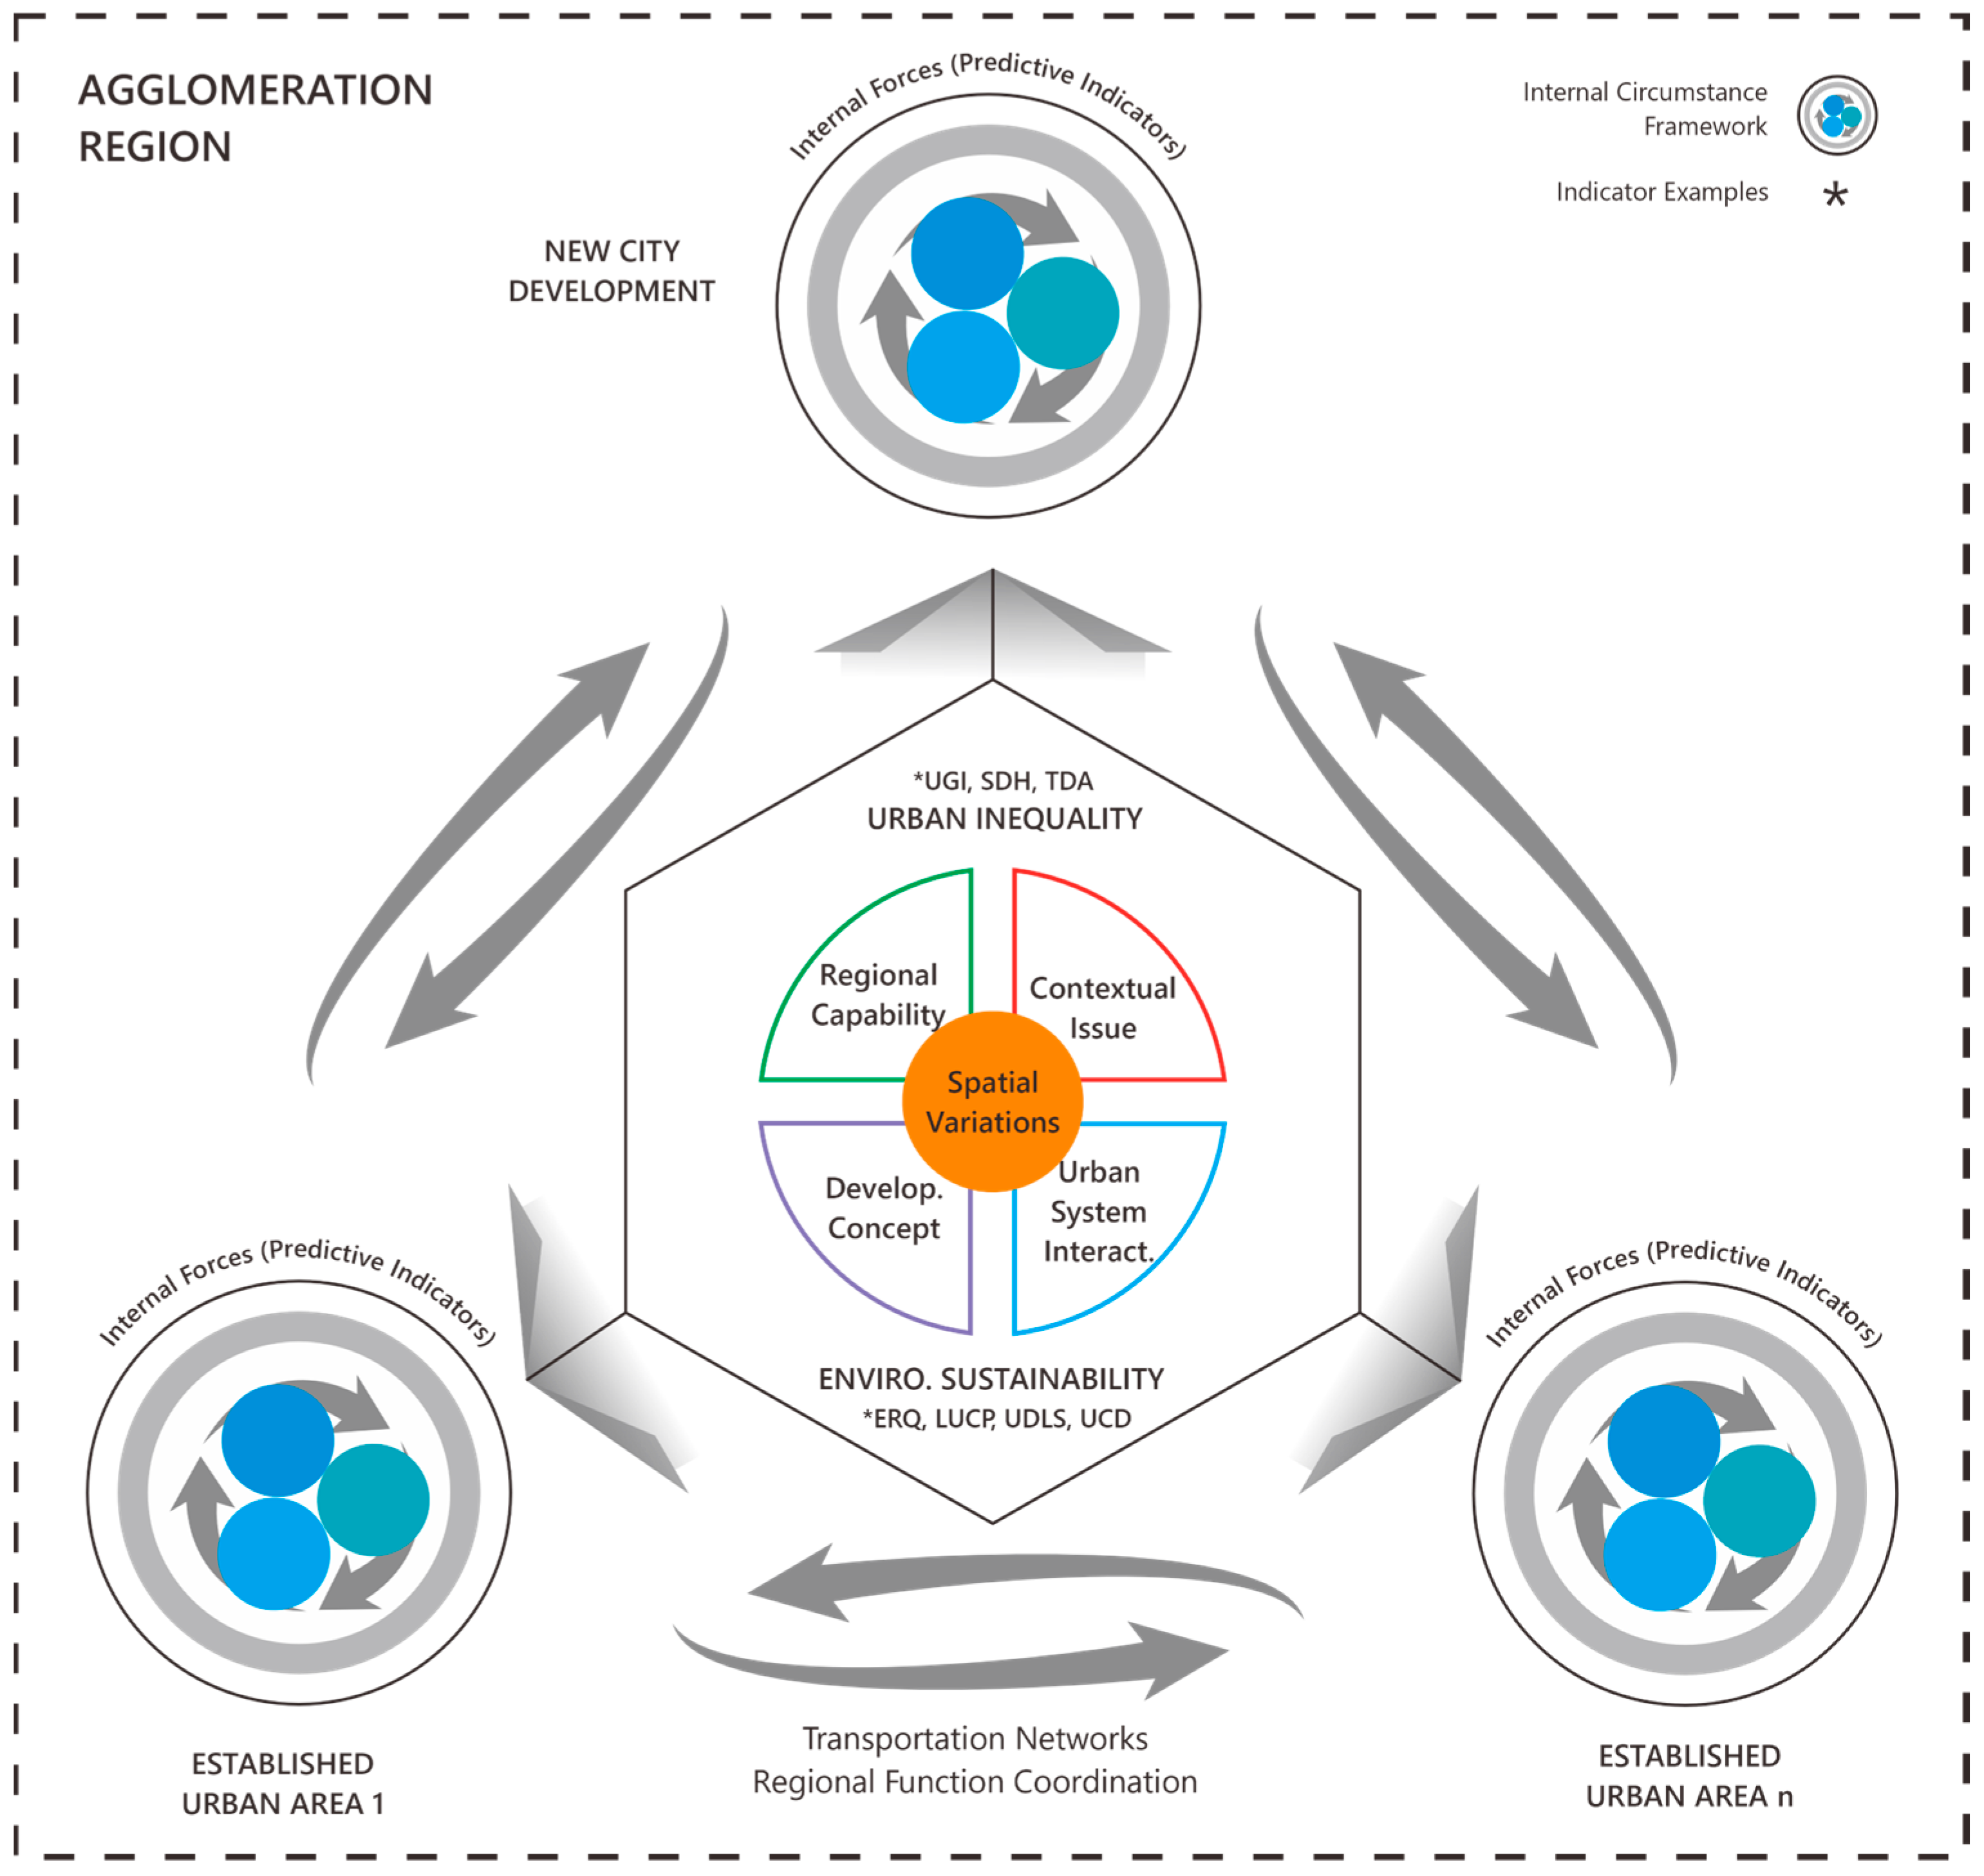
Alongside emphasizing various preventive indicators previously noted, the discourse on preventive indicators emphasizes their fundamental components as an adaptable approach in addressing future challenges. They consider contextual issues, urban system interactions, and regional capabilities, which ultimately lead to spatial variations, as depicted in the center of the proposed framework in Figure 14. For instance, the challenge of increasing tourism activities in Beijing prompts [50] to integrate the tourism capacity factor into land change assessment, highlighting the interaction between tourism activities and land dynamics that give rise to spatial variations. These characteristics make the preventive indicators found in the cited article compatible with the promoted development paradigm. A practical example can be observed in a study by [42], which incorporates the urban compactness factor to predict LUC, given the agglomeration tendency of similar land uses and land intensification towards a compact city concept. In addition, the implementation of ERQ, LUCP, and UDLS by [19] is associated with the integration of the SDGs concept. Although this study identified limited preventive indicators for anticipating future urbanization challenges in NCDs, we underscore the potential for developing additional preventive indicators based on their fundamental components and urban development concepts. Moreover, new cities frequently incorporate modern development concepts, including smart cities that leverage technology in urban management and sponge cities, which aim to enhance climate resilience [103].
Finally, two primary categories of urban issues that must be addressed in the context of future urbanization in NCDs agglomeration regions are environmental sustainability and urban inequalities. These factors necessitate the incorporation of innovative preventive indicators in LUC modeling, as shown in Figure 14. Predictive indicators capture the inherent characteristics of each region, influencing the internal urbanization process by either encouraging or constraining growth. Preventive indicators identify spatial interactions and interdependencies in land dynamics, supporting proactive and adaptive urban land use management in NCDs. As the proposed framework is derived from a comprehensive synthesis of global literature, it provides a generalized analytical basis that can be adapted and tested in various spatial settings to accommodate specific regional characteristics in future applications. The indicator composition from the framework remains flexible and compatible to different environmental and governance conditions. This adaptability ensures that the framework can guide comparative analyses and evidence-based planning across diverse NCD initiatives worldwide.

5.2. Limitations and Future Research

Although this study has established a framework to assess future urbanization in NCDs, several limitations remain. First, the PICOC and SLR approaches employed in article selection using specific keywords result in the exclusion of several potentially relevant publications. Second, the literature review from the past decade is restricted to the Scopus database. Additional databases, including PubMed, Web of Science, and grey literature, could broaden coverage and enhance the analysis of LUC indicators in NCDs. Third, because the reviewed literature lacks detailed contextualization of LUC indicators in specific local dynamics, preliminary investigations into their reliability in individual cases are recommended to highlight their local uniqueness and avoid overgeneralization in practical planning [43,90].
Moving beyond theoretical synthesis, the next stage of research should empirically validate the proposed framework in actual NCD environments. Such validation will provide a concrete illustration of how predictive and preventive indicators interact under expansive urbanization and policy-driven land transformation. One potential case is Nusantara, the new capital city in Indonesia, which epitomizes the dynamics of rapid development in an ecologically sensitive region. This case offers a unique opportunity to evaluate how predictive indicators of internal urban growth interact with preventive indicators of environmental resilience and regional equity, thereby operationalizing the conceptual synthesis of this study into an applied land-management tool. By integrating systematic reviews with evidence-based testing, future LUC research can enhance the predictive–preventive framework as a reliable foundation for sustainable urban development in NCDs.

6. Conclusions

This paper presents a system-level perspective of LUC modeling to measure and monitor the urbanization in NCD. The findings suggest that internal urban conditions and planned infrastructure within the NCD are likely to accelerate urban expansion, driven by 56 predictive indicators across five categories: physical geography, climate environment, socio-economic factors, urban attractiveness, and policy and regulation. These indicators collectively explain how natural constraints, ecological capacity, and climate adaptability interact with socio-economic demand, urban livability, and governance to shape spatial growth trajectories. Meanwhile, two cross-cutting preventive issues—environmental sustainability and urban inequalities—further influence land use preferences through their effects on resource availability, ecological vulnerability, spatial equity, and regional interdependencies. Although fewer in number, these preventive indicators contain key conceptual components (contextual issues, urban system interactions, and regional capabilities) that can be further tailored to specific development strategies to generate new spatial variations and preventive measures. Integrating predictive–preventive dimensions can support policymakers in proactively managing land use under expansion pressure by providing multidimensional insights into urban dynamics, sustainability risks, and inter-regional linkages. The framework also offers methodological transferability as a general analytical model for NCD and is adaptable to various environmental and governance contexts.
Building on these insights, this study provides a comprehensive inventory of LUC indicators as a foundation for the accurate assessment and prediction of urbanization and its impacts. Neglecting any single factor may lead to inaccurate estimations, particularly in NCDs, where measurement remains uncertain. Future research should empirically validate these factors to ensure they are not merely theoretical constructs but also grounded in real-world evidence. Applying the framework in Nusantara, Indonesia’s new capital city, will provide an ideal case for examining how predictive and preventive indicators interact within a rapidly developing yet environmentally sensitive region. This extension will demonstrate the framework’s applicability in supporting responsible land use management and sustainable urbanization in NCD contexts.

Supplementary Materials

The following supporting information can be downloaded at https://www.mdpi.com/article/10.3390/urbansci9110484/s1. Supplementary File S1 contains Table S1: Final query string for articles included in the qualitative and quantitative synthesis; Table S2: Included Articles Datasheet; Table S3: Identified Indicators and Sub-Factors in Physical Geography Category; Table S4: Identified Indicators and Sub-Factors in Climate Environment Category; Table S5: Identified Indicators and Sub-Factors in Socio-Economic Category; Table S6: Identified Indicators and Sub-Factors in Urban Attraction Category; Table S7: Identified Indicators and Sub-Factors in Policy and Regulation Category; Table S8: Identified Indicators and Sub-Factors in Preventive Approach Related to Urban Issues. Supplementary File S2 provides the completed PRISMA 2020 Checklist for this study.

Author Contributions

Conceptualization, A.G. and W.T.d.V.; methodology, A.G.; software, A.G.; validation, A.G. and W.T.d.V.; formal analysis, A.G.; investigation, W.T.d.V.; resources, A.G.; data curation, A.G.; writing—original draft preparation, A.G.; writing—review and editing, W.T.d.V.; visualization, A.G.; supervision, W.T.d.V.; project administration, A.G.; funding acquisition, A.G. All authors have read and agreed to the published version of the manuscript.

Funding

This research was funded by the Indonesia Endowment Funds for Education (LPDP), grant number 0008686/ESC/D/ASN-2022, as part of the doctoral program.

Institutional Review Board Statement

Not applicable.

Informed Consent Statement

Not applicable.

Data Availability Statement

The data used in the paper are available within the article or Supplementary Material.

Acknowledgments

The authors express gratitude to the anonymous reviewers for their thoughtful and insightful comments, which significantly improved the manuscript.

Conflicts of Interest

The authors declare no conflicts of interest.

Abbreviations

The following abbreviations are used in this manuscript:
LUCLand use change
NCDNew development city
SLMSustainable land management
SLRSystematic literature review
PICOCPopulation, intervention, comparison, outcome, and context criteria
PRISMAPreferred reporting items for systematic reviews and meta-analyses
GDPGross domestic product
SEZSpecial economic zone
NTLNighttime lights
ERQEcological resistance quality
LUCPLand use conflict potential
UDLSUrban development land use suitability
UCDUrban compactness
TDATourism development assessment
SDHSpatial development heterogeneity
UGIUrban gravitational interaction

References

  1. Thompson, T.Y.; Lockhart, K.; Siame, G. Introducing the New Cities Map; London, UK; August 2023. Available online: https://www.theigc.org/publications/introducing-new-cities-map (accessed on 18 July 2025).
  2. Moser, S.; Côté-Roy, L. New cities: Power, profit, and prestige. Geogr. Compass 2020, 15, e12549. [Google Scholar] [CrossRef]
  3. Su, X. Building new cities in the Global South: Neoliberal planning and its adverse consequences. Urban Gov. 2022, 3, 67–75. [Google Scholar] [CrossRef]
  4. Moser, S. New Cities: Engineering Social Exclusions. One Earth 2020, 2, 125–127. [Google Scholar] [CrossRef]
  5. Watson, V. African urban fantasies: Dreams or nightmares? Environ. Urban. 2013, 26, 215–231. [Google Scholar] [CrossRef]
  6. Moser, S.; Avni, N. Analysing a private city being built from scratch through a social and environmental justice framework: A research agenda. Urban Stud. 2023, 61, 1545–1562. [Google Scholar] [CrossRef]
  7. Bolleter, J.; Cameron, R. A critical landscape and urban design analysis of Egypt’s new Administrative Capital City. J. Landsc. Arch. 2021, 16, 8–19. [Google Scholar] [CrossRef]
  8. Syaban, A.S.N.; Appiah-Opoku, S. Building Indonesia’s new capital city: An in-depth analysis of prospects and challenges from current capital city of Jakarta to Kalimantan. Urban Plan. Transp. Res. 2023, 11, 2276415. [Google Scholar] [CrossRef]
  9. de Vries, W.T.; Astudillo, C.; Ghozali, A. Spatial Assessment of Wastewater Requirements for the New Capital City of Indonesia. Rev. Int. Géomatique 2025, 34, 125–149. [Google Scholar] [CrossRef]
  10. Zhao, S.; Zhang, C.; Qi, J. The Key Factors Driving the Development of New Towns by Mother Cities and Regions: Evidence from China. ISPRS Int. J. Geo-Inf. 2021, 10, 223. [Google Scholar] [CrossRef]
  11. Lu, Q.; Chang, N.-B.; Joyce, J. Predicting long-term urban growth in Beijing (China) with new factors and constraints of environmental change under integrated stochastic and fuzzy uncertainties. Stoch. Environ. Res. Risk Assess. 2017, 32, 2025–2044. [Google Scholar] [CrossRef]
  12. Tian, L.; Tao, Y.; Li, M.; Qian, C.; Li, T.; Wu, Y.; Ren, F. Prediction of Land Surface Temperature Considering Future Land Use Change Effects under Climate Change Scenarios in Nanjing City, China. Remote Sens. 2023, 15, 2914. [Google Scholar] [CrossRef]
  13. de Vries, W.T.; Schrey, M. Geospatial Approaches to Model Renewable Energy Requirements of the New Capital City of Indonesia. Front. Sustain. Cities 2022, 4, 848309. [Google Scholar] [CrossRef]
  14. Kurniawan, I.; Suhardjono Bisri, M.; Suhartanto, E.; Septiangga, B.; Munajad, R. Projecting land use changes and its consequences for hydrological response in the New Capital City of Indonesia. IOP Conf. Ser. Earth Environ. Sci. 2021, 930, 012044. [Google Scholar] [CrossRef]
  15. Alghais, N.; Pullar, D. Projection for new city future scenarios—A case study for Kuwait. Heliyon 2018, 4, e00590. [Google Scholar] [CrossRef]
  16. Weerasinghe, O.; Hewage, K.; Razi, F.; Fatmi, M.; Sadiq, R. Applicability of Land-Use Models for Sustainable Urban Planning: A Review. J. Urban Plan. Dev. 2025, 151. [Google Scholar] [CrossRef]
  17. Qian, Y.; Xing, W.; Guan, X.; Yang, T.; Wu, H. Coupling cellular automata with area partitioning and spatiotemporal convolution for dynamic land use change simulation. Sci. Total. Environ. 2020, 722, 137738. [Google Scholar] [CrossRef] [PubMed]
  18. Wang, Q.; Wang, H.; Chang, R.; Zeng, H.; Bai, X. Dynamic simulation patterns and spatiotemporal analysis of land-use/land-cover changes in the Wuhan metropolitan area, China. Ecol. Model. 2022, 464, 109850. [Google Scholar] [CrossRef]
  19. Wang, Z.; Lin, L.; Zhang, B.; Xu, H.; Xue, J.; Fu, Y.; Zeng, Y.; Li, F. Sustainable urban development based on an adaptive cycle model: A coupled social and ecological land use development model. Ecol. Indic. 2023, 154, 110666. [Google Scholar] [CrossRef]
  20. Angel, S. Urban expansion: Theory, evidence and practice. Build. Cities 2023, 4, 124–138. [Google Scholar] [CrossRef]
  21. Yang, J.; Li, J.; Xu, F.; Li, S.; Zheng, M.; Gong, J. Urban development wave: Understanding physical spatial processes of urban expansion from density gradient of new urban land. Comput. Environ. Urban Syst. 2022, 97, 101867. [Google Scholar] [CrossRef]
  22. Ding, Y.; Jia, L.; Wang, C.; Wang, P. Urban sprawl and its effects on water competition between building industry and residents: Evidence from 31 provinces in China. Water-Energy Nexus 2024, 7, 26–38. [Google Scholar] [CrossRef]
  23. Seto, K.C.; Güneralp, B.; Hutyra, L.R. Global forecasts of urban expansion to 2030 and direct impacts on biodiversity and carbon pools. Proc. Natl. Acad. Sci. USA 2012, 109, 16083–16088. [Google Scholar] [CrossRef]
  24. Basirat, M.; Arbab, P. Analysing New Town Development in Iran. Int. Rev. Spat. Plan. Sustain. Dev. 2022, 10, 84–107. [Google Scholar] [CrossRef] [PubMed]
  25. Korah, P.I.; Cobbinah, P.B. New Cities in Africa and the Reimagination of Urban Planning. In Reimagining Urban Planning in Africa; Cambridge University Press: Cambridge, UK, 2023; pp. 36–51. [Google Scholar]
  26. Shaw, B.J.; van Vliet, J.; Verburg, P.H. The peri-urbanization of Europe: A systematic review of a multifaceted process. Landsc. Urban Plan. 2020, 196, 103733. [Google Scholar] [CrossRef]
  27. Altrock, U. New (sub)urbanism?—How German cities try to create “urban” neighborhoods in their outskirts as a contribution to solving their recent housing crises. Urban Gov. 2022, 2, 130–143. [Google Scholar] [CrossRef]
  28. van Noorloos, F.; Kloosterboer, M. Africa’s new cities: The contested future of urbanisation. Urban Stud. 2017, 55, 1223–1241. [Google Scholar] [CrossRef]
  29. Cho, S.E.; Kim, S. Measuring urban diversity of Songjiang New Town: A re-configuration of a Chinese suburb. Habitat Int. 2017, 66, 32–41. [Google Scholar] [CrossRef]
  30. Brenner, N. New Urban Spaces; Oxford University Press (OUP): Oxford, UK, 2019. [Google Scholar]
  31. Akhtar-Schuster, M.; Stringer, L.C.; Erlewein, A.; Metternicht, G.; Minelli, S.; Safriel, U.; Sommer, S. Unpacking the concept of land degradation neutrality and addressing its operation through the Rio Conventions. J. Environ. Manag. 2017, 195, 4–15. [Google Scholar] [CrossRef]
  32. Bielecka, E.; Markowska, A.; Wiatkowska, B.; Calka, B. Sustainable Urban Land Management Based on Earth Observation Data—State of the Art and Trends. Remote. Sens. 2025, 17, 1537. [Google Scholar] [CrossRef]
  33. Haregeweyn, N.; Tsunekawa, A.; Tsubo, M.; Fenta, A.A.; Ebabu, K.; Vanmaercke, M.; Borrelli, P.; Panagos, P.; Berihun, M.L.; Langendoen, E.J.; et al. Progress and challenges in sustainable land management initiatives: A global review. Sci. Total. Environ. 2022, 858, 160027. [Google Scholar] [CrossRef]
  34. Verburg, P.H.; Crossman, N.; Ellis, E.C.; Heinimann, A.; Hostert, P.; Mertz, O.; Nagendra, H.; Sikor, T.; Erb, K.-H.; Golubiewski, N.; et al. Land system science and sustainable development of the earth system: A global land project perspective. Anthropocene 2015, 12, 29–41. [Google Scholar] [CrossRef]
  35. Wu, J. Urban ecology and sustainability: The state-of-the-science and future directions. Landsc. Urban Plan. 2014, 125, 209–221. [Google Scholar] [CrossRef]
  36. Tan, X. New-Town Policy and Development in China. Chin. Econ. 2010, 43, 47–58. [Google Scholar] [CrossRef]
  37. Alipour, D.; Dia, H. A Systematic Review of the Role of Land Use, Transport, and Energy-Environment Integration in Shaping Sustainable Cities. Sustainability 2023, 15, 6447. [Google Scholar] [CrossRef]
  38. Page, M.J.; McKenzie, J.E.; Bossuyt, P.M.; Boutron, I.; Hoffmann, T.C.; Mulrow, C.D.; Shamseer, L.; Tetzlaff, J.M.; Akl, E.A.; Brennan, S.E.; et al. The PRISMA 2020 statement: An updated guideline for reporting systematic reviews. PLoS Med. 2021, 18, e1003583. [Google Scholar] [CrossRef] [PubMed]
  39. Carrera-Rivera, A.; Ochoa, W.; Larrinaga, F.; Lasa, G. How-to conduct a systematic literature review: A quick guide for computer science research. MethodsX 2022, 9, 101895. [Google Scholar] [CrossRef] [PubMed]
  40. Li, X.; Hu, S.; Jiang, L.; Han, B.; Li, J.; Wei, X. Bibliometric Analysis of the Research (2000–2020) on Land-Use Carbon Emissions Based on CiteSpace. Land 2023, 12, 165. [Google Scholar] [CrossRef]
  41. van Eck, N.J.; Waltman, L. Manual for VOSviewer Version 1.6.20 [Internet]. October 2023. Available online: https://www.vosviewer.com/documentation/Manual_VOSviewer_1.6.20.pdf (accessed on 13 January 2025).
  42. Abdullahi, S.; Pradhan, B. Land use change modeling and the effect of compact city paradigms: Integration of GIS-based cellular automata and weights-of-evidence techniques. Environ. Earth Sci. 2018, 77, 1–15. [Google Scholar] [CrossRef]
  43. Hernández-Flores, M.d.l.L.; Otazo-Sánchez, E.M.; Galeana-Pizaña, M.; Roldán-Cruz, E.I.; Razo-Zárate, R.; González-Ramírez, C.A.; Galindo-Castillo, E.; Gordillo-Martínez, A.J. Urban driving forces and megacity expansion threats. Study case in the Mexico City periphery. Habitat Int. 2017, 64, 109–122. [Google Scholar] [CrossRef]
  44. Sun, L.; Yu, H.; Sun, M.; Wang, Y. Coupled impacts of climate and land use changes on regional ecosystem services. J. Environ. Manag. 2022, 326, 116753. [Google Scholar] [CrossRef]
  45. Shi, Y.; Liang, L.; Wu, C.; Li, Z. Study on the Trade-Offs of Land Functions in the Central Plain of China for Sustainable Devel-opment. Land 2023, 12, 2125. [Google Scholar] [CrossRef]
  46. Kumar, V.; Agrawal, S. A multi-layer perceptron–Markov chain based LULC change analysis and prediction using remote sensing data in Prayagraj district, India. Environ. Monit. Assess. 2023, 195, 1–27. [Google Scholar] [CrossRef]
  47. Liang, X.; Liu, X.; Li, X.; Chen, Y.; Tian, H.; Yao, Y. Delineating multi-scenario urban growth boundaries with a CA-based FLUS model and morphological method. Landsc. Urban Plan. 2018, 177, 47–63. [Google Scholar] [CrossRef]
  48. Luo, X.; Le, F.; Zhang, Y.; Zhang, H.; Zhai, J.; Luo, Y. Multi-scenario analysis and optimization strategy of ecological security pattern in the Weihe river basin. J. Environ. Manag. 2024, 366, 121813. [Google Scholar] [CrossRef] [PubMed]
  49. Mou, J.; Chen, Z.; Huang, J. Predicting Urban Expansion to Assess the Change of Landscape Character Types and Its Driving Factors in the Mountain City. Land 2023, 12, 928. [Google Scholar] [CrossRef]
  50. Liu, Y.; Shi, J.; Zheng, Y.; Huang, X. The Evolution Pattern and Simulation of Land Use in the Beijing Municipal Administrative Center (Tongzhou District). J. Resour. Ecol. 2022, 13, 270–284. [Google Scholar] [CrossRef]
  51. Lu, L.; Qureshi, S.; Li, Q.; Chen, F.; Shu, L. Monitoring and projecting sustainable transitions in urban land use using remote sensing and scenario-based modelling in a coastal megacity. Ocean Coast. Manag. 2022, 224, 106201. [Google Scholar] [CrossRef]
  52. Salazar, E.; Henríquez, C.; Sliuzas, R.; Qüense, J. Evaluating spatial scenarios for sustainable development in Quito, Ecuador. ISPRS Int. J. Geo-Inf. 2020, 9, 141. [Google Scholar] [CrossRef]
  53. Sakieh, Y.; Amiri, B.J.; Danekar, A.; Feghhi, J.; Dezhkam, S. Scenario-based evaluation of urban development sustainability: An integrative modeling approach to compromise between urbanization suitability index and landscape pattern. Environ. Dev. Sustain. 2014, 17, 1343–1365. [Google Scholar] [CrossRef]
  54. Sun, Q.; Fang, J.; Dang, X.; Xu, K.; Fang, Y.; Li, X.; Liu, M. Multi-scenario urban flood risk assessment by integrating future land use change models and hydrodynamic models. Nat. Hazards Earth Syst. Scis. 2022, 22, 3815–3829. [Google Scholar] [CrossRef]
  55. Jawarneh, R.N.; Julian, J.P.; Lookingbill, T.R. The influence of physiography on historical and future land development changes: A case study of central Arkansas (USA), 1857–2030. Landsc. Urban Plan. 2015, 143, 76–89. [Google Scholar] [CrossRef]
  56. Liu, X.; Wei, M.; Li, Z.; Zeng, J. Multi-scenario simulation of urban growth boundaries with an ESP-FLUS model: A case study of the Min Delta region, China. Ecol. Indic. 2022, 135, 108538. [Google Scholar] [CrossRef]
  57. Mansour, S.; Al-Belushi, M.; Al-Awadhi, T. Monitoring land use and land cover changes in the mountainous cities of Oman using GIS and CA-Markov modelling techniques. Land Use Policy 2020, 91, 104414. [Google Scholar] [CrossRef]
  58. Lu, Q.; Chang, N.-B.; Joyce, J.; Chen, A.S.; Savic, D.A.; Djordjevic, S.; Fu, G. Exploring the potential climate change impact on urban growth in London by a cellular automata-based Markov chain model. Comput. Environ. Urban Syst. 2018, 68, 121–132. [Google Scholar] [CrossRef]
  59. Huang, C.; Zhou, Y.; Wu, T.; Zhang, M.; Qiu, Y. A cellular automata model coupled with partitioning CNN-LSTM and PLUS models for urban land change simulation. J. Environ. Manag. 2023, 351, 119828. [Google Scholar] [CrossRef]
  60. Zhu, Y.; Geiß, C.; So, E. Simulating urban expansion with interpretable cycle recurrent neural networks. GISci. Remote Sens. 2024, 61, 2363576. [Google Scholar] [CrossRef]
  61. Lin, X.; Fu, H. Multi-scenario simulation analysis of cultivated land based on PLUS model—A case study of Haikou, China. Front. Ecol. Evol. 2023, 11, 1197419. [Google Scholar] [CrossRef]
  62. Zhou, M.; Ma, Y.; Tu, J.; Wang, M. SDG-oriented multi-scenario sustainable land-use simulation under the background of urban expansion. Environ. Sci. Pollut. Res. 2022, 29, 72797–72818. [Google Scholar] [CrossRef]
  63. Ashwini, K.; Sil, B.S.; Al Kafy, A.; Altuwaijri, H.A.; Nath, H.; Rahaman, Z.A. Harnessing Machine Learning Algorithms to Model the Association between Land Use/Land Cover Change and Heatwave Dynamics for Enhanced Environmental Management. Land 2024, 13, 1273. [Google Scholar] [CrossRef]
  64. Alturk, B.; Konukcu, F. Modeling land use/land cover change and mapping morphological fragmentation of agricultural lands in Thrace Region/Turkey. Environ. Dev. Sustain. 2019, 22, 6379–6404. [Google Scholar] [CrossRef]
  65. Singh, G.; Singh, S.K. Evapotranspiration Over the Indian Region: Implications of Climate Change and Land Use/Land Cover Change. Nat. Environ. Pollut. Technol. 2023, 22, 211–219. [Google Scholar] [CrossRef]
  66. An, X.; Zhang, M.; Zang, Z. Driving Mechanisms of Spatiotemporal Heterogeneity of Land Use Conflicts and Simulation under Multiple Scenarios in Dongting Lake Area. Remote Sens. 2023, 15, 4524. [Google Scholar] [CrossRef]
  67. Thakrar, S.K.; Johnson, J.A.; Polasky, S. Land-Use Decisions Have Substantial Air Quality Health Effects. Environ. Sci. Technol. 2023, 58, 381–390. [Google Scholar] [CrossRef]
  68. Kumar, V.; Agrawal, S. Urban modelling and forecasting of landuse using SLEUTH model. Int. J. Environ. Sci. Technol. 2022, 20, 6499–6518. [Google Scholar] [CrossRef]
  69. Guan, D.; Zhao, Z.; Tan, J. Dynamic simulation of land use change based on logistic-CA-Markov and WLC-CA-Markov models: A case study in three gorges reservoir area of Chongqing, China. Environ. Sci. Pollut. Res. 2019, 26, 20669–20688. [Google Scholar] [CrossRef]
  70. Safabakhshpachehkenari, M.; Tonooka, H. Modeling Land Use Transformations and Flood Hazard on Ibaraki’s Coastal in 2030: A Scenario-Based Approach Amid Population Fluctuations. Remote Sens. 2024, 16, 898. [Google Scholar] [CrossRef]
  71. Lee, C.; Lee, J.; Park, S. Forecasting the urbanization dynamics in the Seoul metropolitan area using a long short-term memory–based model. Environ. Plan. B Urban Anal. City Sci. 2022, 50, 453–468. [Google Scholar] [CrossRef]
  72. Mustafa, A.; Ebaid, A.; Omrani, H.; McPhearson, T. A multi-objective Markov Chain Monte Carlo cellular automata model: Simulating multi-density urban expansion in NYC. Comput. Environ. Urban Syst. 2021, 87, 101602. [Google Scholar] [CrossRef]
  73. Hasan, S.; Shi, W.; Zhu, X.; Abbas, S. Monitoring of Land Use/Land Cover and Socioeconomic Changes in South China over the Last Three Decades Using Landsat and Nighttime Light Data. Remote Sens. 2019, 11, 1658. [Google Scholar] [CrossRef]
  74. Wang, L.; Pijanowski, B.; Yang, W.; Zhai, R.; Omrani, H.; Li, K. Predicting multiple land use transitions under rapid urbanization and implications for land management and urban planning: The case of Zhanggong District in central China. Habitat Int. 2018, 82, 48–61. [Google Scholar] [CrossRef]
  75. Kim, I.; Kwon, H. Assessing the Impacts of Urban Land Use Changes on Regional Ecosystem Services According to Urban Green Space Policies Via the Patch-Based Cellular Automata Model. Environ. Manag. 2020, 67, 192–204. [Google Scholar] [CrossRef]
  76. Gao, C.; Wang, J.; Wang, M.; Zhang, Y. Simulating Urban Agglomeration Expansion in Henan Province, China: An Analysis of Driving Mechanisms Using the FLUS Model with Considerations for Urban Interactions and Ecological Constraints. Land 2023, 12, 1189. [Google Scholar] [CrossRef]
  77. Gharbia, S.S.; Alfatah, S.A.; Gill, L.; Johnston, P.; Pilla, F. Land use scenarios and projections simulation using an integrated GIS cellular automata algorithms. Model. Earth Syst. Environ. 2016, 2, 1–20. [Google Scholar] [CrossRef]
  78. Rimal, B.; Keshtkar, H.; Sharma, R.; Stork, N.; Rijal, S.; Kunwar, R. Simulating urban expansion in a rapidly changing landscape in eastern Tarai, Nepal. Environ. Monit. Assess. 2019, 191, 255. [Google Scholar] [CrossRef]
  79. Feng, D.; Bao, W.; Fu, M.; Zhang, M.; Sun, Y. Current and future land use characters of a national central city in eco-fragile region—A case study in Xi’an city based on FLUS model. Land 2021, 10, 286. [Google Scholar] [CrossRef]
  80. Han, Y.; Jia, H. Simulating the spatial dynamics of urban growth with an integrated modeling approach: A case study of Foshan, China. Ecol. Model. 2017, 353, 107–116. [Google Scholar] [CrossRef]
  81. Henríquez-Dole, L.; Usón, T.J.; Vicuña, S.; Henríquez, C.; Gironás, J.; Meza, F. Integrating strategic land use planning in the construction of future land use scenarios and its performance: The Maipo River Basin, Chile. Land Use Policy 2018, 78, 353–366. [Google Scholar] [CrossRef]
  82. Ajmal, U.; Jamal, S. Analyzing land-use land-cover change and future urban growth with respect to the location of slaughterhouses in Aligarh city outskirts. Environ. Chall. 2021, 5, 100331. [Google Scholar] [CrossRef]
  83. Tan, J.; Li, Y. Influence of the perceptions of amenities on consumer emotions in urban consumption spaces. PLoS ONE 2024, 19, e0304203. [Google Scholar] [CrossRef]
  84. Nourqolipour, R.; Shariff, A.R.B.M.; Ahmad, N.B.; Balasundram, S.K.; Sood, A.M.; Buyong, T.; Amiri, F. Multi-objective-based modeling for land use change analysis in the South West of Selangor, Malaysia. Environ. Earth Sci. 2015, 74, 4133–4143. [Google Scholar] [CrossRef]
  85. Xu, X.; Zhang, D.; Liu, X.; Ou, J.; Wu, X. Simulating multiple urban land use changes by integrating transportation accessibility and a vector-based cellular automata: A case study on city of Toronto. Geo-Spatial Inf. Sci. 2022, 25, 439–456. [Google Scholar] [CrossRef]
  86. Aithal, B.H.; Vinay, S.; Ramachandra, T.V. Simulating urban growth by two state modelling and connected network. Model. Earth Syst. Environ. 2018, 4, 1297–1308. [Google Scholar] [CrossRef]
  87. Guo, P.; Wang, H.; Qin, F.; Miao, C.; Zhang, F. Coupled MOP and PLUS-SA Model Research on Land Use Scenario Simulations in Zhengzhou Metropolitan Area, Central China. Remote Sens. 2023, 15, 3762. [Google Scholar] [CrossRef]
  88. Lei, Y.; Flacke, J.; Schwarz, N. Does Urban planning affect urban growth pattern? A case study of Shenzhen, China. Land Use Policy 2021, 101, 105100. [Google Scholar] [CrossRef]
  89. Kong, L.; Tian, G.; Ma, B.; Liu, X. Embedding ecological sensitivity analysis and new satellite town construction in an agent-based model to simulate urban expansion in the beijing metropolitan region, China. Ecol. Indic. 2017, 82, 233–249. [Google Scholar] [CrossRef]
  90. Liu, D.; Clarke, K.C.; Chen, N. Integrating spatial nonstationarity into SLEUTH for urban growth modeling: A case study in the Wuhan metropolitan area. Comput. Environ. Urban Syst. 2020, 84, 101545. [Google Scholar] [CrossRef]
  91. Addae, B.; Oppelt, N. Land-Use/Land-Cover Change Analysis and Urban Growth Modelling in the Greater Accra Metropolitan Area (GAMA), Ghana. Urban Sci. 2019, 3, 26. [Google Scholar] [CrossRef]
  92. Gandharum, L.; Hartono, D.M.; Karsidi, A.; Ahmad, M.; Prihanto, Y.; Mulyono, S.; Sadmono, H.; Sanjaya, H.; Sumargana, L.; Alhasanah, F. Past and future land use change dynamics: Assessing the impact of urban development on agricultural land in the Pantura Jabar region, Indonesia. Environ. Monit. Assess. 2024, 196, 1–27. [Google Scholar] [CrossRef]
  93. Luan, C.; Liu, R.; Sun, J.; Su, S.; Shen, Z. An Improved Future Land-Use Simulation Model with Dynamically Nested Ecological Spatial Constraints. Remote. Sens. 2023, 15, 2921. [Google Scholar] [CrossRef]
  94. Yu, H.; Xu, Y.-P.; Zhong, H.; Chiang, Y.-M.; Liu, L. Exploring the impact of urbanization on flood characteristics with the SCS-TRITON method. Nat. Hazards 2023, 120, 3213–3238. [Google Scholar] [CrossRef]
  95. Chaturvedi, S.; Shukla, K.; Rajasekar, E.; Bhatt, N. A spatio-temporal assessment and prediction of Ahmedabad’s urban growth between 1990–2030. J. Geogr. Sci. 2022, 32, 1791–1812. [Google Scholar] [CrossRef]
  96. Yomo, M.; Yalo, E.N.; Gnazou, M.D.T.; Silliman, S.; Larbi, I.; Mourad, K.A. Forecasting land use and land cover dynamics using com-bined remote sensing, machine learning algorithm and local perception in the Agoènyivé Plateau, Togo. Remote Sens. Appl. 2023, 30, 100928. [Google Scholar] [CrossRef]
  97. Valencia, V.H.; Levin, G.; Hansen, H.S. Modelling the spatial extent of urban growth using a cellular automata-based model: A case study for Quito, Ecuador. Geogr. Tidsskr. J. Geogr. 2020, 120, 156–173. [Google Scholar] [CrossRef]
  98. Jamali, A.A.; Kalkhajeh, R.G. Urban environmental and land cover change analysis using the scatter plot, kernel, and neural network methods. Arab. J. Geosci. 2019, 12, 100. [Google Scholar] [CrossRef]
  99. Grigorescu, I.; Kucsicsa, G.; Popovici, E.-A.; Mitrică, B.; Mocanu, I.; Dumitraşcu, M. Modelling land use/cover change to assess future urban sprawl in Romania. Geocarto Int. 2019, 36, 721–739. [Google Scholar] [CrossRef]
  100. Zhang, Z.; Wang, X.; Zhang, Y.; Gao, Y.; Liu, Y.; Sun, X.; Zhi, J.; Yin, S. Simulating land use change for sustainable land management in rapid urbanization regions: A case study of the Yangtze River Delta region. Landsc. Ecol. 2023, 38, 1807–1830. [Google Scholar] [CrossRef]
  101. He, S.Y.; Wu, D.; Chen, H.; Hou, Y.; Ng, M.K. New towns and the local agglomeration economy. Habitat Int. 2020, 98, 102153. [Google Scholar] [CrossRef]
  102. Liu, X.; Gu, R.; Sikder, S.K.; Xie, Z.; Takatori, C.; Xie, X. Mapping the endogenous drivers of mega-urbanisation in contemporary urban development. J. Urban Manag. 2025, 14, 530–542. [Google Scholar] [CrossRef]
  103. Guo, M.; Zhou, Y. Boosting Sustainable Urban Development: How Smart Cities Improve Emergency Management—Evidence from 275 Chinese Cities. Sustainability 2025, 17, 6851. [Google Scholar] [CrossRef]
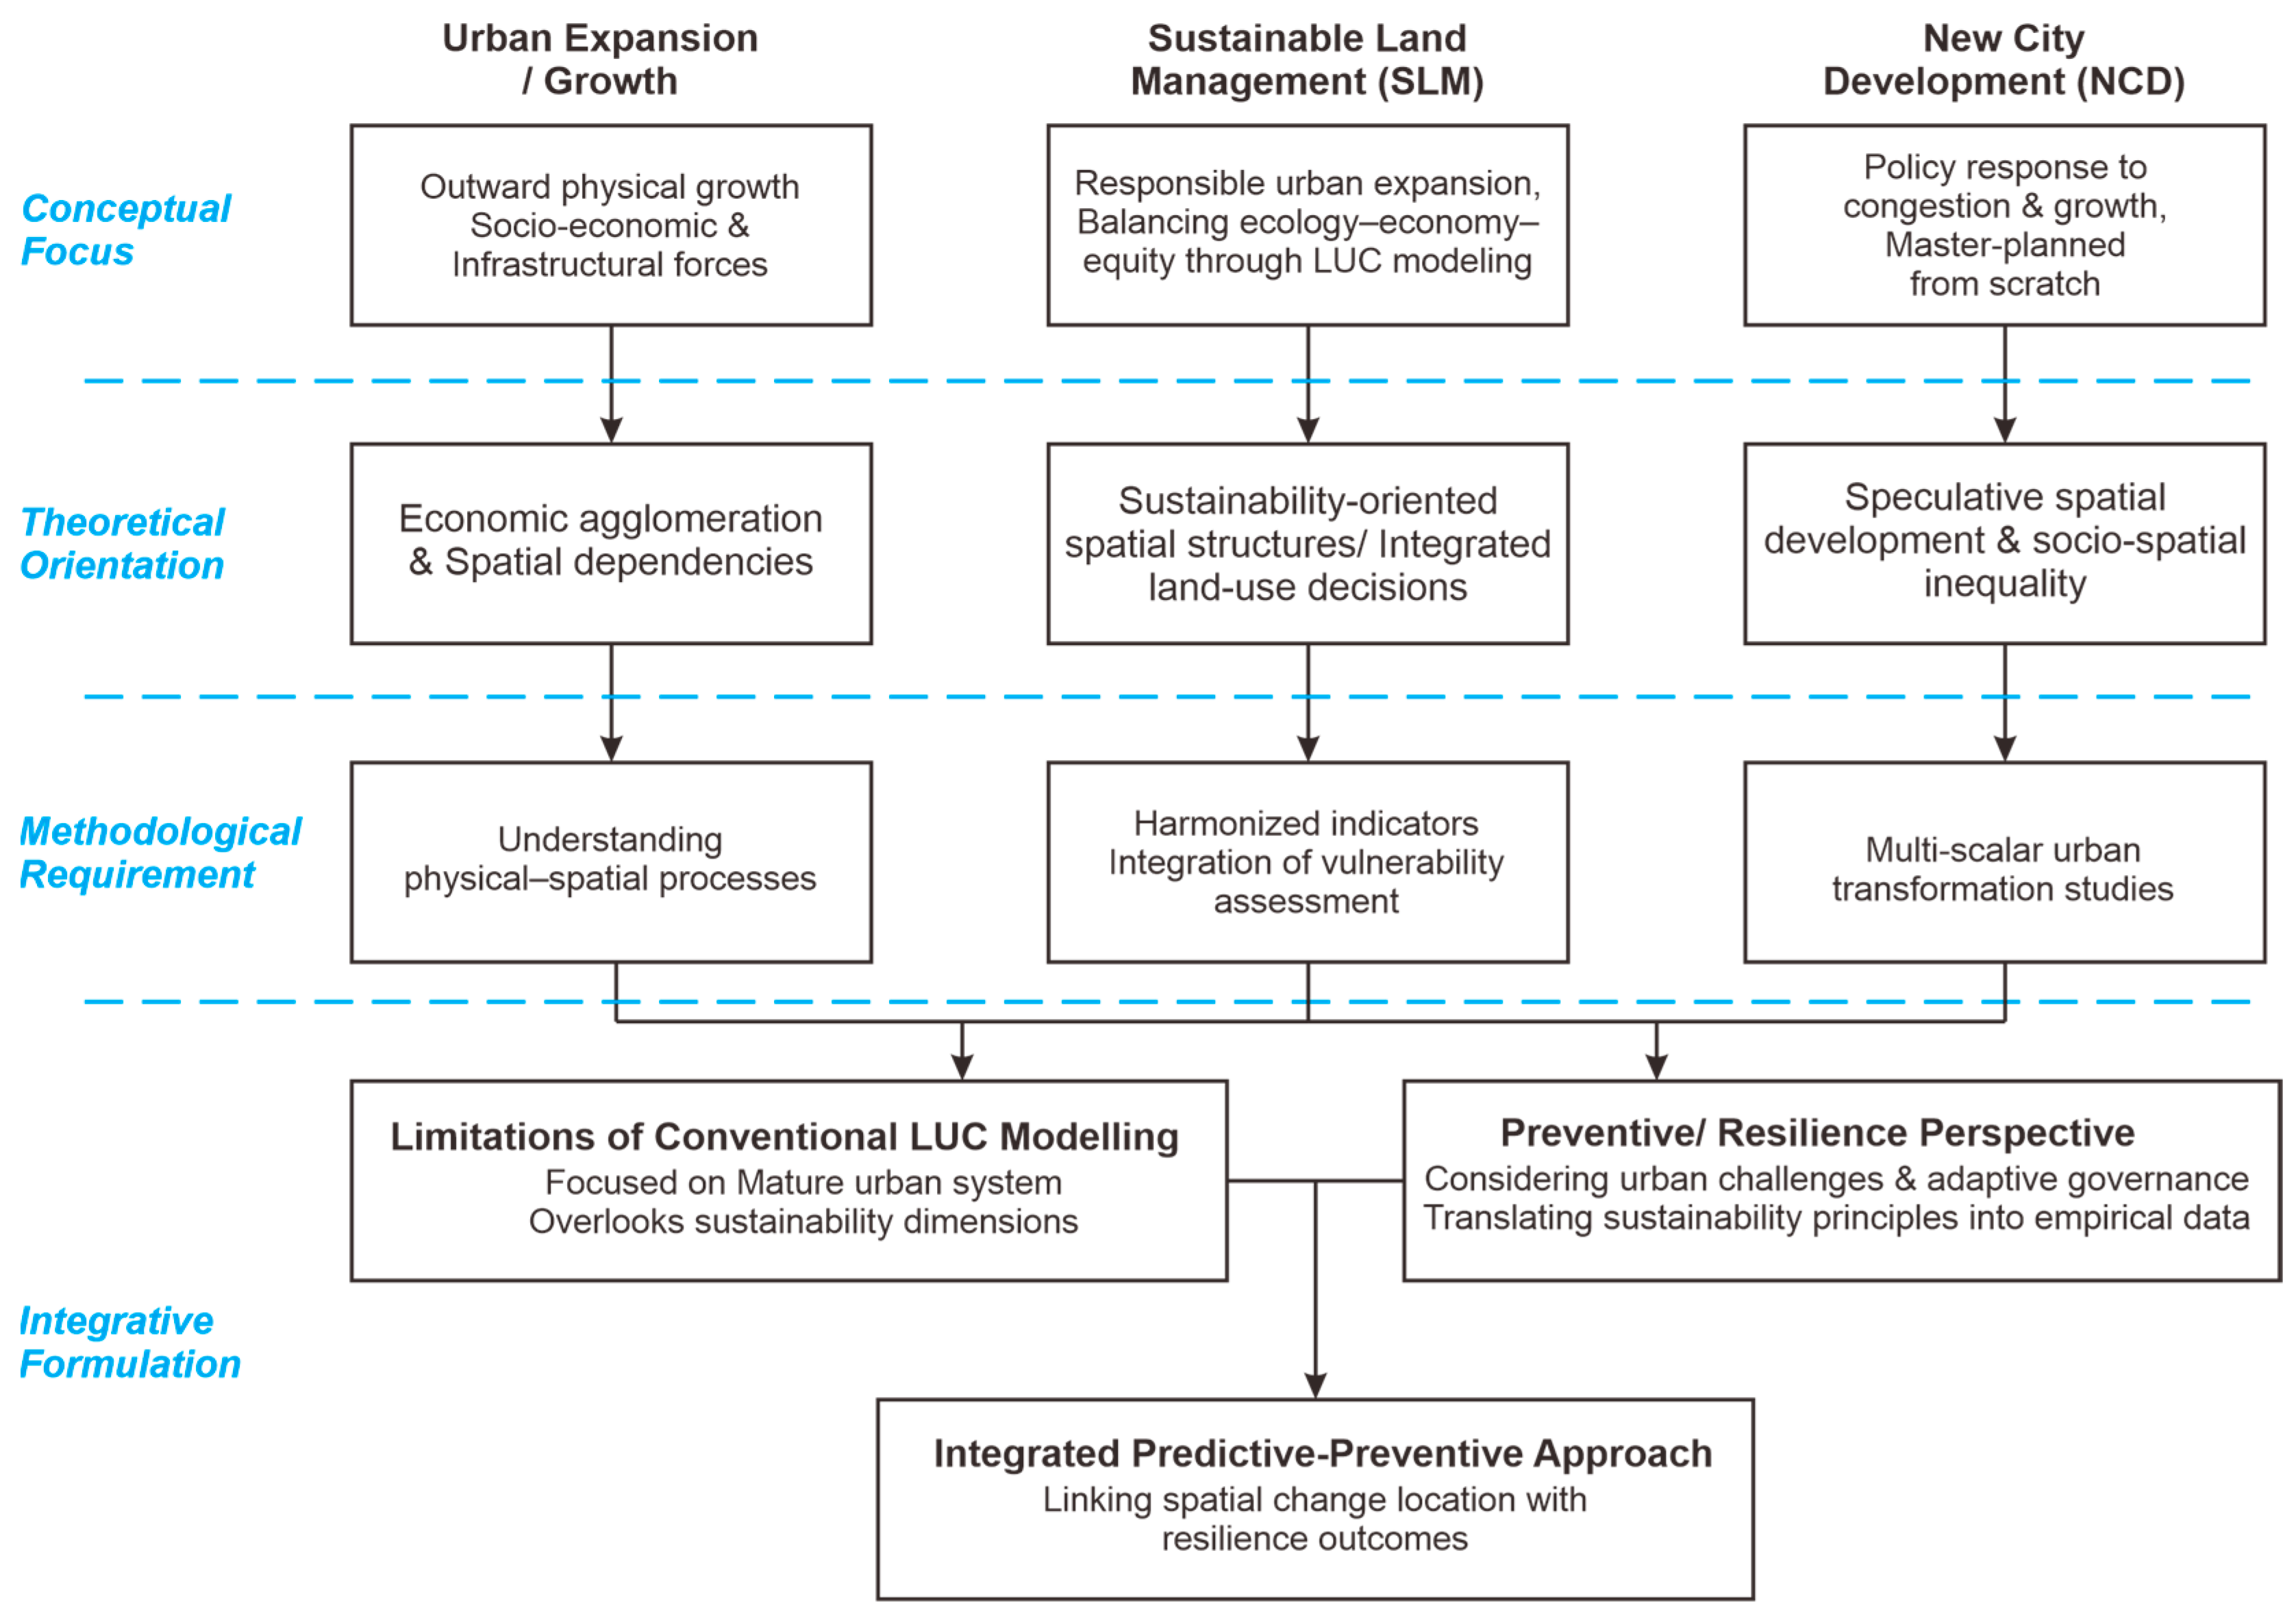
Figure 1. Conceptual synthesis of theoretical foundations.
Urbansci 09 00484 g001
Figure 2. Flow diagram of SLR stages in the present study.
Urbansci 09 00484 g002
Figure 3. Distribution of selected articles by journal.
Urbansci 09 00484 g003
Figure 4. Distribution of collected articles based on the origin country of the case study.
Urbansci 09 00484 g004
Figure 5. Number and classification of selected articles.
Urbansci 09 00484 g005
Figure 6. Network visualization of factors considered by researchers in selected articles.
Urbansci 09 00484 g006
Figure 7. Density visualization of factors considered by researchers in Physical Geography.
Urbansci 09 00484 g007
Figure 8. Density visualization of factors considered by researchers in Climate Environment.
Urbansci 09 00484 g008
Figure 9. Density visualization of factors considered by researchers in Socioeconomic.
Urbansci 09 00484 g009
Figure 10. Density visualization of factors considered by researchers in Urban Attraction.
Urbansci 09 00484 g010
Figure 11. Density visualization of factors considered by researchers in Policy and Regulation.
Urbansci 09 00484 g011
Figure 12. Urban issues found in the article and their strategies’ connection to the LUC Indicators.
Urbansci 09 00484 g012
Figure 13. Interrelated Indicators in Internal Circumstances (see Section 4.2 and Section 4.3 for detailed factors and sub-factors in each indicator). These arrows indicate directional relationships among the indicator categories.
Urbansci 09 00484 g013
Figure 14. Integrated Indicators for Future LUC in NCDs.
Urbansci 09 00484 g014
Table 1. Inclusion criteria in the present study.
CriteriaInclusion CriteriaStrings and Synonyms
PopulationRelated to LUC articlesLand use: land cover, LUCC, LULC, LUC; Change: spatio-temporal, dynamic, transition, transformation
InterventionThe article includes land use prediction in the methodologyPrediction: future land use, modeling, projection, simulation
ComparisonThe articles report the influential driving factors of LUCFactor: variable, driver, contributor, indicator, parameter
OutcomeThe article reported the implementation of urban growthGrowth: expansion, urbanization, urbanization, urban transformation
ContextThe article was interested in urban development and planning discussionsUrban: city, regional, town; Development: planning, management
Table 2. Integrated Indicators related to urban issues found in selected articles.
Integrated IndicatorsReference MentioningConnecting Issue
Ecological resistance quality (ERQ)[19,76]Environmental
Sustainability
Land use conflict potential (LUCP)[19]
Urban development land use suitability (UDLS)[19,93,97]
Urban compactness (UCD)[42]
Tourism Development Assessment (TDA)[50]Urban Inequalities
Spatial development heterogeneity (SDH)[17,59,98]
Urban gravitational interaction (UGI)[76,85,90]
Disclaimer/Publisher’s Note: The statements, opinions and data contained in all publications are solely those of the individual author(s) and contributor(s) and not of MDPI and/or the editor(s). MDPI and/or the editor(s) disclaim responsibility for any injury to people or property resulting from any ideas, methods, instructions or products referred to in the content.