Article

Façade Strategies for Climate Resilience: The Impact of Thermal Mass and Albedo on Urban Microclimates Across Different Climatic Zones

1
Institute of Environment, Habitat and Energy (INAHE-CONICET), CCT-Mendoza, Mendoza 5500, Argentina
2
Department of Energy, CIEMAT, 28040 Madrid, Spain
3
Eduardo Torroja Institute for Construction Science (IETCC), Spanish National Research Council (CSIC), 28033 Madrid, Spain
4
Postgraduate Program in Urban Infrastructure Systems, School of Polytechnic, Pontifical Catholic University of Campinas (PUC-Campinas), Campinas 13087-571, SP, Brazil
*
Author to whom correspondence should be addressed.
Urban Sci. 2025, 9(10), 428; https://doi.org/10.3390/urbansci9100428
Submission received: 21 July 2025 / Revised: 1 October 2025 / Accepted: 9 October 2025 / Published: 16 October 2025
(This article belongs to the Collection Urban Agenda)

Abstract

The intensification of thermal stress in cities due to urbanization and climate change underscores the urgent need to improve outdoor habitability. This study analyses the influence of three opaque façade technologies—traditional, lightweight and external thermal insulation composite systems—combined with two albedo levels (0.30 and 0.80), on summer outdoor conditions in Mendoza (Argentina), Madrid (Spain) and Campinas (Brazil). Using a calibrated microclimatic model with ENVI-met v5.6 software, a digital replica of a 10-storey urban canyon was simulated to generate 18 scenarios, assessing the effect of façade thermal mass and reflectivity on the urban microclimate. The results show that (i) scenarios that mainly affect air temperature (AT) are those that modify the thermal mass of the façade technologies. For example, traditional technology with a low albedo reduce maximum AT by up to 1.2 °C in Campinas, 0.89 °C in Mendoza, and 0.81 °C in Madrid compared to light technology with the same albedo level. (ii) Mean radiant temperature (MRT) increases significantly in scenarios involving lightweight façade by 4.53 °C in Madrid, 4.46 °C in Mendoza, and 3.39 °C in Campinas. Conversely, increasing façade albedo further amplifies MRT due to multiple reflections in urban canyons with increases of 6.50 °C in Campinas, 6.09 °C in Mendoza, and 5.33 °C in Madrid. The impact is more pronounced with traditional façades. (iii) Traditional façades and low-albedo ETIC systems experience the fewest hours of very high thermal stress (UTCI > 38 °C), whereas lightweight façades increase exposure to extreme heat. Overall, air temperature is primarily determined by façade thermal mass, mean radiant temperature by surface reflectivity, and thermal comfort by the combined effect of both. These findings confirm that high reflectivity can be counterproductive in dense urban canyons, emphasizing the importance of climate- and morphology-sensitive façade strategies for urban resilience.

1. Introduction

Urban agglomerations are undergoing significant transformations, marked by rapid urbanization, densification, and spatial expansion, alongside demographic shifts such as population aging and increased exposure to thermal stress driven by global warming [1]. These trends are evident in both developed and developing regions and pose considerable challenges for the future of the cities. The combined effect of heightened heat exposure and growing vulnerability—particularly among sensitive population groups—are likely to intensify thermal stress in the coming decades [2]. Urban populations growth has intensified land demand and accelerated the intensification of urban land use. These processes, often associated with greater impervious surface coverage and reduced soil permeability, contribute to elevated surface temperatures and exacerbate urban overheating and the urban heat island (UHI) effect [3]. The need to mitigate these impacts is reinforced by their direct consequences on human health, including higher heat-related mortality among vulnerable populations and in lower-income neighborhoods [4].
The interaction between urbanization—which amplifies the UHI effect—and climate change—which increases the frequency and intensity of heat waves—has been highlighted in numerous studies [5]. This interaction underscores the urgent need for targeted mitigation and adaptation strategies to improve urban environmental quality and resilience. This imperative has been recognized in both the European Union and the Southern Cone of Latin America, where urban areas are increasingly investing in evidence-based approaches to enhance thermal comfort and overall livability in public spaces [6].
Building more livable cities requires identifying thermal discomfort zones and establishing a quantitative basis for assessing the effectiveness of different mitigation strategies. In this regard, it is essential to evaluate and quantify pedestrian thermal comfort using thermal stress indices that integrate key environmental variables such as solar radiation, air temperature, wind speed, and humidity. These indices must also account for the specific characteristics of the urban fabric—including surface materials, vegetation density, building geometry, and shading elements—which directly affect the physiological responses of the human body. Among these indices, the mean radiant temperature (MRT) is a key microclimatic parameter for assessing outdoor thermal comfort [7]. Technically, MRT represents the uniform temperature of an imaginary enclosure in which a person would exchange the same amount of radiant heat as in the actual environment. Unlike air temperature alone, MRT accounts for the combined effect of shortwave and longwave radiation emitted and reflected by surrounding surfaces, thereby providing the equivalent temperature perceived by the human body after comprehensively considering all radiation influences [8]. MRT in urban environments depends on the thermal and radiative properties of exterior finishing materials, urban geometry [9,10], and vegetation cover [11]. Proper management of these factors is therefore essential to designing more comfortable and climate-resilient urban environments [12].
The Universal Thermal Climate Index (UTCI) is another widely used and robust tool for analyzing and managing outdoor thermal comfort. UTCI integrates air temperature, humidity, wind speed, and mean radiant temperature to comprehensively represent human thermal stress. Based on UTCI values, a thermal sensation scale is defined, categorizing different levels of stress from extreme cold to extreme heat [13].
In the urban environments, the main influence on MRT balance comes from longwave thermal radiation re-emitted by building surfaces-particularly façades and other vertical elements- toward the surrounding environment. The use of high-emissivity materials increases re-emitted thermal energy, thereby reducing surface temperatures. However, this re-emitted energy plays a critical role in raising ambient temperatures at the pedestrian level, intensifying thermal stress and reinforcing the UHI effect in densely built areas [14].
The albedo of urban surfaces also plays a significant role in shaping urban thermal comfort by determining the amount of reflected solar radiation [15]. High albedo materials reduce heat absorption by keeping surfaces cooler and lowering the emitted long-wave radiation [16]. For instance, studies by Alchapar et al. [17] in Latin American cities showed that every 10% increase in pavements and roofs albedo reduces air temperature by 0.5 °C in Mendoza, Argentina, and by 0.9 °C in Campinas, Brazil. However, when applied to façades, high albedo materials can lead to overheating within deep street canyons due to the increased mutual reflections between buildings. This process, referred to as the “Inter-Building Effect–IBE” by Pisello et al. ([18,19]), traps solar radiation at street level and increases the radiant load experienced by pedestrians. Consequently, while the use of high albedo urban materials is effective in lowering surface temperatures, its ability to reduce MRT and thermal stress is limited in dense, high-rise urban contexts.
Although the vertical surfaces of tall buildings can significantly alter urban radiation dynamics through absorption and re-emission and multiple reflections of solar energy, existing research often overlooks the impact of façade configurations on mean radiant temperature (MRT), surface heat flux, and the pedestrian-level radiative environment. While façades have been widely studied in relation to energy performance, passive solar control, and photovoltaic integration, their role in shaping the microclimatic balance and outdoor thermal comfort remains underexplored. In recent work, Kim et al. [13] analyzed the effects of variations in the emissivity and reflectivity of urban road and concrete pavements on the UTCI. However, the properties of building materials and green spaces were held constant, citing their limited feasibility for modification in real-world applications. Similarly, a review by Köker et al. [20] highlights the challenges for estimating the solar energy potential of urban façades through simulation compared to horizontal urban surfaces. Potential sources of error in façade modeling include shading from surrounding buildings and architectural elements such as overhangs and balconies, diffuse and reflected irradiance from the ground and adjacent structures, and variations in sky view factors due to complex urban morphologies. To address this research gap, a comparative study on the influence of different façade technologies in multi-story buildings on the urban microclimate and pedestrian thermal comfort across diverse climatic zones is of significant importance.
Among the innovative façade technologies, lightweight (dry) and modular systems are increasingly implemented in residential buildings worldwide. Over the past decade, lightweight construction has shown steady growth, driven by advantages such as faster construction timelines, greater design flexibility, and cost reductions resulting from shorter project durations. The global dry construction market is projected to reach USD 231.4 billion by 2028, with a compound annual growth rate (CAGR) of 5.7% between 2023 and 2028 [21]. This expansion is also evident in Latin America, particularly in Argentina, Chile, Mexico, and Colombia, where the region is expected to represent 14% of the global dry construction market by 2028 [22]. Lightweight construction technologies are promoted as more efficient and sustainable alternatives to traditional systems, primarily because of their high thermal resistance provided by materials such as polystyrene or polyurethane. However, these dry systems are characterized by low thermal inertia, which increases energy demand for heating and cooling [9,10]. This change in the energy balance of lightweight/dry envelopes alters the rate and manner in which building envelopes absorb and release energy to the external environment (e.g., street canyons). Several studies have reviewed the trends and challenges of dry construction technologies, consistently identifying low thermal inertia as a critical issue to be addressed in order to ensure both thermal comfort and energy efficiency in buildings [23].
Another well-established façade technology for multi-story buildings is the External Thermal Insulation Composite System (ETICS). This system provides a comprehensive solution for the thermal insulation of buildings and is applicable to both new constructions and retrofitting of existing structures. ETICS are characterized by a compact, waterproof, and breathable “sandwich” layer that adheres directly to the building façade. The fundamental principle of the system is the application of insulating material to the exterior façade surfaces, thereby enhancing the thermal performance of the building envelope while protecting it from external climatic conditions [24]. In terms of thermal inertia, ETICS display an intermediate behavior between lightweight and traditional technologies. While the external insulation layer substantially improves thermal resistance, it also reduces the capacity of the wall to store and release heat. Consequently, ETICS perform better than lightweight systems in moderating temperature fluctuations but fall short of the buffering capacity provided by traditional massive envelopes.
The primary objective of this study is to identify the most effective combinations of radiative and thermal properties for optimizing air temperature in opaque façades in optimizing outdoor air temperature (AT), mean radiant temperature (MRT), and urban thermal comfort,-assessed using the Universal Thermal Climate Index (UTCI)—during the summer months in three cities: Mendoza, Madrid, and Campinas. The analysis is based on a theoretical model developed with ENVI-met V.5.6. and considers three construction technologies with different thermal mass properties—lightweight or dry (L), traditional (T) and the ETIC system (S)—each evaluated in relation to two levels of albedo (0.3 and 0.8).

2. Methodology

2.1. Study Cities as Case Studies

This study focuses on the cities of Mendoza (Argentina), Madrid (Spain), and Campinas (Brazil) to examine how climatic and geographic variability across temperate and subtropical latitudes influences the performance of façades constructed with different building technologies. Figure 1 shows the geographical location of the three cities, while Table 1 summarizes their main characteristics [25,26].
Although Mendoza, Madrid, and Campinas all experience warm summers, their Köppen climate classifications [27] reveal fundamental differences in seasonal temperature and precipitation patterns. Mendoza (BWk) has a cold desert steppe climate, characterized by very low annual precipitation, warm summers, and distinctly cold winters. In contrast, Madrid (Csa) features a typical Mediterranean climate with hot, dry summers, mild and humid winters, and precipitation concentrated mainly in the transitional seasons. Campinas (Cwa) presents a warm temperate climate with dry winters and hot summers; precipitation is concentrated in the warm season, while winters are milder and drier, without the cold conditions typical of steppe or desert climates. The three cities were selected to evaluate the impact of the façade technologies under diverse climatic conditions. The inclusion of desert steppe, Mediterranean, and warm temperate climates enables a comprehensive assessment of the façade performance across contrasting scenarios.

2.2. Study Area and Theoretical Model

For this study, a single area was selected: a peripheral social neighborhood in Mendoza (32°54′48″ S, 68°50′46″ W), whose urban typology is representative of the three cities analyzed. The area features a regular urban layout with homogeneous building types. Residential buildings are typically one- or two-story single-family homes, forming a low-density urban fabric with rectangular blocks and street widths ranging from 16 to 20 m. The built-up area covers approximately 80% of the neighborhood, while urban vegetation accounts for 13%. The average building height is 3.2 m, resulting in a height-to-width (H/W) ratio between 0.15 and 0.19.
Regarding construction technology, the roofs are lightweight, with a wooden structure, ceramic tile covering, and expanded polystyrene insulation (U-value: 0.625 W/m2K). The walls are traditionally constructed without thermal insulation, consisting of solid brick plastered on both sides (U-value: 1.07 W/m2K). The vehicular pavements are asphalt.
The microclimate of the study area was simulated using ENVI-met v5.6, a robust and widely used tool in urban microclimate research and thermal comfort assessment. ENVI-met integrates wind dynamics, temperature and humidity profiles, vegetation, and radiative exchanges at high spatial resolution [28,29,30,31,32]. It allows for detailed estimation of Mean Radiant Temperature (MRT), a key variable in biometeorological indices such as the Predicted Mean Vote (PMV), Physiologically Equivalent Temperature (PET), and the Universal Thermal Climate Index (UTCI) [31]. ENVI-met has incorporated in version 5 advanced models for calculating MRT, notably the Indexed View Sphere (IVS) and Advanced Canopy Radiation Transfer (ACRT) modules. These modules account for short- and long-wave radiation fluxes using a six-directional measurement technique, improving upon the older Average View Factors (AVF) method that simplified secondary radiation exchanges [31,33]. Recent studies confirm the potential of these models, especially when applied with site-specific inputs and calibrated parameters such as surface albedo and cloud cover, highlighting the importance of empirical calibration for reliable simulations in complex urban morphologies [34]. Therefore, while ENVI-met enables robust analyses of thermal comfort and urban heat mitigation strategies, its application requires careful local calibration and validation with field measurements to ensure reliable results [31,33,34].
The model was comprehensively digitized to reflect the actual characteristics of the study area, including urban morphology, surface materials, and vegetation, all documented through field surveys. Surface materials were represented using the ENVI-met v5.6.1 standard database, with site-specific adjustments to the albedo of horizontal and vertical external surfaces. Vegetation was parameterized using the software’s standard library, complemented by locally collected data. The microclimatic model was constructed as a 100 (x) × 80 (y) × 30 (z) grid with a resolution of 3.0 m (dx) × 3.0 m (dy) × 5.0 m (dz), covering a reference surface of 300 × 240 m.
To ensure simulation accuracy, a day with stable atmospheric conditions—free of precipitation and with minimal cloud cover—was selected to minimize external variability. Model calibration was conducted by comparing measured and simulated air temperatures recorded by a sensor installed within a central urban canyon. Although mean radiant temperature (MRT) was not directly validated through field measurements, it is considered representative, as the model incorporated critical input parameters such as albedo, material properties, and cloud cover, which are widely recognized as essential for accurate MRT estimation [31,34]. Microclimatic variables were collected at fixed station points (P1) in the central area of the study site (Figure 2) at pedestrian height (1.5 m). The measurement equipment used was a HOBO® H08-003-02 (Bourne, MA, USA, EE. UU.), with temperature accuracy of ±0.7 °C (from +21 °C) and humidity accuracy of ±5% (from +5 °C to +50 °C). Equipment was installed inside a radiation shield following WMO guidelines [35]. Figure 2 shows both the morphological configuration of the study area and the modeled section in ENVI-met. For calibration, the receptor was positioned at the exact location of the climate data logger (P1).
The input climatic parameters correspond to the periods of highest solar radiation availability. Specifically, the analysis focused on 8 February for Mendoza, 23 August for Madrid, and 6 February for Campinas in 2024. These dates were selected as they represent typical summer climatic conditions for each respective location (Table 2).

Model Calibration

To ensure model stability, the ENVI-met simulation was run for two consecutive days (48 h). The results presented in Figure 3 correspond to the second day, when the model had reached steady-state conditions.
Figure 4 presents a scatter plot comparing predicted and measured air temperature and relative humidity, along with the associated statistical metrics for the study area. The results indicate that the ENVI-met model performs well in estimating air temperature (Ta) and provides an acceptable fit for relative humidity (RH). For air temperature, the coefficient of determination was R2 = 0.91, indicating a strong correlation with observed data. Errors were relatively low (RMSE = 1.46 °C, MAE = 1.20 °C), with a negative bias (MBE = −0.80 °C), reflecting a slight systematic underestimation. For relative humidity, the fit was somewhat lower (R2 = 0.84), with RMSE = 3.04% and MAE = 2.00%, and a positive bias (MBE = 0.61%), indicating a minor overestimation. Overall, these results suggest that the model adequately reproduces the microclimatic conditions of the study area.

2.3. Assessment of Different Scesnarios

Once the model was calibrated and confirmed to reliably reproduce local climatic conditions, a new scenario was introduced. In this modified area, a simplified model was constructed with a typical building height of 30 m (≈10 stories) and no vegetation, allowing the isolation of the construction variable and maximizing façade exposure relative to the total envelope area. This configuration resulted in a sky view factor of 31% (Figure 5).
To evaluate the impact of different façade technologies on urban microclimatic performance in Mendoza, Madrid, and Campinas, 18 scenarios were analyzed. The variables considered were construction technology (traditional, lightweight, and ETIC system) and albedo level (0.3 and 0.8), applied across the three cities: Mendoza (BWk climate), Madrid (Csa climate), and Campinas (Cwa climate). The nomenclature (ID) of the scenarios is detailed in Table 3, while the construction specifications for each façade scenario are presented in Table 4.
Table 4 outlines the construction solutions for the façades, according to their radiative properties and thermal mass characteristics.
To evaluate the microclimatic impact of the thermal and radiative properties of different façade technologies within the study area, a comparative analysis was conducted across the climatic contexts of Mendoza, Madrid, and Campinas. Initially, the thermal performance of each technology was assessed individually in terms of thermal capacity (see Section 3.1). The thermal capacity of a material is a physical property that indicates the amount of thermal energy required to raise the temperature of a given quantity of that material by one degree Celsius (or Kelvin). In other words, it is a measure of a material’s ability to store heat. This concept is closely related to the thermal inertia of materials, which requires more complex calculation models that consider the geometry of each component and boundary conditions, as the ENVI-met model does. The total thermal capacity per m2 (Ctotal) of each studied technology is determined by the sum of the heat capacities per m2 of its individual layers (Ci), according to the following formula:
C i   =   m i ·   c i
where
  • Ci = heat capacity per m2 of layer i (J/m2·K);
  • mi = ρi · ei = mass per m2 of the layer (kg/m2);
  • ρi = density of the layer (kg/m3);
  • ei = thickness of the layer (m);
  • ci = specific heat of the layer (J/kg·K).
Then, the total heat capacity per m2 of technologies, Ctotal (J/m2·K), is obtained by summing all layers:
C t o t a l = i = 1 n C i   =   i = 1 n ( ρ i · e i · c i )
This formula allows to calculate the total thermal mass of a composite wall per square meter, and find the most effective combinations of radiative and thermal mass properties.. Secondly, various radiative and thermal properties façade configurations were simulated using ENVI-met software, and their influence on the urban environment was quantified through the parameters of mean radiant temperature (MRT) and outdoor air temperature (AT), as defined previously (see Section 3.2). Finally, to further understand the implications of façade technology selection, a thermal comfort analysis was conducted using the Universal Thermal Climate Index (UTCI) in the study cities (see Section 3.2.2. The objective of this analysis was to investigate how the different climatic characteristics (BWk for Mendoza, Csa for sMadrid, and Cwa for Campinas) interact with the thermal and radiative properties of façades and affect the perception of thermal stress, particularly under extreme heat conditions. The UTCI thermal stress categories considered in the analysis were interpreted as follows:
  • Moderate heat stress: (26–32 °C);
  • Strong heat stress: (32–38 °C);
  • Very strong heat stress: (38–46 °C).

3. Results

3.1. Thermal Capacity of the Analyzed Technologies (Ctotal)

Thermal inertia is the ability of a material to store and release heat. A material with high thermal inertia absorbs heat during the day and releases it slowly at night, helping to stabilize indoor temperatures. It is directly related to the total thermal capacity of the wall (Ctotal) that is the physical quantity used to quantify the effect of thermal inertia. Therefore, a wall with a higher Ctotal has greater thermal inertia and is more effective at damping temperature fluctuations.
Table 5 describes the distinctive thermal behavior of the three analyzed construction technologies, evaluated through their heat capacity per unit area (Ctotal). The traditional system (T) has a Ctotal of 187,840 J/(m2·K), which means that raising the temperature of 1 m2 of a traditional wall (18 cm thick) by 1 K requires approximately 187,879 J of thermal energy. These values demonstrate that traditional façade technology achieves the highest thermal inertia, making it ideal for damping daytime temperature fluctuations due to the high mass and density of its layers.
In contrast, the lightweight system (L) exhibits the lowest heat capacity, with a Ctotal of 69,624 J/(m2·K), resulting in low thermal inertia. This technology prioritizes thermal insulation through the incorporation of a thick layer of expanded polystyrene (EPS), making it highly efficient at reducing heat transfer.
Finally, the External Thermal Insulation Composite System (S) achieves an optimal balance, combining significant thermal inertia (Ctotal = 174,312 J/(m2·K)) due to its internal brick mass with superior insulation provided by an external EPS layer. This design allows the interior mass to regulate temperature while the insulation minimizes heat losses or gains, optimizing both comfort and energy efficiency.
The bar chart in Figure 6 describes the total thermal capacity per m2 of each component by technology as calculated by Equation (1).

3.2. Impact of Façade Technologies on Urban Environment

Table 6 presents the outdoor air temperature (AT) and mean radiant temperature (MRT) data for Mendoza, Madrid, and Campinas, considering different façade technologies (lightweight—L, traditional—T, and ETIC system—S) and albedo levels (0.3 and 0.8). The columns showing the maximum values of each variable (AT and MRT) are color-coded according to their range of behavior to facilitate analysis and highlight observable patterns.
Table 6 shows that the extreme values in the maximum AT column occur when the construction technology is varied (L0.3 vs. T0.3) across the three cities. In contrast, MRT is primarily influenced by surface albedo, with high-albedo façades producing higher MRT values than low-albedo ones (L0.3, T0.3, S0.3 vs. L0.8, T0.8, S0.8).
Figure 7 and Figure 8 illustrate the urban microclimatic behavior in terms of air temperature and mean radiant temperature within the street canyon for the three study cities, across all 18 façade scenarios. Table 3 provides a detailed explanation of the nomenclature codes for each scenario.

3.2.1. Air Temperature (AT) and Mean Radiant Temperatures (MRT)

When evaluating the thermal behavior of the analyzed scenarios, it was observed that the MRT variable was highly sensitive to the three façade technologies (L, T, and S) and to both albedo levels (0.3 and 0.8) in façade technologies, compared to air temperature (AT). Next, consistent patterns were observed across cities:
-
Air temperature (AT) in relation to technologies modification: traditional façades with low albedo (0.3) systematically presented the lowest maximum AT values, confirming the buffering effect of higher thermal inertia. In Campinas, for example, the maximum AT with traditional façades was 31.23 °C, while lightweight façades reached 32.43 °C—an increase of 1.2 °C. Similar, but smaller, differences were recorded in Mendoza (0.89 °C) and Madrid (0.81 °C) (T0.3 vs. L0.3). Lightweight façades, characterized by low thermal mass due to insulating materials such as polystyrene, responded more rapidly to diurnal variations. This accelerated heat release resulted in higher AT peaks and more pronounced daily fluctuations.
-
Air Temperature (AT) in relation to albedo modification: regarding the impact of the radiative properties of façades, a lower influence on urban air temperatures was observed, compared to the effect of façade materials. Across the studied cities, increasing the albedo from 0.3 to 0.8 most significantly affected lightweight technologies. The greatest reductions in maximum AT occurred in Campinas, with decreases of 0.92 °C; in Mendoza and Madrid, average differences reached approximately 0.5 °C (L0.3 vs. L0.8) (Table 6 and Figure 7).
-
Mean Radiant Temperature (MRT) in relation to technologies modification: lightweight façades with low albedo generate significantly higher MRT than other technologies, particularly in high-radiation contexts. The maximum differences between lightweight and traditional technologies reached 4.46 °C in Mendoza, 4.53 °C in Madrid and 3.39 °C in Campinas (L0.3 vs. T0.3). The increase is particularly pronounced in Mendoza and Madrid, cities characterized by high solar radiation and heliophany during the summer months (exceeding 1000 W/m2). (Table 6 and Figure 8).
-
Mean Radiant Temperature (MRT) in relation to albedo modification: high-albedo façades (0.8) amplified MRT due to multiple reflections within the deep canyon, a phenomenon of radiative “trapping.” Their interaction with solar altitude reinforced the effect of canyon geometry. Deep urban canyons in all study areas promoted higher maximum and average MRT values across the three cities, mainly due to inter-building radiation reflections (inter-building effect, [19]). Campinas was particularly affected because of its geographical position near the equator, where the sun strikes almost perpendicularly on horizontal surfaces, intensifying radiative load. Specifically, in Campinas, increasing façade albedo to 0.8 raised MRT by 6.50 °C for traditional technology (from 62.33 °C to 68.83 °C) and by 3.62 °C for lightweight technology (from 65.72 °C to 68.83 °C). In Mendoza, the maximum MRT difference was 6.09 °C for traditional façades (from 64.87 °C to 70.96 °C) and 2.85 °C for lightweight façades (from 69.33 °C to 72.18 °C). A similar trend was found in Madrid, with increases of 5.33 °C (from 64.98 °C to 70.31 °C) for traditional façades and 3.25 °C (from 69.51 °C to 72.76 °C) for lightweight façades (T0.8 vs. T0.3 and L0.8 vs. L0.3) (Table 6 and Figure 8).
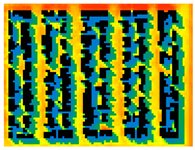
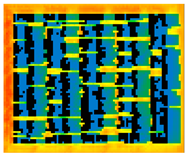
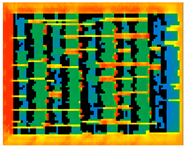
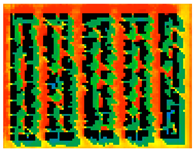
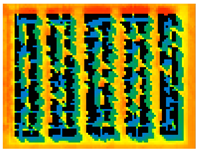
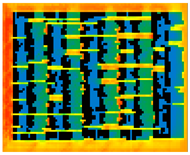
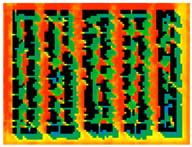
Table 7 presents thermal maps of mean radiant temperature (MRT) distribution captured at the time of their maximum values (15:00 solar time) on the study days for each city. In these maps, black areas represent building footprints, while the color scale indicates MRT distribution and intensity, ranging from low temperatures (blue/green) to high temperatures (red/yellow).
The orientation and extent of the shadow cones vary according to each city’s latitude relative to the Equator. In Mendoza, shadows are compact and cast southward due to the high solar altitude angle (approximately 74° in February). Conversely, in Madrid, the shadow cones are much larger and oriented northward, owing to its northern latitude and lower solar altitude (61° in August). Finally, in Campinas, its proximity to the Equator results in shadows primarily cast westward, with a high solar altitude angle (84° in February). These spatial and temporal shading patterns, combined with façade reflectivity and thermal inertia, determine the net radiative load at pedestrian level and explain the observed variations in MRT and outdoor thermal comfort across cities (Table 7).

3.2.2. Thermal Comfort According to UTCI Index

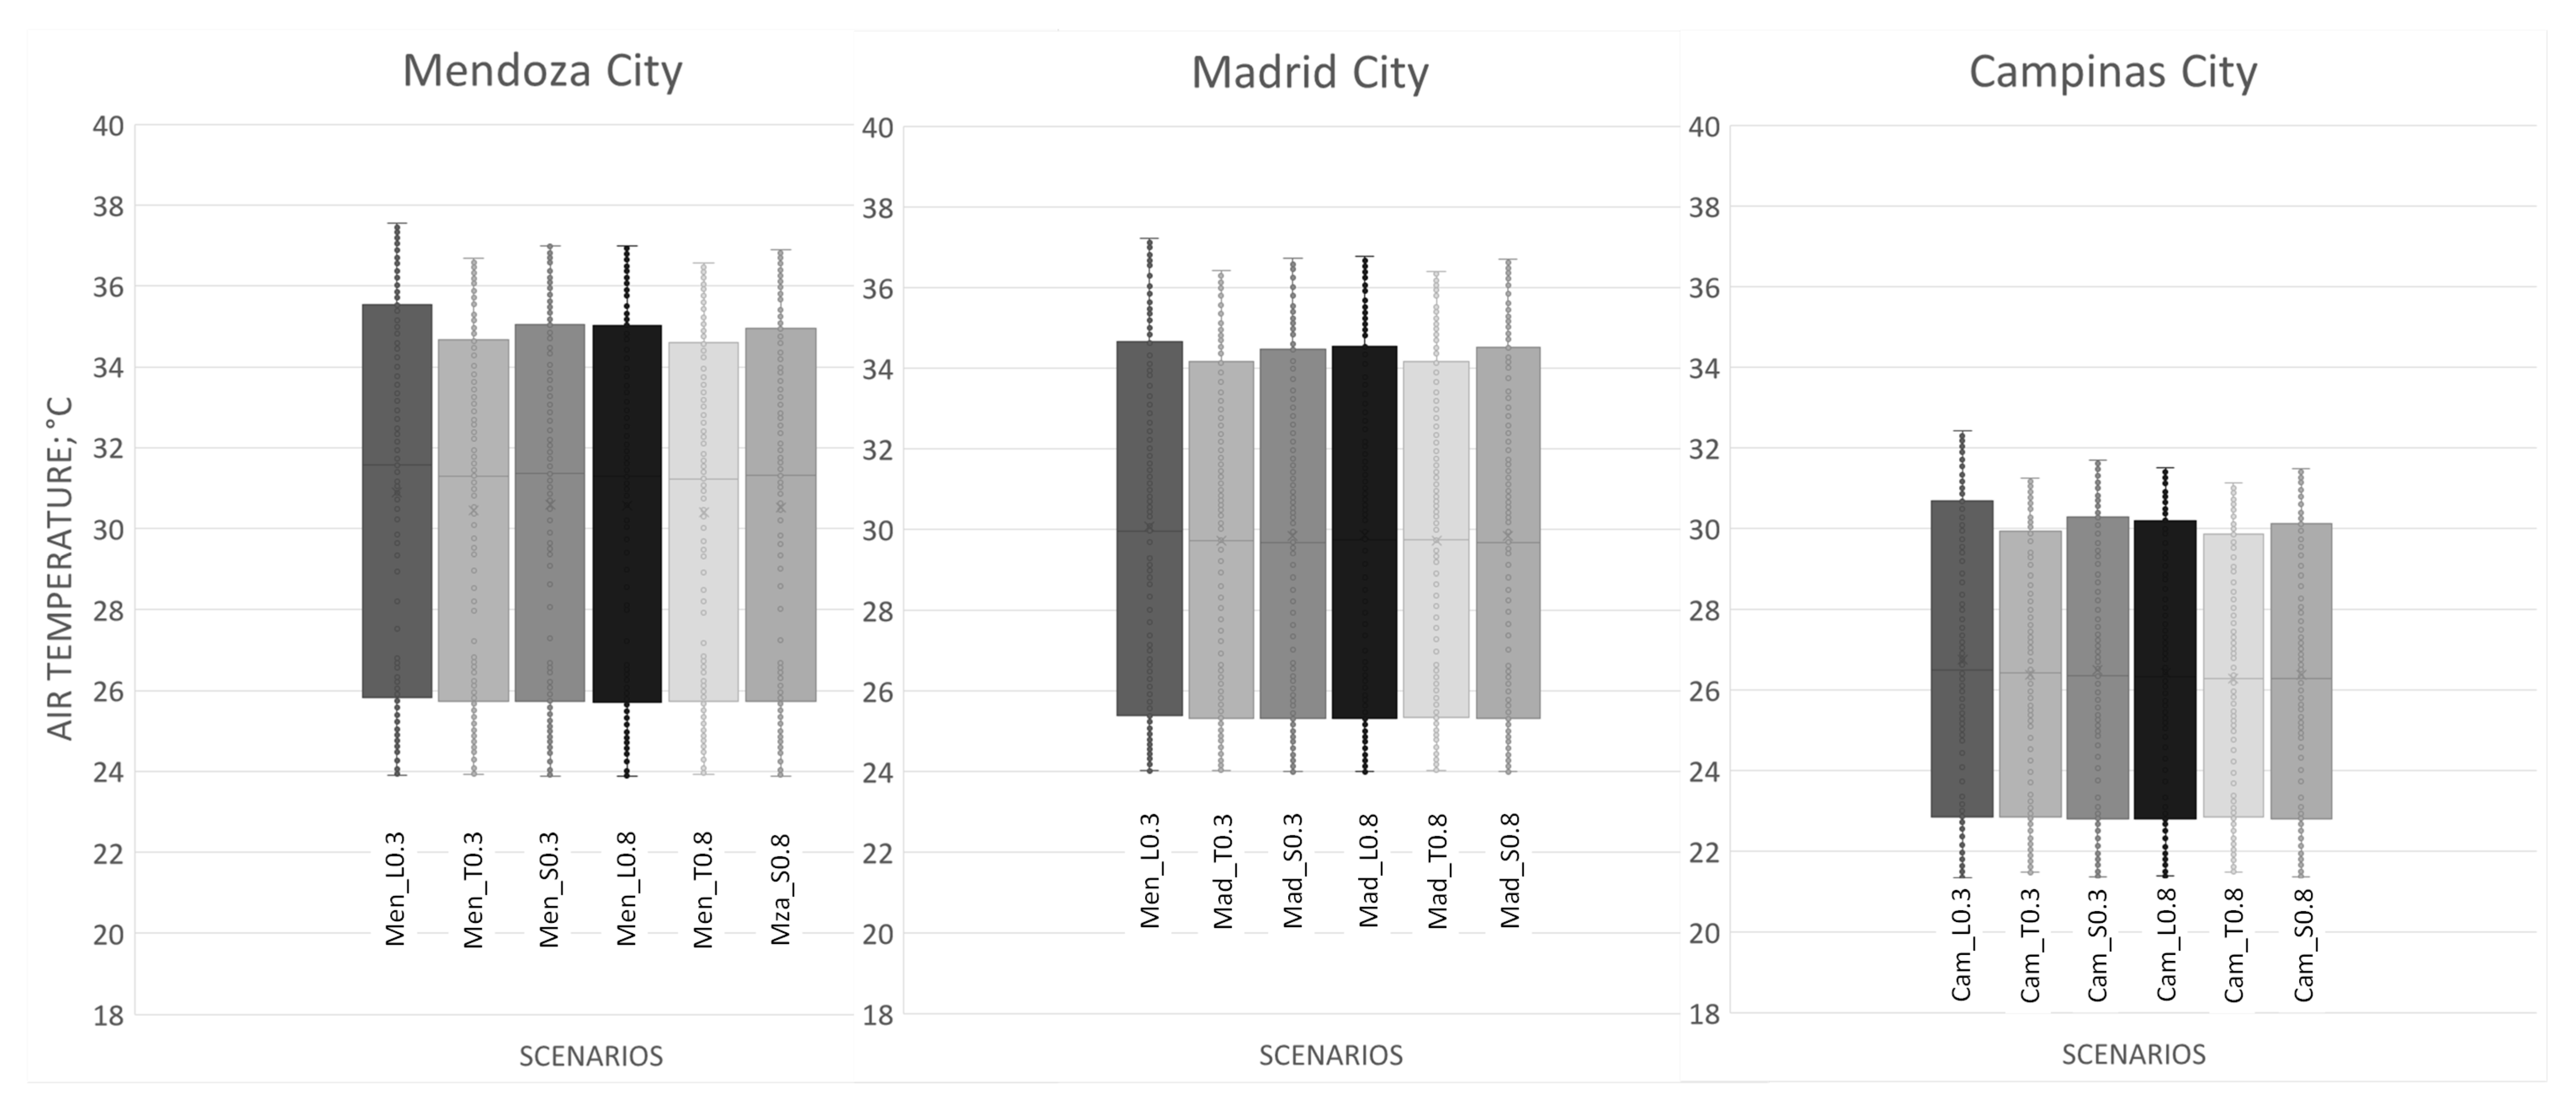
Figure 9 illustrates the daily distribution of the Universal Thermal Climate Index (UTCI) for the different façade technologies across the three cities. Figure 10 presents the percentage of hours experiencing very strong heat stress for each technology and albedo level.
This analysis aims to identify the combinations of façade technology and surface reflectance that are most effective in reducing heat stress. In Mendoza, the scenarios Men_T0.3 and Men_S0.3 (highlighted in Figure 10) exhibit the lowest percentage of hours under very strong heat stress, making them the most effective solutions for this climate. In Madrid, the most favorable configurations are Mad_T0.3, Mad_S0.3, and Mad_T0.8, which also show the lowest proportion of time under heat stress. In Campinas, the most efficient scenarios are Camp_L0.3 and Camp_L0.8, recording the fewest hours of very strong heat stress. This indicates that in warm-humid climates such as Campinas, thermal insulation is more critical than thermal mass, as the primary challenge is to limit sensible heat gains and prevent daytime overheating. In this context, lightweight systems with 9 cm of EPS insulation (Ci = 54,000 J/(m2·K)) are adequate (Table 5).
By contrast, cities like Mendoza and Madrid, which experience large daily temperature ranges (>9 °C, see Table 3), benefit more from technologies with higher thermal mass. Both traditional façades (T, Ctotal = 187,840 J/(m2·K)) and ETIC systems (S, Ctotal = 174,312 J/(m2·K)) perform better. The higher heat capacity allows these systems to absorb incoming solar radiation during the day and release it gradually at night, dampening the thermal cycle within the urban canyon and reducing UTCI peaks. This buffering effect is particularly important in arid climates such as Mendoza, where intense solar radiation and low cloud cover amplify thermal contrasts.
Surface reflectance (albedo) plays a key role in high-thermal-mass technologies, while its effect is less pronounced in lightweight systems. Due to the rapid thermal response of low-mass façades, the influence of reflectance is short-lived and does not accumulate, limiting its impact on UTCI compared to massive constructions.
Specifically, in Mendoza, the percentage of time under very strong heat stress exceeds 21% for Men_L0.3, Men_L0.8, Men_T0.8, and Men_S0.8, with UTCI peaking at 44.98 °C. In Madrid, this percentage reaches 12.5% for Mad_L0.3, Mad_L0.8, and Mad_S0.8, with a maximum UTCI of 42.22 °C. In Campinas, time under very strong heat stress increases to 12.5% for Cam_L0.3, Cam_S0.3, Cam_L0.8, and Cam_S0.8, with maximum UTCI values of 40.94 °C (Figure 10).

4. Discussion

This study confirms that façade material properties—particularly thermal mass and albedo—are decisive in shaping microclimates within deep urban canyons. Traditional and ETIC systems, both with higher heat capacity, consistently buffered air temperature peaks and reduced UTCI exposure, especially in climatic locations with large diurnal ranges such as Mendoza. These findings are consistent with previous evidence on the benefits of thermal inertia for moderating microclimatic extremes ([36,37]), and reinforce its relevance as a passive cooling strategy in dense urban environment.
Lightweight façades, in contrast, showed limited capacity to regulate thermal conditions, producing higher MRT and longer periods of strong heat stress. This outcome echoes recent studies on the drawbacks of low-mass materials in outdoor comfort [13], highlighting the need to complement such systems with additional strategies. One promising approach is the integration of phase-change materials (PCMs), which have been shown to enhance the latent storage capacity of lightweight constructions [37].
The influence of façade reflectivity was even more critical. Increasing albedo from 0.3 to 0.8 systematically amplified MRT by more than 6 °C in deep canyons, despite negligible effects on air temperature. This pattern corroborates the “inter-building effect” described in ([18,19]) and recent reviews questioning the universal benefits of reflective materials [38,39]. While high-albedo surfaces are often promoted as urban cooling solutions [40], the results here demonstrate that, under specific morphologies, they can exacerbate pedestrian radiant stress. Alternative innovations, such as retro-reflective materials designed to redirect solar gains away from pedestrian zones may offer more effective solutions [41]. Evidence from previous studies ([39,40,41,42]) suggests that multi-strategy approaches outperform isolated interventions in mitigating urban heat and improving outdoor comfort. Overall, these findings emphasize that façade strategies cannot be generalized. Instead, they must be tailored to climate and morphology, integrating recent material innovations to mitigate unintended consequences and improve outdoor thermal comfort.

5. Conclusions

The results of this study confirm that the thermal performance of opaque façades in deep urban canyons is strongly determined by their thermal capacity and surface reflectivity. Traditional façades, with the highest heat storage capacity (Ctotal = 187,840 J/(m2·K)), consistently achieved the lowest maximum air temperatures and MRT values across the three cities. In Campinas, for instance, maximum AT decreased by 1.2 °C compared to lightweight façades (31.23 °C vs. 32.43 °C), while MRT differences reached 3.39 °C (62.33 °C vs. 65.72 °C). Similar patterns were observed in Mendoza (ΔAT = 0.89 °C; ΔMRT = 4.46 °C) and Madrid (ΔAT = 0.81 °C; ΔMRT = 4.53 °C).
The ETIC system (Ctotal = 174,312 J/(m2·K)) showed intermediate but robust behavior, balancing the buffering effect of thermal mass with the insulating performance of EPS. By contrast, lightweight façades (Ctotal = 69,624 J/(m2·K)) systematically recorded the highest MRT and UTCI peaks, particularly in high-radiation climates such as Mendoza and Madrid, confirming their vulnerability due to low thermal inertia.
Albedo played a secondary role in AT modulation but had a decisive impact on MRT. Increasing surface reflectivity from 0.3 to 0.8 raised maximum MRT by up to 6.50 °C in Campinas (T0.3 = 62.33 °C vs. T0.8 = 68.83 °C), 6.09 °C in Mendoza (64.87 °C vs. 70.96 °C), and 5.33 °C in Madrid (64.98 °C vs. 70.31 °C). These increases, driven by multiple reflections and the inter-building effect, intensified radiant heat loads at pedestrian level, demonstrating that highly reflective façades can worsen thermal stress in tall, dense canyons.
Thermal comfort analysis further confirmed these trends. In arid and continental climates with large diurnal temperature ranges (Mendoza, Madrid), traditional and ETIC façades with low albedo minimized exposure to very strong heat stress (>38 °C), while lightweight façades prolonged it. In Campinas, a warm-humid climate, insulation proved more relevant, making lightweight façades comparatively effective in reducing sensible heat gains.
Overall, the study demonstrates that façade strategies cannot be generalized. Thermal mass is the primary determinant of AT, surface albedo governs MRT, and UTCI outcomes result from the combined influence of both. High reflectivity, often considered a universal cooling solution, may instead exacerbate thermal discomfort in dense urban morphologies. Climate- and morphology-sensitive façade design—favoring systems with higher thermal inertia and carefully selected albedo—represents a more reliable pathway to enhancing outdoor habitability and urban resilience.

Author Contributions

Conceptualization: N.A., E.G., G.P. and C.P.; methodology: N.A., E.G., C.P.; validation: N.A., C.P. and M.T.; investigation: N.A. and E.G.; resources: C.P., E.G. and G.P.; data curation: N.A. and M.T.; writing—original draft preparation: N.A. and E.G.; writing—review and editing: E.G., G.P. and N.A.; visualization: C.P., N.A. and M.T.; supervision: G.P.; project administration: G.P. and E.G.; funding acquisition: C.P. and G.P. All authors have read and agreed to the published version of the manuscript.

Funding

This work was supported by URBAN-TherCOM Project (Grant PID2020–114873RA-C33) and mateMAD Project (Grant PID2020-114873RB-C31) both funded by MCIN/AEI/10.13039/501100011033. They also thank the support by the São Paulo Research Foundation (FAPESP) under grant #2023/09875-1 and #2024/01299-4, and National Scientific and Technical Research Council of Argentina (CONICET) under grant #TE_2023_1_1012613.

Data Availability Statement

This article is a revised and expanded version of a paper entitled “Façade Construction Technologies and Their Impact on the Urban Microclimate: A Comparative Study between the Cities of Madrid and Mendoza”, which was presented at VII Ibero-American Congress of Smart Cities. ICSC-CITIES 2024 conference in San José, Costa Rica, in November 2024. The original contributions presented in this study are included in the article. Further inquiries can be directed to the corresponding author.

Acknowledgments

The support provided by the following institutions is gratefully acknowledged: Instituto de Medio Ambiente, Hábitat y Energía (INAHE-CONICET), CCT-Mendoza, Argentina; Departamento de Energía, CIEMAT, Madrid, Spain; Instituto Eduardo Torroja de Ciencias de la Construcción (IETCC), Madrid, Spain; and School of Polytechnic Postgraduate Program in Urban Infrastructure, Pontifical Catholic University of Campinas (PUC-Campinas), SP, Brazil.

Conflicts of Interest

The authors declare no conflicts of interest. The funders had no role in the design of the study; in the collection, analyses, or interpretation of data; in the writing of the manuscript; or in the decision to publish the results.

References

  1. Broadbent, A.M.; Krayenhoff, E.S.; Georgescu, M. The motley drivers of heat and cold exposure in 21st century US cities. Proc. Natl. Acad. Sci. USA 2020, 117, 21108–21117. [Google Scholar] [CrossRef]
  2. Schinasi, L.H.; Benmarhnia, T.; De Roos, A.J. Modification of the association between high ambient temperature and health by urban microclimate indicators: A systematic review and meta-analysis. Environ. Res. 2018, 161, 168–180. [Google Scholar] [CrossRef] [PubMed]
  3. Sinsel, T.; Simon, H.; Broadbent, A.M.; Bruse, M.; Heusinger, J. Modeling the outdoor cooling impact of highly radiative ‘super cool’ materials applied on roofs. Urban Clim. 2021, 38, 100898. [Google Scholar] [CrossRef]
  4. Klinenberg, E. Heat Wave. A Social Autopsy of Disaster in Chicago; The University of Chicago Press: Chicago, IL, USA, 2015; Available online: https://www.perlego.com/book/1853205/heat-wave-a-social-autopsy-of-disaster-in-chicago-pdf (accessed on 26 September 2025).
  5. Cheval, S.; Amihăesei, V.-A.; Chitu, Z.; Dumitrescu, A.; Falcescu, V.; Irașoc, A.; Micu, D.M.; Mihulet, E.; Ontel, I.; Paraschiv, M.-G.; et al. A systematic review of urban heat island and heat waves research (1991–2022). Clim. Risk Manag. 2024, 44, 100603. [Google Scholar] [CrossRef]
  6. Pörtner, H.; Roberts, D.C.; Adams, H.; Adelekan, I.; Adler, C.; Adrian, R.; Aldunce, P.; Ali, E.; Begum, R.A.; Bednar-Friedl, B.; et al. Technical Summary. In Climate Change 2022–Impacts, Adaptation and Vulnerability; Cambridge University Press: Cambridge, UK, 2023; pp. 37–118. [Google Scholar] [CrossRef]
  7. Gál, C.V.; Kántor, N. Modeling mean radiant temperature in outdoor spaces, A comparative numerical simulation and validation study. Urban Clim. 2020, 32, 100571. [Google Scholar] [CrossRef]
  8. Herrmann, J.; Matzarakis, A. Mean radiant temperature in idealised urban canyons—Examples from Freiburg, German. Int. J. Biometeorol. 2012, 56, 199–203. [Google Scholar] [CrossRef]
  9. Pérez, G.; Martín-Consuegra, F.; de Frutos, F.; Martínez, A.; Oteiza, I.; Frutos, B.; Alonso, C. Analysis of the Optical Response of Opaque Urban Envelope Materials: The Case of Madrid. Infrastructures 2022, 7, 116. [Google Scholar] [CrossRef]
  10. Alonso, C.; Martín-Consuegra, F.; Oteiza, I.; Asensio, E.; Pérez, G.; Martínez, I.; Frutos, B. Effect of façade surface finish on building energy rehabilitation. Sol. Energy 2017, 146, 470–483. [Google Scholar] [CrossRef]
  11. Ali-Toudert, F.; Mayer, H. Numerical study on the effects of aspect ratio and orientation of an urban street canyon on outdoor thermal comfort in hot and dry climate. Build. Environ. 2006, 41, 94–108. [Google Scholar] [CrossRef]
  12. Forouzandeh, A. Prediction of surface temperature of building surrounding envelopes using holistic microclimate ENVI-met model. Sustain. Cities Soc. 2021, 70, 102878. [Google Scholar] [CrossRef]
  13. Kim, J.; Park, S.; Lee, G. Analyzing urban thermal comfort changes due to modifications in urban material properties in a large-scale new town: A CFD study based on the universal thermal climate index (UTCI). Sustain. Cities Soc. 2025, 130, 106627. [Google Scholar] [CrossRef]
  14. Costanzo, V.; Evola, G.; Marletta, L. Energy savings in buildings or UHI mitigation? Comparison between green roofs and cool roofs. Energy Build. 2016, 114, 247–255. [Google Scholar] [CrossRef]
  15. Banerjee, S.; Graces Ching, N.Y.; Yik, S.K.; Dzyuban, Y.; Crank, P.J.; Yi, R.P.X.; Chow, W.T.L. Analysing impacts of urban morphological variables and density on outdoor microclimate for tropical cities: A review and a framework proposal for future research directions. Build. Environ. 2022, 225, 109646. [Google Scholar] [CrossRef]
  16. Levinson, R. Using solar availability factors to adjust cool-wall energy savings for shading and reflection by neighboring buildings. Sol. Energy 2019, 180, 717–734. [Google Scholar] [CrossRef]
  17. Alchapar, N.L.; Pezzuto, C.C.; Correa, E.N.; Chebel Labaki, L. The impact of different cooling strategies on urban air temperatures: The cases of Campinas, Brazil and Mendoza, Argentina. Theor. Appl. Climatol. 2017, 130, 35–50. [Google Scholar] [CrossRef]
  18. Pisello, A.L.; Castaldo, V.L.; Poli, T.; Cotana, F. Simulating the Thermal-Energy Performance of Buildings at the Urban Scale: Evaluation of Inter-Building Effects in Different Urban Configurations. J. Urban Technol. 2014, 21, 3–20. [Google Scholar] [CrossRef]
  19. Pisello, A.L.; Taylor, J.E.; Xu, X.; Cotana, F. Inter-building effect: Simulating the impact of a network of buildings on the accuracy of building energy performance predictions. Build. Environ. 2012, 58, 37–45. [Google Scholar] [CrossRef]
  20. Köker, N.I.; Manni, M.; Giorio, M.; Jelle, B.P.; Di Sabatino, M.; Lobaccaro, G. Defining challenges of solar irradiance modeling on façades in urban environments: A systematic review. Energy Build. 2025, 347, 116137. [Google Scholar] [CrossRef]
  21. Grand View Research. Modular Construction Market Size, Share & Trends Analysis Report By Product (Relocatable, Permanent), By Material (Wood, Steel, Concrete, Others), By Application, By Region, And By Segment Forecasts, 2023–2030; Grand View Research: San Francisco, CA, USA, 2023. [Google Scholar]
  22. Cardona, A.O. Construcción en seco steel framing ahorra 30% en los tiempos de edificación en obras. La República, Medellín, 2018. Available online: https://www.larepublica.co/especiales/especial-camacero/construccion-en-seco-steel-framing-ahorra-30-en-los-tiempos-de-edificacion-en-obras-2790535 (accessed on 26 September 2025).
  23. Elsinger, D.; Fernández, A.; Garzón, B. Calculador Integral de Eficiencia Energética de la Envolvente Arquitectónica: CIDEE-EA. Averma 2020, 24, 77–88. [Google Scholar]
  24. Saint-Gobain, W. Guía de Soluciones para Aislar Fachadas (SATE). 2020. Available online: https://www.es.weber/files/es/2019-11/FOL-ES-Weber-La-Guia-webertherm.pdf (accessed on 26 September 2025).
  25. Lawrie, L.; Drury, B.C. Development of Global Typical Meteorological Years (TMYx). 2022. Available online: https://climate.onebuilding.org (accessed on 1 August 2025).
  26. CEPAGRI. Climatologia Campinas-Centro De Pesquisas Meteorológicas e Climáticas Aplicadas à Agricultura. 2025. Available online: https://www.cpa.unicamp.br/graficos (accessed on 17 March 2025).
  27. Peel, M.C.; Finlayson, B.L.; McMahon, T.A. Updated world map of the Köppen-Geiger climate classification. Hydrol. Earth Syst. Sci. 2007, 11, 1633–1644. [Google Scholar] [CrossRef]
  28. Pezzuto, C.C.; Alchapar, N.L.; Correa, E.N. Urban cooling technologies potential in high and low buildings densities. Sol. Energy Adv. 2022, 2, 100022. [Google Scholar] [CrossRef]
  29. Muniz-Gäal, L.P.; Pezzuto, C.C.; de Carvalho, M.F.H.; Mota, L.T.M. Urban geometry and the microclimate of street canyons in tropical climate. Build. Environ. 2020, 169, 106547. [Google Scholar] [CrossRef]
  30. Tsoka, S.; Tsikaloudaki, A.; Theodosiou, T. Analyzing the ENVI-met microclimate model’s performance and assessing cool materials and urban vegetation applications—A review. Sustain. Cities Soc. 2018, 43, 55–76. [Google Scholar] [CrossRef]
  31. Sinsel, T.; Simon, H.; Ouyang, W.; dos Santos Gusson, C.; Shinzato, P.; Bruse, M. Implementation and evaluation of mean radiant temperature schemes in the microclimate model ENVI-met. Urban Clim. 2022, 45, 101279. [Google Scholar] [CrossRef]
  32. Liu, Z.; Cheng, W.; Jim, C.Y.; Morakinyo, T.E.; Shi, Y.; Ng, E. Heat mitigation benefits of urban green and blue infrastructures: A systematic review of modeling techniques, validation and scenario simulation in ENVI-met V4. Build. Environ. 2021, 200, 107939. [Google Scholar] [CrossRef]
  33. Aleksandrowicz, O.; Saroglou, T.; Pearlmutter, D. Evaluation of summer mean radiant temperature simulation in ENVI-met in a hot Mediterranean climate. Build. Environ. 2023, 245, 110881. [Google Scholar] [CrossRef]
  34. Schöneberger, P.; Sinsel, T.; Ouyang, W.; Tan, Z.; Bruse, M.; Simon, H. Enhancing urban microclimate simulations: Validating ENVI-met’s accuracy in modeling multi-directional radiative fluxes and mean radiant temperature in subtropical hong kong. Build. Environ. 2025, 284, 113475. [Google Scholar] [CrossRef]
  35. World Meteorological Organization. Instruments and Observing Methodos Report No. 81; World Meteorological Organization: Geneva, Switzerland, 2006. [Google Scholar]
  36. Elnaggar, S.A.; Omar, W.F.; Elsafty, M. A Review of the Role of Façade Materials in Mitigating the Urban Heat Island. Sci. J. Fac. Fine Arts Alex. Univ. 2022, 10, 1–14. [Google Scholar] [CrossRef]
  37. Piselli, C.; Castaldo, V.L.; Pisello, A.L. How to enhance thermal energy storage effect of PCM in roofs with varying solar reflectance: Experimental and numerical assessment of a new roof system for passive cooling in different climate conditions. Sol. Energy 2019, 192, 106–119. [Google Scholar] [CrossRef]
  38. Alchapar, N.L.; Correa, E.N. The use of reflective materials as a strategy for urban cooling in an arid ‘OASIS’ city. Sustain. Cities Soc. 2016, 27, 1–14. [Google Scholar] [CrossRef]
  39. Abdelwahab, R.A.; Fekry, A.A.; Hamed, R.E.-D. The effective landscape design parameters with high reflective hardscapes: Guidelines for optimizing human thermal comfort in outdoor spaces by design -a case on hot arid climate weather. Comput. Urban Sci. 2025, 5, 28. [Google Scholar] [CrossRef]
  40. Fahmy, M.; Ibrahim, Y.; Hanafi, E.; Barakat, M. Would LEED-UHI greenery and high albedo strategies mitigate climate change at neighborhood scale in Cairo, Egypt? Build. Simul. 2018, 11, 1273–1288. [Google Scholar] [CrossRef]
  41. Huang, X.; Bou-Zeid, E.; Pigliautile, I.; Pisello, A.L.; Mandal, J. Optimizing retro-reflective surfaces to untrap radiation and cool cities. Nat. Cities 2024, 1, 275–285. [Google Scholar] [CrossRef]
  42. Ibrahim, Y.; Kershaw, T.; Shepherd, P.; Coley, D. On the optimisation of urban form design, energy consumption and outdoor thermal comfort using a parametric workflow in a hot arid zone. Energies 2021, 14, 4026. [Google Scholar] [CrossRef]
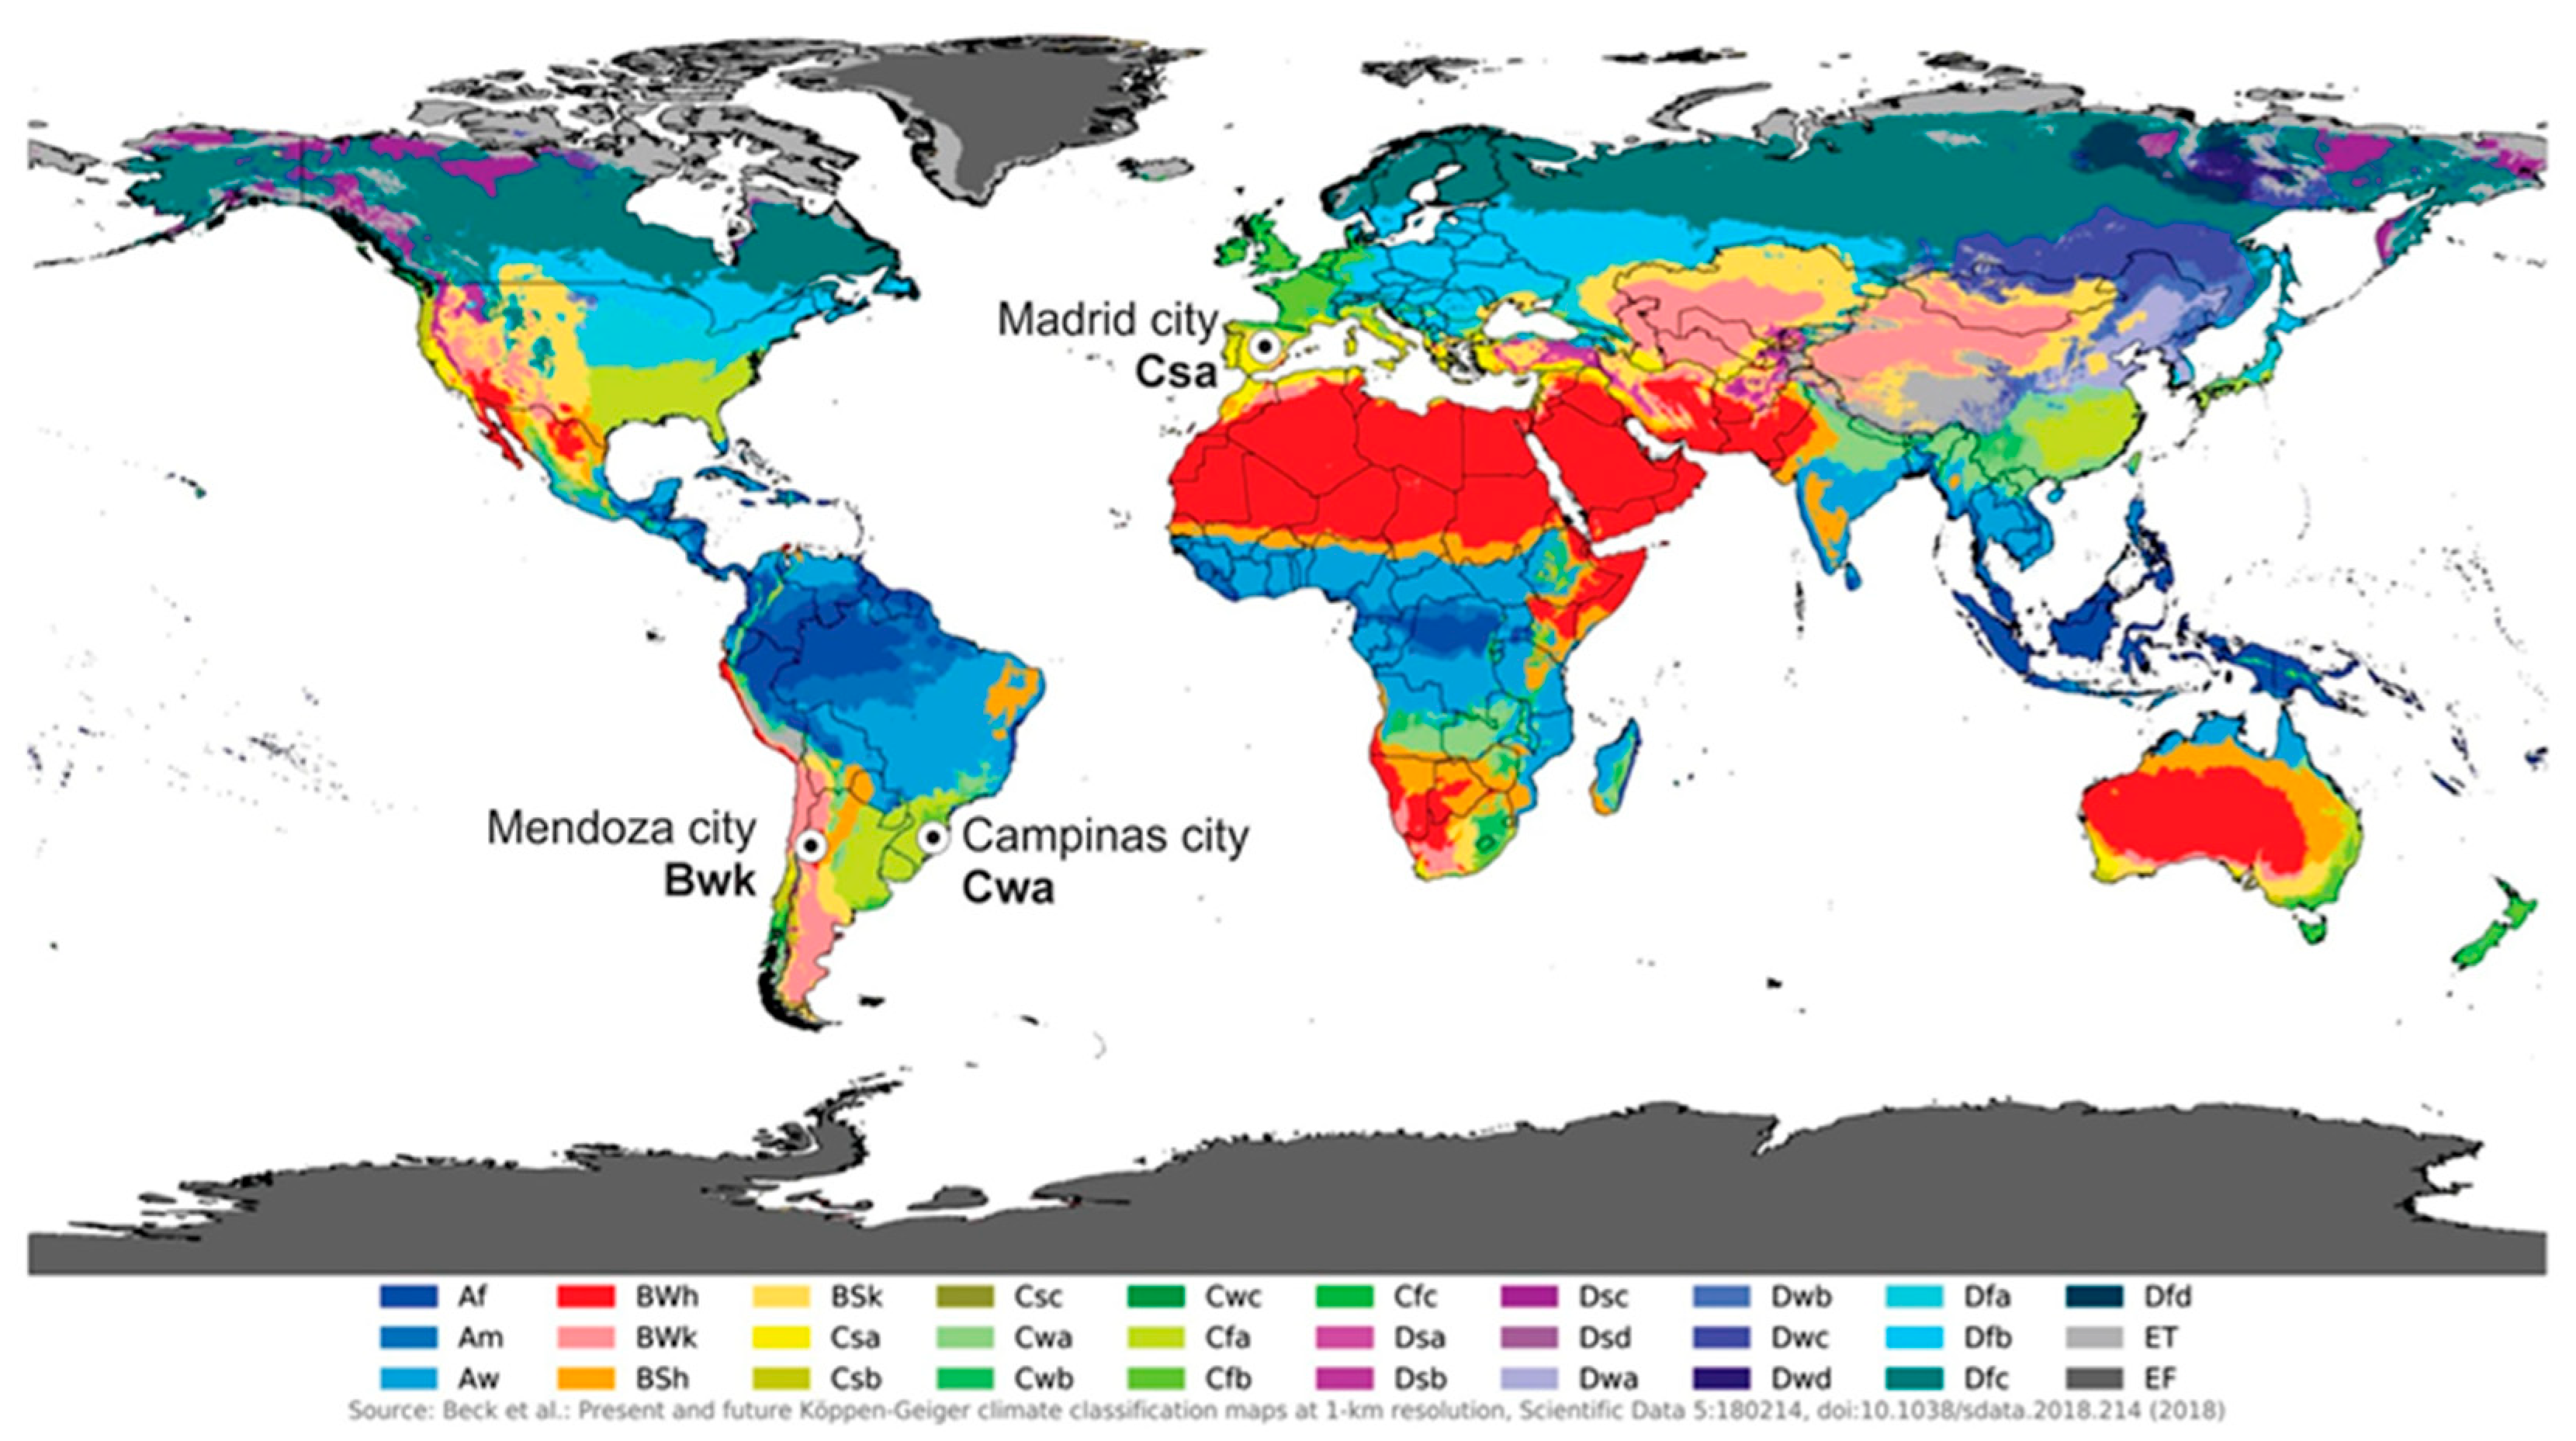
Figure 1. Location of the studied cities—Mendoza (Argentina), Madrid (Spain) and Campinas (Brazil) according to the Köppen climate classification [27].
Urbansci 09 00428 g001
Figure 2. Study area and P1 (data acquisition point/receptor), (a) aerial photographs, (b) study area digitalized with ENVI-met model (black volumes: buildings and green volumes: urban trees). Font: adapted from ENVI-met and Google Earth Pro.
Urbansci 09 00428 g002
Figure 3. Calibration curves for air temperature and relative humidity of the ENVI-met model compared to fixed point. both at point P1.
Urbansci 09 00428 g003
Figure 4. Scatter plot between predicted value (ENVI-met model) and measured value, both at point P1. Statistical calibration metrics: coefficient of determination (R2); mean bias error (MBE); root mean square error (RMSE); mean absolute error (MAE).
Urbansci 09 00428 g004
Figure 5. Study area in the ENVI-met v.5.6 model space with analysis scenario.
Urbansci 09 00428 g005
Figure 6. Heat capacity per m2 of technologies (Ctotal); J/m2·K.
Urbansci 09 00428 g006
Figure 7. Air temperature at pedestrian level at 1.50 m for lightweight (L), traditional (T) technologies and Exterior Thermal Insulation System (S), according to albedo (0.3 and 0.8) for the cities of Mendoza (Men), Madrid (Mad) and Campinas (Cam).
Urbansci 09 00428 g007
Figure 8. Mean radiant temperature at pedestrian level at 1.50 m for lightweight (L), traditional (T) technologies and Exterior Thermal Insulation System (S), according to albedo (0.3 and 0.8) for the cities of Mendoza (Men), Madrid (Mad) and Campinas (Cam).
Urbansci 09 00428 g008
Figure 9. Universal thermal climate index at 1.50 m for lightweight (L), traditional (T) technologies and Exterior Thermal Insulation System (S), according to albedo (0.3 and 0.8) for the cities of Mendoza (Men), Madrid (Mad) and Campinas (Cam).
Urbansci 09 00428 g009
Figure 10. Daily percentage of hours within the very strong heat stress category (above 38 °C) according to the Universal Thermal Climate Index (UTCI) in the three cities studied (Mendoza, Madrid, Campinas), differentiated by façade scenarios: lightweight (L), traditional (T), and ETIC system (S), and by albedo levels: 0.3 and 0.8. Dotted box: It is highlighting the most effective technologies for the three analyzed climates.
Urbansci 09 00428 g010
Table 1. Geographic and Climatic Conditions of the Evaluated Cities.
CharacteristicsMendoza, ArgentinaMadrid, SpainCampinas, Brazil
Location32.86° S; 68.86° W
750 m a.s.l.
40.42° N; −3.70° E
680 m a.s.l.
22.53° S, 47.04° W
680 m a.s.l.
Population2,043,540 hab.3,460,491 hab.1,139,047 hab.
Climate according to Köppen classification [27].Desert with cold steppe, BWkTypical Mediterranean, CsaWarm temperate with dry winters and hot summers, Cwa
Maximum daily horizontal global radiation 1117 W/m21011 W/m21020 W/m2
Mean wind speed (height: 10 m)2.18 m/s (south)2.61 m/s (south)2.2 m/s (southeast)
Annual mean temperature16.79 °C14.72 °C22.5 °C
Average minimum temperatures−5 °C−7.6 °C12.4 °C
Average maximum temperatures39 °C40.4 °C32.5 °C
Annual average relative humidity60.32%52.16%69.0%
Annual average accumulated precipitation220 mm435 mm1510 mm
Table 2. Input Data for the ENVI-met v.5.6 Model.
ParametersMendoza
(February)
Madrid
(August)
Campinas
(February)
Average air temperature; °C30.729.825.9
Maximum air temperature; °C40.138.831.4
Minimum air temperature; °C22.923.020.2
Thermal amplitude; °C17.215.811.2
Average relative humidity; %29.032.379.0
Average wind speed; m/seg5.03.61.7
Maximum global solar radiation; W/m210171011941
Table 3. Proposed scenarios for each of the three cities studied.
CityIDTechnology
Lightweight
(L)
Traditional
(T)
ETIC System
(S)
MendozaLow AlbedoMen_L0.3Men_T0.3Men_S0.3
High AlbedoMen_L0.8Men_T0.8Men_S0.8
MadridLow AlbedoMad_L0.3Mad_T0.3Mad_S0.3
High AlbedoMad_L0.8Mad_T0.8Mad_S0.8
CampinasLow AlbedoCam_L0.3Cam_T0.3Cam_S0.3
High AlbedoCam_L0.8Cam_T0.8Cam_S0.8
Table 4. Thermal and radiative properties according to construction technology.
Traditional Technology (T)—Thickness: 0.18 m
PropertiesStucco ext. Solid BrickStucco Int.
* Thickness (e); meters0.020.140.02
* Specific Heat (c); J/kgK669650669
* Thermal Conductivity; W/mK0.090.440.09
* Density (ρ); Kg/m3192015001920
Albedo0.30/0.80 0.30/0.80
* Emissivity0.900.900.90
Thermal Transmittance of the Component1.07 W/m2K
Lightweight Technology (L)—Thickness: 0.12 m
PropertiesCementitious board ext. Isolant EPSCementitious board int.
* Thickness (e); meters0.0150.090.015
* Specific Heat (c); J/kgK8401500840
* Thermal Conductivity; W/mK0.20.070.2
* Density (ρ); Kg/m3620400620
Albedo0.3/0.8 0.3/0.8
* Emissivity0.94 0.94
Thermal Transmittance of the Component 0.623 W/m2K
Exterior Thermal Insulation System (S)—Thickness: 0.21 m
PropertiesCementitious board ext.Isolant EPSSolid Brick int.
* Thickness (e); meters0.0150.050.14
* Specific Heat (c); J/kgK8401500650
* Thermal Conductivity; W/mK0.20.070.44
* Density (ρ); Kg/m36204001500
Albedo0.3/0.8 0.3/0.8
* Emissivity0.94 0.9
Thermal Transmittance of the Component0.782 W/m2K
* Default values. ENVI-met v.5.6 material library.
Table 5. Heat capacity per m2 of technologies (Ctotal); J/m2·K, according to construction technology.
TechnologyLayere; mρ; kg/m3c; J/kg·KCi; J/m2·K
Traditional (T)Exterior Stucco0.02192066925,670
Solid Brick0.141500650136,500
Interior Stucco0.02192066925,670
Ctotal 0.18 187,840
Lightweight (L)Exterior Cementitious Board0.0156208407812
EPS Insulation0.09400150054,000
Interior Cementitious Board0.0156208407812
Ctotal 0.12 69,624
Exterior Thermal Insulation Systems (S)Exterior Cementitious Board0.0156208407812
EPS Insulation0.05400150030,000
Interior Solid Brick0.141500650136,500
Ctotal 0.21 174,312
Table 6. Air temperature (AT) and mean radiant temperature (MRT) at 1.5 m height for the analyzed scenarios in the three cities.
ScenariosAT; °CMRT; °C
AverageMaximumMinimumAverageMaximumMinimum
MendozaMen_L0.330.937.5723.8934.1469.3320.33
Men_T0.330.4636.6823.9232.1564.8720.15
Men_S0.330.5836.9923.8932.8166.2920.28
Men_L0.830.573723.8735.3272.1820.2
Men_T0.830.4136.5723.9334.6970.9620.21
Men_S0.830.5336.8923.8935.1871.9720.28
MadridMad_L0.330.0637.2224.0133.1569.5120.9
Mad_T0.329.7236.4124.0231.6564.9820.31
Mad_S0.329.8336.7123.9932.1567.0520.45
Mad_L0.829.8536.7723.9934.5172.7620.26
Mad_T0.829.7236.4124.0334.0270.3120.33
Mad_S0.829.8336.7123.9934.3872.6120.45
CampinasCam_L0.326.7632.4321.3531.9965.7218.22
Cam_T0.326.3831.2321.4830.1262.3318.36
Cam_S0.326.4831.721.3730.9862.8718.28
Cam_L0.826.4231.5121.3833.2169.3418.29
Cam_T0.826.2931.1221.4932.3868.8318.38
Cam_S0.826.3831.4921.3733.0669.1818.28
Color scale:
Urbansci 09 00428 i001
Table 7. Distribution of mean radiant temperature for 18 analyzed scenarios at 15:00.
Urbansci 09 00428 i002Mendoza–ArgentinaUrbansci 09 00428 i003Madrid–SpainUrbansci 09 00428 i004Campinas–Brazil
Men_T0.3
Urbansci 09 00428 i005
Urbansci 09 00428 i006Mad_T0.3
Urbansci 09 00428 i007
Urbansci 09 00428 i008Camp_T0.3
Urbansci 09 00428 i009
Urbansci 09 00428 i010
Men_T0.8
Urbansci 09 00428 i011
Urbansci 09 00428 i012Mad_T0.8
Urbansci 09 00428 i013
Urbansci 09 00428 i014Camp_T0.3
Urbansci 09 00428 i015
Urbansci 09 00428 i016
Men_L0.3
Urbansci 09 00428 i017
Urbansci 09 00428 i018Mad_L0.3
Urbansci 09 00428 i019
Urbansci 09 00428 i020Camp_L0.3
Urbansci 09 00428 i021
Urbansci 09 00428 i022
Men_L0.8
Urbansci 09 00428 i023
Urbansci 09 00428 i024Mad_L0.8
Urbansci 09 00428 i025
Urbansci 09 00428 i026Camp_L0.8
Urbansci 09 00428 i027
Urbansci 09 00428 i028
Men_S0.3
Urbansci 09 00428 i029
Urbansci 09 00428 i030Mad_S0.3
Urbansci 09 00428 i031
Urbansci 09 00428 i032Camp_S0.3
Urbansci 09 00428 i033
Urbansci 09 00428 i034
Men_S0.8
Urbansci 09 00428 i035
Urbansci 09 00428 i036Mad_S0.8
Urbansci 09 00428 i037
Urbansci 09 00428 i038Camp_S0.8
Urbansci 09 00428 i039
Urbansci 09 00428 i040
Disclaimer/Publisher’s Note: The statements, opinions and data contained in all publications are solely those of the individual author(s) and contributor(s) and not of MDPI and/or the editor(s). MDPI and/or the editor(s) disclaim responsibility for any injury to people or property resulting from any ideas, methods, instructions or products referred to in the content.