Article

Socio-Economical Analysis of a Green Reverse Logistics Network under Uncertainty: A Case Study of Hospital Constructions

by
Alireza Alibakhshi
1,
Amirreza Saffarian
2 and
Erfan Hassannayebi
1,*
1
Industrial Engineering Department, Sharif University of Technology, Tehran 15119-43943, Iran
2
Industrial and Systems Engineering Department, University of Florida, 303 Weil Hall, P.O. Box 116595, Gainesville, FL 32603, USA
*
Author to whom correspondence should be addressed.
Urban Sci. 2024, 8(4), 171; https://doi.org/10.3390/urbansci8040171
Submission received: 23 August 2024 / Revised: 29 September 2024 / Accepted: 8 October 2024 / Published: 11 October 2024
(This article belongs to the Special Issue Sustainable Transportation and Urban Environments-Public Health)

Abstract

:
This study addresses the critical issue of managing construction and demolition waste in urban environments. Effective waste management is not only essential for minimizing costs but also for enhancing sustainability and reducing environmental impact. In this context, the research introduces a green reverse logistics model designed for C&D waste management, integrating both sustainability considerations and current regulatory frameworks, such as LEED. A key innovation of this model is the incorporation of electric vehicles for waste collection, compared to traditional diesel vehicles, as part of the logistical process, as carbon emission is a significant concern. By evaluating the limitations and opportunities associated with electric vehicles, alongside robust optimization to manage uncertainties in waste collection, the model seeks to balance environmental, social, and economic objectives. It further incorporates decision-making tools like fuzzy logic to optimize multi-objective outcomes across various waste facilities, including separation labs, incineration centers, recycling centers, and landfills. A case study conducted in Tehran validates the model, highlighting the socio-economic and environmental benefits of using electric vehicles in waste collection. Sensitivity analysis indicates that hybrid and socially focused policies perform best under high-impact scenarios, although results can differ with varying data sets. Despite the complexity of managing reverse logistics networks, this research provides valuable insights for supply chain planners. It suggests potential future directions, such as the application of metaheuristic algorithms and improved stochastic planning methods.

1. Introduction

The new urban lifestyle has led to the mass construction of buildings, particularly skyscrapers, marking a new era for construction and construction management. With this change in construction style, it is important to consider the management of waste from demolition and construction activities, as millions of tons of solid waste will be produced worldwide. In 2014, China produced 1130 million tons of construction waste, ranking as the top global generator. The United States generated 534 million tons of construction waste in the same year, including building activities, road and bridge construction, and other construction activities [1]. Dealing with construction and destruction wastes depends heavily on the type of material they contain. According to [2], construction and demolition waste pertains to materials or by-products resulting from the construction process, produced due to non-compliance with specifications, non-utilization or excessive use of resources, and damage to resources and infrastructure. Dealing with these kinds of materials requires different strategies. For solid waste, some non-hazardous materials can be buried in landfills, while others should be incinerated. In modern waste management, there are different policies around the world on how to treat solid waste. There are several approaches around the world established to deal with construction and demolition wastes. In 2017, Umar et al. conducted a study focusing on active policies for construction and demolition waste management [3]. In this research, we analyzed various policies from around the world and found that one of the most effective approaches is to minimize waste at construction sites and reuse materials whenever possible. However, some may argue that this policy is unrealistic enough to significantly reduce waste, as operational costs may exceed regular operations when focusing on waste minimization. The policies also sought efficient ways to manage landfills and waste transportation to promote sustainable construction practices [4,5]. In order to manage waste at construction sites, various techniques can be employed. Thermal treatment is used to efficiently remove chlorine and organics, while stabilization is used for cement disposal and stabilization. Separation and landfilling can be employed for recycling and direct disposal, respectively [6]. Separation centers play a pivotal role in the waste management of construction sites. They are capable of processing a huge number of wastes and determining whether they are recyclable. Furthermore, these centers have an important role in identifying hazardous materials and separating them from non-hazardous ones [7]. As the importance of efficient waste management for constructional sites is comprehended, there is another side to the story of waste management: the environmental impact of each policy. The key aspect of every waste disposal process is the vehicle used to transport the waste and the amount of carbon emissions produced by it. In today’s urbanized world, carbon footprint is a significant concern for environmental researchers. This concern primarily focuses on trucks and other vehicles that rely on fossil fuels for operation. This is when the advancement of electric vehicles will answer most concerns [8].
Electric vehicles have gained a lot of attention recently due to their ability to reduce carbon dioxide emissions produced by diesel cars and trucks. The first prototype of the electric-powered vehicles was introduced in 1832 by Anderson [9]. Greenhouse gas (GHG) emissions are projected to double in the following years if current policies remain unchanged, with transportation vehicles being a major source of GHGs [10]. Electric vehicles are receiving significant attention for further development through governmental policies such as tax reductions, budget allocations, and resource allocations to encourage manufacturers and users to choose electric vehicles over diesel cars. Electric vehicles have some limitations when used for transportation. Because they rely on batteries for operation, their range and the availability of charging stations are significantly lower than that of diesel vehicles. This is one of the main reasons why, despite recent advances, diesel vehicles are still preferred [11].
The problems related to supply chain and reverse logistics are the kind of issues that can assist industries in dealing with transportation, inventory complexities, and decision making. The term “Supply Chain” (SC) was first used in a study in 1983 by Oliver et al. [12]. Since then, researchers have been working on designing optimized supply chains to address existing concerns. There are two main categories of supply chain problems: deterministic supply chain management and stochastic supply chain management. Stochastic supply chain management is used when researchers want to mathematically model their supply chain flows in an uncertain way to be closer to the real-world situation [13]. In stochastic supply chain management, there is always room for improvement and consideration of new uncertain variables. In construction sites, the problem of transporting and dealing with waste is not deterministic, and several factors can make this process uncertain. For instance, it is never certain how much material can be collected from each site during construction and demolition. Dealing with uncertainties can be addressed using various solutions such as robust optimization and scenario-based modeling. All of these solutions can factor in uncertain events in our models.
Nowadays, SC models have improved to include multiple objectives and optimize them all at once. For instance, common objectives include minimizing the cost of the operation and unit for each SC model. This objective is widely used in research. Researchers have also started adding more objectives related to sustainability and social impacts due to the nature of the problem. However, adding these objectives can make the problem more difficult, as they do not have the same metrics and cannot be optimized together. In 1970, Bellman et al. were the first to apply fuzzy environments in decision-making to address problems with unclear boundaries. Fuzzy environments and multi-objective decision-making (MODM) can be valuable tools for researchers to solve such problems [14].
The management of C&D waste in urban areas presents significant challenges, particularly in balancing environmental, economic, and logistical concerns. Despite the implementation of waste management policies, urban centers continue to face difficulties in minimizing the environmental impact of waste collection and disposal. One of the primary issues is the reliance on diesel-powered vehicles for waste transportation, which increases greenhouse gas emissions and contributes to urban pollution. To address both environmental and economic objectives, recycling plays a crucial role in the waste management process. However, effective recycling requires specialized centers or labs to accurately assess the recyclability and safety of waste materials. Establishing these facilities would improve the efficiency and reliability of waste management planning, enabling more sustainable outcomes. In this research, a new green supply chain model based on the latest waste management policies at construction sites, such as LEED (leadership in environmental design and green building policy), is proposed. LEED is a globally recognized certification system that promotes sustainability in building design, construction, and operation. LEED provides a framework for creating healthy and environmentally responsible buildings. In the context of construction and demolition waste management, LEED encourages the reduction, reuse, and recycling of materials to minimize landfill contributions and lower carbon footprints. Incorporating LEED principles into waste management strategies not only aligns with environmental goals but also supports long-term sustainability in the construction industry [15]. This model focuses on reverse logistics and examines the environmental impact of using electric vehicles compared to traditional diesel vehicles for waste collection. As mentioned earlier, the model considers the limitations of electric vehicles for transporting waste to the centers. Additionally, there are uncertainties regarding the amount of waste collected from each site, and a robust formulation is used to address these uncertainties. This paper makes the following contributions:
  • Designing a novel reverse logistics model under uncertainty that includes separation labs, incineration centers, recycling centers, and landfills.
  • Using robust formulation to deal with uncertain constraints.
  • Optimizing environmental and social impacts as well as economic aspects.
  • Solving the problem in a fuzzy environment to analyze the importance of each factor.
  • Analyzing the impact and disparity of using electric vehicles versus diesel in environmental and economic aspects.
  • Focusing on LEED policies for the recycling of construction and demolition wastes and incorporating them into the mathematical modeling.
  • Conducting a case study of constructional waste management in Tehran.
  • Conducting a socio-economical analysis with respect to the environmental aspects to choose the best strategy and scenario.
The rest of the paper is structured as follows: the literature on green supply chains is reviewed in Section 2. Then, the mathematical formulation and methodology of the paper are explained in Section 3. Section 4 provides numerical results of the proposed model in a case study in Tehran, and in Section 5, the results are discussed, and managerial insights are mentioned. Also, potential future research is mentioned in Section 5.

2. Literature Review

This section covers two main ideas. First, it explores the existing literature on supply chain management and green supply chain management. Then, it delves into the existing literature on electric vehicles and their role in transportation and logistics, especially in waste management. Table 1 compares this paper to the closest literature in C&D waste management, and the literature on sustainable supply chains and the use of electric vehicles in the supply chain will be scrutinized in the following subsections.

2.1. Reverse Logistics, Supply Chain Management, and Sustainability

In the last decade, numerous researchers have worked on the sustainability of supply chain network design, considering various aspects and factors of context-based supply chains to optimize the network. Akçalı et al. conducted a literature review paper on reverse logistics up until 2008. They scrutinized the methodological contributions and new characteristics observed in reverse logistics and closed-loop supply chain networks [24]. In 2009, Seuring and Müller conducted a comprehensive review of sustainable supply chain management literature, analyzing 191 papers published between 1994 and 2007. The authors observed that most research is concentrated on environmental or “green” issues, with limited attention to the social dimension and the integration of all three pillars of sustainability: economic, environmental, and social [25]. In 2010, Nagurney et al. presented an analytical framework for supply chain network design. In their research, they aimed to minimize the operational and fixed costs of the network, reduce greenhouse gas emissions, and conduct numerical examples to validate their models. This research involved elements of multi-criteria decision-making as well as rigorous modeling [26]. Sarkis et al. explored the strategic role of reverse supply chain logistics in enhancing the reclamation, reuse, and recycling of products at the end of their life cycle, with an emphasis on minimizing landfill use, fuel consumption, and associated costs. While much of the existing research in reverse logistics has focused on economic and environmental sustainability, the social and ethical dimensions remain underexplored. In response to this gap, the authors propose a framework that links social sustainability indicators with reverse logistics practices, providing a comprehensive profile of reverse logistics for social sustainability. By incorporating international case studies, the paper offers practical insights and concludes with recommendations for future research, encouraging a more holistic approach to sustainability in reverse logistics [27]. Pishvaee et al. introduced a new robust optimization framework to address input data uncertainty. They aimed to consider the business potential of the closed-loop supply chain and employed mixed integer linear programming to model the network. The optimization model also factored in transportation costs. Finally, they tested their network using various problem instances of different sizes [28]. In 2012, Pishvaee et al. developed a multi-objective fuzzy optimization network. This time, they took the environmental impacts of the designated supply chain into consideration. The goal of this network was to minimize costs and environmental impacts, such as pollution. The methodology used for this research was life cycle assessment. Finally, a real case study was used to evaluate this sustainable supply chain network [29]. Ramezani et al. offered a comprehensive optimization model that includes both forward and reverse logistics processes and is applicable to a wide range of industries, including electronics, digital equipment, and vehicles. Given the strategic and sensitive nature of logistic network design, which is both time-consuming and costly, the robust optimization approach solves these problems by taking into account a limited number of scenarios to account for uncertainty [30]. In 2014, Zhang et al. used an industrial case study to develop a novel supply chain network in which they included economic, environmental, and social impacts as deciding factors to optimize. For the results, they found out that there is a trade-off between decreasing costs and lead time. For this network, they tried multi-objective optimization, and they prioritized the improvement of environmental performance [31].
Defining key indicators and good decision variables is one of the most important factors for good research. In 2017, Sangwan conducted a novel study to determine good decision variables and indicators for reverse logistics problems. This research proposed locations, capacities, and collection methods as good decision variables and noted that the interactions between activities could be good indicators for these kinds of networks [32]. In 2018, Bal et al. proposed a novel goal-programming approach to solve electronic equipment waste management, considering its legal, economic, environmental, and social aspects. The core aspect of this study was focusing on household appliances and transporting them to recycling centers to extract and reuse the raw materials from them. This paper was the first in the literature to try to consider real conditions and legalization in its optimization model [33]. In an effort to make their work more closely resemble real-world conditions, the researchers aimed to account for uncertainty in mathematical modeling. There are various approaches to optimizing models when dealing with uncertainty. In 2020, Zarbakhshnia et al. developed a network under uncertainty to address the reverse logistics problem characterized by uncertain demands. Their design takes into consideration the environmental and social impacts of optimizing this network. This research was modeled using probabilistic mixed-integer linear programming, and the researchers employed the non-dominated sorting genetic algorithm to solve it [34]. In 2021, a case study was conducted in Slovakia that prioritized the protection of natural resources and the elimination of environmental barriers. This study thoroughly focused on the environmental aspects of reverse logistics in Slovakia, taking into consideration environmental policies and the lack of financial resources [35].
In recent years, the uncertain reverse logistics model for specific industries has gained a lot of attention among researchers. Nowadays, supply chain planners are trying to propose new networks based on specific applications instead of proposing general networks. In 2022, Gholizadeh et al. designed sustainable reverse logistics in the polystyrene appliance industry. They considered the demands and recovery rate to be uncertain and optimized the network with the help of the robust optimization method. Some heuristics were used to solve this problem, such as genetic and simulated annealing. One of the differences between this study and most of the studies in the literature was the use of non-linear programming in their methodology [36]. As of 2024, several researchers have designed innovative networks. For example, Shi et al. designed a network that used electric vehicles to transport kitchen waste. Robust optimization and scenario analysis were used to optimize the capacity of this model [37]. Another study by Najm et al. used robust optimization for electrical reverse logistics in a case study. This multi-objective optimization problem was solved in a fuzzy environment to balance the objective function between social, environmental, and economic aspects [38].

2.2. Electric Vehicles in Green Supply Chain and Logistics Networks

Electric vehicles are one of the essential components of green supply chains and reverse logistics networks as they do not emit any CO2 or any other GHGs. However, these vehicles have always had some drawbacks, such as the significantly lower distance they can cover with one charge compared to diesel cars. There has been a lot of research regarding the use of electric vehicles in reverse logistics and green supply chains. In 2015, Lloyd et al. designed a supply chain network in Tunisia for vaccine delivery with the aim of net-zero power usage. This research addressed scaling and implementation as the challenges for using electric vehicles to transport vaccines [39]. In 2016, Duarte et al. researched alternative solutions in urban mobility and addressed electric vehicles as an effective way to overcome environmental concerns in urban logistics. This research took place in Lisbon and used real data to obtain operational patterns [40]. In 2017, Wątróbski et al. attempted to address urban logistics planning and environmental concerns by implementing a multi-criteria decision-making framework. This study involved ecological footprints and used TOPSIS as the methodology to solve the problem [41].
With the advancement of electric vehicles, an increasing number of researchers are utilizing electric vehicles in their studies to develop more sustainable logistic networks and replace traditional vehicles. Location and vehicle routing problems have always been important for optimizing logistics networks, and in recent years, routing problems involving electric vehicles have gained significant attention. In 2018, Schiffer et al. designed a location routing problem considering the uncertainty of demand and service time windows. In this research, they addressed the criteria for using electric fleets and charging stations [42]. In 2020, Zhao et al. attempted to address the urban cold logistics problem by developing a network and electric vehicle routing system that considers changing traffic conditions. They applied adaptive ant colony metaheuristics optimization to minimize the total distribution cost, improve cold chain logistics performance, and factor in economic and fresh value loss costs [43]. Akram et al. made a significant contribution to the study of battery state changes by considering reverse logistics networks. Their research utilized the Markov chain steady-state census model to analyze reverse logistics processes. The study also examined the economic benefits of recycling and extending battery lifespan [44].
Recently, researchers have been focusing on developing effective policies to encourage business owners to use electric cars. In 2022, Zhao et al. conducted a study on dynamic subsidy policy adjustments using a game model. They proposed feasible management solutions for governments and enterprises to encourage the use of electric vehicles in cold chain logistics [45]. Butt et al. explored the critical role of reverse logistics in advancing the circular economy, emphasizing the need for contemporary business models to integrate social, economic, and environmental objectives. Through a multiple case study approach involving 40 semi-structured interviews with reverse logistics specialists from the four largest retailing firms in the United Arab Emirates (UAE), the study highlights several ways in which reverse logistics contribute to a circular economy [46]. Recent studies have highlighted the importance of mobile renewable energy charging stations in promoting electric vehicle adoption and reducing fossil fuel reliance. A two-stage stochastic programming approach, supported by differential evolutionary (DE) and DE Q-learning (DEQL) algorithms, has proven effective in optimizing the location and management of these stations, with DEQL demonstrating superior performance in reducing operational costs and carbon emissions [47]. In 2024, Li et al. conducted a study where they designed an optimization model for electric vehicles in sustainable logistics. They utilized several meta-heuristics to solve the optimization mathematical model and applied this model in the context of a cold supply chain [48].

3. Problem Definition

The literature review highlighted the recent research focus on C&D waste management. With the current situation of construction sites in big cities, it is essential to design an efficient supply chain network. This research aims to develop a reverse logistics network to efficiently collect and transport construction waste to specialized facilities for sorting into recyclable and non-recyclable materials. In the initial phase of this network, there are multiple construction sites, and trucks and low-capacity vehicles are responsible for collecting waste based on their designated capacity. The vehicles used in this research are assumed to operate using only electric power sources; however, it is important to note that this assumption has some limitations, which are addressed in the MILP formulation.
After collecting and transporting the materials, there are three options for where they can go. The first option is for recyclable materials. These materials will be taken to the recycling center based on the current policy. These policies are effective when the amount of recyclable material exceeds the minimum threshold set by the policy. For example, if 70 percent of the material is recyclable, we can choose policies with a threshold below 70 percent. In addition to these recycling centers, there are two other options for waste disposal: incineration centers and landfills. This model helps to choose between them based on their distances, costs, and capacity. Incineration centers naturally have more capacity than landfills, but their costs are higher. Landfills also have a drawback related to their distance from city laboratories. Distance plays a significant role in our decision-making since we use electric vehicles and trucks.
This research considered the economic, environmental, and social factors in the decision-making process. The economic aspect of this issue is related to the fixed and operational costs of each processing center, as well as the operational costs of electric vehicles and trucks. The environmental impacts, however, have two stages in this research. In the first stage, the power consumption is calculated for transportation, and in the second stage, the model is solved with the assumption and consideration of diesel vehicles. This comparison will show how much the environment can benefit from using electric vehicles. In the later stages of this research, a thorough analysis will be conducted to illustrate uncertainty’s impact on the mathematical formulation’s objective functions. Since this problem involves three main objective functions, the research will employ an interactive fuzzy approach to manage the trade-offs between the decision-makers’ goals. The overall scheme of this research is explained in Figure 1.
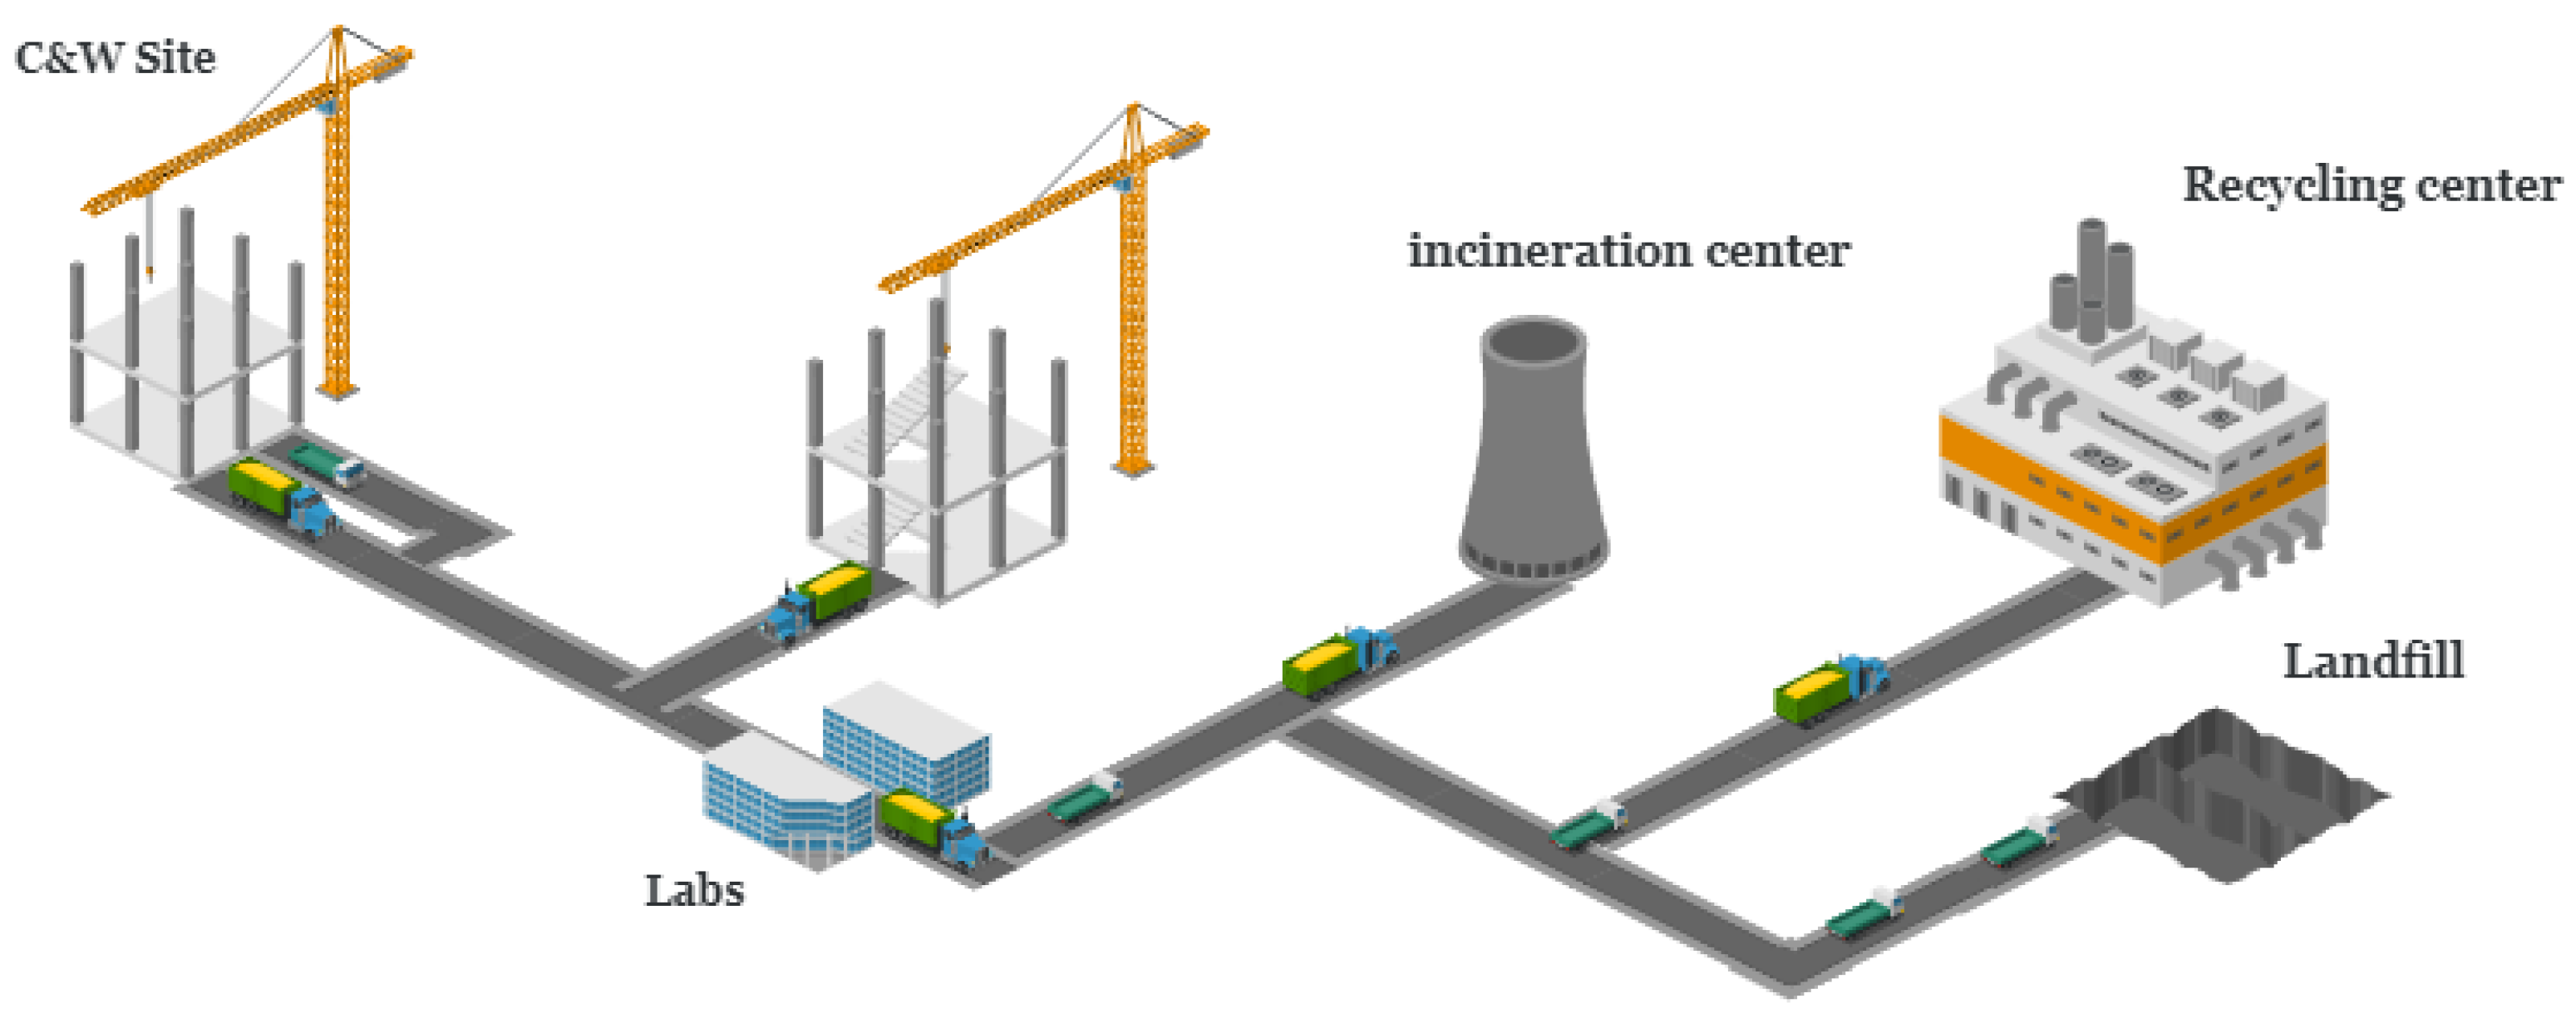
For a better understanding, Figure 2 presents an overview of the reverse logistics. In this reverse logistics network, decision-makers at construction sites and laboratories can use electric vehicles, electric trucks, or a combination of both if the capacity is not exceeded. For example, a construction site could choose to have three electric vehicles and two electric trucks to transport their waste based on the predetermined goals set by objective functions. The uncertainty of this network lies under the collectable wastes generated by each site. Robust reformulation helps to deal with this uncertainty and analyze worst-case scenarios. This section has three main subsections: the first subsection will introduce the parameters, sets, variables, and the mathematical formulation of this problem in an integer linear form. The second section is dedicated to the reformulation of the uncertain constraints based on the robust optimization method. Finally, in the last section, an interactive fuzzy method is introduced to optimize this multi-objective problem.

3.1. Mixed Integer Linear Formulation

In this section, we will present the notations, sets, parameters, and the main mixed integer linear formulation of the reverse logistic network. Table 2 will introduce the sets of the mathematical formulation, Table 3 will introduce the parameters, and Table 4 will introduce the decision variables and their descriptions.
The first objective function will focus on the economic aspects of the reverse logistics network. This objective function will include the fixed and operational costs of each facility, as well as the costs of electric trucks and vehicles. These costs will encompass the following components:
-
The fixed cost of laboratories:
F C O L = l g l × C F L l .
-
The operating cost of laboratories:
U C O L = v l q v l v , l × C U L l .
-
The fixed cost of landfills:
F C O L F = l f h l f × C F L F l f .
-
The operating cost of landfills:
U C O L F = l l f q l f l , l f × C U L F l f .
-
The fixed cost of incineration centers:
F C O I C = i c z i c × C F I C i c .
-
The operating cost of incineration centers:
U C O I C = l i c q l i l , i c × C U I C i c .
-
The fixed cost of recycling centers:
F C O O C = o c o o c × C F O C o c .
-
The operating cost of recycling centers:
U C O O C = l o c q l o l , o c × C U O C o c .
-
The operating cost of electric vehicles responsible for transporting the waste from construction sites to laboratories:
U C O E V L = v l n l e v v , l × T C E V × T D V v , l .
-
The operating cost of electric trucks responsible for transporting the waste from construction sites to laboratories:
U C O E T L = v l n l e t v , l × T C E T × T D V v , l .
-
The operating cost of electric vehicles responsible for transporting the waste from laboratories to landfills:
U C O E V L F = l l f n l f e v l , l f × T C E V × T D L F l , l f .
-
The operating cost of electric trucks responsible for transporting the waste from laboratories to landfills:
U C O E T L F = l l f n l f e t l , l f × T C E T × T D L F l , l f .
-
The operating cost of electric vehicles responsible for transporting the waste from laboratories to incineration centers:
U C O E V I C = l i c n i c e v l , i c × T C E V × T D L I l , i c .
-
The operating cost of electric trucks responsible for transporting the waste from laboratories to incineration centers:
U C O E T I C = l i c n i c e t l , i c × T C E T × T D L I l , i c .
-
The operating cost of electric vehicles responsible for transporting the waste from laboratories to recycling centers:
U C O E V O C = l o c n o c e v l , o c × T C E V × T D L O l , o c .
-
The operating cost of electric trucks responsible for transporting the waste from laboratories to recycling centers:
U C O E T O C = l o c n o c e t l , o c × T C E T × T D L O l , o c .
The first objective function containing the mentioned components is as follows:
M i n Z 1 = F C O L + U C O L + F C O L F + U C O L F + F C O I C + U C O I C + F C O O C + U C O O C + U C O E V L + U C O E T L + U C O E V L F + U C O E T L F +              U C O E V I C + U C O E T I C + U C O E V O C + U C O E T O C .
The second objective function focuses more on the power consumption of electric vehicles and trucks and aims to minimize them. this objective function contains the following components:
-
The power consumed by electric vehicles from C&W sites to laboratories:
E V L = v l n l e v v , l × T D V v , l × V E C S .
-
The power consumed by electric trucks from C&W sites to laboratories:
E T L = v l n l e t v , l × T D V v , l × T E C S .
-
The power consumed by electric vehicles from laboratories to landfills:
E V L F = l l f n l f e v l , l f × T D L F l , l f × V E C S .
-
The power consumed by electric trucks from laboratories to landfills:
E T L F = l l f n l f e t l , l f × T D L F l , l f × T E C S .
-
The power consumed by electric vehicles from laboratories to incineration centers:
E V I C = l i c n i c e v l , i c × T D L I l , i c × V E C S .
-
The power consumed by electric trucks from laboratories to incineration centers:
E T I C = l i c n i c e t l , i c × T D L I l , i c × T E C S .
-
The power consumed by electric vehicles from laboratories to recycling centers:
E V O C = l o c n o c e v l , o c × T D L O l , o c × V E C S .
-
The power consumed by electric trucks from laboratories to recycling centers:
E T O C = l o c n o c e t l , o c × T D L O l , o c × T E C S .
Considering the mentioned components, the second objective function aims to minimize power consumption by the following equation:
M i n Z 2 = E V L + E T L + E V L F + E T L F + E V I C + E T I C + E V O C + E T O C .
The third objective function takes into account social factors and aims to maximize employment using each center or lab. This objective function is as follows:
M a x Z 3 = l g l × E R L l + l f h l f × E R L F l f + i c z i c × E R I i c + o c o o c × E R O o c .
The first and second objective functions were minimizing power consumption and costs for this reverse logistics model, while the third aimed to maximize the social impacts and employment of the local people. These objective functions are subjected to the following constraints:
W G v = v l q v l v , l ; v ,
α × ( l l   f q l f l , l   f + l i c q l i l , i c ) θ × l o c q l o l , o c ,
v q v l v , l = l f q l f l , l f + i c q l i l , i c + o c q l o l , o c ; l ,
v q v l v , l L C l × g l ; l ,
l q l f l , l f L F C l f × h l f ; l f ,
l q l i l , i c I C C i c × z i c ; i c ,
n l e v v , l × E V C + n l e t v , l × E T C q v l v , l ; v , l ,
n l f e v l , l f × E V C + n l f e t l , l f × E T C q l f l , l f ; l , l f ,
n i c e v l , i c × E V C + n i c e t l , i c × E T C q l i l , i c ; l , i c ,
n o c e v l , o c × E V C + n o c e t l , o c × E T C q l o l , o c ; l , o c ,
n l e v v , l × ( T D V v , l L E V ) 0 ; v , l ,
n l e t v , l × ( T D V v , l L E T ) 0 ; v , l ,
n l f e v l , l f × ( T D L F l , l   f L E V ) 0 ; l , l f ,
n l f e t l , l f × ( T D L F l , l   f L E T ) 0 ; l , l f ,
n i c e v l , i c × ( T D L I l , i c L E V ) 0 ; l , i c ,
n i c e t l , i c × ( T D L I l , i c L E T ) 0 ; l , i c ,
n o c e v l , o c × ( T D L O l , o c L E V ) 0 ; l , o c ,
n o c e t l , o c × ( T D L O l , o c L E T ) 0 ; l , o c ,
v l n l e v v , l + l l f n l f e v l , l f + l i c n i c e v l , i c + l o c n o c e v l , o c L I M V ,
v l n l e t v , l + l l f n l f e t l , l f + l i c n i c e t l , i c + l o c n o c e t l , o c L I M T ,
g l , h l f , z i c , o o c { 0 , 1 } ,
q v l v , l , q l f l , l f , q l i l , i c , q l o l , o c 0 ,
n l e v v , l , n l e t v , l , n l f e v l , l f , n l f e t l , l f n i c e v l , i c , n i c e t l , i c , n o c e v l , o c , n o c e t l , o c N .
Constraint (28) ensures that all of the generated waste will be transferred into the labs. This constraint will be reformulated in the robust optimization reformulation to take into account the uncertainty of collectible wastes. Constraint (29) ensures that based on the selected policy, the proportion of wastes to be recycled will be determined. The inflow and outflow of this network will be controlled by constraint (30). Constraints (31)–(33) take into account the capacity constraint on each facility. As one of the assumptions in this network, the recycling center does not have a determined capacity. Constraints (33)–(37) ensure that the material transferred between the facilities is distributed between trucks and vehicles in a way that their capacity is not exceeded. As mentioned in the previous sections, electric vehicles have limitations regarding the distance they can cover; therefore, constraints (38)–(45) ensure that every electric truck and vehicle only cover the distance they can. In that way, some of the roads between facilities cannot be covered by certain vehicles. Constraints (46) and (47) are responsible for making sure this model uses cars and trucks according to the number of cars and trucks available.

3.2. Robust Formulation

In this problem, there is uncertainty at each construction site. The waste generated by each construction site has a certain rate of collectibility. Since there are no accurate measurements to determine this rate of collectibility, a robust formulation can be the appropriate approach to consider the uncertainty in this problem. For this formulation, this research will utilize the Bartimas and Sim method [49] in the robust formulation. In order to reformulate this problem, the rate of collectibility, γ , is introduced. γ is a number between 0 and 1 and will be used in the first constraint. As γ is uncertain, the baseline method for the reformulation suggested that this parameter can be in the interval of [ γ σ ^ , γ + σ ^ ] , where σ ^ is the deviation from γ and will take into account the uncertainty of the parameter γ . In addition to γ , this reformulation technique needs two auxiliary variables as well. P and Z are the auxiliary variables.
Considering this reformulation technique, the constraint (28) can be reformulated as follows:
W G v × ( γ v + P v + Z v Γ ) l q v l v , l ; v ,
P v + Z v σ ^ .

3.3. Interactive Fuzzy Optimization

As discussed in Section 3, there are three objective functions that need to be optimized. The decision-making process can be made easier using interactive fuzzy optimization methods for multi-objective optimization. Managers or supply chain planners can define the importance of each objective in relation to other objectives and then optimize this reverse logistics problem. One of the most common approaches in interactive fuzzy optimization is the TH interactive fuzzy method [50]. In this method, the planner will directly determine the degree of satisfaction for each objective function.
The first step of this fuzzy approach entails finding the positive ideal solution for each objective function. This is shown with the symbol Z P I S . The Z P I S for our objective functions are calculated using the following equation:
Z 1 P I S = M I N Z 1 ; Z 2 P I S = M I N Z 2 ; Z 3 P I S = M A X Z 3 .
In addition to the PIS, a negative ideal solution (NIS) should be calculated as well. This can be achieved by solving each MILP problem, but as these calculations are time-consuming and computational costs are high, the estimation of NIS using PIS is an effective way to deal with this situation. The related NIS can be estimated as follows:
Z h N I S = M A X k = 1 , 2 , 3 { Z h ( v k * ) } ; h = 1 , 2 ,
Z h N I S = M I N k = 1 , 2 , 3 { Z h ( v k * ) } ; h = 3 .
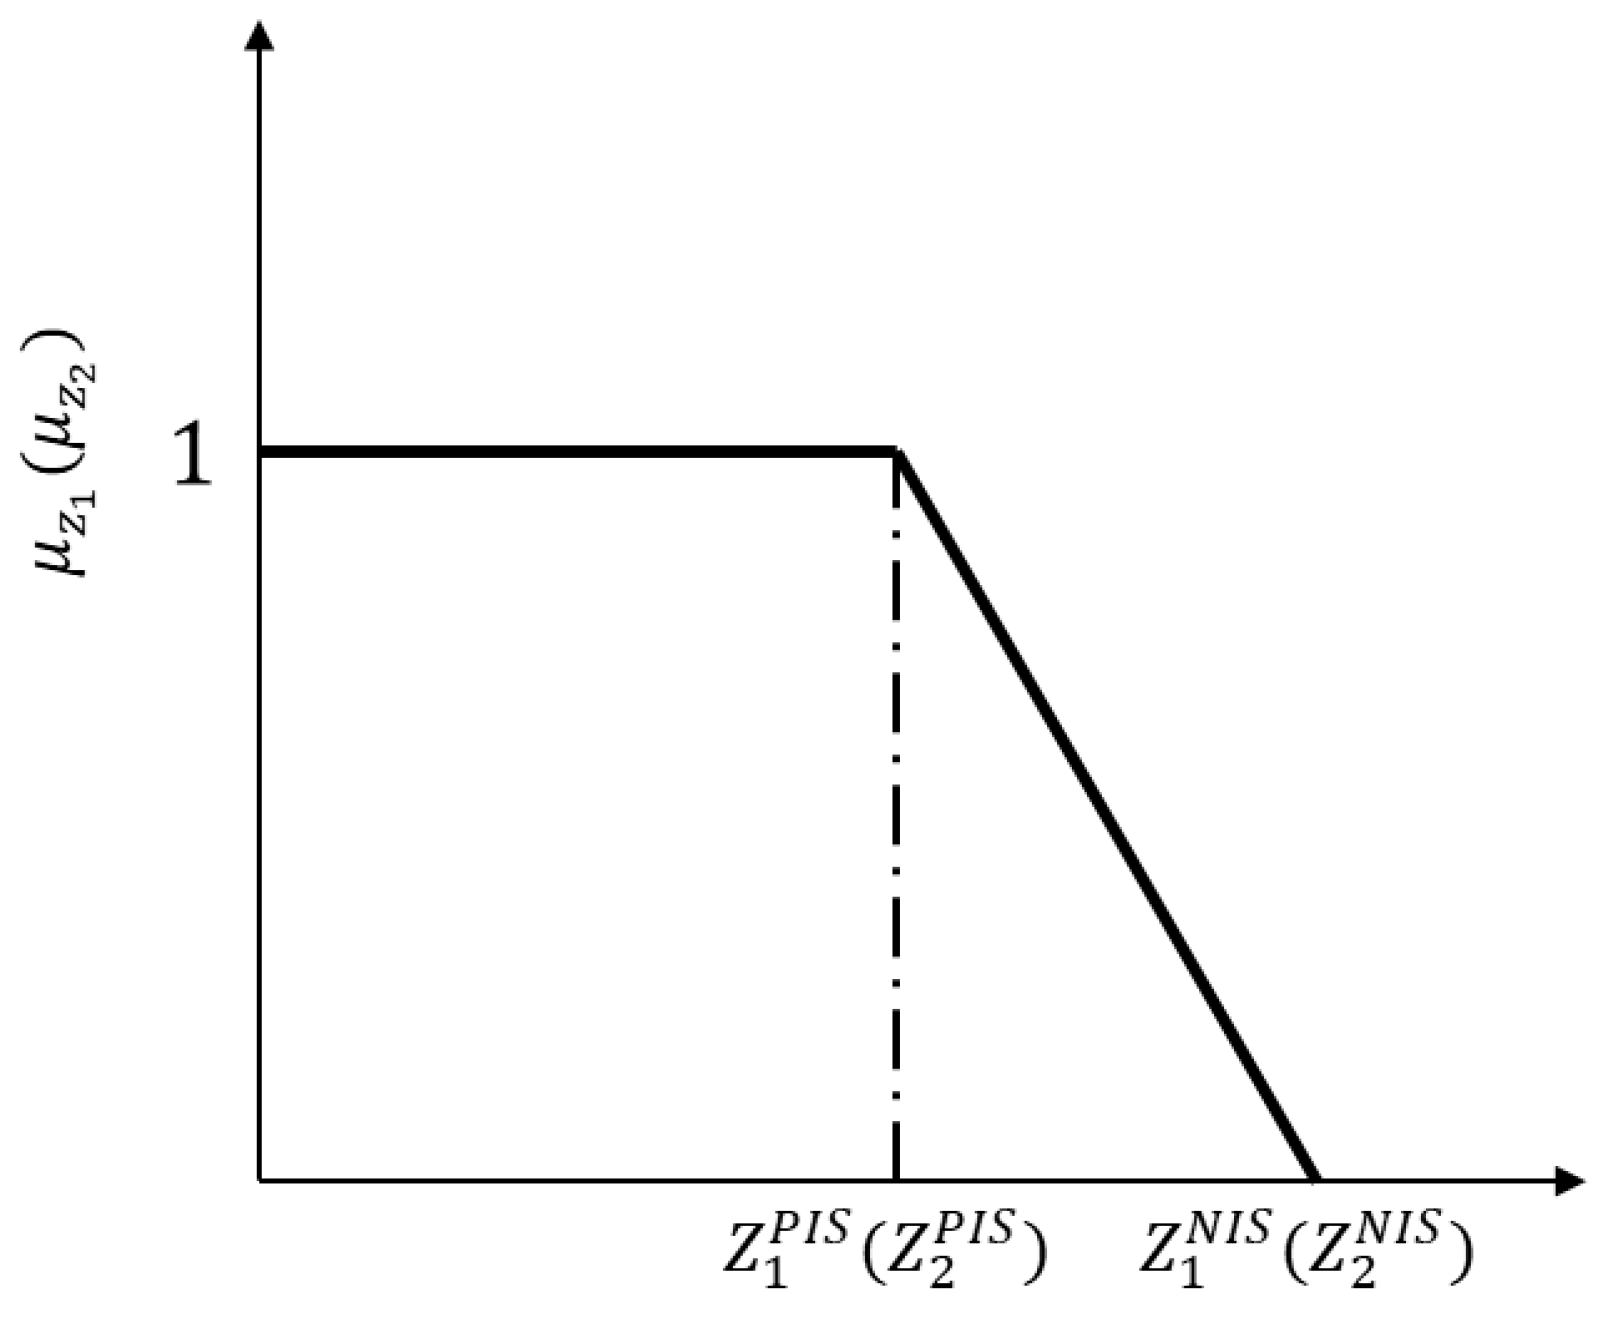
After determining the NIS and PIS for each objective function, the linear membership function for each objective function is determined. Figure 3 and Figure 4 are the illustrations of this membership function.
μ 1 ( x ) = 0 , if Z 1 Z 1 P I S Z 1 N I S Z 1 Z 1 N I S Z 1 P I S , if Z 1 P I S Z 1 Z 1 N I S 1 , if Z 1 Z 1 N I S ,
μ 2 ( x ) = 0 , if Z 2 Z 2 P I S Z 2 N I S Z 2 Z 2 N I S Z 2 P I S , if Z 2 P I S Z 2 Z 2 N I S 1 , if Z 2 Z 2 N I S ,
μ 3 ( x ) = 0 , if Z 3 Z 3 P I S Z 3 Z 3 N I S Z 3 P I S Z 3 N I S , if Z 3 N I S Z 2 Z 3 P I S 1 , if Z 3 Z 3 N I S .
At the final stage of this interactive fuzzy approach, the auxiliary multi-objective MILP model is transformed into an equivalent single-objective MILP using the following new auxiliary formulation.
m a x λ ( v ) = γ λ 0 + ( 1 γ ) h θ h μ h ( v )
s . t λ 0 μ h ( v ) , h = 1 , 2 , 3
v F ( v ) , λ 0 a n d γ [ 0 , 1 ] .

3.4. Tehran Case Study

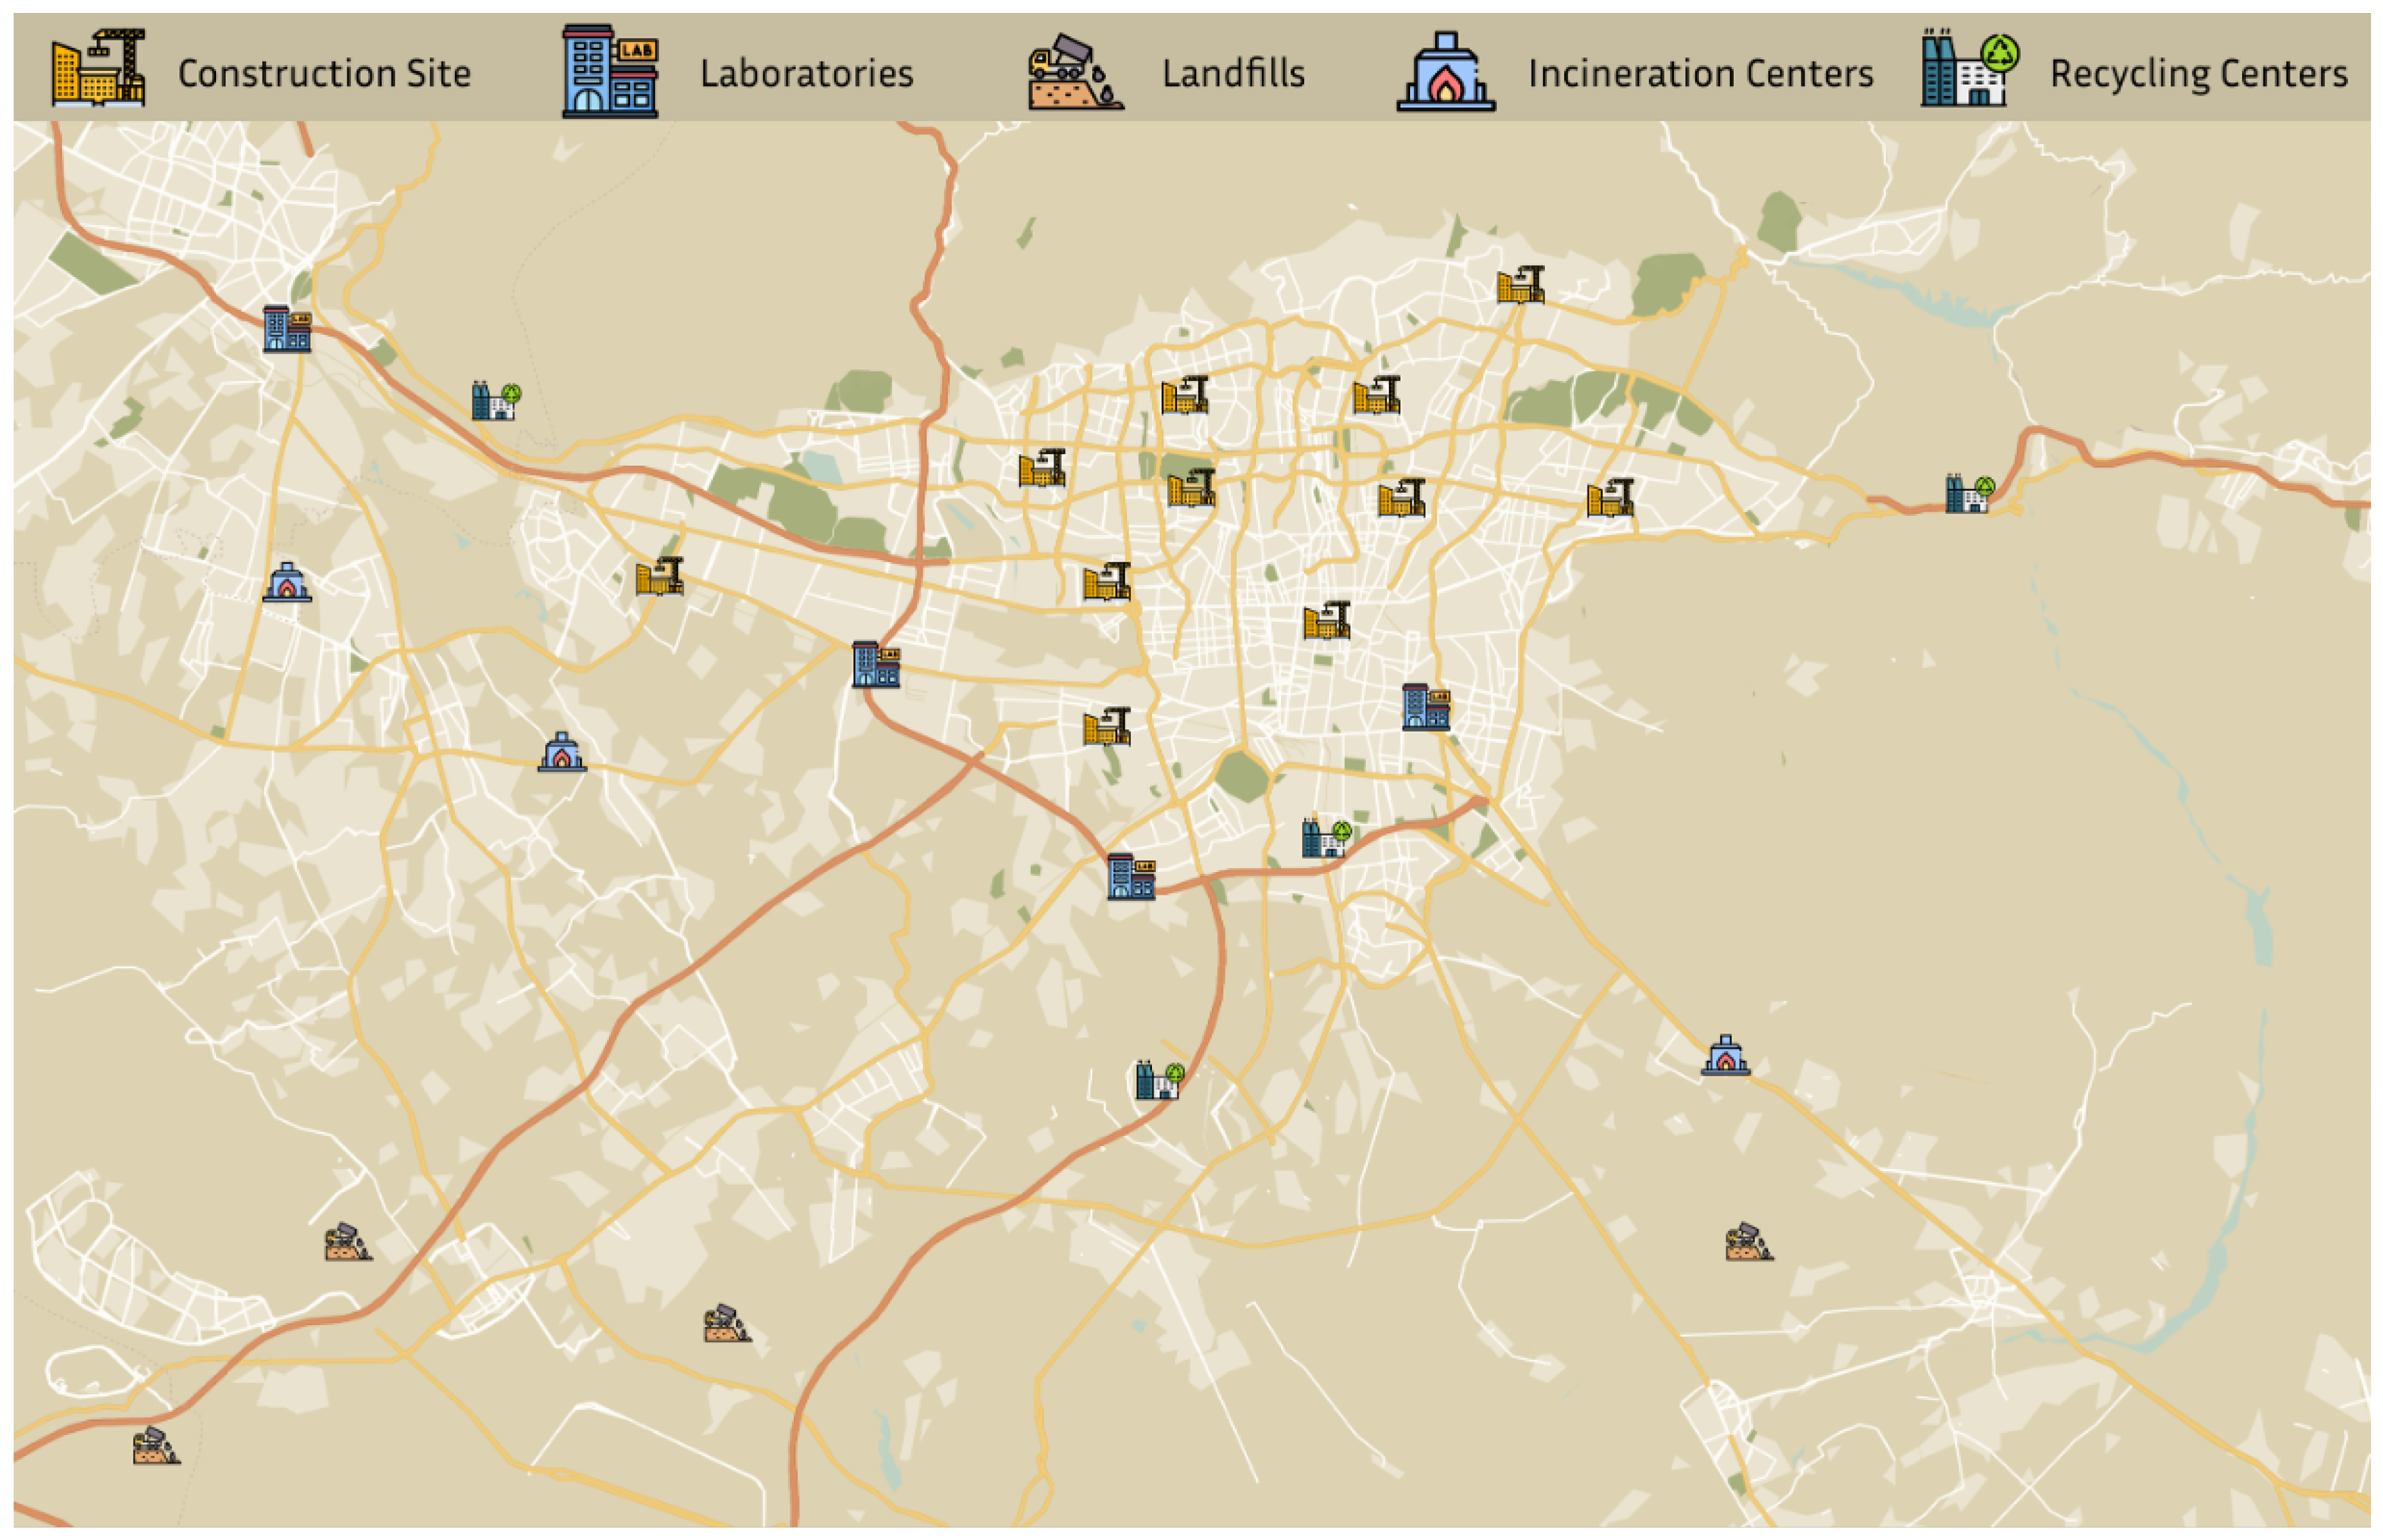
Tehran is one of the oldest and largest capitals in the world. Many hospitals and tall buildings have been built in the past that are not compatible with modern living. One of the first things business owners do is demolish these old buildings and build new ones that are safer and more efficient. Most of these buildings are located in the city center; however, there are some old skyscrapers situated in the vicinity of Tehran. Laboratories are mostly in the vicinity of Tehran, and one of them, which has a substantial capacity and is close to Tehran, is located in a city adjacent to Tehran. Despite not being in Tehran, it is being used due to its size and proximity to the city. Landfills and incineration centers are all outside of the city, but generally, incineration centers are closer to the city than landfills; however, their processing costs are significantly higher. Figure 5 shows a graphical representation of this case study.
The demolition project includes six hospitals, four specialty hospitals/clinics, and one sports clinic that has been selected for renovation and reconstruction. To improve supply chain planning, it is necessary to estimate the weight of the waste produced. This estimation involves various factors such as the height and area of each floor, as well as the total number of floors in each building. Detailed information for these complexes is available in Table 5. In this estimation, there are several assumptions. The weights of each material used in the building are deemed different, and the percentage of usage of each material is extracted from the blueprint of the building. The next assumption is that we overlook other materials used in the buildings as they do not constitute a significant percentage and can be transferred easily.
There are always several concerns about transporting waste to construction sites. The limited number of trucks and vehicles available is a significant problem, especially as, in this research, the use of electric trucks and vehicles is being scrutinized. The number of manufactured electric trucks is relatively lower than electric vehicles, but at the same time, these electric vehicles have less capacity, and their fixed costs may exceed the fixed cost of using the electric truck.
Each laboratory and waste management center has a specific capacity that cannot be exceeded, as outlined in Table 6. It is important to note that the recycling centers in this study are assumed to have unlimited capacity, as their actual capacity far exceeds the scale of this study.
The distance between the centers should be calculated as the electric vehicles’ efficiency will be compared, and it has a direct effect on the cost of operation for each electric vehicle and truck. The estimation of the distance between each facility and site is determined in Table 7, Table 8, Table 9 and Table 10.

4. Numerical Results and Analysis

In this section, a numerical analysis from a real case study in Tehran is implemented on the mathematical model, and the effectiveness and robustness of the model are evaluated. Section 4 will analyze the results of the first solution to the problem with default settings and then analyze the effect of electric vehicles and trucks. In this subsection, first, the problem will be solved with the consideration of trucks and vehicles being electric, and then a different type of problem will be solved with the assumption of the cars using diesel fuels to determine how much the use of electric cars and drive are helping the environment. Moreover, a thorough analysis will be implemented in this subsection to determine the sensitivity of the problem to the change in different values in the robust reformulation as well as the MILP formulation. This research is implemented using GAMS 25.1 software in an Intel i7 CPU machine with 16 gigabytes of RAM.

Data and Sensitivity Analysis

In this section, the Tehran case study will be analyzed, and different parameters of this problem will be scrutinized. For the numerical results and data analysis, this research will first determine six different approaches towards the decision-making process. The first approach is the economic approach. In this approach, the decision-maker has two different scenarios. The extreme scenario only values the economic factor in the interactive fuzzy optimization problem ( θ 1 = 1 , θ 2 = 0 , θ 3 = 0 ). The “High” approaches in this section consider other factors while giving the main factor more attention. For instance, in the high scenario for economic decisions, the hyperparameters for the interactive fuzzy optimization are distributed evenly between environmental and social factors, while the economic factor has a higher value than the other two. ( θ 1 = 0.7 , θ 2 = 0.15 , θ 3 = 0.15 ) social and economic scenarios follow the same rules.
On the other hand, there are some scenarios that combine two decisions. These decisions are labeled as hybrid decision-making. “Socio-Economical”, “Socio-Environmental”, and “Enviro-Economical” decisions are the hybrid scenarios used for this problem type. Socio-economical decisions focus on balancing social welfare and economic benefits; socio-environmental decisions integrate social considerations with environmental sustainability; enviro-economical decisions merge environmental impacts with economic viability. These hybrid decision scenarios give equal attention to the two important factors, and in the “Extreme” scenario, the third one is overlooked. However, in the “High” scenario, the remaining weight will be given to the third factor as well. For instance, for the “Socio-Economical” decision, the “Extreme” scenario’s hyperparameters are θ 1 = 0.5 , θ 2 = 0.5 , and θ 3 = 0 , while the “High” scenario’s hyperparameters are θ 1 = 0.4 , θ 2 = 0.4 , and θ 3 = 0.2 .
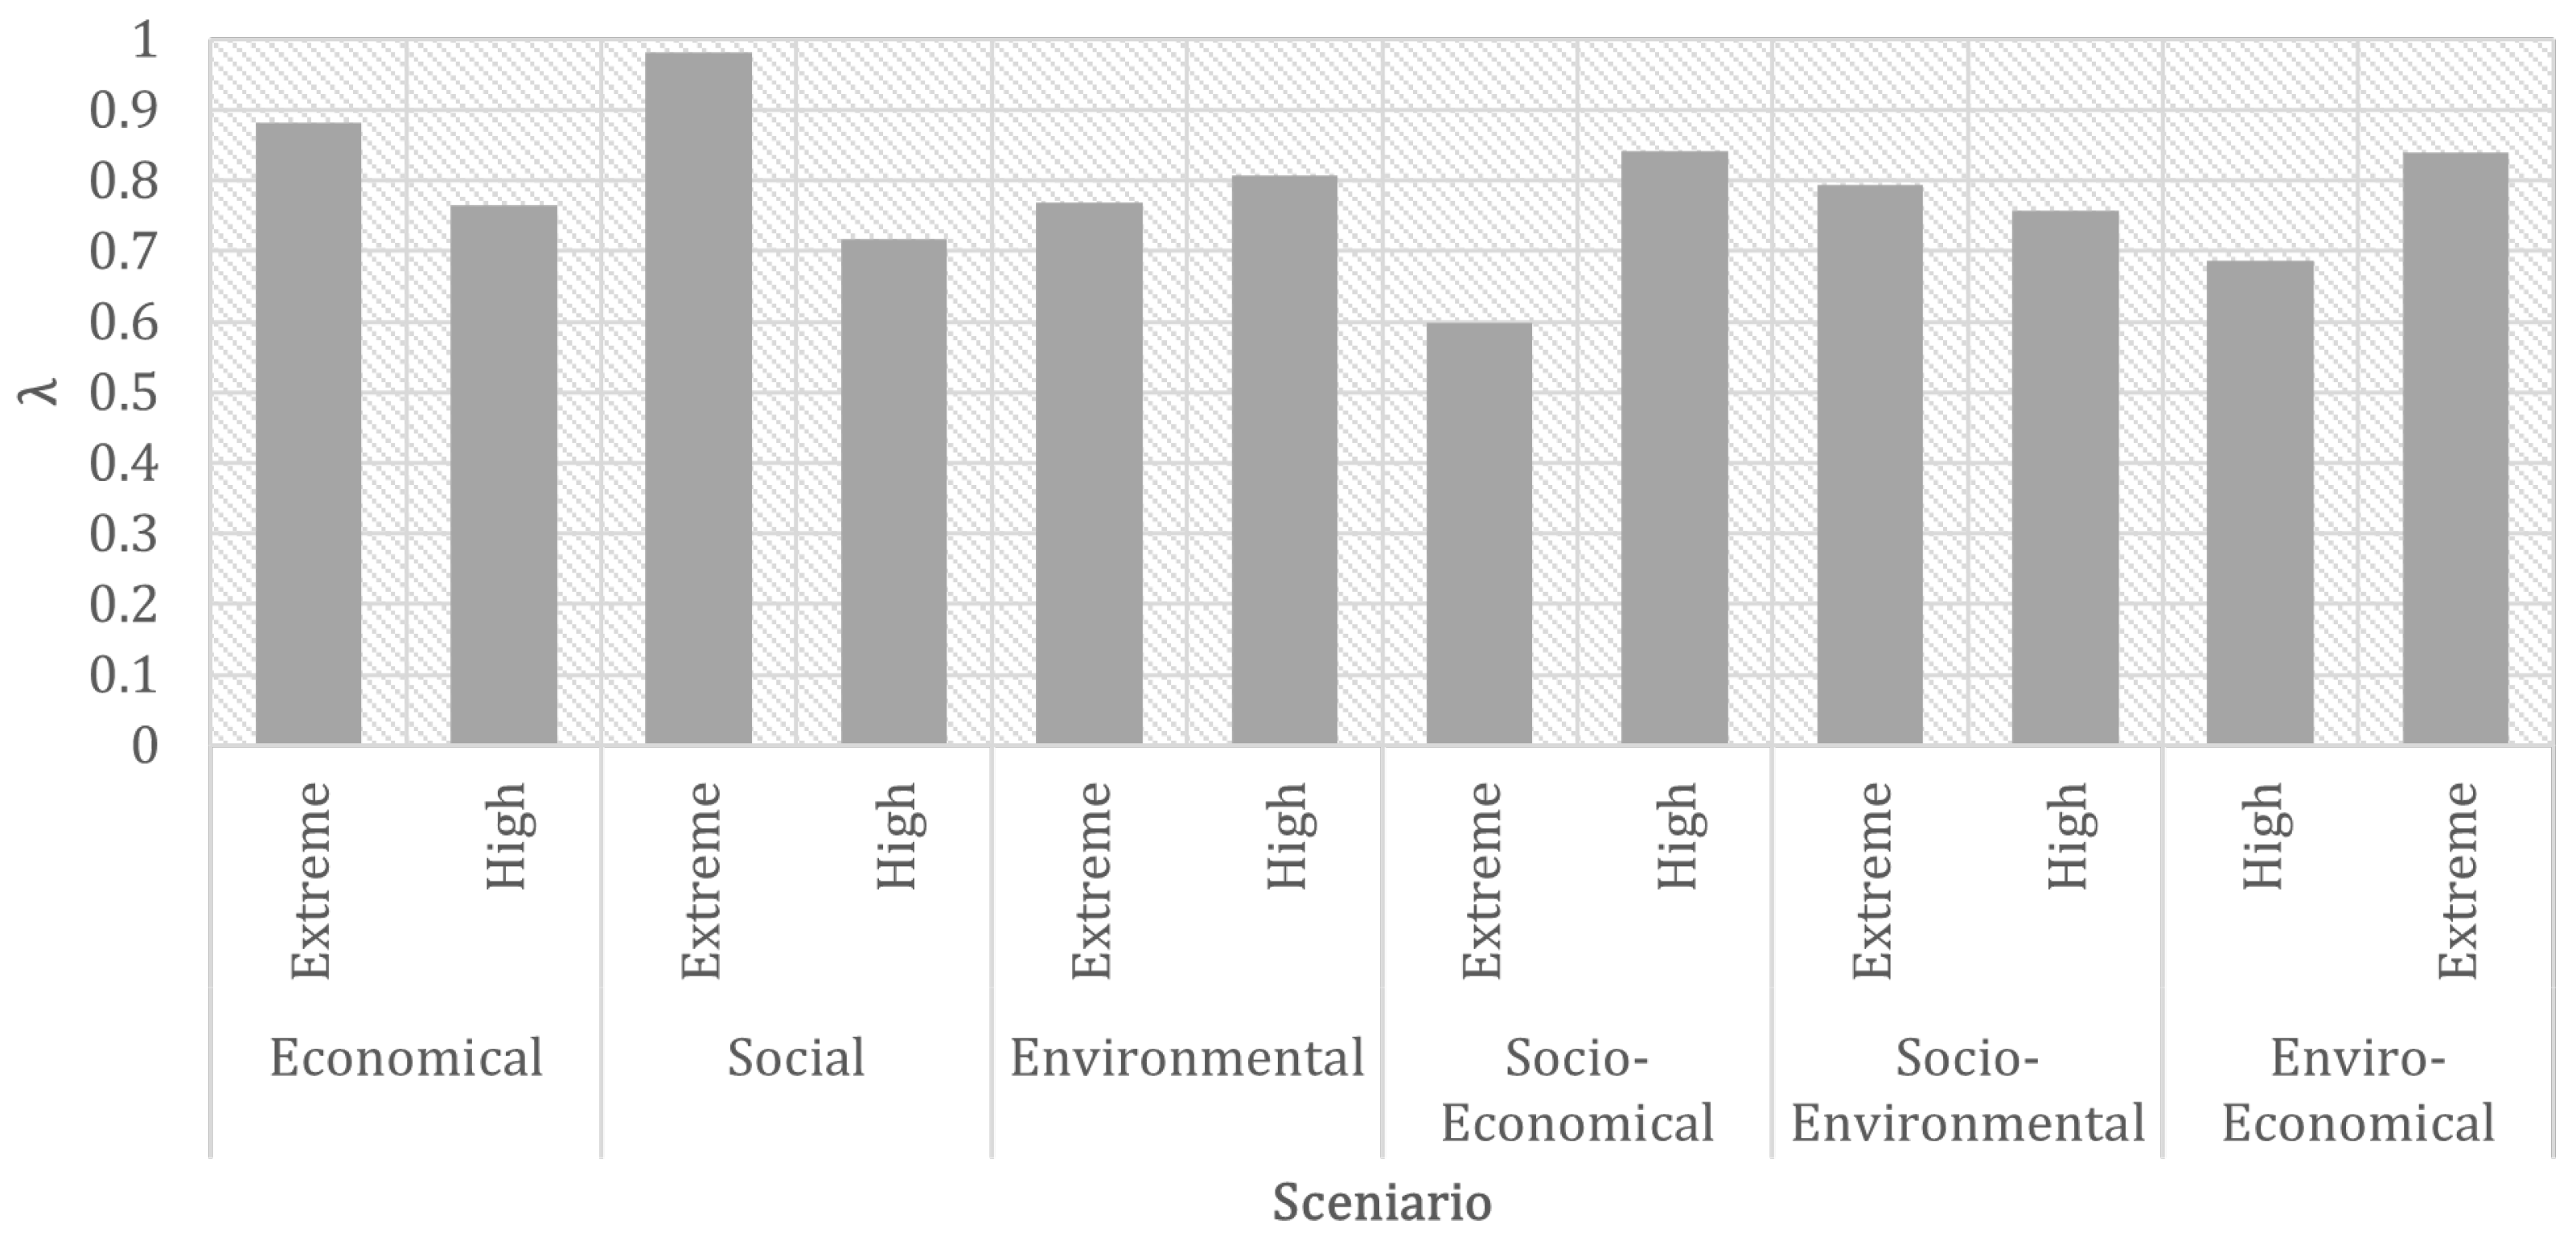
For the first stage of the data analysis, λ is compared in different scenarios to determine the optimal policy for decision-making in the fixed situation. Figure 6 shows the value of λ in different scenarios of decision-making. As mentioned earlier in this section, different scenarios are determined by altering the value of θ . Social decision-making shows a better response for our objective function in the “Extreme” scenario, while economic decision-making has a better objective function in the “High” scenario. Environmental decisions lead to moderate answers to the problem. However, hybrid decisions do not show any improvement in comparison to the first three decision-making scenarios. The worst-case scenario for the objective function is the “Extreme” scenario in socio-economical decision-making.
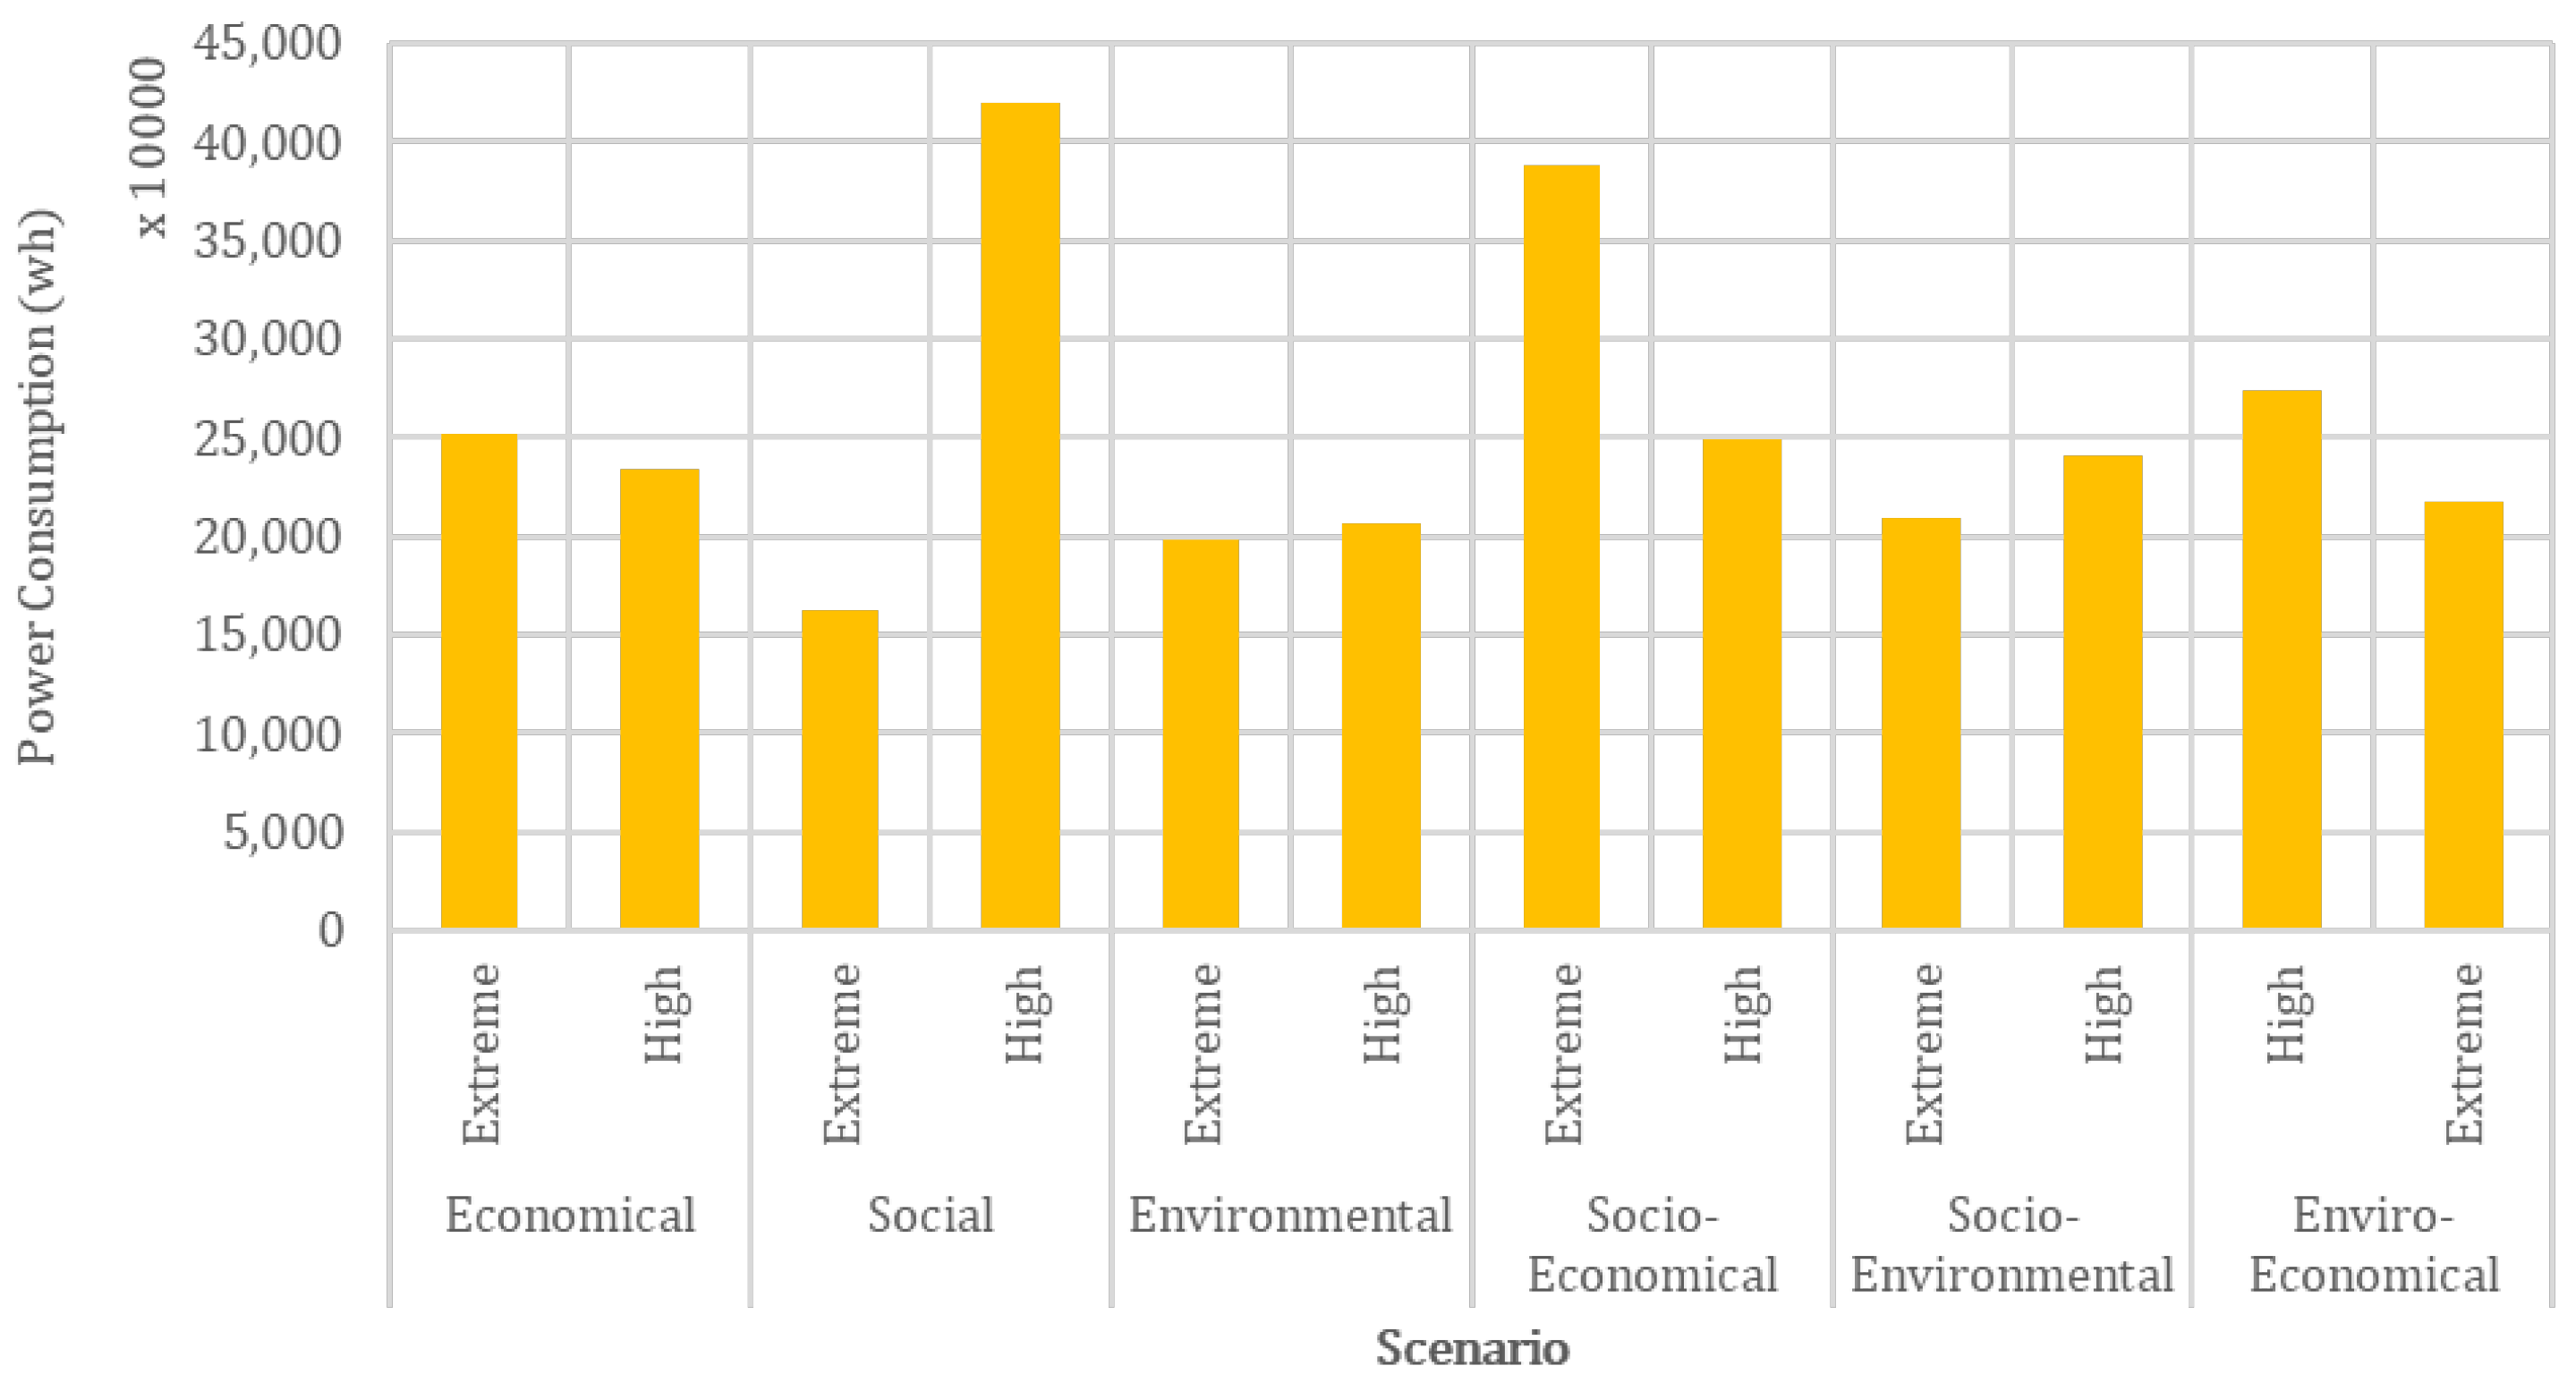
Different strategies have different impacts on the cost and power consumption of electric vehicles and trucks. As mentioned earlier, electric trucks and vehicles have some limitations in comparison to diesel vehicles, and one of the most important limitations for electric vehicles is their power consumption and battery usage. As expected, environmental decisions are the best decision-making strategies for the power consumption of electric vehicles. However, “Extreme” and “High” social decisions are the best and worst scenarios available, respectively. This unexpected result might be because of the distance between the facilities, as some of the facilities outside of the city have more capacity for employment. Between the hybrid decisions, socio-environmental decisions are more effective than expected. Socio-environmental decisions cause less power consumption by electric vehicles. Therefore, they are the best options for decision-makers when the environment is the main concern.
The worst hybrid decision for power consumption is the socio-economical decision, as in the “Extreme” scenario, they have the most power consumed by the vehicles and rank second in the worst cases among other scenarios. The environmental decision scenario, both for “Extreme” and “High”, is effective for decision-makers if they want to minimize power consumption and it is their priority. Figure 7 illustrates the power consumption for electric vehicles in each scenario and strategy.
One of the most important parameters for any supply chain planner or decision-maker is the fixed cost and cost of the operation. It is evident that if the decision-maker decides to adopt an economic strategy, the cost is minimized. The economic strategy in both “Extreme” and “High” scenarios has been proven to be effective in minimizing costs. However, power consumption is not that optimal. The worst scenario for cost minimization is the “High” scenario from social strategy. This makes more sense as the fixed and operating cost per unit is relatively higher for the factories that hire more people, as wages are one of the fixed cost components. The best strategy between the hybrid approaches is the enviro-economical strategy, which keeps the cost low in both “High” and “Extreme” scenarios. This hybrid strategy also keeps power consumption low. Along with the economic strategy, environmental strategies also happen to work well for cost minimization. Figure 8 demonstrates the cost of each strategy and scenario.
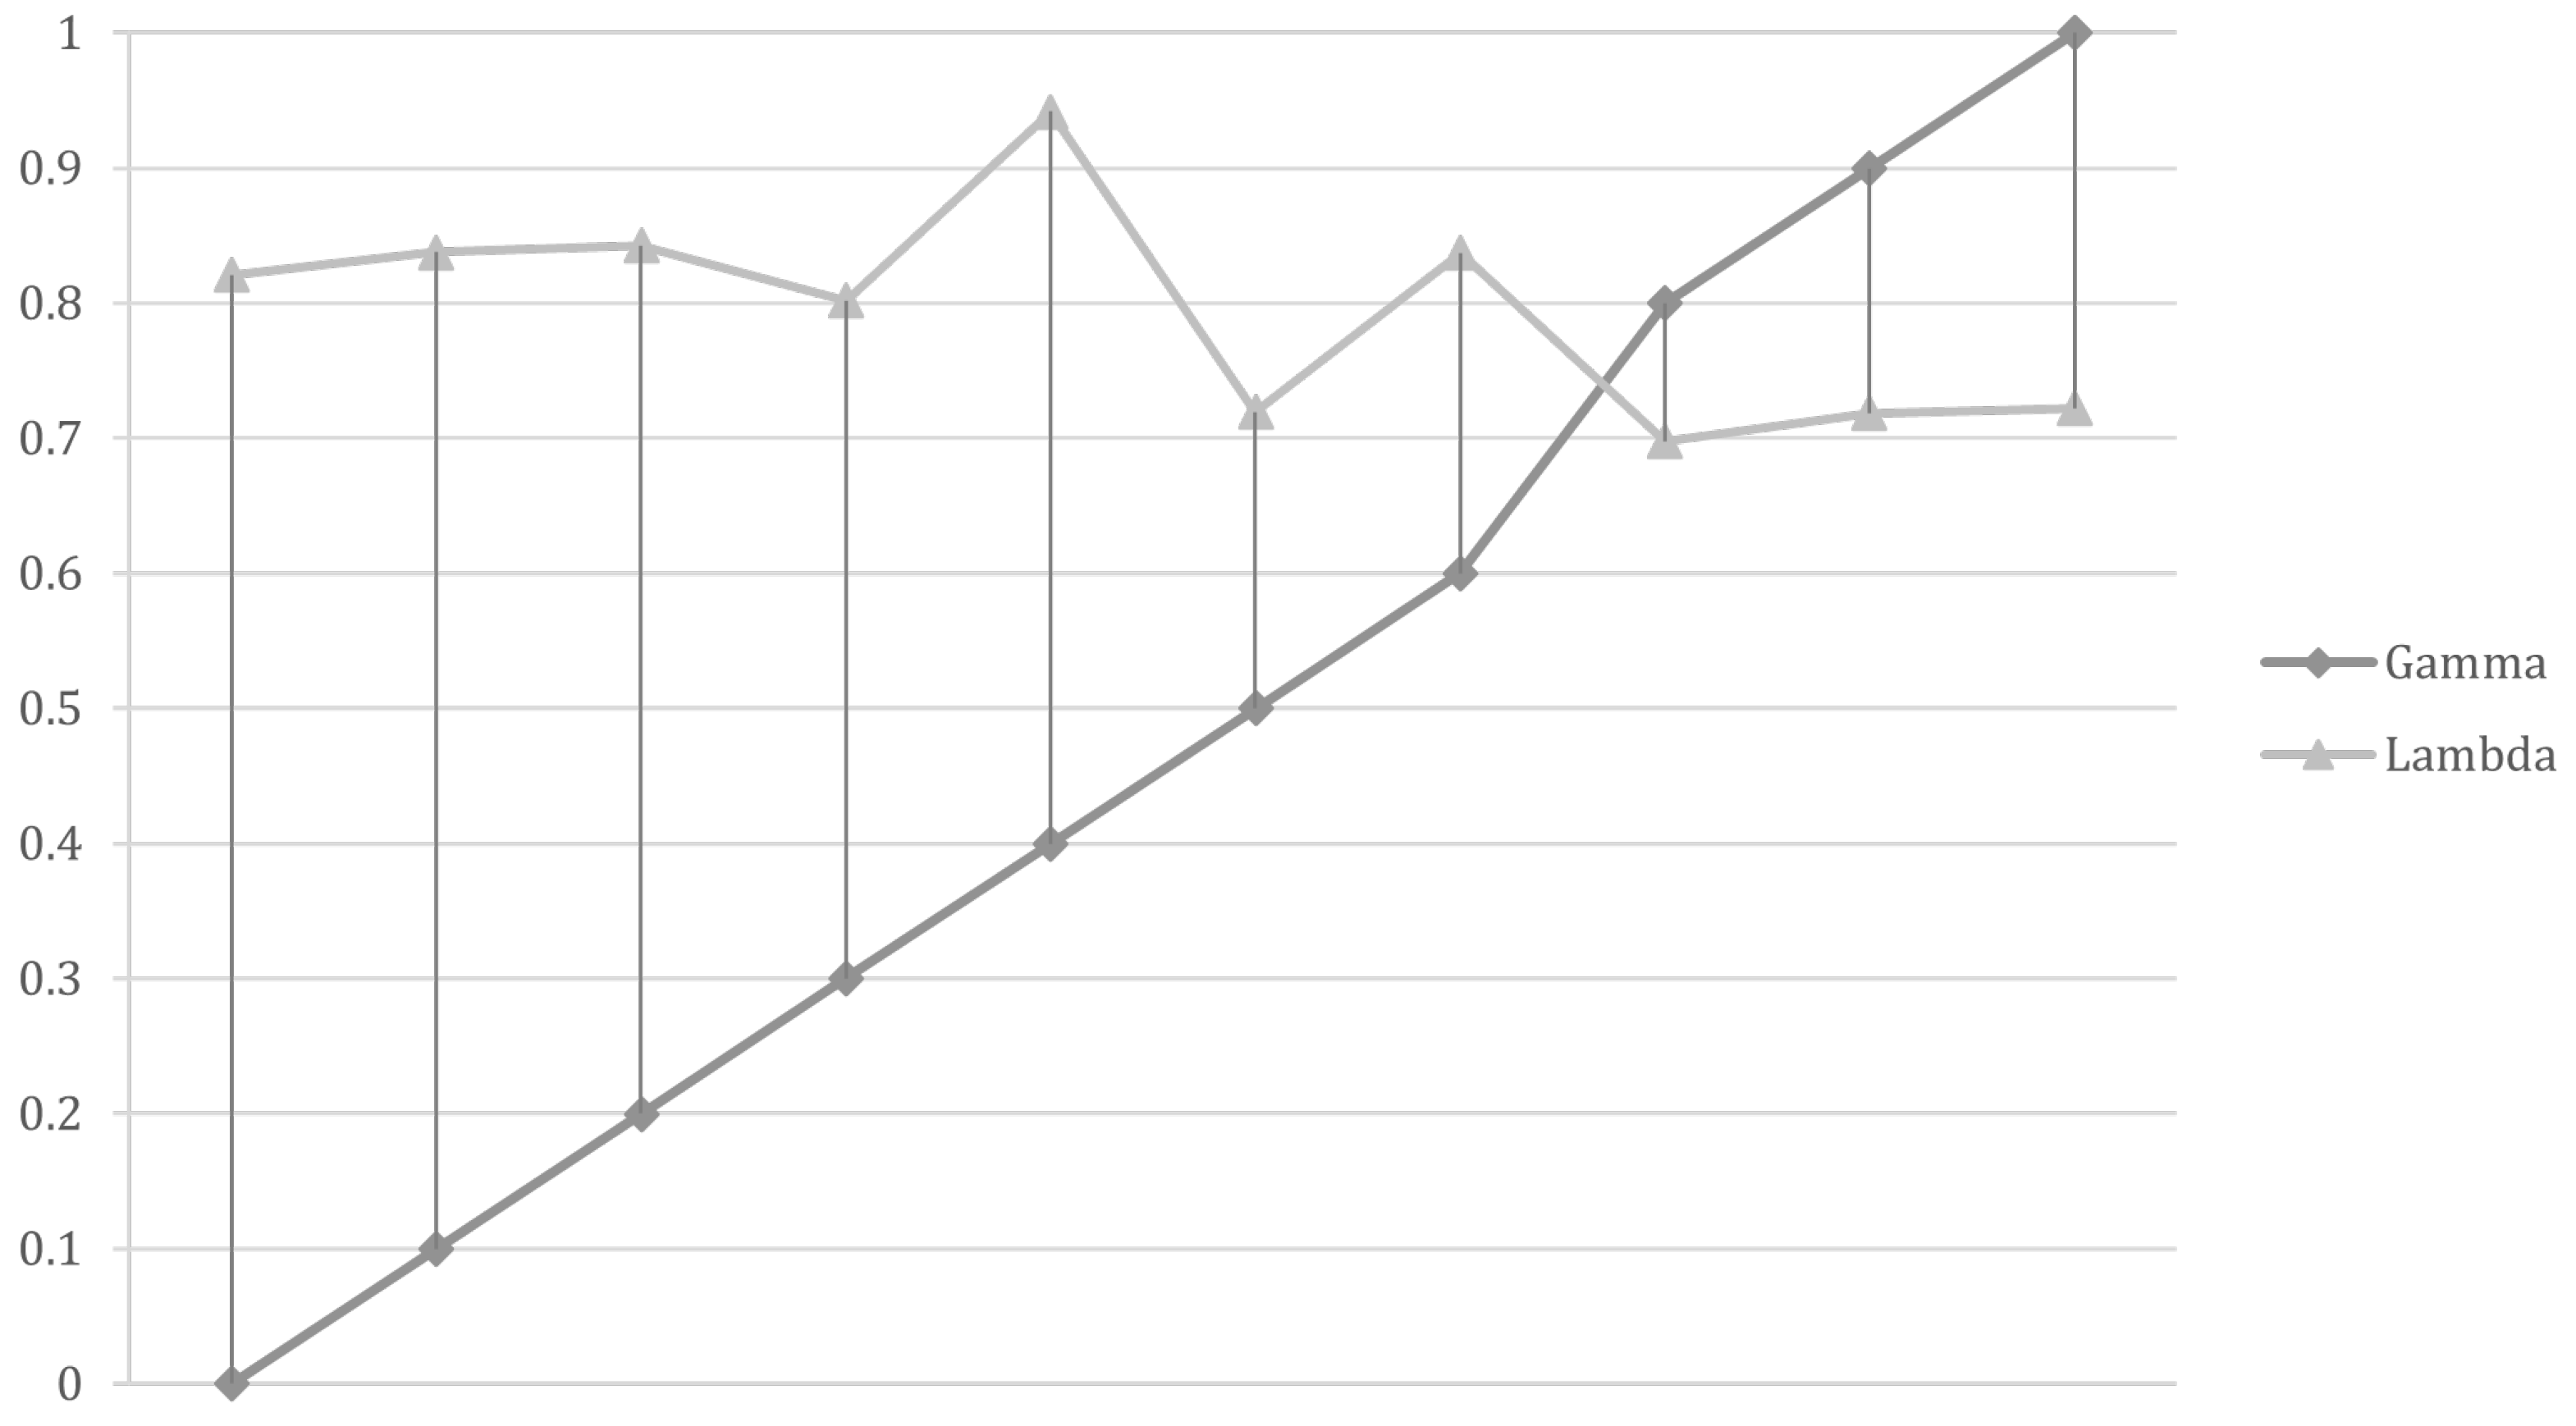
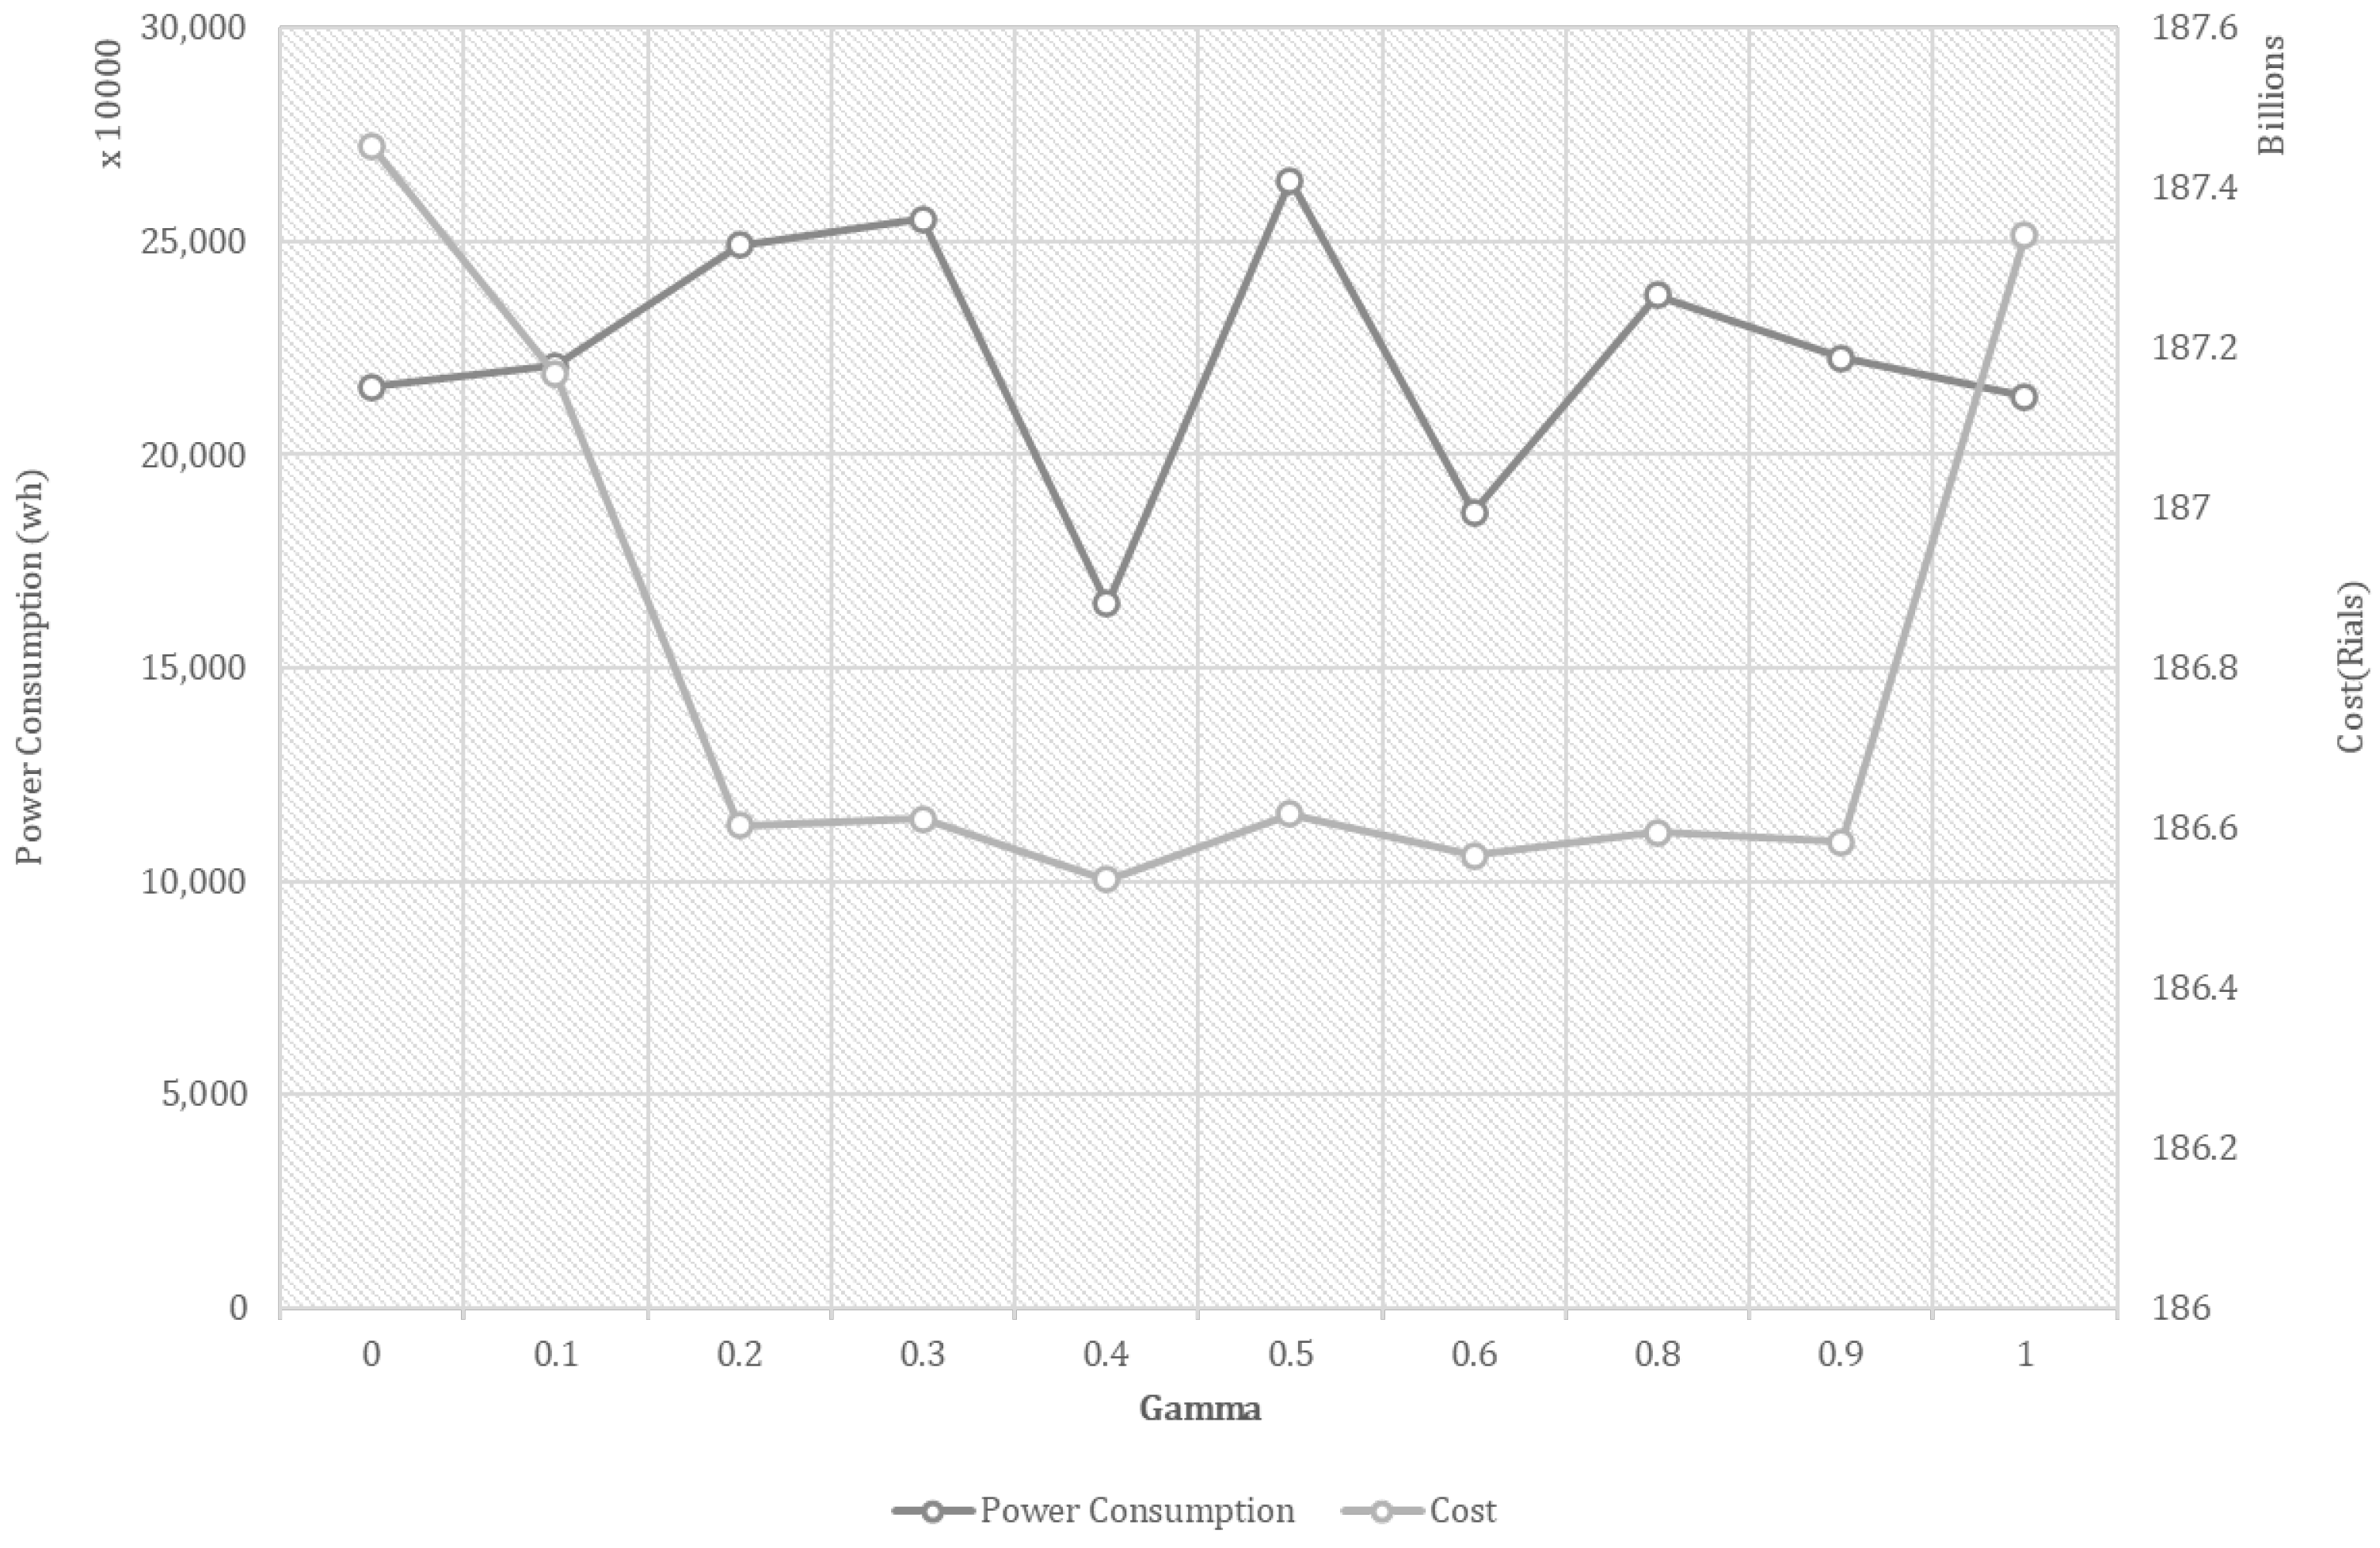
The interactive fuzzy approach for this optimization problem has two important hyperparameters. λ , which is the objective function of our fuzzy problem, and γ , which is the compensation coefficient. In the proposed problem, by increasing γ , λ changes and reacts to these changes. By increasing γ to a value of 0.4, the objective function first increases by nearly 15%, and after a value of 0.4, it starts to decrease until the compensation coefficient is up to 0.8. After this value, there is a minor increase in our objective function. Figure 9 illustrates the changes and relationship between γ and λ . Figure 10 shows the different values of γ and the related costs and power consumption. It is evident from the graph that a value of 0.4 is the optimal value for the compensation level in order to minimize costs and power consumption.
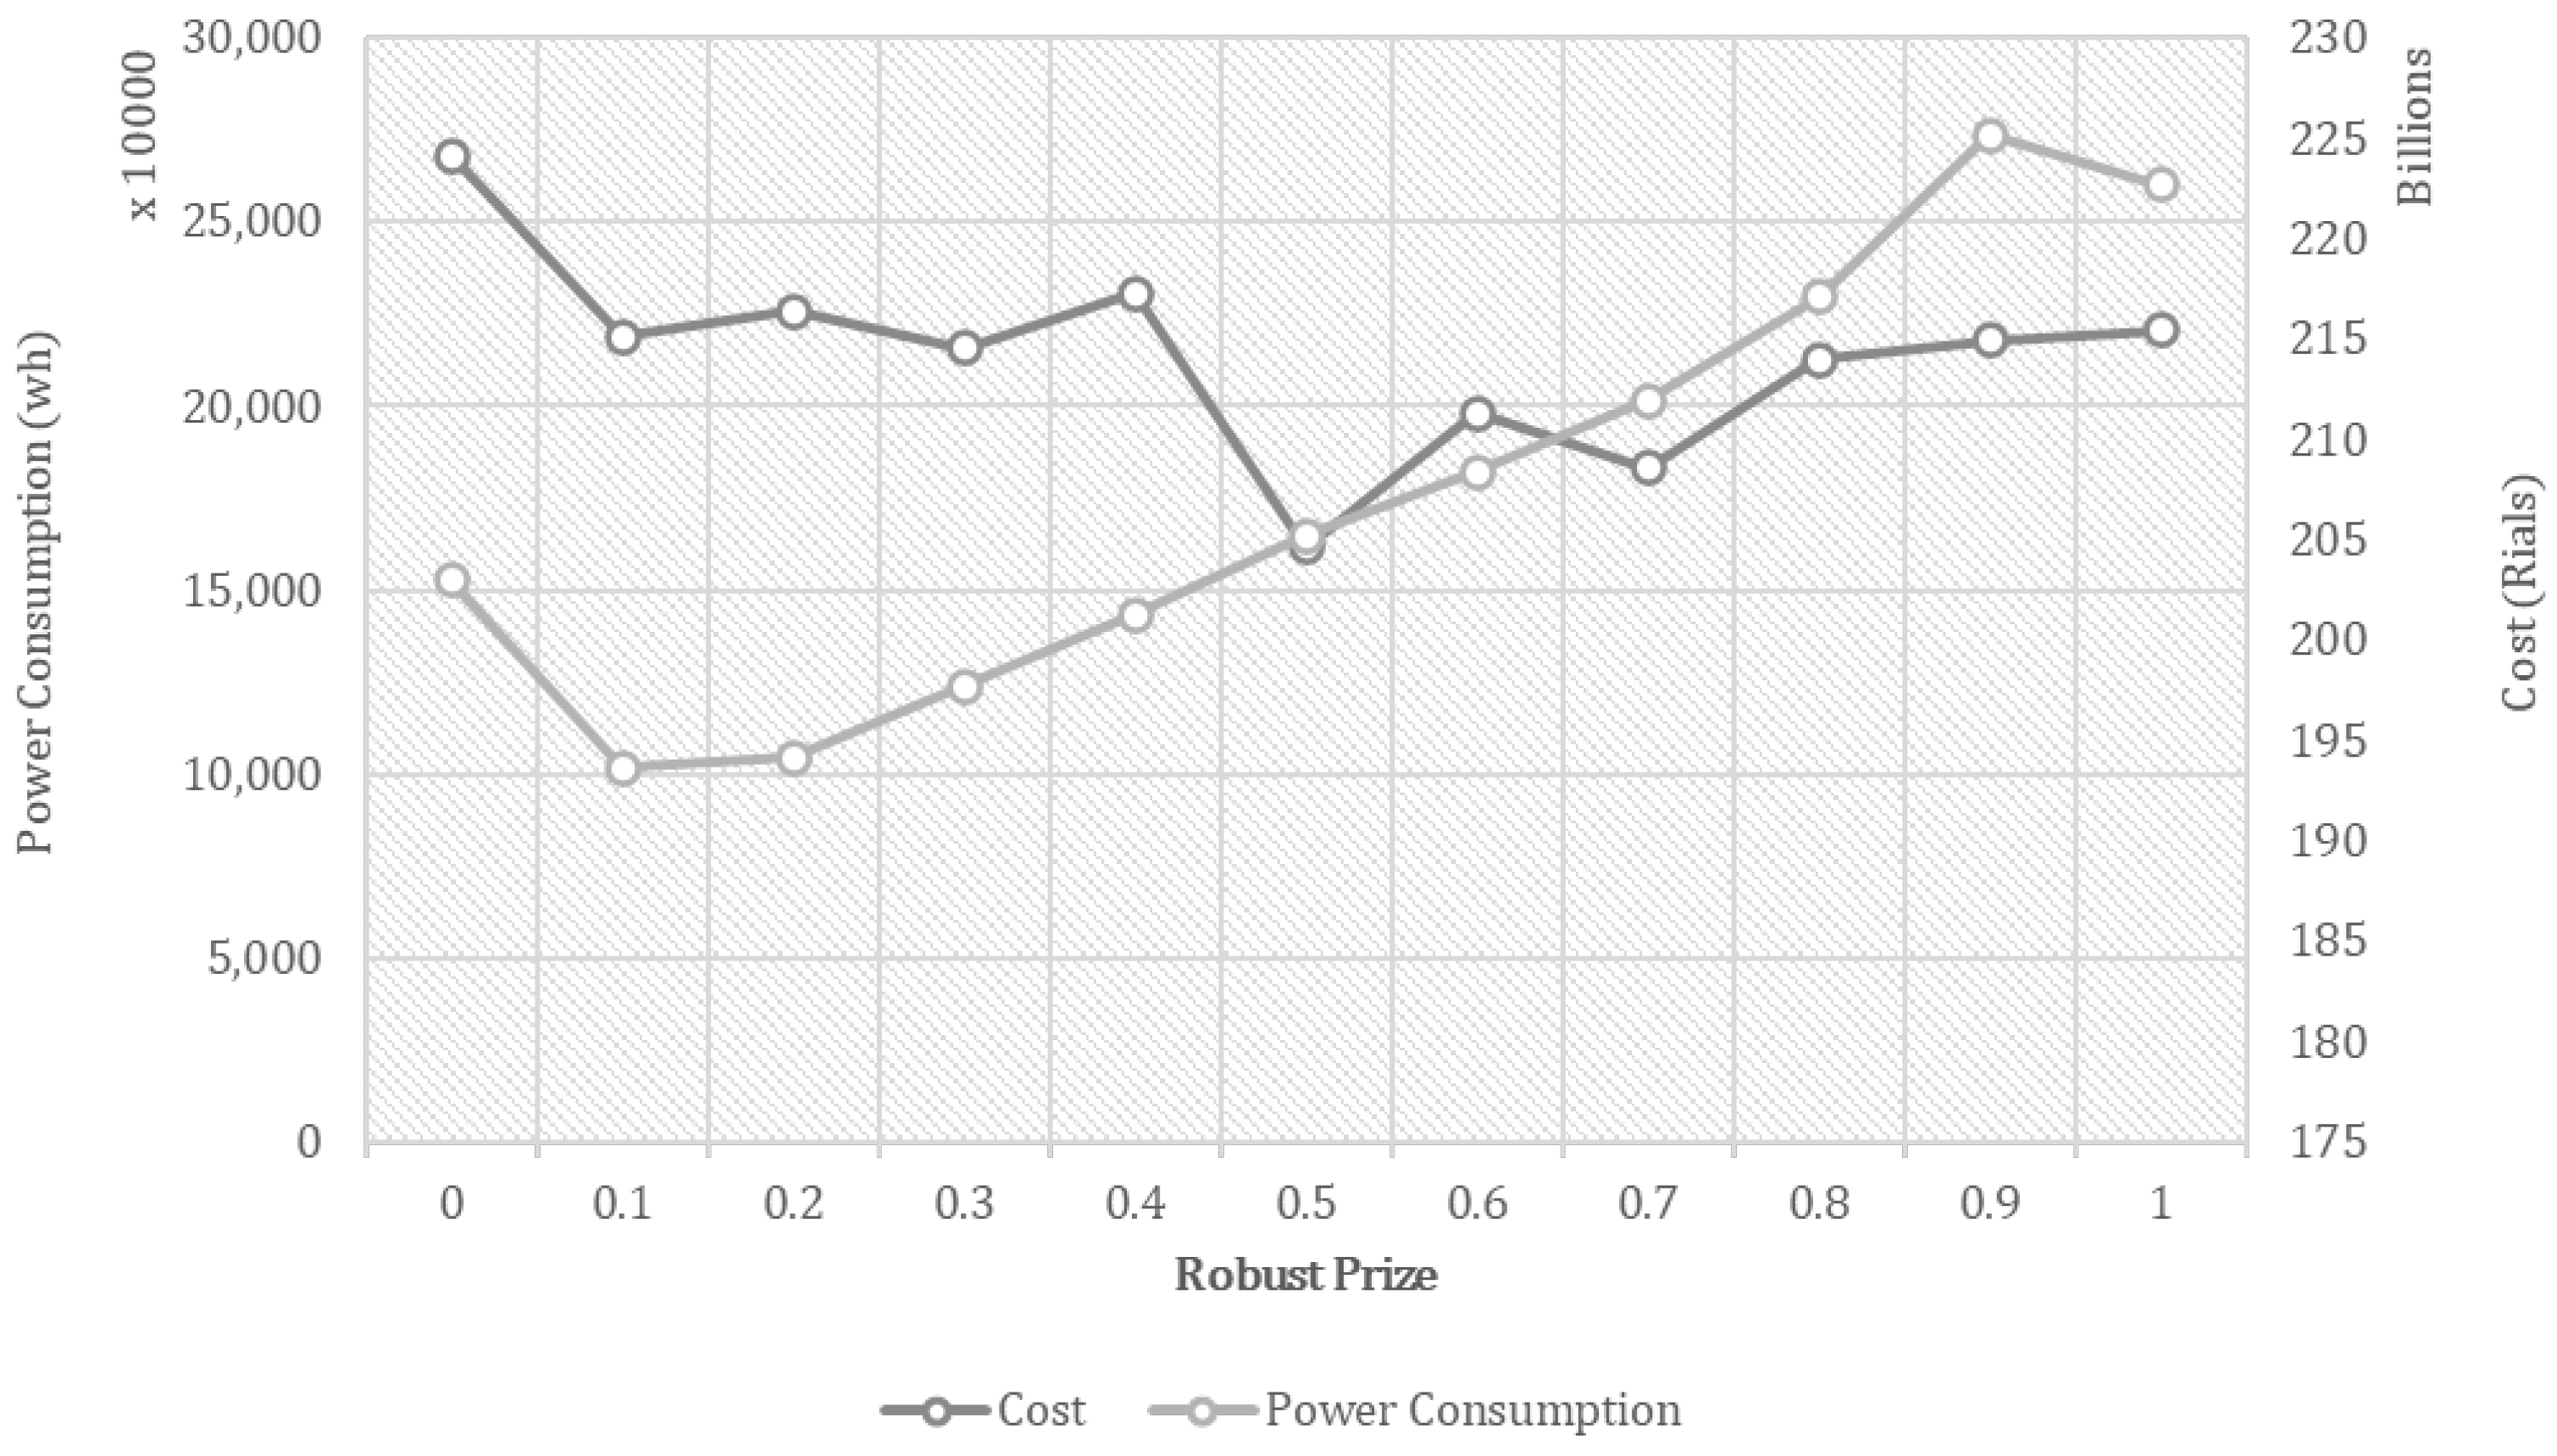
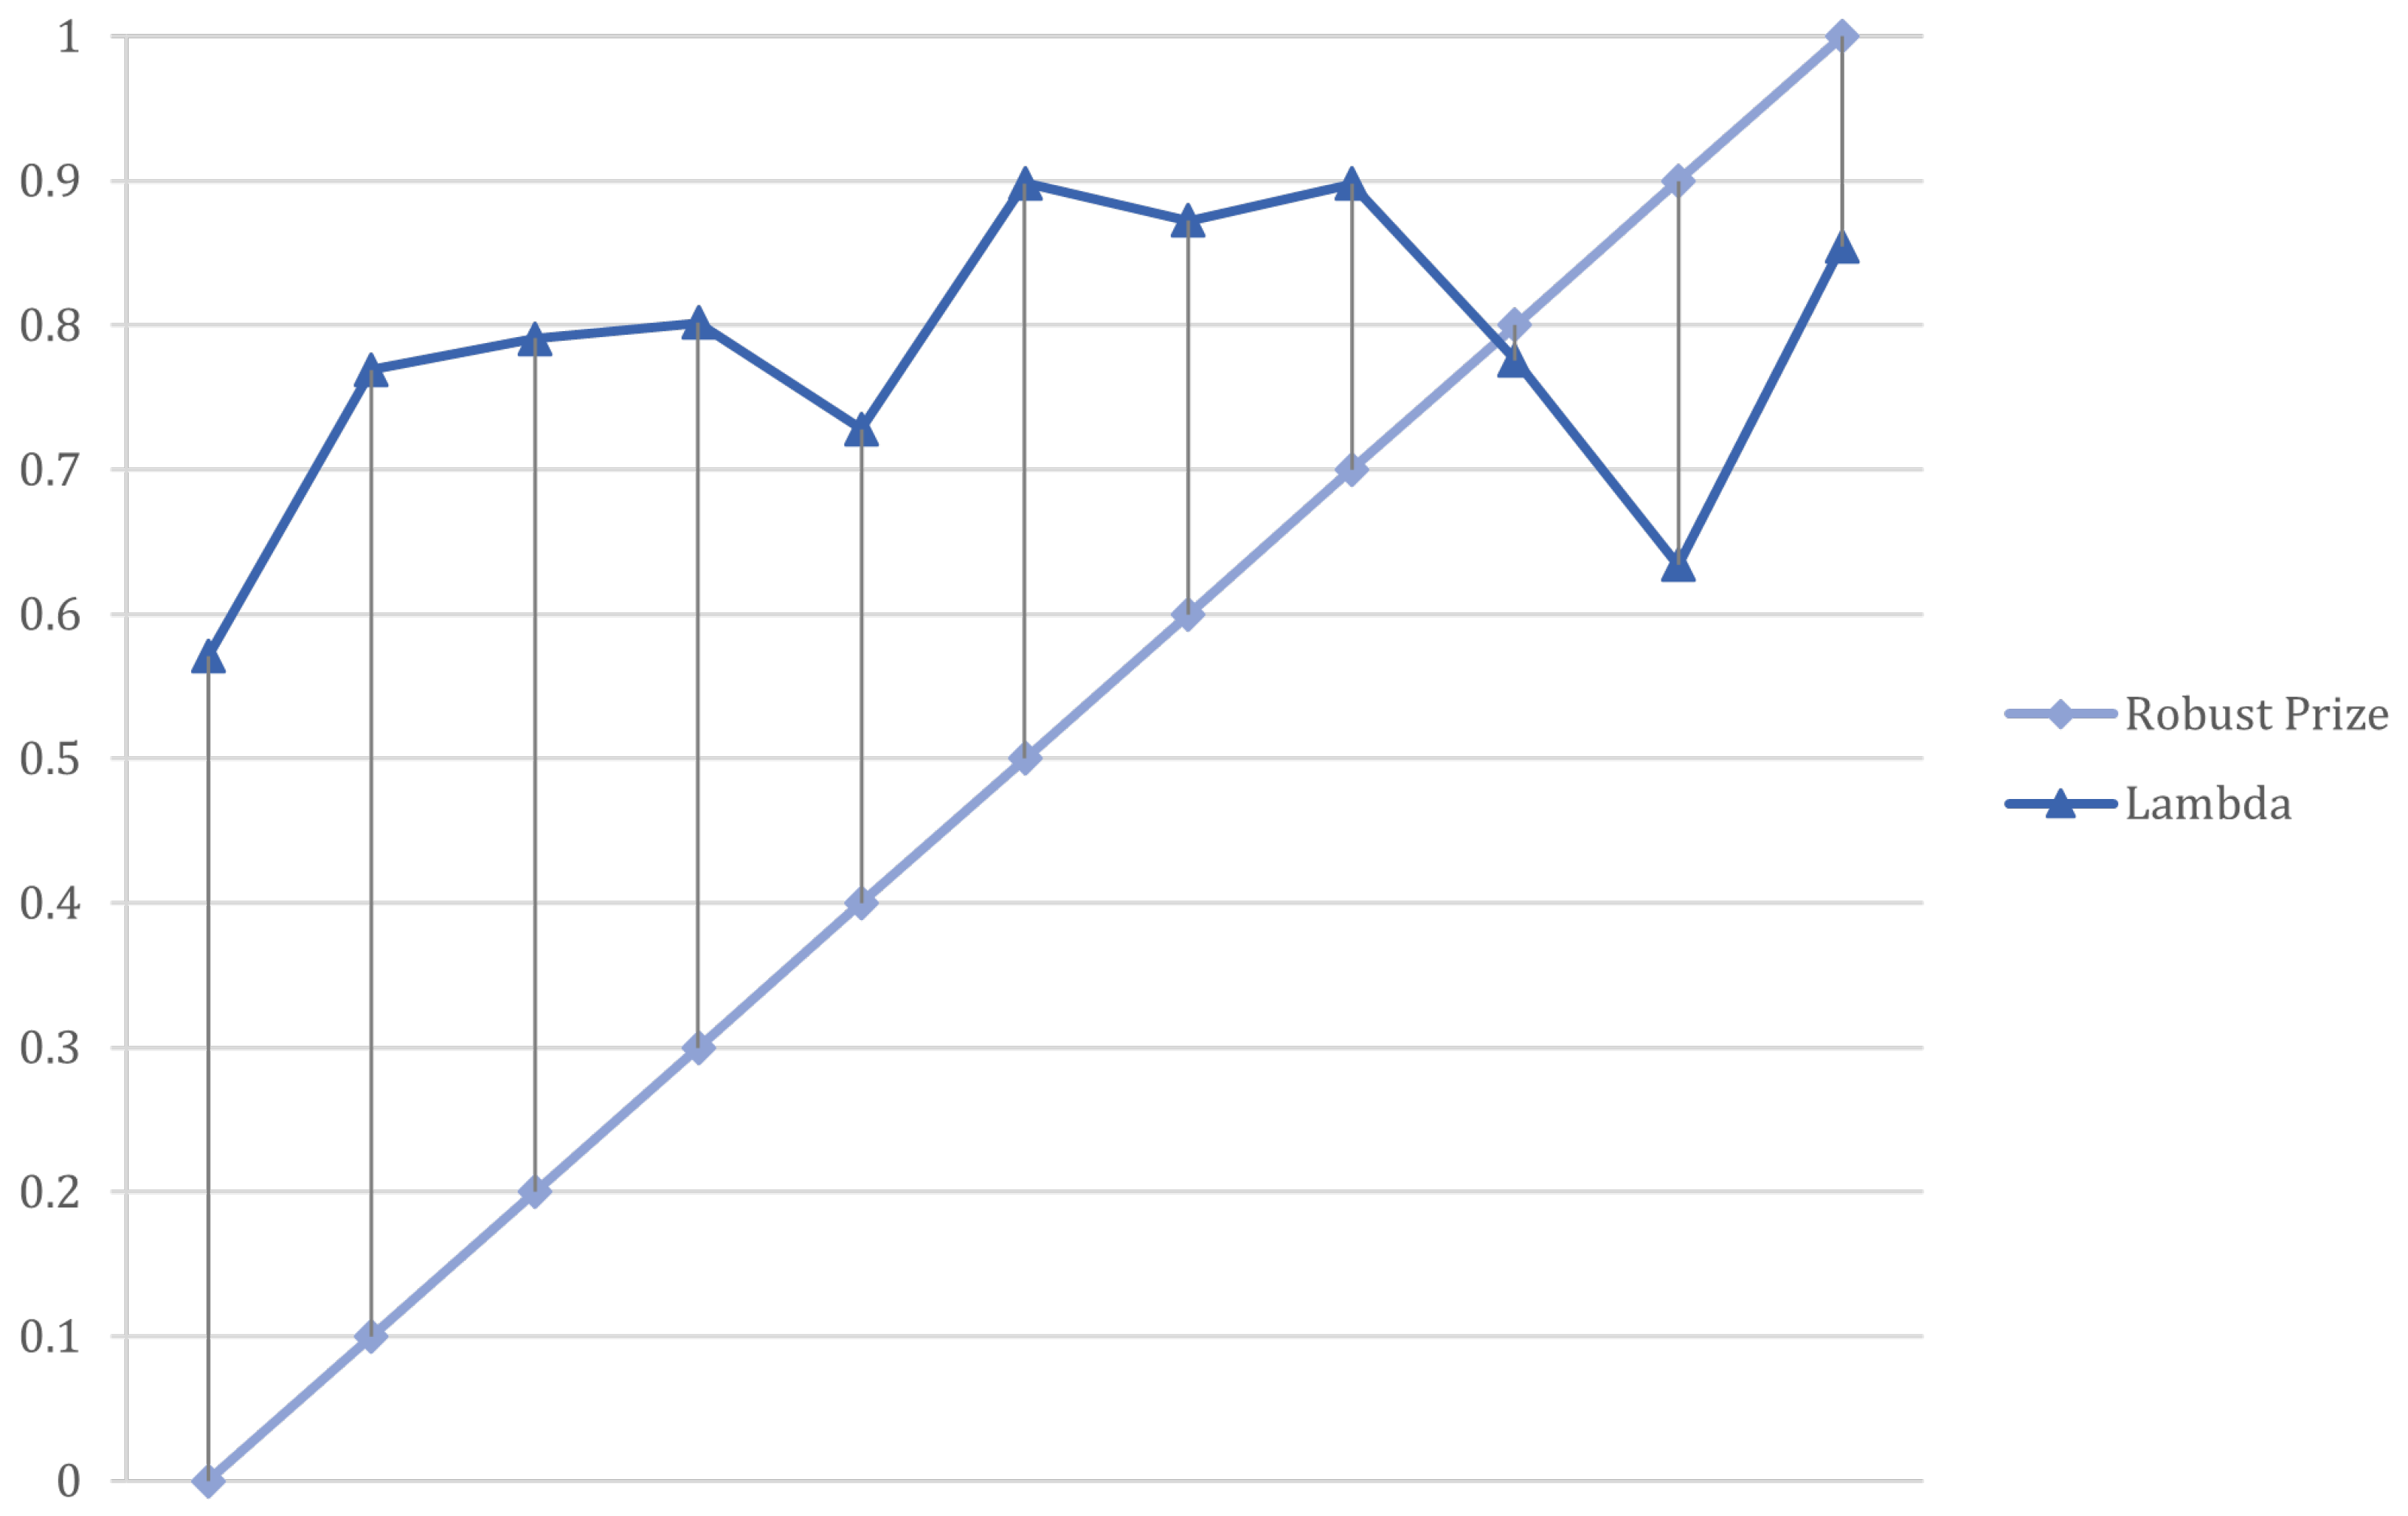
The price of robustness (Γ) is the parameter that works to determine realization scenarios under uncertainty. By changing the price of robustness, the realization scenario will change, and our objective function will change accordingly. Robust optimization works in a way that considers the worst-case scenario for optimization in a stochastic situation [51]. The price of robustness helps us consider the different scenarios with the reformulation carried out in Section 3. In different scenarios, costs and power consumption act differently. For instance, by increasing the price of robustness to 0.5, the cost decreases by nearly 65%; on the other hand, the power consumption increases by 10%. After this value, both power consumption and cost increase in the scenarios, and the robust price is more than 0.5. λ , which is our objective function, has its optimal value when the robustness price has the values 0.5 and 0.7. However, the scenario in which the price of robustness is 0.5 has the maximum level of λ . Figure 11 and Figure 12 show the sensitivity analysis for Γ .
One of the main policies for recycling items concerns LEDD rules. LEDD rules have three different policies in their scoring system. The first policy, which receives zero points, is where decision-makers recycle under 50% of their waste and do not make streamlines for recyclable materials. The second policy, which receives one point, is when two types of materials have different streamlines, and half of the waste is recycled at the end of the reverse logistics network. The last policy, which receives the full points, ensures that all recyclable materials have streamlines for recycling, and 75% of the material will be recycled. In this research, all three LEDD policies have been addressed and implemented in the optimization model.
Table 11 shows the different policies implemented based on LEDD rules. In these experiments, the number of electric vehicles and trucks used for the reverse logistics network helped us to calculate CO2 emissions in case the planners were using diesel vehicles. In this experiment, the first policy, which does not receive any points, has a better objective but is not suitable to implement if the planner is looking for LEED points and circular economy is the priority. However, the third policy is better as our objective function focuses on optimality. Using electric vehicles and trucks based on these experiments helps the environment by emitting at least 50,197,950 g less CO2 in this project. Also, if the planners do not have electric vehicles or trucks, the second policy proved to be more effective in CO2 emission, as less distance was be traveled by the vehicles.

5. Discussion and Conclusions

This research focused on socio-economical analysis with respect to environmental factors of green reverse logistics in the construction and demolition industry. Existing literature in this context did not mention the use of electric vehicles and their limitations in the transportation of construction waste. Some studies researched policies and their effects, and some just studied the environmental and economic factors of many construction sites’ reverse logistics network. This novel approach tried to tackle this problem using three objective functions with constraints that consider electric transportation vehicles.
The research used stochastic planning and robust optimization methods to address the uncertainty in the collection of waste in Tehran. The goal was to make the research more applicable to real-world situations. Through sensitivity analysis, it was determined that enviro-economic policies, particularly hybrid policies and social policies in the “High” scenario, work best for the designated network. However, these results are subject to change based on different situations and data. This innovative reverse logistics model assists supply chain planners and managers in choosing a strategy based on their preferences, utilizing an interactive fuzzy approach.
The Tehran case study was conducted to test the model in a real-life project and situation. Data and sensitivity analysis were also conducted to determine the best values of hyperparameters for the case study. This case study was specifically for the healthcare industry and hospital construction, as it involved incineration centers and special landfills for waste disposal.
The research experiments utilized LEED policies to assess their effectiveness and alignment with external recycling policies for construction materials. The study also identified the number of trucks and vehicles involved and analyzed their power consumption. The research demonstrated the potential CO2 emissions if supply chain planners opt for diesel vehicles over electric trucks and vehicles.
There were some limitations in this study. The reverse logistics network was NP-Hard, and commercial solvers like CPLEX were unable to handle these NP-Hard problems on a large scale. Future researchers can propose metaheuristic algorithms to deal with large-sized problems or use relaxation methods to overcome the CPU time needed to solve this specific problem. Moreover, future researchers can use this network and enhance it in a way that would make the number of trucks and vehicles optimal by combining this model with vehicle routing problem models. Moreover, the cost of battery disposal and the time to pick up the waste can be considered as well. Finally, researchers can focus more on stochastic planning and consider more variables as uncertain to make it as close as possible to the real-world situation.

Author Contributions

A.A.: Methodology, Implementation, Conceptualization, Writing; A.S.: Methodology, Implementation, Conceptualization, Writing; E.H.: Supervision, Conceptualization. All authors have read and agreed to the published version of the manuscript.

Funding

This research received no external funding.

Data Availability Statement

Data are available within the context of this study.

Acknowledgments

We Kindly thank anyone who reads this paper.

Conflicts of Interest

The authors declare no conflicts of interest.

References

  1. Menegaki, M.; Damigos, D. A review on current situation and challenges of construction and demolition waste management. Curr. Opin. Green Sustain. Chem. 2018, 13, 8–15. [Google Scholar] [CrossRef]
  2. Skoyles, E.R. Waste Prevention on Site; BT Batsford Limited: London, UK, 1987. [Google Scholar]
  3. Umar, U.A.; Shafiq, N.; Malakahmad, A.; Nuruddin, M.F.; Khamidi, M.F. A review on adoption of novel techniques in construction waste management and policy. J. Mater. Cycles Waste Manag. 2017, 19, 1361–1373. [Google Scholar] [CrossRef]
  4. Chen, Z.; Li, H.; Wong, C.T. Environmental management of urban construction projects in China. J. Constr. Eng. Manag. 2000, 126, 320–324. [Google Scholar] [CrossRef]
  5. Cole, R.J. Building environmental assessment methods: Assessing construction practices. Constr. Manag. Econ. 2000, 18, 949–957. [Google Scholar] [CrossRef]
  6. Chen, D.; Zhang, Y.; Xu, Y.; Nie, Q.; Yang, Z.; Sheng, W.; Qian, G. Municipal solid waste incineration residues recycled for typical construction materials—A review. RSC Adv. 2022, 12, 6279–6291. [Google Scholar] [CrossRef]
  7. Ponnada, M.R.; Kameswari, P. Construction and demolition waste management—A review. Safety 2015, 84, 19–46. [Google Scholar] [CrossRef]
  8. Chen, K.; Yang, M.; Zhou, X.; Liu, Z.; Li, P.; Tang, J.; Peng, C. Recent advances in carbon footprint studies of urban ecosystems: Overview, application, and future challenges. Environ. Rev. 2022, 30, 342–356. [Google Scholar] [CrossRef]
  9. Guarnieri, M. When cars went electric, part one [historical]. IEEE Ind. Electron. Mag. 2011, 5, 61–62. [Google Scholar] [CrossRef]
  10. Van de Graaf, T.; Colgan, J. Global energy governance: A review and research agenda. Palgrave Commun. 2016, 2, 1–12. [Google Scholar] [CrossRef]
  11. Yilmaz, M. Limitations/capabilities of electric machine technologies and modeling approaches for electric motor design and analysis in plug-in electric vehicle applications. Renew. Sustain. Energy Rev. 2015, 52, 80–99. [Google Scholar] [CrossRef]
  12. Oliver, R.K.; Webber, M. Supply Chain Management: Logistics Catches up with Strategy; Chapman and Hall: London, UK, 1982. [Google Scholar]
  13. Santoso, T.; Ahmed, S.; Goetschalckx, M.; Shapiro, A. A stochastic programming approach for supply chain network design under uncertainty. Eur. J. Oper. Res. 2005, 167, 96–115. [Google Scholar] [CrossRef]
  14. Bellman, R.E.; Zadeh, L.A. Decision-making in a fuzzy environment. Manag. Sci. 1970, 17, B-141–B-164. [Google Scholar] [CrossRef]
  15. U.S. Green Building Council. USGBC LEED Green Associate Study Guide; Pearson: Upper Saddle River, NJ, USA, 2011. [Google Scholar]
  16. Lin, Z.; Xie, Q.; Feng, Y.; Zhang, P.; Yang, Y. An optimal C&D waste logistics network design from contractors’perspective. J. Green Build. 2020, 15, 121–137. [Google Scholar]
  17. Hannan, M.; Akhtar, M.; Begum, R.; Basri, H.; Hussain, A.; Scavino, E. Capacitated vehicle-routing problem model for scheduled solid waste collection and route optimization using PSO algorithm. Waste Manag. 2018, 71, 31–41. [Google Scholar] [CrossRef]
  18. Pan, X.; Xie, Q.; Feng, Y. Designing recycling networks for construction and demolition waste based on reserve logistics research field. J. Clean. Prod. 2020, 260, 120841. [Google Scholar] [CrossRef]
  19. Ahmed, R.R.; Zhang, X. Multi-stage network-based two-type cost minimization for the reverse logistics management of inert construction waste. Waste Manag. 2021, 120, 805–819. [Google Scholar] [CrossRef]
  20. Shi, Y.; Huang, Y.; Xu, J. Technological paradigm-based construction and demolition waste supply chain optimization with carbon policy. J. Clean. Prod. 2020, 277, 123331. [Google Scholar] [CrossRef]
  21. Yu, H.; Solvang, W.D. A carbon-constrained stochastic optimization model with augmented multi-criteria scenario-based risk-averse solution for reverse logistics network design under uncertainty. J. Clean. Prod. 2017, 164, 1248–1267. [Google Scholar] [CrossRef]
  22. Liu, J.; Chai, Y.; Zheng, J.; Dai, J.; Wang, Z. Optimizing City-Scale Demolition Waste Supply Chain Under Different Carbon Policies. Environ. Sci. Pollut. Res. 2024, 31, 25787–25804. [Google Scholar] [CrossRef]
  23. Halvorsen, E.O.; Andersson, H. Optimizing environmental and economic aspects of collaborative transportation and logistics related to infrastructure projects–A case study from Norway. Waste Manag. 2023, 156, 159–167. [Google Scholar] [CrossRef]
  24. Akçalı, E.; Çetinkaya, S.; Üster, H. Network design for reverse and closed-loop supply chains: An annotated bibliography of models and solution approaches. Networks 2009, 53, 231–248. [Google Scholar] [CrossRef]
  25. Seuring, S.; Müller, M. From a literature review to a conceptual framework for sustainable supply chain management. J. Clean. Prod. 2008, 16, 1699–1710. [Google Scholar] [CrossRef]
  26. Nagurney, A.; Nagurney, L.S. Sustainable supply chain network design: A multicriteria perspective. Int. J. Sustain. Eng. 2010, 3, 189–197. [Google Scholar] [CrossRef]
  27. Sarkis, J.; Helms, M.M.; Hervani, A.A. Reverse logistics and social sustainability. Corp. Soc. Responsib. Environ. Manag. 2010, 17, 337–354. [Google Scholar] [CrossRef]
  28. Pishvaee, M.S.; Rabbani, M.; Torabi, S.A. A robust optimization approach to closed-loop supply chain network design under uncertainty. Appl. Math. Model. 2011, 35, 637–649. [Google Scholar] [CrossRef]
  29. Pishvaee, M.S.; Razmi, J. Environmental supply chain network design using multi-objective fuzzy mathematical programming. Appl. Math. Model. 2012, 36, 3433–3446. [Google Scholar] [CrossRef]
  30. Ramezani, M.; Bashiri, M.; Tavakkoli-Moghaddam, R. A robust design for a closed-loop supply chain network under an uncertain environment. Int. J. Adv. Manuf. Technol. 2013, 66, 825–843. [Google Scholar] [CrossRef]
  31. Zhang, Q.; Shah, N.; Wassick, J.; Helling, R.; van Egerschot, P. Sustainable supply chain optimisation: An industrial case study. Comput. Ind. Eng. 2014, 74, 68–83. [Google Scholar] [CrossRef]
  32. Sangwan, K.S. Key Activities, Decision Variables and Performance Indicators of Reverse Logistics. Procedia CIRP 2017, 61, 257–262. [Google Scholar] [CrossRef]
  33. Bal, A.; Satoglu, S.I. A goal programming model for sustainable reverse logistics operations planning and an application. J. Clean. Prod. 2018, 201, 1081–1091. [Google Scholar] [CrossRef]
  34. Zarbakhshnia, N.; Kannan, D.; Kiani Mavi, R.; Soleimani, H. A novel sustainable multi-objective optimization model for forward and reverse logistics system under demand uncertainty. Ann. Oper. Res. 2020, 295, 843–880. [Google Scholar] [CrossRef]
  35. Richnák, P.; Gubová, K. Green and Reverse Logistics in Conditions of Sustainable Development in Enterprises in Slovakia. Sustainability 2021, 13, 581. [Google Scholar] [CrossRef]
  36. Gholizadeh, H.; Goh, M.; Fazlollahtabar, H.; Mamashli, Z. Modelling uncertainty in sustainable-green integrated reverse logistics network using metaheuristics optimization. Comput. Ind. Eng. 2022, 163, 107828. [Google Scholar] [CrossRef]
  37. Shi, Y.; Vanhaverbeke, L.; Xu, J. Electric vehicle routing optimization for sustainable kitchen waste reverse logistics network using robust mixed-integer programming. Omega 2024, 128, 103128. [Google Scholar] [CrossRef]
  38. Najm, H.; Asadi-Gangraj, E. Designing a robust sustainable reverse logistics to waste of electrical and electronic equipment: A case study. Int. J. Environ. Sci. Technol. 2024, 21, 1559–1574. [Google Scholar] [CrossRef]
  39. Lloyd, J.; McCarney, S.; Ouhichi, R.; Lydon, P.; Zaffran, M. Optimizing energy for a ‘green’ vaccine supply chain. Vaccine 2015, 33, 908–913. [Google Scholar] [CrossRef]
  40. Duarte, G.; Rolim, C.; Baptista, P. How battery electric vehicles can contribute to sustainable urban logistics: A real-world application in Lisbon, Portugal. Sustain. Energy Technol. Assess. 2016, 15, 71–78. [Google Scholar] [CrossRef]
  41. Wątróbski, J.; Małecki, K.; Kijewska, K.; Iwan, S.; Karczmarczyk, A.; Thompson, R.G. Multi-Criteria Analysis of Electric Vans for City Logistics. Sustainability 2017, 9, 1453. [Google Scholar] [CrossRef]
  42. Schiffer, M.; Walther, G. Strategic planning of electric logistics fleet networks: A robust location-routing approach. Omega 2018, 80, 31–42. [Google Scholar] [CrossRef]
  43. Zhao, Z.; Li, X.; Zhou, X. Distribution Route Optimization for Electric Vehicles in Urban Cold Chain Logistics for Fresh Products under Time-Varying Traffic Conditions. Math. Probl. Eng. 2020, 2020, 9864935. [Google Scholar] [CrossRef]
  44. Akram, M.N.; Abdul-Kader, W. Electric vehicle battery state changes and reverse logistics considerations. Int. J. Sustain. Eng. 2021, 14, 390–403. [Google Scholar] [CrossRef]
  45. Zhao, C.; Ma, X.; Wang, K. The electric vehicle promotion in the cold-chain logistics under two-sided support policy: An evolutionary game perspective. Transp. Policy 2022, 121, 14–34. [Google Scholar] [CrossRef]
  46. Butt, A.S.; Ali, I.; Govindan, K. The role of reverse logistics in a circular economy for achieving sustainable development goals: A multiple case study of retail firms. Prod. Plan. Control. 2024, 35, 1490–1502. [Google Scholar] [CrossRef]
  47. Ala, A.; Deveci, M.; Bani, E.A.; Sadeghi, A.H. Dynamic capacitated facility location problem in mobile renewable energy charging stations under sustainability consideration. Sustain. Comp. Infor. Syst. 2024, 41, 100954. [Google Scholar]
  48. Li, Y.; Lim, M.K.; Xiong, W.; Huang, X.; Shi, Y.; Wang, S. An electric vehicle routing model with charging stations consideration for sustainable logistics. Ind. Manag. Data Syst. 2024, 124, 1076–1106. [Google Scholar] [CrossRef]
  49. Bertsimas, D.; Sim, M. The Price of Robustness. Oper. Res. 2004, 52, 35–53. [Google Scholar] [CrossRef]
  50. Torabi, S.; Hassini, E. An interactive possibilistic programming approach for multiple objective supply chain master planning. Fuzzy Sets Syst. 2008, 159, 193–214. [Google Scholar] [CrossRef]
  51. Ben-Tal, A.; El Ghaoui, L.; Nemirovski, A. Robust Optimization; Princeton University Press: Princeton, NJ, USA, 2009; Volume 28. [Google Scholar]
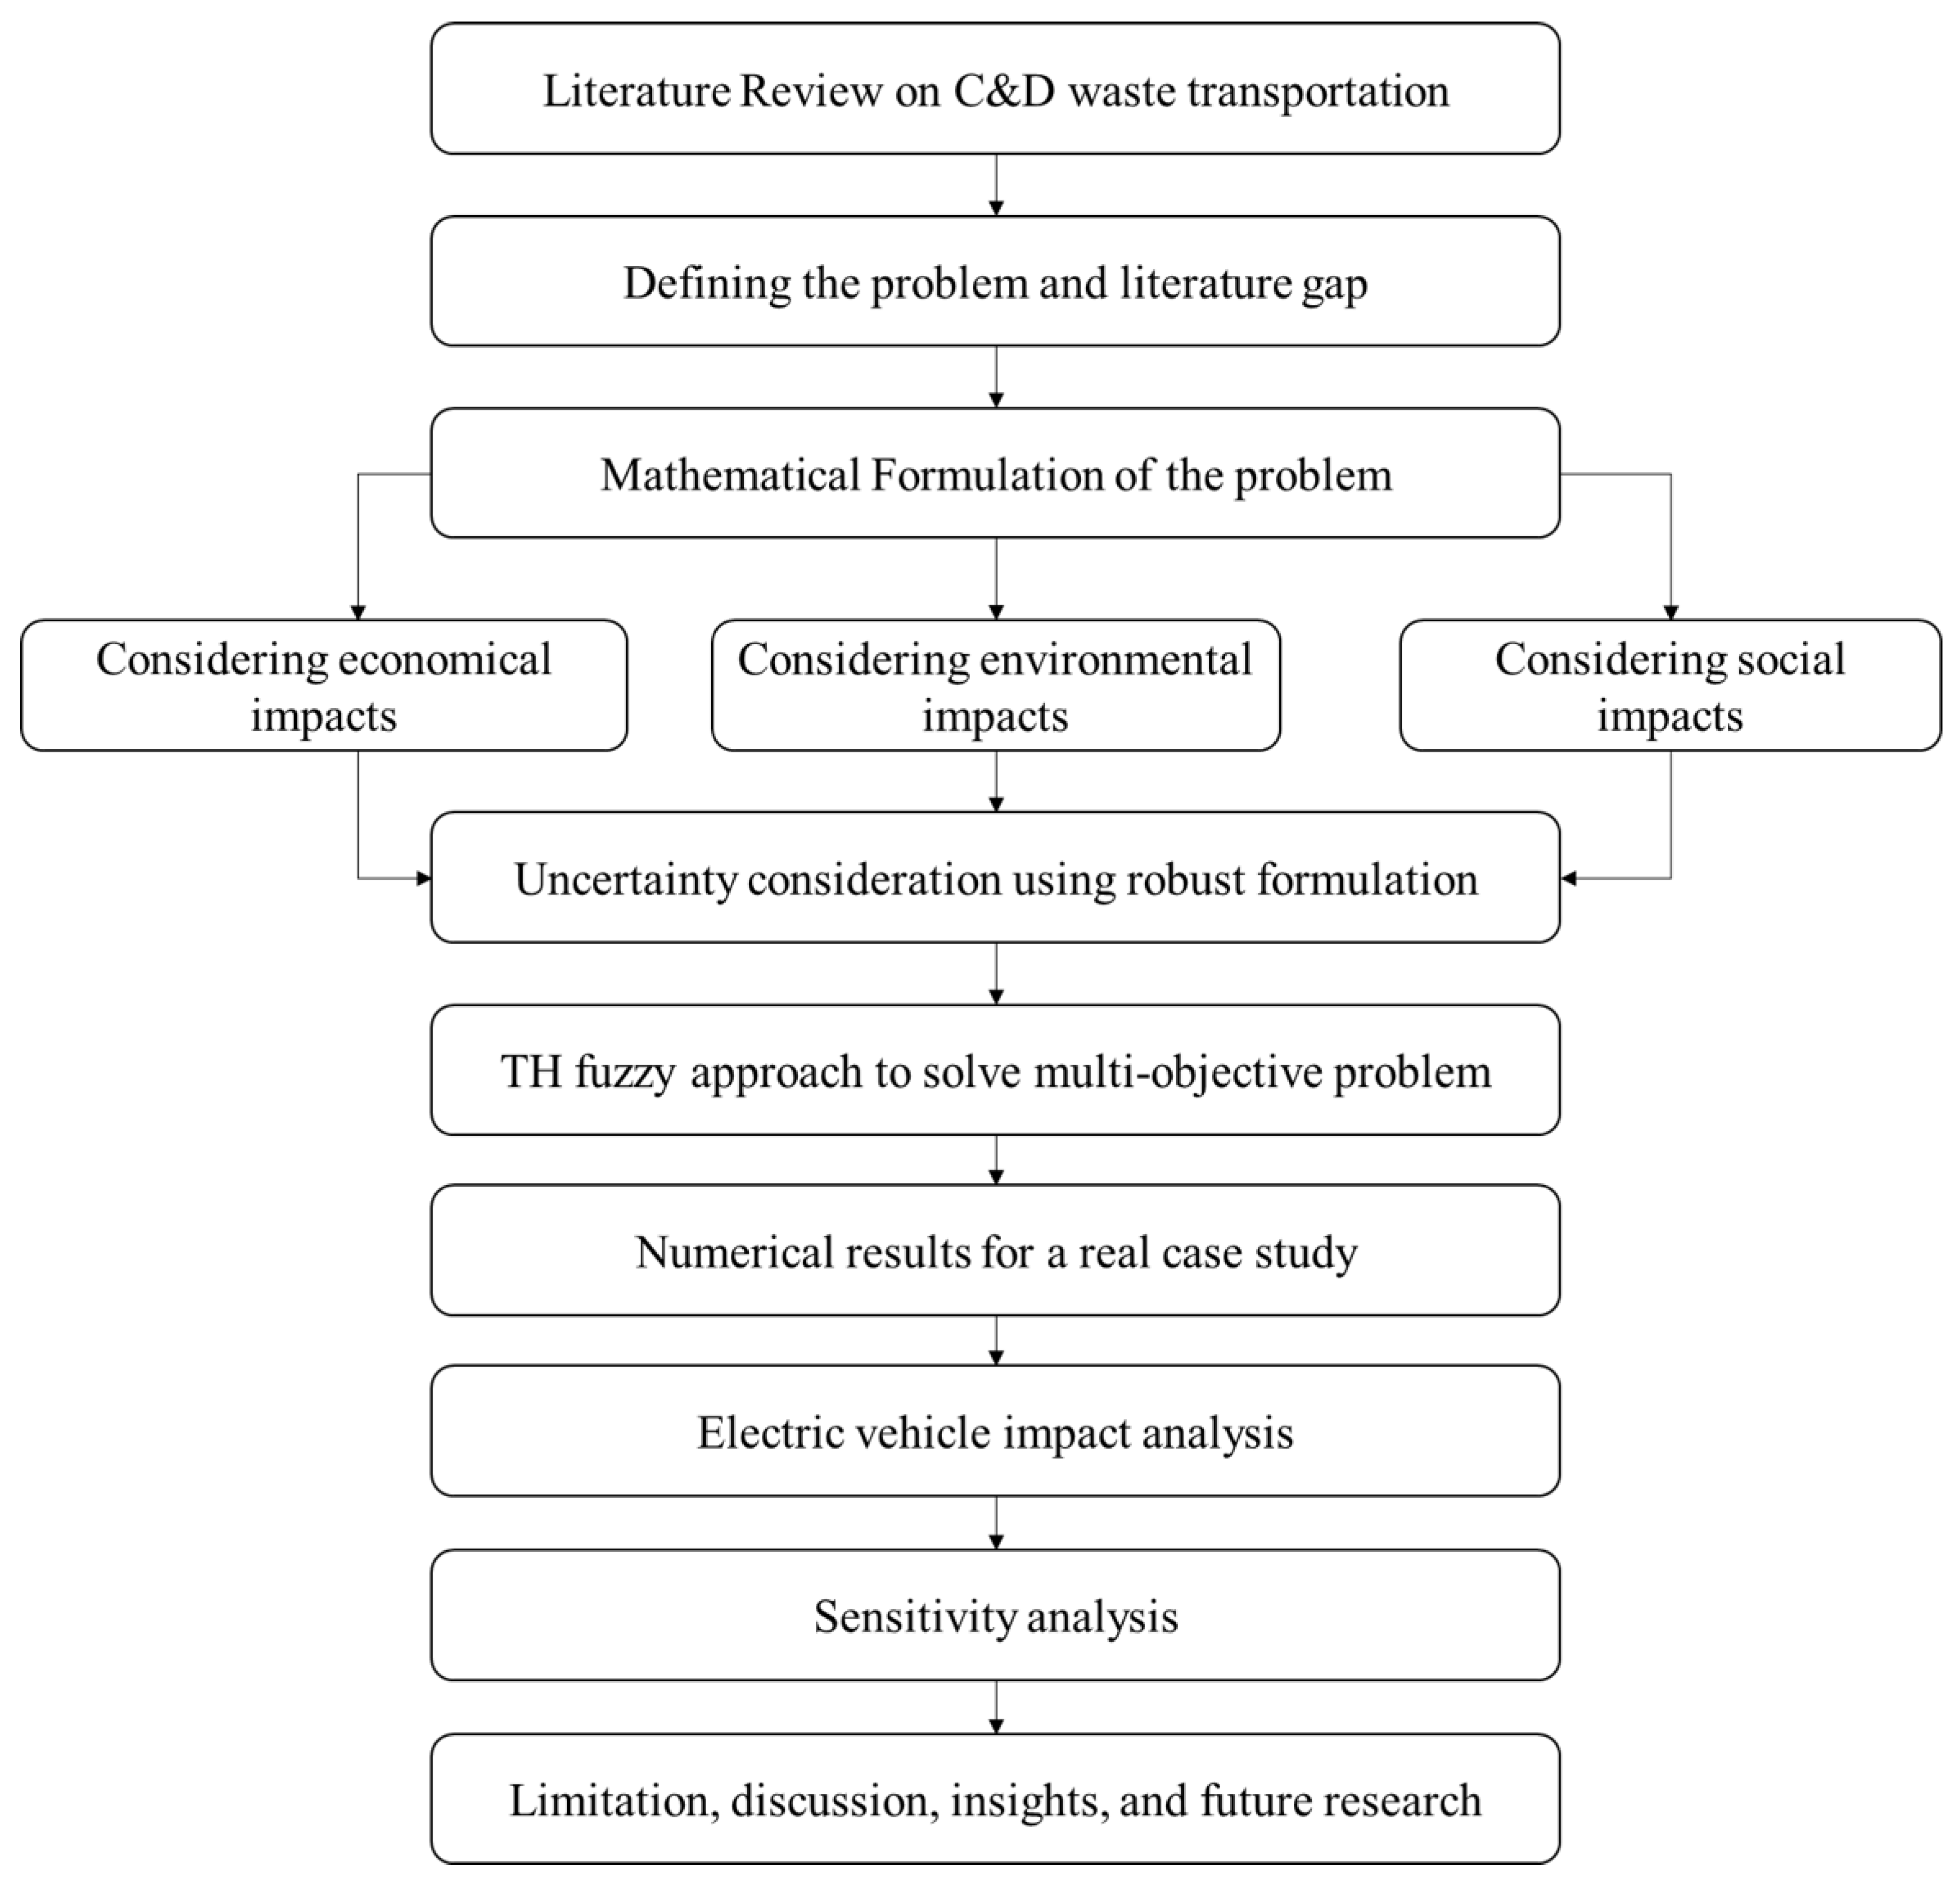
Figure 1. Overview of the methodology and experiments of this study.
Urbansci 08 00171 g001
Figure 2. Illustration of the proposed reverse logistics network.
Urbansci 08 00171 g002
Figure 3. Linear membership function for Z 1 and Z 2 .
Urbansci 08 00171 g003
Figure 4. Linear membership function for Z 3 .
Urbansci 08 00171 g004
Figure 5. A graphical illustration of the case study in Tehran.
Urbansci 08 00171 g005
Figure 6. λ in correspondence to different decision strategies.
Urbansci 08 00171 g006
Figure 7. Power consumption of electric vehicles in different strategies.
Urbansci 08 00171 g007
Figure 8. Fixed operation costs in different strategies.
Urbansci 08 00171 g008
Figure 9. Sensitivity analysis of γ and λ .
Urbansci 08 00171 g009
Figure 10. Sensitivity analysis of γ correspondence with related costs and power consumption.
Urbansci 08 00171 g010
Figure 11. Cost and power consumption related to different values of Γ .
Urbansci 08 00171 g011
Figure 12. Sensitivity analysis of Γ and λ .
Urbansci 08 00171 g012
Table 1. Literature on the C&D waste management supply chain and comparison with this study.
PaperObjectiveParameter TypeAspectsSoloution ApproachModelTransportation Vehicle
MultiSingleDeterministicStochasticEconomicalSocialEnvironmentalPolicyExactHueriticsMILPMINLPElectricDiesel
Lin et al. (2020) [16]
Hannan et al. (2018) [17]
Pan et al. (2020) [18]
Ahmed et al. (2021) [19]
Shi et al. (2020) [20]
Yu et al. (2017) [21]
Liu et al. (2024) [22]
Halvorsen et al. (2023) [23]
This Paper
Table 2. Sets of the proposed formulation.
NameDescription
VSet of construction sites; v { 1 , , V }
LSet of labs; l { 1 , , L }
L F Set of landfills; l   f { 1 , , L F }
I C Set of incineration centers; i c { 1 , , I C }
O C Set of recycle centers; o c { 1 , , O C }
Table 3. Parameters of the proposed formulation.
NameDescription
W G v Waste generated by construction sites v
L C l Capacity of lab l
L F C l f Capacity of landfill l   f
I C C i c Capacity of incineration center i c
C U L l Unit operating cost of lab l
C F L l Fixed cost of lab l
C U L F l f Unit cost of landfill l   f
C F L F l f Fixed cost of landfill l   f
C U I C i c Unit cost of incineration center i c
C F I C i c Fixed cost of incineration center i c
C U O C o c Unit cost of recycling center o c
C F O C o c Fixed cost of recycling center o c
T D V v , l Transportation distance from v to l
T D L F l , l f Transportation distance from l to l   f
T D L I l , i c Transportation distance from l to i c
T D L O l , o c Transportation distance from l to o c
T C E V Unit transportation cost for electric vehicles
T C E T Unit transportation cost for electric trucks
α Proportion of recyclable material
θ Proportion of non-recyclable material
E V C Electric vehicle capacity
E T C Electric truck capacity
L E V Electric vehicle distance limit
L E T Electric truck distance limit
L I M V Electric vehicle number limit
L I M T Electric truck number limit
T E C S Electric truck power consumption in km
V E C S Electric vehicle power consumption in km
E R L l Employment of lab l
E R I i c Employment of incineration center i c
E R O o c Employment of recycling center o c
E R L F l f Employment of landfill l   f
Table 4. Desicion variables of the proposed formulation.
NameDescription
g l 1 if lab l is used; 0 otherwise.
h l f 1 if landfill lf is used; 0 otherwise.
z i c 1 if incineration center ic is used; 0 otherwise.
o o c 1 if recycling centers are used; 0 otherwise.
q v l v , l amount of waste transported from v to l
q l f l , l f amount of waste transported from l to l   f
q l i l . i c amount of waste transported from l to i c
q l o l , o c amount of waste transported from l to o c
n l e v v , l number of electric vehicles used to transport waste from v to l
n l f e v l , l f number of electric vehicles used to transport waste from l to l   f
n i c e v l , i c number of electric vehicles used to transport waste from l to i c
n o c e v l , o c number of electric vehicles used to transport waste from l to o c
n l e t v , l number of electric trucks used to transport waste from l to l   f
n l f e t l , l f number of electric trucks used to transport waste from l to l   f
n i c e t l , i c number of electric trucks used to transport waste from l to i c
n o c e t l , o c number of electric trucks used to transport waste from l to o c
Table 5. Detailed information about the demolition sites.
SitesCategoryNo. FloorsConcreteSteelBrickDrywallSquare FeetTotal Weight in Pounds
1Hospital1265%20%10%5%6900173,052,000
2Speciality Hospital680%15%5%5%800096,480,000
3Speciality Clinic970%20%10%10%7500147,150,000
4Hospital960%30%5%5%5400118,827,000
5Hospital775%15%5%5%9000121,905,000
6Hospital1280%5%5%10%420077,364,000
7Speciality Hospital1750%30%10%10%6000241,740,000
8Sports Clinic280%10%10%0%12,00043,440,000
9Speciality Hospital980%15%5%5%8000144,720,000
10Hospital360%30%10%0%18,000134,460,000
11Hospital975%15%5%5%500087,075,000
Table 6. Detailed information about waste management facilities.
LandfillsCapacity (Pounds)LabsCapacity (Pounds)IC CenterCapacity (Pounds)
17,900,0001190,000,0001123,900,000
229,500,0002230,000,0002432,800,000
376,400,00031,850,000,0003321,700,000
49,500,4304465,000,000--
Table 7. The distance between construction sites and labs.
Site/Lab (km)1234567891011
116111215914171410296
2252219171714151152111
3272721152013108101016
44347393240312729341538
Table 8. The distance between landfills and labs.
Labs/Landfills (km)1234
149806928
239685727
340645238
452604862
Table 9. The distance between recycling centers and labs.
Labs/Recycling Centers (km)1234
12141241
2338433
340191522
45943403
Table 10. The distance between incineration centers and labs.
Labs/Incineration Centers (km)123
1143345
2212435
3321325
4561212
Table 11. Different LEED policies and the parameter of solutions related to the policy implemented.
PolicyRecycledDisposedVehiclesTrucksPower Consumption (wh)Cost (Rials)CO2 Emission (g) λ
125%75%76,996358161,625,600205,198,000,00055,428,2000.89
250%50%90,000833363,030,500305,857,000,00050,197,9500.48
375%25%78,29999236,678,900429,797,000,00058,875,0500.68
Disclaimer/Publisher’s Note: The statements, opinions and data contained in all publications are solely those of the individual author(s) and contributor(s) and not of MDPI and/or the editor(s). MDPI and/or the editor(s) disclaim responsibility for any injury to people or property resulting from any ideas, methods, instructions or products referred to in the content.