Abstract
In Togo, and especially in the peri-urban areas of Greater Lomé, flood hazards and their effects on communities and ecosystems have increased in recent years due to global changes. This is predominantly due to increasing urbanization and the changing climate. This study explores the application of remote sensing, geographic information system (GIS) and analytical hierarchy processes (AHP) for flood hazard mapping in Greater Lomé. Maps of seven (7) drivers of flood hazards, namely flow accumulation, rainfall intensity, geology and soil, land use, slope, elevation and distance from the drainage network, were prepared by integrating remote sensing data into a GIS environment. The weight of each factor was estimated via the AHP method and used in the estimation of the flood hazard index (FHI). The results show that there is a high or very high susceptibility of flooding in 53.4% of the Greater Lomé suburbs, while there is a moderate to low susceptibility of flooding in about 46.59% of it, and 0.01% of the study area. The generated map is a useful tool for decision-makers and practitioners in charge of flood risk and disaster management when developing plans to reduce the risk of both current and future floods in the study area.
1. Introduction
According to the sixth (6) assessment report of the Intergovernmental Panel on Climate Change (IPCC), West African drought and flood events are expected to worsen by the end of the twenty-first century [1]. Floods are regarded as being among the most destructive hazards associated with climate change, which affect poor countries due to their high vulnerability [2]. They are characterized by the submersion of usually dry areas in water. Over the past two decades, West Africa has been subject to floods with catastrophic consequences in terms of loss of human lives and material damages. From June to October 2022, floods caused by heavy rains killed more than 600 people in Nigeria. On September 18 of the same year, floods caused the death of 159 people in Niger. In Togo, the floods of 2007 and 2010 were their most devastating, with 23 and 21 people killed, respectively. The 2008 floods not only resulted in the loss of life but also caused several bridges to collapse, including the Amakpapé on National Road 1, creating serious transportation bottlenecks for deliveries to Greater Lomé, the capital.
In Togo, floods are mainly caused by runoff, resulting from intense or prolonged rainfalls, overflows of watercourses and rising of water tables, as well as a lack of critical infrastructures such as proper drainage channels. In the autonomous district of Greater Lomé, climate change, associated with rapid urbanization and a galloping demography, raises fears of worsening flooding [3]. The first major consequence of urbanization on the hydrological cycle is the waterproofing of the soil. In fact, covering the ground with concrete or other materials over considerable areas results in a decrease in the infiltration rate of rainwater into the ground and therefore an increase in runoff. In urban settings, for example, research has shown that the greatest influences on surface runoff volumes are impervious cover and road density [4].
Quintessentially, the need for decision support tools for flood hazard assessment is no longer in doubt among those responsible for risk and disaster management, urban managers and decision-makers. Different tools and methods like remote sensing and hydrodynamic modeling, as well as the combination of remote sensing and geographic information systems (GIS), have been used to map flood hazards. Remote sensing is useful to obtain fine resolution images of flooded areas [5,6]. However, optical imagery often does not adequately detect flooded areas under dense vegetation cover or in the event of very cloudy skies during floods [7,8]. Hydrodynamic modeling is a technique commonly used to numerically simulate and/or predict the flood’s extent via the use of 1D; 2D; 1D–2D; or 3D hydraulic models [9,10]. Nevertheless, hydraulic models require a large amount of data which is often difficult to obtain in certain regions due to the lack of monitoring stations in both urban and rural areas [9]. The incorporation of remote sensing data into the GIS is the most widely used method for mapping flood hazards. Many studies that combine GIS and multi-criteria analysis (MCDA) methods to characterize flood hazards have been carried out in Africa [11,12], in Asia [13,14] and in Europe [15]. For the same purpose, many other studies applied a combination of GIS and artificial intelligence [16], the flood vulnerability index approach [17], the naive approach of Bayes [18], the bivariate statistical method [19] and logistic regression [20]. Among the MCDA methods, the analytical hierarchy process (AHP) has shown its effectiveness in flood susceptibility mapping. For instance, ref. [21] integrated remote sensing data, the GIS method and the AHP method to map flood susceptibility in Okazaki City (Japan) and generated a high-accuracy tool for physical flood vulnerability prediction with 95% of the area under the curve. Ref. [22] combined AHP and GIS methods to predict the magnitude of flood risk areas in the Eldoret municipality (Kenya). They obtained a maximum error of less than 8% in the highly vulnerable flood zones. Moreover, ref. [23] integrated AHP and GIS to predict flash flood-prone areas in the Sinai Peninsula (Egypt) and demonstrated an excellent predictive accuracy with a score of 91.6%. Ref. [24] mapped the flood-prone areas in the Taguenit Wadi Watershed (Morocco) using AHP and remote sensing data. Their generated flood hazard map was similar to those of previous historical flood events. As far as Greater Lomé is concerned, it is the first time a combination of remote sensing data, GIS and AHP has been applied to analyze flood susceptibility. The AHP method was developed by ref. [25]. It is a powerful mathematical method that breaks down a complex problem into a hierarchical system, in which binary combinations are established at each level of the hierarchy. Thus, AHP is used in the process of the evaluation and selection of alternatives in various domains such as business, government, military and industrial [25].
The aim of the study is to apply this methodological approach via an integration of remote sensing data and the AHP to identify flood-prone areas in the peri-urban settlements of Greater Lomé. The specific objectives are to:
- Analyze the relative importance of a set of indicators in contributing to flood hazard severity in the study area;
- Develop a flood hazard index model; and
- Derive a flood hazard map for the outskirts of Greater Lomé.
2. Materials and Methods
2.1. Study Area
This study was conducted on the outskirts of Greater Lomé, located in the extreme south-west of Togo and extending along the coast of the Atlantic Ocean between 6° north latitude and 1°15 east longitude (Figure 1). The agglomeration of Lomé covers an area of 280 km2 and is composed of 152 districts which administratively spread into two prefectures, namely Agoè-Nyivé (six municipalities) and Golfe (seven municipalities) (Figure 1). Additionally, there are three (3) geomorphological units, namely the sandy coast, the lagoon depression and the sandy clay plateau. Three main types of soils are predominant in the area under study. These are hydromorphic soils, colluvial and alluvial soils and non-hydromorphic soils [26]. The study area is characterized by a population of 2,188,376 inhabitants [27]; the main economic activities are, essentially, trade and industry.
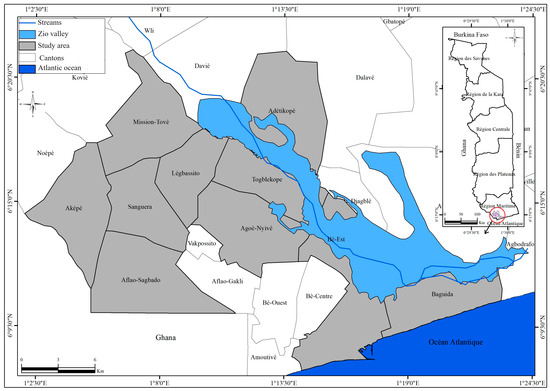
Figure 1.
Geographical location of the study area (data source: National Institute for Statistics, Economic and Demographic Studies).
Four (4) seasons, each lasting from November to March, from April to July, August, for a short dry season, and from September to October, for a short raining season, all characterize the subequatorial climate of the study area (Figure 2).
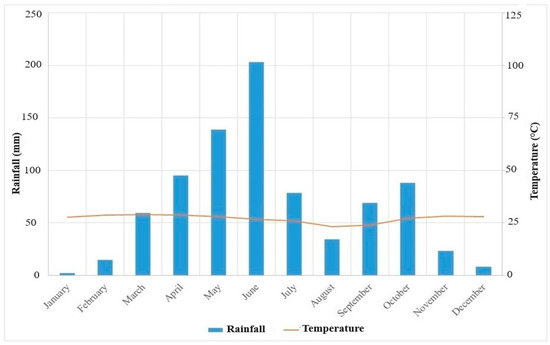
Figure 2.
Climate diagram at the meteorological station of Lomé (1991–2020). data source: National Meteorological Service.
The average annual rainfall is between 800 and 900 mm/year (1991–2020). The maximum temperatures are observed in March and April and vary around 28 °C, while the minimums in August do not drop below 25 °C. The relative humidity varies from 80–90%.
2.2. Data Used
As shown in Table 1, all the data used in the present study are obtained from remote sensing products.

Table 1.
Dataset.
Elevation ranks among the most important factors causing flooding [13,17]. Lower elevated areas are more susceptible to flooding when water moves from upland to lowland. The land-use and land-cover management of any given area remains another of the most important factors [13,28]. It has some influence on the infiltration rate and the surface runoff and, as a result, in the flood generation process. For instance, vegetation type and coverage plays a big role, with trees intercepting and facilitating the infiltration of more rainfall than grasses. This interception and infiltration reduce the flood hazard. Rainfall amount or duration is the most obvious cause of flood in the area under this study [29]. Depending on the antecedent conditions of the soil, heavy or prolonged rainfalls lead to huge amounts of runoff and increase flood hazard. The slope of the land is another factor that affects the occurrence of a flood hazard, as it controls the speed of runoff and infiltration rates [13,28]. When the slope decreases, the velocity of runoff decreases but the volume of overland flow and the susceptibility of flood increase. The areas with higher proximity to rivers are generally more likely to be flooded than those which are located far away from streams, but the threshold distance depends on the characteristics of the river [30]. In the identification of flood-prone areas, among the elements that have frequently been included in numerous earlier studies is flow accumulation [28,31]. This factor shows the overall amount of water flowing from upstream regions into a particular catchment location [31]. Higher flow accumulation values are associated with a higher likelihood of water buildup and, thus, a higher vulnerability to flooding.
2.3. Methods
The flood susceptibility map was generated by combining remote sensing data, GIS and the AHP approach. The whole flowchart shown in Figure 3 lists the processes used in carrying out the flood hazard mapping in this study. The data layers of flow accumulation, slope, distance from the drainage network, land use and cover, rainfall intensity and infiltration rate of the soil were prepared using GIS and remote sensing methods from the spatial data collected from the different sources (see Table 1). The following sections describe the different steps used to derive the flood hazard map.
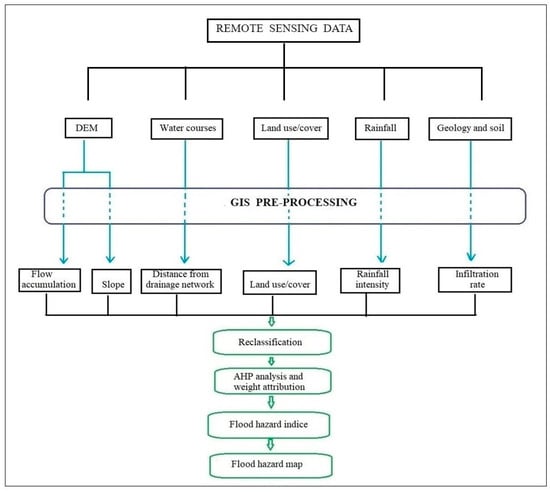
Figure 3.
Flowchart of the methodology.
2.3.1. Preparation of the Drivers of Flood Hazard Layers
In this study, seven (7) drivers of flood hazards were selected based on the study area characteristics, data availability and earlier studies, such as those of refs. [28,29,30,31]. These drivers are as follows: rainfall; soil; land use/land cover (LULC); slope; elevation; distance from the drainage network; and flow accumulation. The rainfall intensity factor was expressed as a Modified Fournier Index (MFI), which is computed using the following equation [32]:
where is the cumulated rainfall of the month and P is the total annual rainfall. In order to create the rainfall factor map, grid daily rainfall data for the period from 2007 to 2021 were downloaded from the United State Geological Survey (USGS) database via the website of the Famine Early Warning Systems Network project (FEWS-NET) and imported in the QGIS software (Version 3.4).
The LULC information was extracted from the Sentinel-2 image through supervised classification using QGIS software while the soil type map was generated by classifying the soil type layers of the Harmonized World Soil Data (HWSD) provided by the Food and Agriculture Organization (FAO). The elevation and slope maps were derived from the DEM of the study area whereas the slope flow accumulation map was generated after filling the DEM map of the study area and creating the flow direction map from the filled DEM map through the QGIS software. The distance to the drainage network map was created by applying a buffer tool into a GIS environment, in conjunction with the existing drainage network. The areas close to the drainage network were regarded to be those located at below 200 m since previous studies considered areas located within distances less than 200 m from the existing drainage network to have a high flood vulnerability level [33,34,35].
It is worth noting that the maps of the seven (7) drivers of flood hazards were reclassified to a same scale, from 1 (very low) to 5 (very high), and resampled to 10 m spatial resolution. The classes of drainage network, elevation and rainfall were created using the method of natural breaks, like in previous studies, because this method is helpful in changing the labels to ordinary scales [27,30]. The LULC classes were estimated from [31], while the slope and soil infiltration rate classes were estimated as suggested, respectively, by [36,37]. Furthermore, given that the research data have different spatial resolutions, a resampling process was conducted. This has been an essential technique in this spatial data processing in order to harmonize the resolutions of the images from different sources for consistent analysis. The bilinear method was used due to its ability to preserve visual continuity as well as to calculate the value of new pixels by a weighted average of its neighboring pixels, ensuring smooth integration. The resolution of the Sentinel-2 image (10 m) served as a reference to adjust the other images.
2.3.2. Application of the AHP Method
Since the different flood drivers do not have the same importance in the flood generation process, the Saaty’s AHP approach was applied to estimate the relative weights of each driver [38]. Due to the possibility of this method to incorporate a consistency test in order to reduce uncertainty in the weighting process, it has attracted interest in several previous studies [11,12,24]. This multi-criteria decision-making method uses a series of pairwise comparison matrices to determine the relative weight of various criteria and options, from which the optimal choice is selected [38]. The relative importance of the criteria is estimated from 1 to 9, from the least important criterion to the most important (Table 2).

Table 2.
Important scales used in the pairwise comparison matrix [24].
So as to calculate the weights of each parameter, the AHP begins by creating a pairwise comparison matrix (M = (. Each numerical value of M represents the relative importance of the ith parameter with respect to the jth parameter. If >1, then the ith parameter is more important than the jth parameter, while if <1, then the ith parameter is less important than the jth parameter. If both parameters have the same importance, then = 1. On the other hand, the mathematical values satisfy the given condition in Equation (2):
After the development of the comparison matrix and the definition of the factor weights, a consistency ratio (CR) was calculated according to Equation (3) proposed by [24]:
where CI is the consistency index and RI is the random index, whose value depends on n, which is the number of criteria (factors). The value of the consistency index was obtained using Equation (4):
where represents the largest eigenvalue of the matrix and n stands for the number of parameters. The constant RI depends on n (Table 3). When CR < 0.1, the assessment is consistent and reliable results can be expected from the AHP model.
CR = CI/RI

Table 3.
Random index used to calculate the consistency ratio [38].
2.3.3. Development of the Flood Hazard Index Model
The flood hazard index (FHI) model proposed in this study considered seven (7) factors, namely: flow accumulation, rainfall, soil, land use, slope, elevation and distance from the drainage network. Based on the estimation of the weights of these different factors and their scores (Table 3), the flood hazard index of each pixel was calculated using Equation (5) [39]:
where is the rank score of each class with respect to the j layer, and represents the weight of the j layer. Furthermore, the FHI was divided into five (5) classes, namely: very low, low, moderate, high and very high.
2.4. Validation of the Flood Hazard Map
In this study, an image of a historical flood was used to verify the flood hazard map using the same methods as in refs. [36,37]. The freely available observed map of the September 2020 flood was downloaded from the Copernicus website (https://sentinels.copernicus.eu/web/sentinel/missions/sentinel-11 (accessed on 4 May 2023)) and superimposed on the GIS-MCDA flood hazard map in order to identify the location of each observed flood point on the derived flood hazard map.
3. Results
This section comprises the study area’s flood hazard index, GIS-based flood hazard map and characteristics of the selected causes of flood hazard. It also includes the validation findings.
3.1. Drivers of Flood Hazards in the Study Area
The classes, ratings and area coverage of the seven (7) drivers of flood hazards, which were combined to identify the flood-prone areas (elevation, land use/land cover, rainfall, slope, soil, distance to the river network and flow accumulation), are compiled in Table 4.

Table 4.
Drivers of flood hazards in the study area.
In the peri-urban areas of Greater Lomé, 7.23% of the area has an elevation between 17 and 40 m (Table 4 and Figure 4). It was discovered that nearly 46% of the area is covered by settlements. Forest areas represent less than 1% of the surface and generally favor infiltration, while agricultural areas (22.9%) allow a higher volume of water to flow as runoff (Table 4 and Figure 5). The spatial distribution of the different classes of rainfall intensity values is shown in Figure 6. Furthermore, the slope class with the lowest degrees, which represents 15.96% of the study area, was assigned the highest score to flood susceptibility (Table 4 and Figure 7). In the study area, the reclassified soil map shows that 37% of the area is characterized by a low infiltration rate (Table 4 and Figure 8) and is more vulnerable to flooding. The pixels located at a distance lower than 200 m were assigned the highest level of flood occurrence. They cover 45.19% of the study area (Table 4 and Figure 9). The class with the highest values of flow accumulation, which covers 0.84% of the study area, was attributed the highest score of flood (Table 4 and Figure 10).
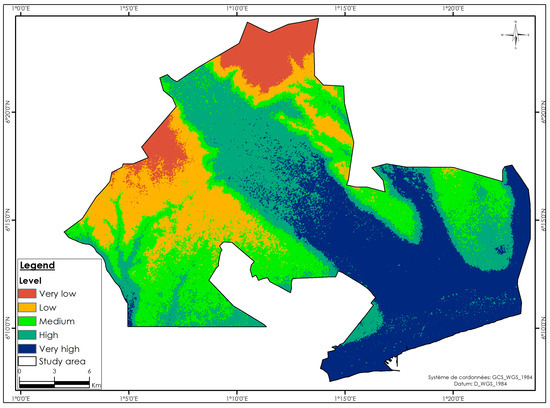
Figure 4.
Elevation map.
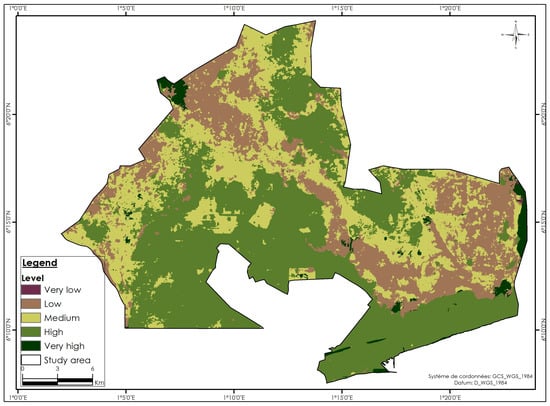
Figure 5.
Land use/land cover map (data source: https://scihub.copernicus.eu/dhus/#/home (Accessed on 4 May 2023)).
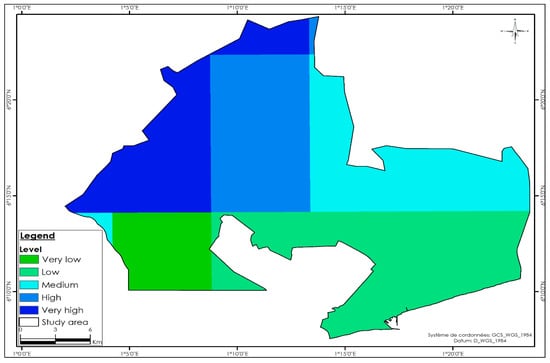
Figure 6.
Rainfall intensity map.
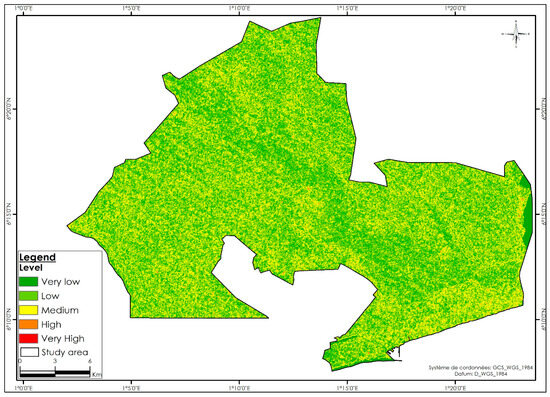
Figure 7.
Map of the slope.
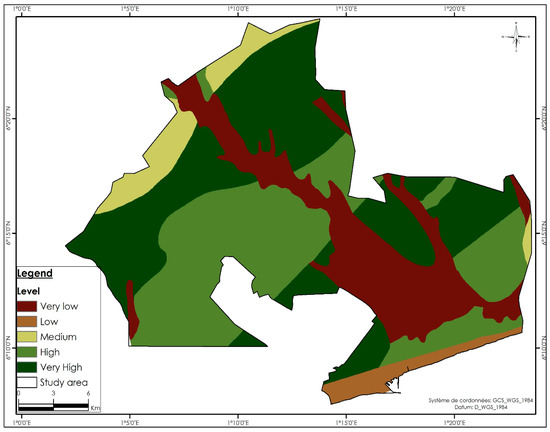
Figure 8.
Map of the soil infiltration rate.
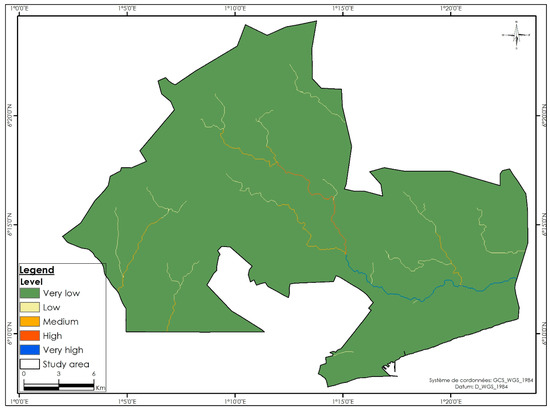
Figure 9.
Map of the flow accumulation.
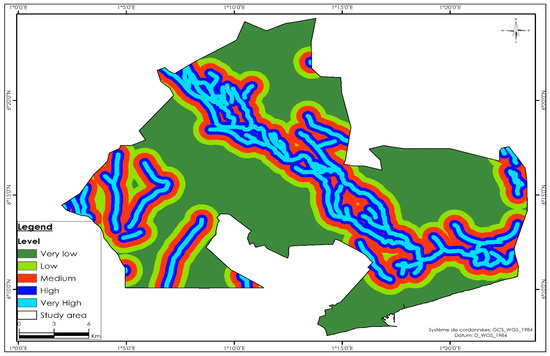
Figure 10.
Map of the distance to the drainage network.
3.2. Factors’ Weights and Flood Hazard Index Model
The purpose of applying the Saaty’s AHP model was to estimate the relative weights of the selected flood-contributing factors. The pairwise comparison matrix and weights of the factors results are presented in Table 5.

Table 5.
Pairwise comparison matrix and the estimated weights.
Moreover, the calculated CR is equal to 0.01. Since the value is lower compared to the threshold value of 0.1, the estimated weights are acceptable and can be used in the flood hazard index which is expressed as follows:
From the weights of the drivers, it is clear that in the study area, the distance from the drainage network has the highest weight, indicating that it has an additional contribution to flood hazard in the area when compared to the other flood factors.
3.3. Flood Hazard Map
The weighted linear combination, as shown in Equation (6), was used to derive the study area’s flood hazard map (Figure 11). It appears that 3% of the periphery of greater Lomé is defined by a very high level of flood hazard, while 51% has a high level. At the same time, 47% of the area is at the moderate susceptibility level and only less than 0.05% at the low level. There is no area which is characterized by a very low level of flood hazard in the study area.
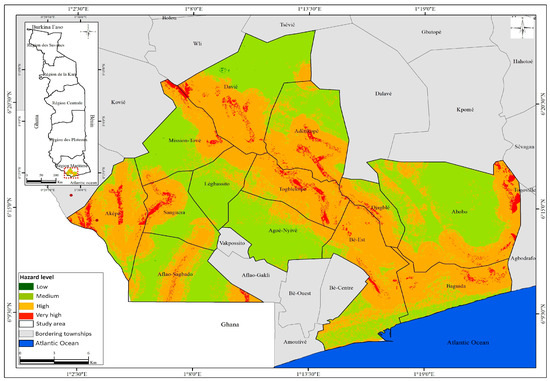
Figure 11.
Flood susceptibility map using AHP model.
In addition, the results revealed that areas with high/very high flood hazard levels are sited near the drainage network, indicating that closeness to the water courses remains the most important factor of flood physical vulnerability in the study area. It is also observed that the level of flood hazard is not evenly distributed. The municipalities of Bè-est, Togblékopé, Adétikopé, Djagblé, Baguida, Aképé and the southern part of Davié host the zones with high to very high flood hazard levels. The southern part of Mission Tové, Légbassitio and Agoè-Nyivé have land with moderate susceptibility to flooding.
The result of the comparison of the derived GIS-based flood hazard and the observed flood area in 2020 are shown in Figure 12. The flooded areas are in blue color. It was found that the major flooding (473 ha) was located in areas classified as showing very high and high susceptibility to floods while 408 ha of flooded areas were observed in the moderate flood susceptibility zone.
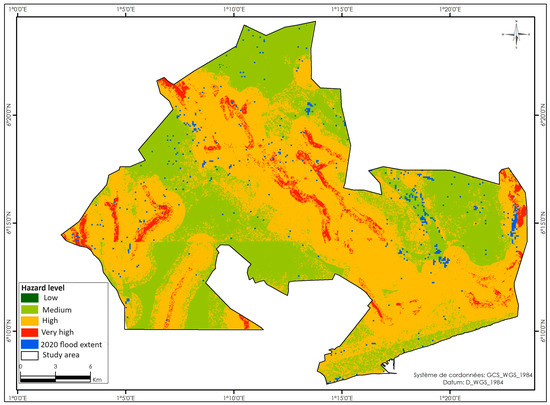
Figure 12.
Comparison of the generated flood hazard map with the 2020 flood extent.
4. Discussion
The flood-prone areas in the peri-urban areas of Greater Lomé were identified via the integration of spatial data of flood drivers, such as topography, land use, rainfall intensity, slope, soil infiltration rate, distance from the drainage network and flow accumulation, into a GIS environment. The relative contribution of each of these drivers was estimated using hierarchical multi-criteria analysis (AHP). The values of flood hazard indices depended on both the selected flood drivers and the associated weights. In the current study, the highest weight was assigned to the distance from the river network factor, as in the study of [39], while others gave the highest contribution in flood hazard to rainfall [11,14], topography [35], flow accumulation [32] and soil [40].
As far as the AHP method is concerned, it has the advantages of being simple and easy to understand. It decomposes a complex decision-making problem into three elements, namely, a goal, criteria and alternative goals [14]. However, the AHP is being criticized for its imbalanced level of judgment and failure to precisely handle the associated uncertainty in carrying out pairwise comparisons [41]. Moreover, psychologists have determined that nine items are the greatest number of objects that a person can reliably rank and compare at the same time; hence, using a maximum of nine criteria is highly recommended [42].
It is worth noting that the results obtained in this study depended on the selected drivers as well as the expert opinions via the relative weights and the quality of the available data. The validation of the proposed map demonstrates that the present study was able to identify flood-prone areas in the peri-urban areas of Greater Lomé in Togo. Thus, the developed flood hazard map is a useful tool to improve flood risk management in the outskirts of Greater Lomé. For instance, it can be used to raise awareness about areas at a high level of flood risk and thus help the communities in developing appropriate measures to increase their resilience. Furthermore, the National Civil Protection Agency and the Red Cross can use the proposed map to plan emergency responses. It is also essential for land-use planning and urban development, so as to reduce future flooding. In fact, during the last two (2) decades, an increase in the frequency of flood hazard has been observed, which is due not only to climate variability but also to anthropogenic factors such as unplanned urbanization, multiplication of aggregate extraction, agricultural practices, etc. [3].
As the present study is the first preliminary mapping of flood-prone areas, the estimation of the flood hazard index considered only seven (7) drivers. Furthermore, the combination of the AHP method with other multi-criteria decision analysis techniques may be useful to increase the efficiency of future works.
5. Conclusions
The study’s objective was to characterize the susceptibility to flooding in the outskirts of Greater Lomé so as to contribute to a better management of floods, which have become increasingly recurrent in the Togolese capital city. Thus, thematic maps of seven (7) flood factors, namely, flow accumulation, rainfall intensity, geology and soil (infiltration capacity), land use, slope, elevation and distance from the drainage network, were prepared by integrating remote sensing data into a GIS environment. In order to take into account the relative contribution of each flood driver in the estimation of the hazard index, the AHP method was applied to estimate the weight of each factor.
The results revealed that around 3% of the outskirts of Greater Lomé faces a very high level of flood susceptibility, while 51% faces a high level. In addition, 47% of the area is defined by a moderate level of susceptibility to flooding while less than 0.05% is defined by a low level. There are practically no areas characterized by a very low level of flood hazard on the outskirts of Greater Lomé. The proposed flood hazard map is an important support for decision-making in terms of efficient flood risk management in the district of Greater Lomé in Togo.
Author Contributions
Conceptualization, T.-H.B. and K.K. (Kossi Komi); methodology, K.K. (Kossi Komi); software, A.K.D.H.; validation, K.A., K.K. (Kossi Komi) and A.K.D.H.; formal analysis, K.A.; investigation, K.S.G.; resources, K.K. (Kossi Komi); data curation, A.K.D.H.; writing—original draft preparation, K.K (Kossi Komi).; writing—review and editing, P.B.O.; visualization, B.P.; supervision, K.K. (Kouami Kokou); project administration, K.A.; funding acquisition, K.A. All authors have read and agreed to the published version of the manuscript.
Funding
This study received financial support from the Regional Center of Excellence on Sustainable Cities in Africa (CERViDA-DOUNEDON) through the funding of the project entitled “Opportunity Study for the Restoration of the Forest Landscape to Fight Against Urban Heat Islands (UHI) in the Context of Climate Change in the Greater Lomé, Maritime Region” (grant No. 5955 credit IDA) and the WASCAL (West African Science Service Center on Climate Change and Adapted Land Use) through the FURIFLOOD project.
Data Availability Statement
Data sources are contained within the article.
Acknowledgments
The authors would like to thank Yvonne WALZ for her contributions in improving the quality of the manuscript. Also, we would like to thank CERViDA-DOUNEDON and WASCAL for their financial support.
Conflicts of Interest
The authors declare no conflicts of interest.
References
- IPCC. Climate Change 2022: Impacts, Adaptation, and Vulnerability. In Contribution of Working Group II to the Sixth Assessment Report of the Intergovernmental Panel on Climate Change; Pörtner, H.-O., Roberts, D.C., Tignor, M., Poloczanska, E.S., Mintenbeck, K., Alegría, A., Craig, M., Langsdorf, S., Löschke, S., Möller, V., et al., Eds.; Cambridge University Press: Cambridge, UK; New York, NY, USA, 2022; p. 3056. [Google Scholar] [CrossRef]
- Ibeanu, C.; Ghadiri Nejad, M.; Ghasemi, M. Developing Effective Project Management Strategy for Urban Flood Disaster Prevention Project in EDO State Capital, Nigeria. Urban Sci. 2023, 7, 37. [Google Scholar] [CrossRef]
- Klassou Selom, K. L’influence humaine dans l’origine et la gravite des inondations au Togo: Cas de l’amenagement de l’espace dans la grande banlieue Nord de Lomé (Togblé-Adétikopé). Rev. Géographie Trop. d’Environ. 2014, 2, 41–53. [Google Scholar]
- Wijayawardana, N.; Abenayake, C.; Jayasinghe, A.; Dias, N. An Urban Density-Based Runoff Simulation Framework to Envisage Flood Resilience of Cities. Urban Sci. 2023, 7, 17. [Google Scholar] [CrossRef]
- Sajjad, A.; Lu, J.; Chen, X.; Chisenga, C.; Mazhar, N. Rapid assessment of riverine flood inundation in Chenab floodplain using remote sensing techniques. Geoenvironmental Disasters 2023, 10, 9. [Google Scholar] [CrossRef]
- Baghermanesh, S.S.; Jabari, S.; McGrath, H. Urban Flood Detection Using TerraSAR-X and SAR Simulated Reflectivity Maps. Remote Sens. 2022, 14, 6154. [Google Scholar] [CrossRef]
- Sanyal, J.; Lu, X.X. Application of Remote Sensing in Flood Management with Special Reference to Monsoon Asia: A Review. Nat. Hazards 2004, 33, 283–301. [Google Scholar] [CrossRef]
- Marti-Cardona, B.; Lopez-Martinez, C.; Dolz-Ripolles, J.; Bladè-Castellet, E. ASAR Polarimetric, Multi-Incidence Angle and Multitemporal Characterization of Doñana Wetlands for Flood Extent Monitoring. Remote Sens. Environ. 2010, 114, 2802–2815. [Google Scholar] [CrossRef]
- Komi, K.; Neal, J.; Trigg, A.M.; Diekkrüger, B. Modelling of flood hazard extent in data sparse areas: A case study of the Oti River basin, West Africa. J. Hydrol. Reg. Stud. 2017, 10, 122–132. [Google Scholar] [CrossRef]
- Arrault, A.; Finaud-Guyot, P.; Archambeau, P.; Bruwier, M.; Erpicum, S.; Pirotton, M.; Dewals, B. Hydrodynamics of long-duration urban floods: Experiments and numerical modelling. Nat. Hazards Earth Syst. Sci. 2016, 16, 1413–1429. [Google Scholar] [CrossRef]
- Danumah, J.H.; Odai, S.N.; Saley, B.M.; Szarzynski, J.; Thiel, M.; Kwaku, A.; Kouame, F.K.; Akpa, L.Y. Flood Risk Assessment and Mapping in Abidjan District using Multi-Criteria Analysis (AHP) Model and Geoinformation Techniques, (côte d’ivoire). Geoenvironmental Disasters 2016, 3, 10. [Google Scholar] [CrossRef]
- Komi, K.; Amisigo, A.B.; Diekkrüger, B. Integrated flood risk assessment of rural communities in the Oti River Basin. Hydrology 2016, 3, 42. [Google Scholar] [CrossRef]
- Alarifi, S.S.; Abdelkareem, M.; Abdalla, F.; Alotaibi, M. Flash Flood Hazard Mapping Using Remote Sensing and GIS Techniques in Southwestern Saudi Arabia. Sustainability 2022, 14, 14145. [Google Scholar] [CrossRef]
- Allafta, H.; Opp, C. GIS-based multi-criteria analysis for flood prone areas mapping in the trans-boundary Shatt Al-Arab basin, Iraq-Iran, Geomatics. Nat. Hazards Risk 2021, 12, 2087–2116. [Google Scholar] [CrossRef]
- Ekmekcioğlu, Ö.; Koc, K.; Özger, M. District based flood risk assessment in Istanbul using fuzzy analytical hierarchy process. Stoch. Env. Res. Risk Assess. 2021, 35, 617–637. [Google Scholar] [CrossRef]
- Antzoulatos, G.; Kouloglou, I.; Bakratsas, M.; Moumtzidou, A.; Gialampoukidis, I.; Karakostas, A.; Lombardo, F.; Fiorin, R.; Norbiato, D.; Ferri, M. Flood Hazard and Risk Mapping by Applying an Explainable Machine Learning Framework Using Satellite Imagery and GIS Data. Sustainability 2022, 14, 3251. [Google Scholar] [CrossRef]
- Oyedele, P.; Kola, E.; Olorunfemi, F.; Walz, Y. Understanding Flood Vulnerability in Local Communities of Kogi State, Nigeria, Using an Index-Based Approach. Water 2022, 14, 2746. [Google Scholar] [CrossRef]
- Singha, C.; Swain, K.C.; Meliho, M.; Abdo, H.G.; Almohamad, H.; Al-Mutiry, M. Spatial Analysis of Flood Hazard Zoning Map Using Novel Hybrid Machine Learning Technique in Assam, India. Remote Sens. 2022, 14, 6229. [Google Scholar] [CrossRef]
- Tehrany, M.S.; Pradhan, B.; Jebur, M.N. Remote sensing data reveals eco-environmental changes in urban areas of Klang Valley, Malaysia: Contribution from object based analysis. J. Indian. Soc. Remote 2013, 41, 981–991. [Google Scholar] [CrossRef]
- Bilal, Ö.; Osman, O. Flood susceptibility mapping by best–worst and logistic regression methods in Mersin, Turkey. Environ. Sci. Pollut. Res. 2023, 30, 45151–45170. [Google Scholar] [CrossRef]
- Rimba, B.A.; Setiawati, D.M.; Sambah, B.A.; Fusanori Miura, F. Physical Flood Vulnerability Mapping Applying Geospatial Techniques in Okazaki City, Aichi Prefecture, Japan. Urban Sci. 2017, 1, 7. [Google Scholar] [CrossRef]
- Ouma, Y.O.; Tateishi, R. Urban Flood Vulnerability and Risk Mapping Using Integrated Multi-Parametric AHP and GIS: Methodological Overview and Case Study Assessment. Water 2014, 6, 1515–1545. [Google Scholar] [CrossRef]
- Shawky, M.; Hassan, Q.K. Geospatial Modeling Based-Multi-Criteria Decision-Making for Flash Flood Susceptibility Zonation in an Arid Area. Remote Sens. 2023, 15, 2561. [Google Scholar] [CrossRef]
- Saaty, T.L.; Vargas, L.G. Inconsistency and rank preservation. J. Math. Psychol. 1984, 28, 205–214. [Google Scholar] [CrossRef]
- Ikirri, M.; Faik, F.; Echogdali, F.Z.; Antunes, I.M.H.R.; Abioui, M.; Abdelrahman, K.; Fnais, M.S.; Wanaim, A.; Id-Belqas, M.; Boutaleb, S.; et al. Flood Hazard Index Application in Arid Catchments: Case of the Taguenit Wadi Watershed, Lakhssas, Morocco. Land 2022, 11, 1178. [Google Scholar] [CrossRef]
- Canco, I.; Kruja, D.; Iancu, T. AHP, a Reliable Method for Quality Decision Making: A Case Study in Business. Sustainability 2021, 13, 13932. [Google Scholar] [CrossRef]
- Sombroek, W.; Sims, D. Planning for sustainable use of land resources: Towards a new approach. Background Paper to FAO’s Task Managership for Chapter 10 of Agenda 21 of the United Nations Conference on Environment and Development (UNCED). Available online: https://api.semanticscholar.org/CorpusID:127415754%7D (accessed on 2 July 2024).
- INSEED. Résultats Définitifs du RGPH-5 de Novembre 2022, République Togolaise. 2023. Available online: https://www.togofirst.com/images/2023/RECENSEMENT_RESULTATS_.pdf (accessed on 8 March 2023).
- Negese, A.; Worku, D.; Shitaye, A.; Getnet, H. Potential flood-prone area identification and mapping using GIS-based multi-criteria decision-making and analytical hierarchy process in Dega Damot district, northwestern Ethiopia. Appl. Water Sci. 2022, 12, 255. [Google Scholar] [CrossRef]
- Komi, K. Flood susceptibility mapping using the analytical hierarchy process method and geographic information system: Application to the Savannah Region, Togo. In Mitigating the Impact of Extreme Natural Events in Developing Countries; Durrheim, J.R., Sewwandi, N.G.B., NAM Science & Technology Centre, Eds.; Daya Publishing House: New Delhi, India, 2019; pp. 53–62. ISBN 978-93-88982-16-0(HB). [Google Scholar]
- Senanou, G.K.; Ayarema, A.; Ouro-Djobo E., S.; Sonnou, T.; Kouami, K. Projection of intensity duration frequency curves in a context of climate change in the city of Lome (West Africa). Int. J. Adv. Res. 2019, 7, 678–692. [Google Scholar] [CrossRef]
- Kazakis, N.; Kougias, I.; Patsialis, T. Assessment of flood hazard areas at a regional scale using an index-based approach and Analytical Hierarchy Process: Application in Rhodope–Evros region, Greece. Sci. Total Environ. 2015, 538, 555–563. [Google Scholar] [CrossRef]
- Arnoldus, H.M.J. An Approximation of the Rainfall Factor in the Universal Soil Loss Equation. In Assessment of Erosion; De Boodt, M., Gabriels, D., Eds.; John Wiley and Sons: New York, NY, USA, 1980; pp. 127–132. [Google Scholar]
- Mahmoud, S.H.; Gan, T.Y. Multi-criteria approach to develop flood susceptibility maps in arid regions of Middle East. J. Clean. Prod. 2018, 196, 216–229. [Google Scholar] [CrossRef]
- Luu, C.; Bui, Q.D.; Costache, R.; Nguyen, L.T.; Nguyen, T.T.; Van Phong, T.; Van Le, H.; Pham, B.T. Flood-prone area mapping using machine learning techniques: A case study of Quang Binh province, Vietnam. Nat. Hazards 2021, 108, 3229–3251. [Google Scholar] [CrossRef]
- Chowdhuri, I.; Pal, S.C.; Chakrabortty, R. Flood susceptibility mapping by ensemble evidential belief function and binomial logistic regression model on river basin of eastern India. Adv. Space Res. 2020, 65, 1466–1489. [Google Scholar] [CrossRef]
- Rimba, A.B.; Chapagain, S.K.; Masago, Y.; Fukushi, K.; Mohan, G. Investigating Water Sustainability and Land Use/Land Cover Change (LULC) As the Impact of Tourism Activity in Bali, Indonesia. In Proceedings of the IEEE International Geoscience and Remote Sensing Symposium, IGARSS 2019, Yokohama, Japan, 28 July–2 August 2019; pp. 6531–6534. [Google Scholar] [CrossRef]
- Saaty, T.L. Decision Making with the Analytic Hierarchy Process. Int. J. Serv. Sci. 2008, 1, 83–98. [Google Scholar] [CrossRef]
- Dash, P.; Sar, J. Identification and validation of potential flood hazard area using GIS-based multi-criteria analysis and satellite data-derived water index. J. Flood Risk Manag. 2020, 13, e12620. [Google Scholar] [CrossRef]
- Demek, J. Manual of Detailed Geomorphological Map-Ping; Academia: Prague, Czech Republic, 1972; p. 320. [Google Scholar]
- Brouwer, C. Gestion des eaux en irrigation. In Méthodes d’Irrigation; FAO: Rome, Italy, 1990; 75p. [Google Scholar]
- Shuaibu, A.; Hounkpè, J.; Bossa, Y.A.; Kalin, R.M. Flood Risk Assessment and Mapping in the Hadejia River Basin, Nigeria, Using Hydro-Geomorphic Approach and Multi-Criterion Decision-Making Method. Water 2022, 14, 3709. [Google Scholar] [CrossRef]
Disclaimer/Publisher’s Note: The statements, opinions and data contained in all publications are solely those of the individual author(s) and contributor(s) and not of MDPI and/or the editor(s). MDPI and/or the editor(s) disclaim responsibility for any injury to people or property resulting from any ideas, methods, instructions or products referred to in the content. |
© 2024 by the authors. Licensee MDPI, Basel, Switzerland. This article is an open access article distributed under the terms and conditions of the Creative Commons Attribution (CC BY) license (https://creativecommons.org/licenses/by/4.0/).