1. Background
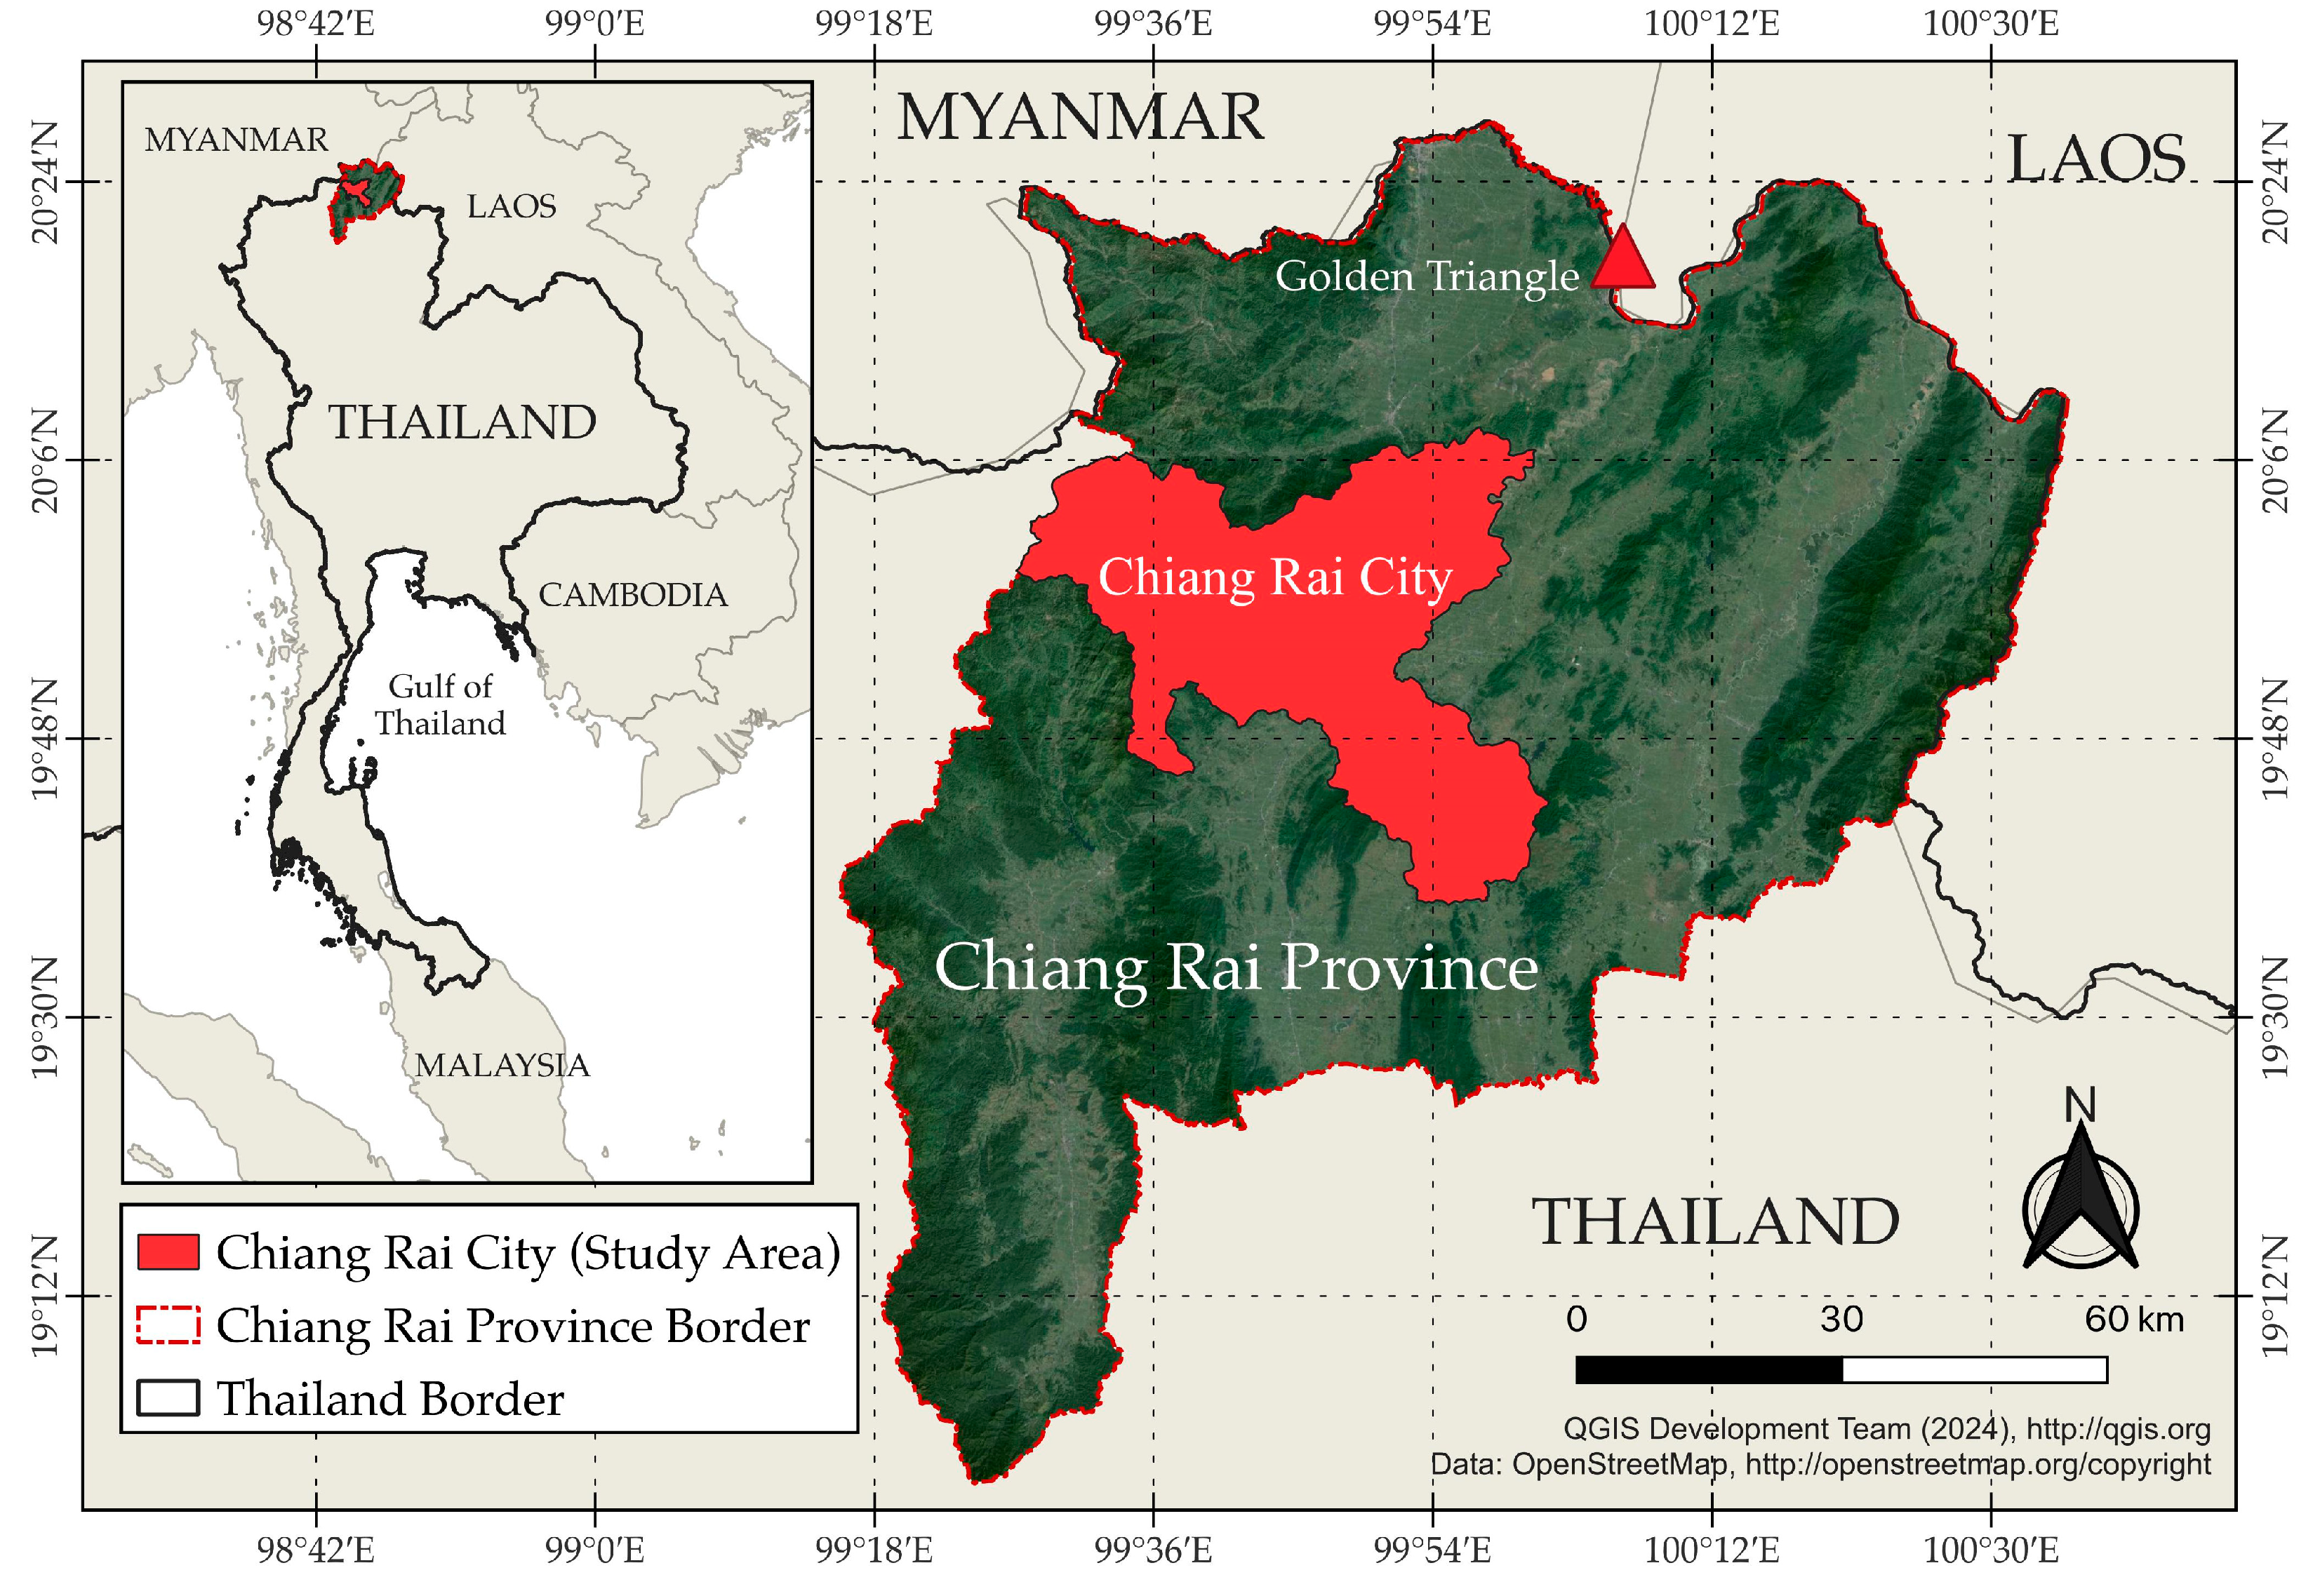
As urbanization accelerates, the threat of fire disasters becomes increasingly pronounced, particularly in densely populated cities like Chiang Rai city, the strategic city in northern Thailand known for residents both Thai and other ethnic groups, cross-border medical centers, and tourisms. This study addresses the urgent need for comprehensive emergency service coverage by conducting a spatial analysis of emergency facilities in relation to fire disaster risks. Utilizing advanced Geographic Information Systems (GISs) and innovative web scraping techniques, this research assesses the current service coverage and identifies critical gaps that may compromise urban safety.
The primary objective of this study is to bridge the divide between theoretical frameworks and practical applications in urban disaster management. Through meticulous spatial analysis and the integration of real-time data, this research not only evaluates the effectiveness of the existing emergency services but also proposes strategies to enhance their reach and efficiency. These insights are crucial for urban planners and policymakers aiming to bolster disaster preparedness and response in rapidly expanding urban environments like Chiang Rai city. This research contributes significantly to the field of urban science by merging technological advancements with urban planning to tackle contemporary challenges. The methodology adopted in this study builds upon established research on optimizing service coverage, assessing fire disaster risks, and applying GISs in urban contexts, thereby establishing a solid foundation for the analysis and recommendations provided.
1.1. Service Coverage for City’s Emergency Service Facilities
Optimizing service coverage is vital for ensuring that essential services are available and accessible within a designated area. This concept holds particular importance in various contexts, including the development of smart city infrastructure, strategic business site selection, and the deployment of satellite edge computing technologies [
1,
2]. In urban environments, optimizing service coverage plays a critical role in strategically positioning facilities to maximize public benefits. Numerous studies have explored methodologies for determining service coverage across various sectors, including transit systems [
1], public services [
3], and healthcare facilities [
4]. Key factors such as street connectivity, topography, and population density significantly influence the delineation of service coverage areas [
5].
Advanced assessment techniques, which leverage geospatial and demographic data, have been increasingly automated to evaluate public service coverage in urban regions [
6]. GIS and spatial analysis techniques have proven invaluable in examining the service coverage of health facilities within residential areas. These studies underscore the necessity of incorporating factors such as accessibility, distance, and topographical characteristics when determining service coverage for different facility types within cities.
Service coverage for emergency service facilities is a crucial aspect of urban development and disaster management. The availability of fire stations, medical facilities, and other emergency services in urban areas significantly impacts response times and the effectiveness of managing fire disasters. This study focuses on reviewing the existing literature on service coverage for urban emergency facilities, particularly concerning fire disaster risk, to highlight the importance of optimizing emergency response strategies.
1.2. Service Coverage Assessment
Assessing service coverage involves a comprehensive evaluation of the geographic distribution of emergency facilities and their capacity to meet the population’s needs effectively. This assessment is crucial for identifying gaps in service provision and enhancing disaster preparedness. In this study, spatial analysis techniques are employed to evaluate the service coverage of emergency facilities concerning fire disaster risk in Chiang Rai city.
1.2.1. Emergency Response Cut-Off Parameters
In urban areas, where high population density and complex infrastructure exacerbate the risks associated with emergencies, response time is a critical factor. The ability of emergency services to arrive at the scene within essential timeframes can be the difference between life and death, especially in incidents involving fires or other acute situations [
7,
8,
9,
10,
11]. Research consistently shows that even slight delays in response times, such as 5 to 10 min, can significantly increase mortality rates and property damage, highlighting the need for rapid intervention [
7,
10]. This urgency is particularly acute in densely populated urban environments, where risks are magnified, and the margin for error is minimal. Thus, optimizing response times in urban areas is essential not only for saving lives and preserving property but also for maintaining public trust and confidence in emergency services.
Determining the optimal service coverage for fire emergencies requires balancing several factors, including distance, travel time, and, critically, the cut-off time—the maximum acceptable response window before fire damage becomes severe.
Table 1 represents studies from around the world that provide valuable insights into these parameters, shaping how fire response effectiveness is approached. Globally, cut-off times vary depending on context and resource availability. Urban areas often prioritize shorter response windows, with recommendations ranging from 5 min in Toronto [
12] to 10 min in the U.S. [
13]. For example, a study on the Bangkok Emergency Medical Service Center (Erawan Center) found that the response time for emergency medical services varied depending on the severity of the emergency, with life-threatening cases receiving services within 10 min [
14]. This global body of research underscores the importance of tailoring cut-off times and distances to specific contexts, considering factors like traffic patterns, population density, building types, and resource availability. By carefully considering these elements and drawing upon diverse international studies, this study can work toward more effective fire response systems, safeguarding lives, and minimizing property losses.
1.2.2. Existing Emergency Service Coverage Studies
Emergency service facilities in urban areas are designed primarily to ensure effective coverage for medical emergencies and to minimize response times.
Table 2 represents various models and methodologies that have been proposed to enhance the coverage of these facilities. One notable approach integrates Data Envelopment Analysis (DEA) and the Maximum Coverage Location Problem (MCLP) to pinpoint optimal locations for new facilities, thereby maximizing service efficiency [
18]. Another study examines the assessment of ambulance dispatch coverage and emergency service facilities using GIS applications alongside primary and secondary data [
19]. Addressing the uncertainties inherent in response times and demands, another paper utilizes uncertainty theory to tackle the location problem of emergency service facilities [
20]. The localization problem for fire-fighting services is also a subject of investigation, considering dynamic changes throughout the day and population migration [
21]. Moreover, the Maximal Service Area Problem (MSAP), a facility location model, utilizes GIS capabilities to expand the total service area of emergency facilities [
22]. Recent studies continue to build on these methodologies, such as a study by Seong et al. (2023) on heat-related EMS delays in Austin–Travis County, employing spatiotemporal analysis to examine EMS response time delays [
23]. Banke-Thomas et al. assessed emergency obstetric care accessibility in Lagos, Nigeria, using geographical coverage indicators and integrating traffic variability [
24].
1.3. Fire Disaster Risk in Urban Areas
Fire disaster risk in urban areas poses a significant threat, given the potential for the extensive loss of life and property. Numerous studies have been conducted to assess and mitigate this risk. For instance, Noori et al. developed an urban vulnerability index map using multi-criteria decision-making methods to identify areas at a heightened risk of fire in Ardabil city, Iran [
25]. Dandoulaki et al. emphasized the importance of integrating disaster risk management into spatial planning, using the reconstruction of the Mati settlement in Greece after a devastating forest fire as a case study [
26]. Similarly, Palazzi et al. conducted a fire-risk assessment in the historic center of Yungay, Chile, identifying vulnerabilities to inform risk reduction strategies [
27]. Rani et al. applied a hierarchical integrated spatial risk assessment model to pinpoint fire hazard areas in an Indian study, underscoring the need for coping mechanisms and a comprehensive fire information system [
28]. Additionally, a global study generated a data layer of the wildland–urban interface (WUI) and identified regions with high wildfire risk, such as the United States, Brazil, and Africa [
29].
Urban areas are particularly susceptible to various types of fire disasters due to their dense populations and the prevalence of commercial establishments. Understanding the nature and extent of fire disaster risk is crucial for effective emergency service planning. This section of the article delves into the specific fire disaster risks faced by urban areas, with a focus on Chiang Rai city. The findings from this research are intended to inform and guide urban planners and policymakers in enhancing fire disaster preparedness and response strategies.
1.4. Spatial Analysis and GIS Applications
Spatial analysis and GIS are indispensable tools across various disciplines, particularly in environmental monitoring and urban planning. These tools enable the identification, modeling, and visualization of spatial data, such as population density, natural growth dynamics, and the distribution of critical resources [
30]. By integrating and managing multi-source and heterogeneous data, spatial data collection, processing, analysis, sharing, and service can be significantly enhanced [
31].
GIS techniques, when combined with remote sensing and spatial analysis, are particularly effective for monitoring and assessing environmental risks, such as water and soil pollution, air quality, and wind erosion hazards [
32]. Furthermore, spatial analysis and remote sensing can support environmental impact assessments by providing baseline information, understanding spatial and temporal patterns, and facilitating decision-making processes [
33]. In the context of urban disaster management, spatial analysis and GIS applications offer powerful tools for examining the distribution of emergency facilities, identifying risk factors, and assessing the accessibility of services. This study explores the applications of GISs in assessing the service coverage of fire disaster risk facilities in Chiang Rai city, highlighting the critical role that spatial analysis plays in disaster management. Through GISs, this research aims to provide actionable insights for improving emergency response strategies, ensuring that urban areas are better equipped to handle fire disasters.
1.5. Web Scraping and Geospatial Data
Web scraping is a powerful technique for collecting geospatial data from the World Wide Web, providing researchers with valuable insights into geographic patterns and processes. This method allows for near-real-time access to geolocated data at the object level, which can be captured in a cost-effective manner. However, web scraping presents unique challenges, particularly related to location, including ethical and legal concerns such as intellectual property rights, informed consent, and privacy issues [
34]. Additionally, technical, and statistical challenges, such as data inconsistencies, biases, and limited historical coverage, can affect the quality and reliability of the data [
35,
36]. Geospatial analyses often require the automated extraction and resolution of toponyms or addresses, which adds another layer of complexity to the process [
37]. Despite these challenges, web scraping has been successfully utilized in various fields, including marketing, where it is used to gather data from dynamic web environments. Ensuring the validity of these datasets necessitates the careful consideration of the associated technical, legal, and ethical concerns.
In the context of this research, web scraping is employed to collect and analyze geospatial data from interactive maps and other publicly available web resources. This method is particularly useful for gathering data on the locations of fire-risk merchandise shops and emergency facilities. The data obtained through web scraping play a crucial role in the spatial analysis conducted in this study, enabling a more dynamic and up-to-date assessment of emergency service coverage in Chiang Rai city.
2. Methodology
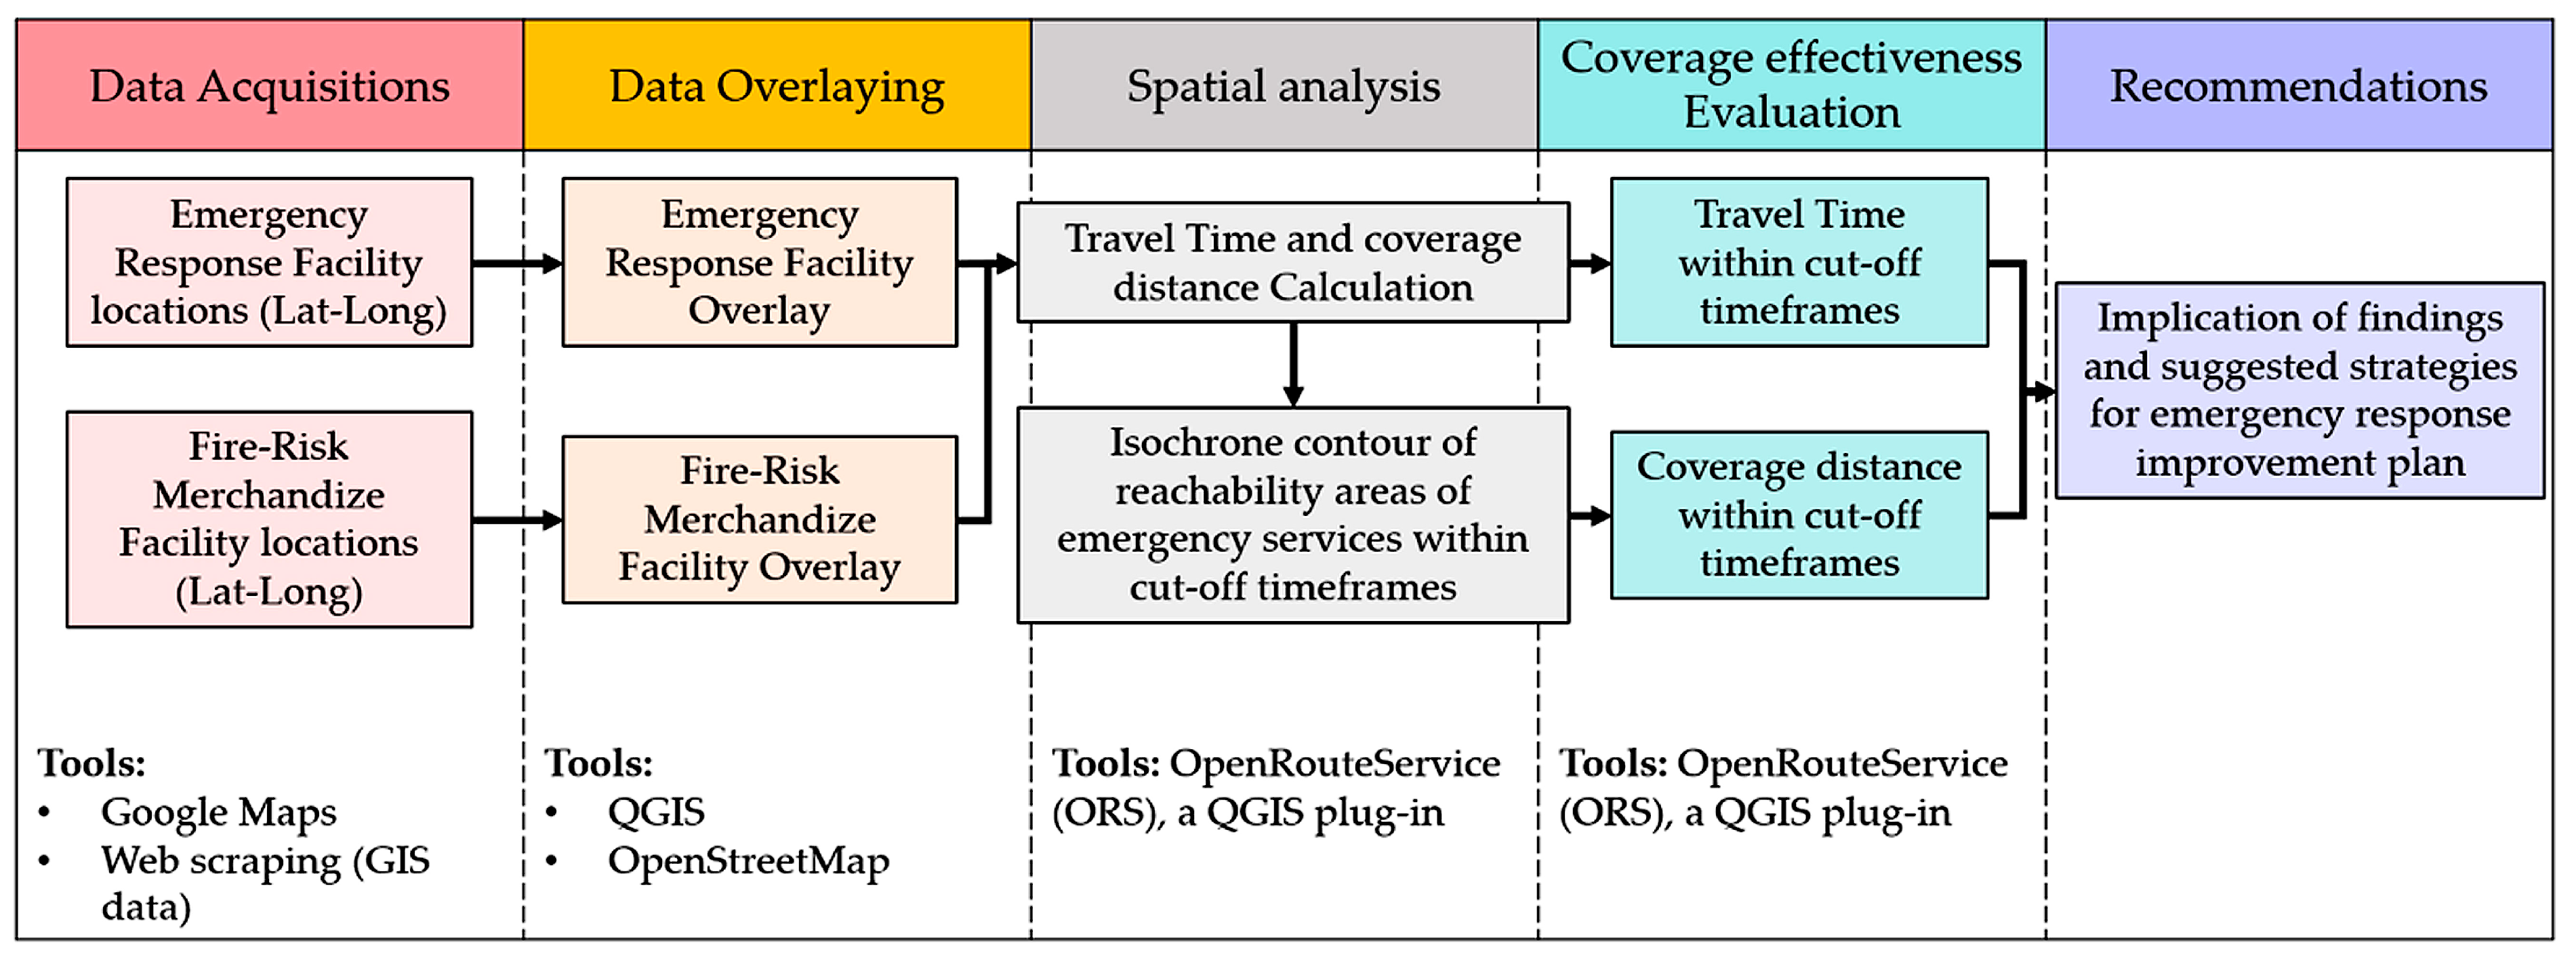
This research employs a comprehensive methodology to analyze the service coverage of emergency facilities in Chiang Rai city, Thailand, with a particular emphasis on their efficiency in responding to fire-risk situations, as illustrated in
Figure 1, which outlines the study’s roadmap. The methodology integrates advanced geospatial analysis techniques, including GIS data overlaying, travel time and distance analysis, and an assessment of service coverage efficiency.
The analysis categorizes the data by the type of emergency facility and examines various factors that influence travel time and distance, including the type of emergency vehicle, the type of road, and the urban/rural speed limits. The initial phase involves a descriptive analysis of the dataset to understand the distribution and characteristics of emergency facilities and fire-risk merchandise locations. Key metrics include average travel time, distance, and spatial distribution across the district.
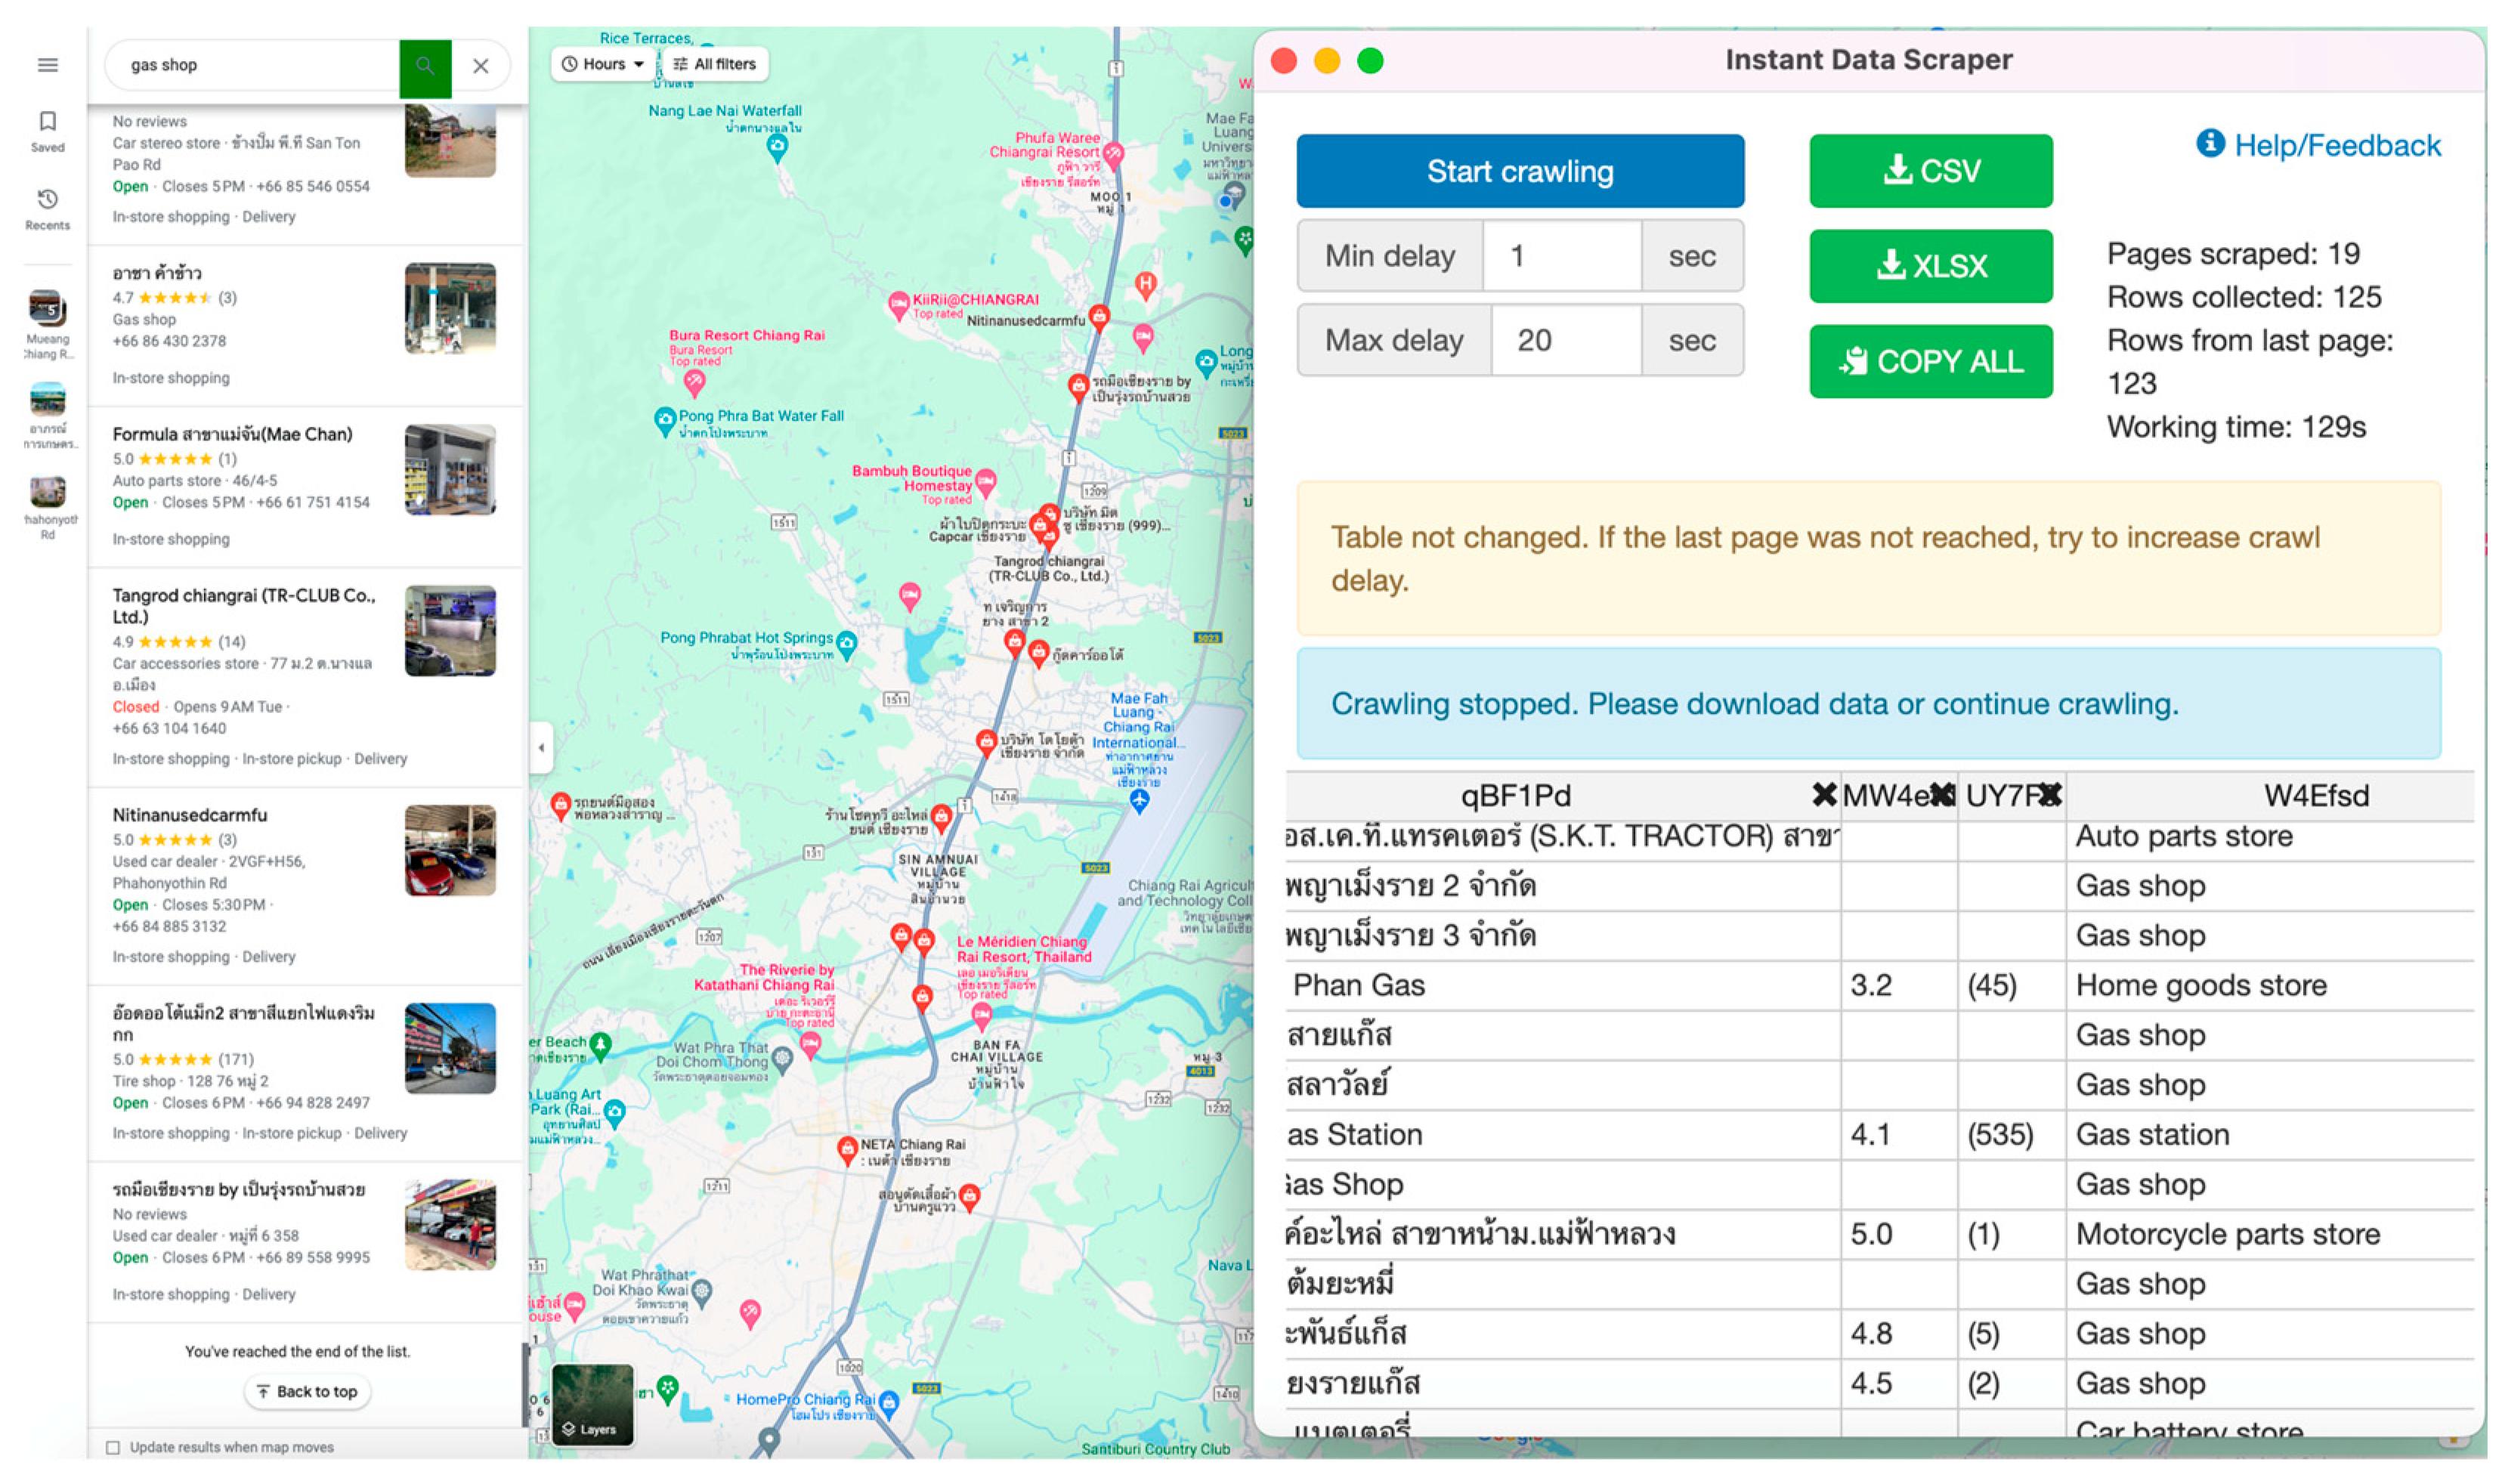
The first step in the methodology involves meticulous data acquisition. The study employs web scraping techniques to gather detailed information on the locations of emergency facilities and fire-risk areas. Utilizing the Instant Data Scraper [
38], a Google Chrome extension, the study extracts structured data from Google Maps, focusing on key parameters such as facility names, types, and geographic coordinates. These data form the foundation of analysis, enabling us to map the locations of emergency services and fire-risk facilities accurately.
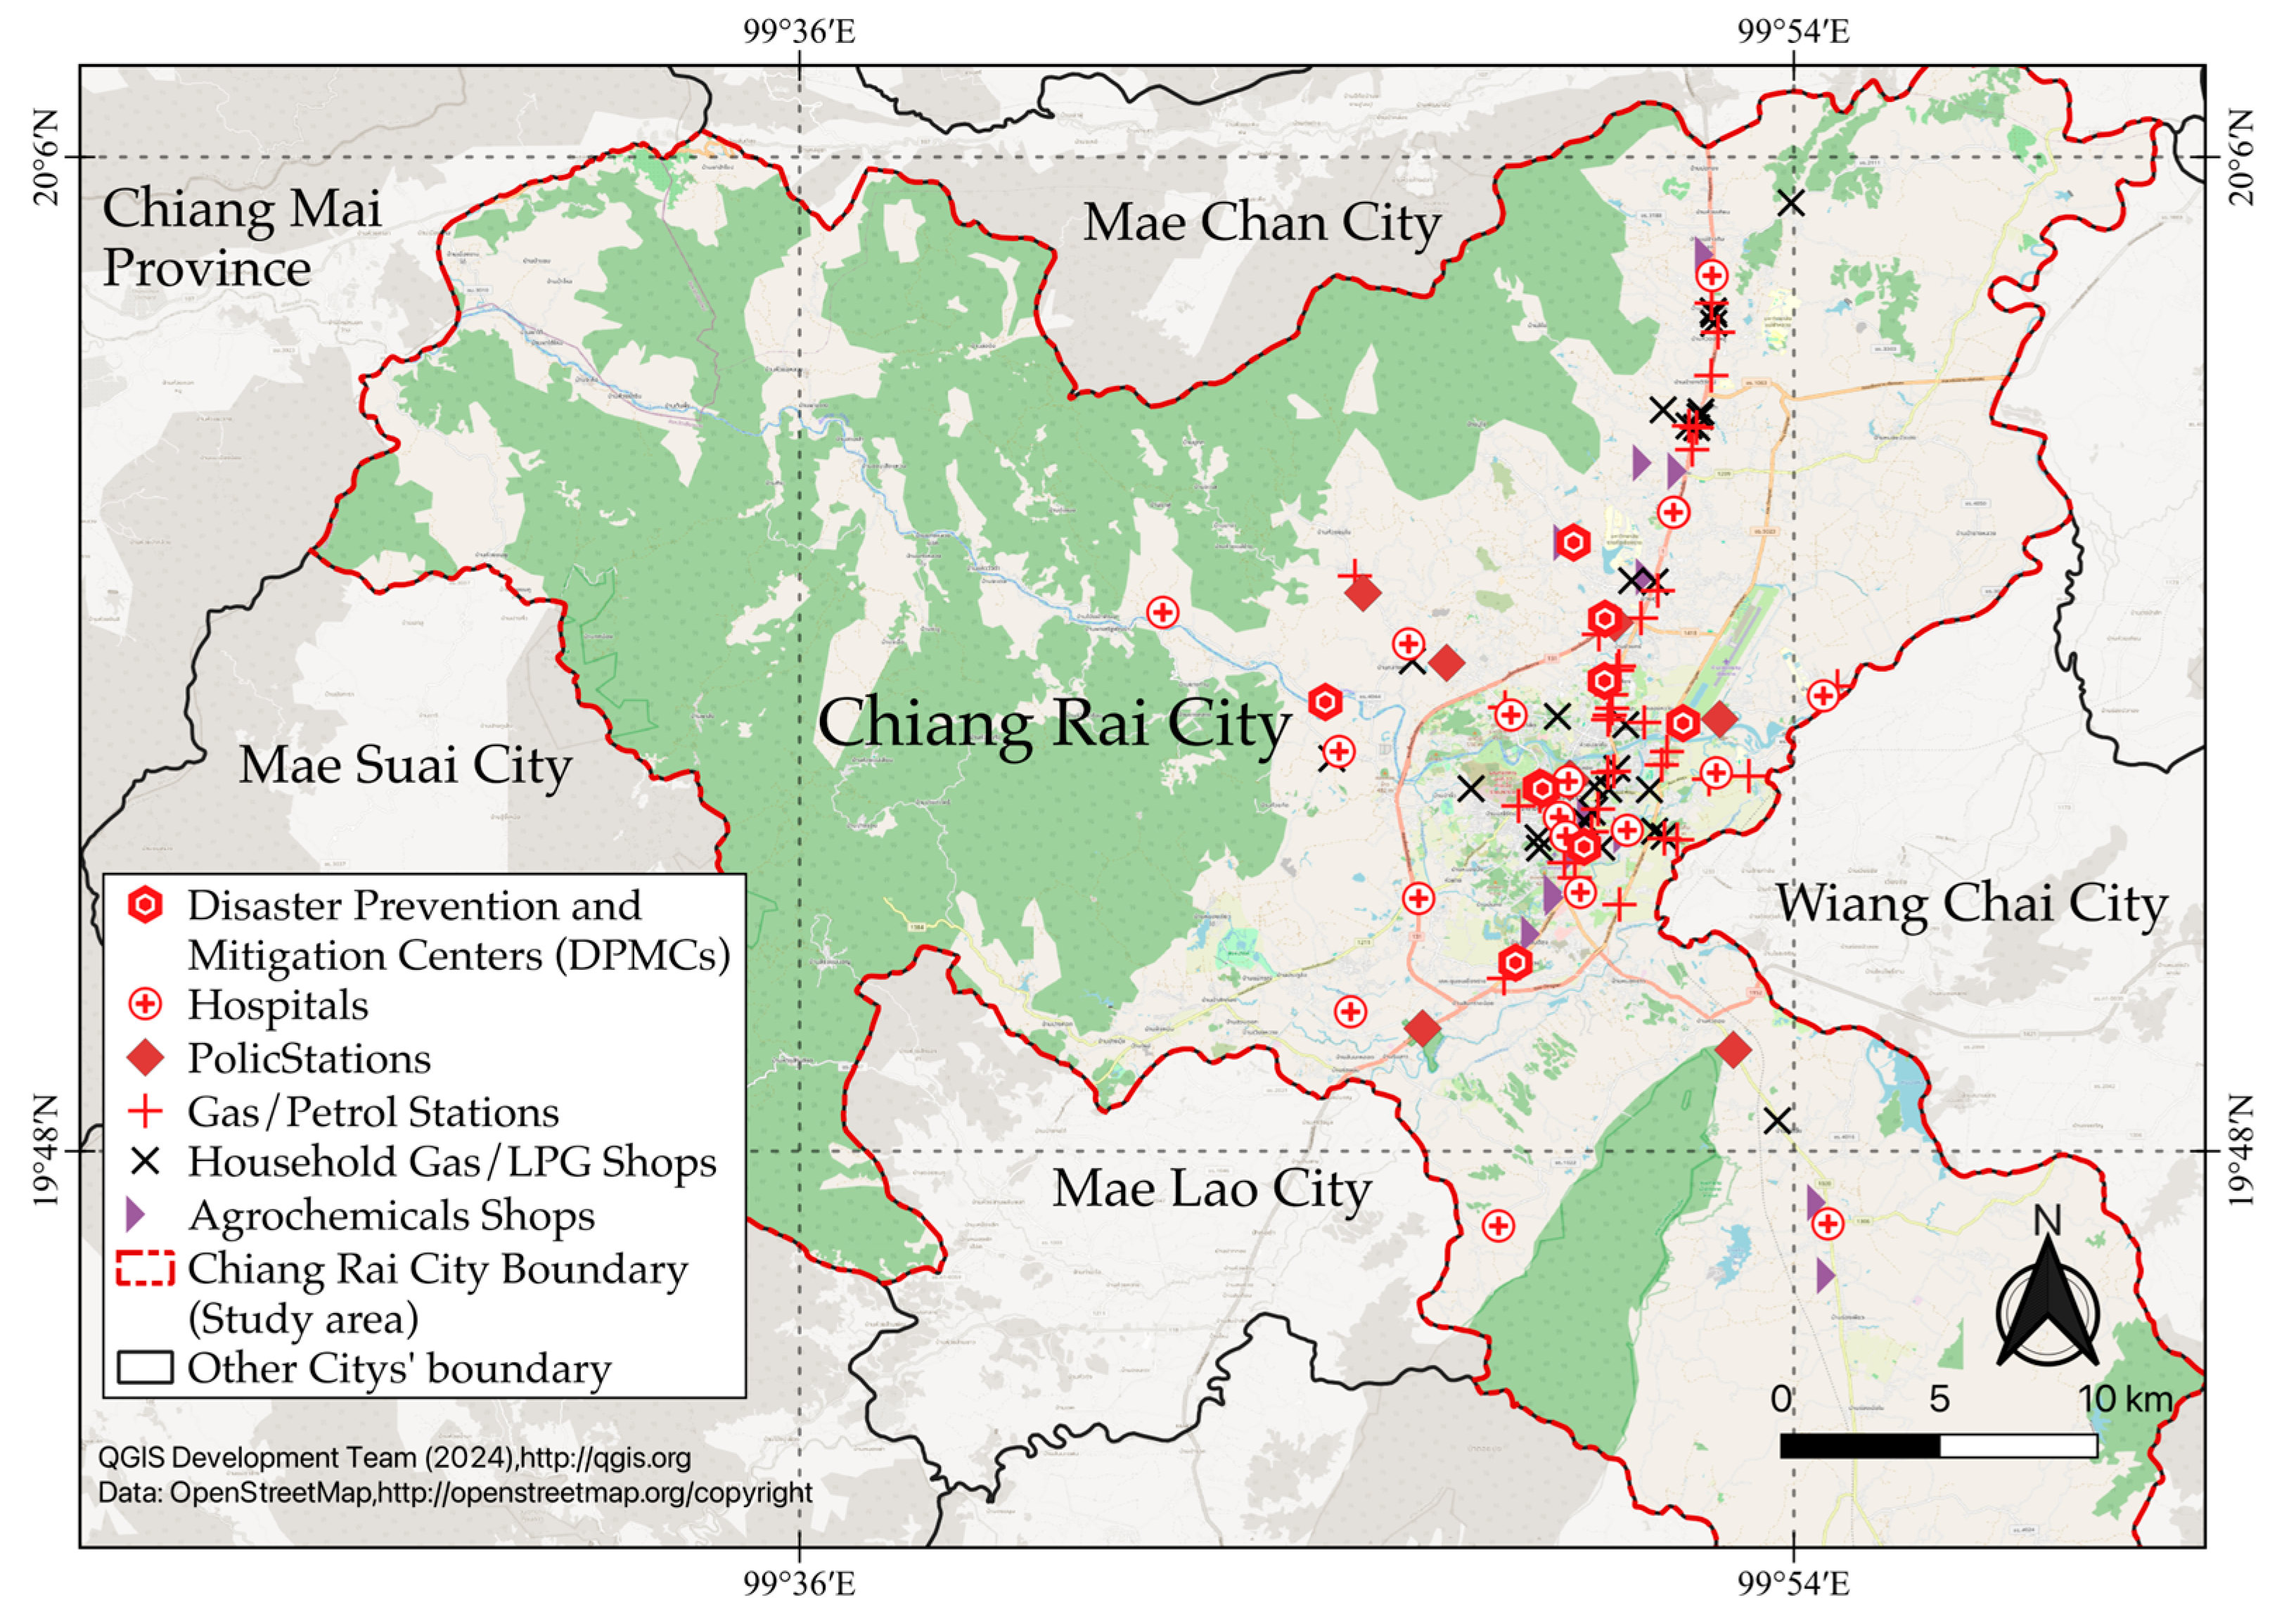
Subsequently, the study conducts an in-depth GIS data overlaying process, where these locations are plotted onto OpenStreetMap using QGIS version 3.28 [
39], revealing their spatial relationships and distribution patterns. This step is followed by a detailed travel time and distance analysis, informed by isochrones generated through the Open Route Service (ORS), a QGIS plug-in application [
40], which considers local road networks, traffic conditions, and legal speed limits to assess the accessibility of emergency facilities. Finally, the study evaluates the service coverage efficiency of these facilities, determining their reach and effectiveness within various time thresholds.
This comprehensive approach not only highlights the current state of emergency services in the region but also identifies potential areas for improvement, contributing to more informed and effective emergency response strategies. The subsequent sections detail the specific steps and analyses undertaken in this study, providing a clear and precise description of the experimental results, their interpretation, and the conclusions that can be drawn from them.
2.1. Identifying Emergency Facilities and Fire-Risk Facilities
The first critical step in the analysis is the identification of emergency facilities and fire-risk facilities within Chiang Rai city. This process is foundational to the subsequent spatial and service coverage analysis, as it ensures that the dataset is both comprehensive and relevant. To identify these facilities, the study employed a targeted approach using specific keywords. For fire-risk facilities, keywords such as “chemical fertilizer supplier”, “gas shop”, and “gas station” were utilized. These terms were strategically selected to represent a wide spectrum of potential fire hazards, considering both the nature of the operations and the materials handled at these locations. Similarly, for emergency facilities, keywords like “police station”, “fire station”, “disaster prevention and mitigation center”, and “hospital” were used. These facilities are pivotal in emergency response, and their identification is essential for a thorough analysis of service coverage.
The significance of this step cannot be overstated, as it establishes a solid foundation for the entire study. By capturing a wide array of facilities associated with emergency response and fire risk, the study ensures that the analysis is not only comprehensive but also directly applicable to the urban safety challenges faced by Chiang Rai city.
2.2. Facilities Location Acquisition Using Data Scraping
The acquisition of precise location data for facilities is a critical component of this study, and data scraping proved to be an innovative and effective method for gathering the necessary geospatial information. The use of the Instant Data Scraper, a Google Chrome extension, is particularly noteworthy in this research. This tool is adept at extracting structured data from dynamic web pages, such as those on Google Maps, which is essential for the study’s purposes. The scraping process the study employed was systematic and efficient. By activating the Instant Data Scraper on Google Maps pages that displayed search results for the specified keywords, the study was able to automatically extract relevant data points, including facility names, types, latitude, longitude, and other available metadata, as shown in
Figure 2. This process ensured a high-level of accuracy and comprehensiveness in the dataset.
The scraped data then underwent a rigorous process of verification and cleaning. This step was crucial to ensure the accuracy and relevance of the data. It involved formatting and standardizing the data for GIS analysis, thereby making it usable for the subsequent geospatial analysis. The accuracy and comprehensiveness of the data scraping methodology directly influenced the quality of the spatial analysis and the reliability of conclusions regarding emergency service coverage and preparedness. This approach demonstrates how modern data acquisition techniques can be leveraged to obtain crucial geographic information efficiently. It highlights the intersection of technology and geographic research, opening avenues for more sophisticated and detailed spatial analysis in various fields.
2.3. Geospatial Analysis
The geospatial analysis at the core of this study synthesizes the scraped data into actionable insights, encompassing GIS data overlaying, travel time and distance analysis, and service coverage efficiency assessment. Each of these elements plays a crucial role in understanding the spatial dynamics of emergency service coverage in Chiang Rai city. The first phase is GIS data overlaying, which involves integrating the locations of emergency and fire-risk facilities into a GIS using QGIS version 3.28 software. This process not only maps these locations but also reveals the spatial relationships and distribution patterns across Chiang Rai city. By visualizing these patterns, the study establishes a foundation for deeper analysis, particularly in terms of accessibility and coverage.
The next step is travel time and distance analysis, which shifts the focus to the practicalities of emergency response. Here, the study examines how swiftly and effectively emergency services can be delivered to fire-risk locations. Using the ORS extension in QGIS, the study conducted a detailed travel time and distance analysis. This analysis considered real-world factors such as local road networks, way types, and speed limits to determine the reachability of emergency services within critical cut-off timeframes. This element of the study is vital for emergency management and planning, as it provides a realistic assessment of the service coverage area.
The final aspect of the study’s geospatial analysis is the assessment of service coverage efficiency. This involves evaluating how effectively emergency facilities can respond within various travel time thresholds—3, 5, and 10 min. By calculating the percentage of fire-risk facilities reachable by emergency services within these intervals, the study gains valuable insights into the overall efficiency of the service coverage. This analysis not only highlights areas where current emergency services are performing well but also identifies potential gaps in coverage that could be addressed to improve emergency response strategies.
4. Results
This research embarked on a comprehensive exploration of the dynamics surrounding emergency service coverage in Chiang Rai city, Thailand, with a particular focus on fire disaster risk. The analysis spanned multiple facets, including geospatial distribution, travel time efficiency, and the effectiveness of service coverage by emergency facilities. This section presents the findings from each analytical component, weaving them together to form a cohesive understanding of the current state of emergency services in the city.
4.1. Travel Time and Distance Analysis
The study began by evaluating the efficiency of emergency response in terms of travel time and distance, considering various influencing factors. This involved a thorough factor analysis to examine the impact of different variables such as vehicle type, road type, surface condition, and speed limits on travel time and distance. Statistical methods were employed to determine the significance of these factors, ensuring a comprehensive understanding of what affects emergency response times and distances. The data were meticulously grouped and prepared, with segmentation based on factors like vehicle type and road type. Descriptive statistics were then used to compute the average travel time and distance for each group, providing a clear picture of the current state of emergency response efficiency. A GIS-based network analysis was conducted to determine the most efficient routes from emergency facilities to fire-risk locations. This approach allowed for the calculation of the shortest and quickest paths, which is crucial for assessing the actual reach of emergency services within critical time frames.
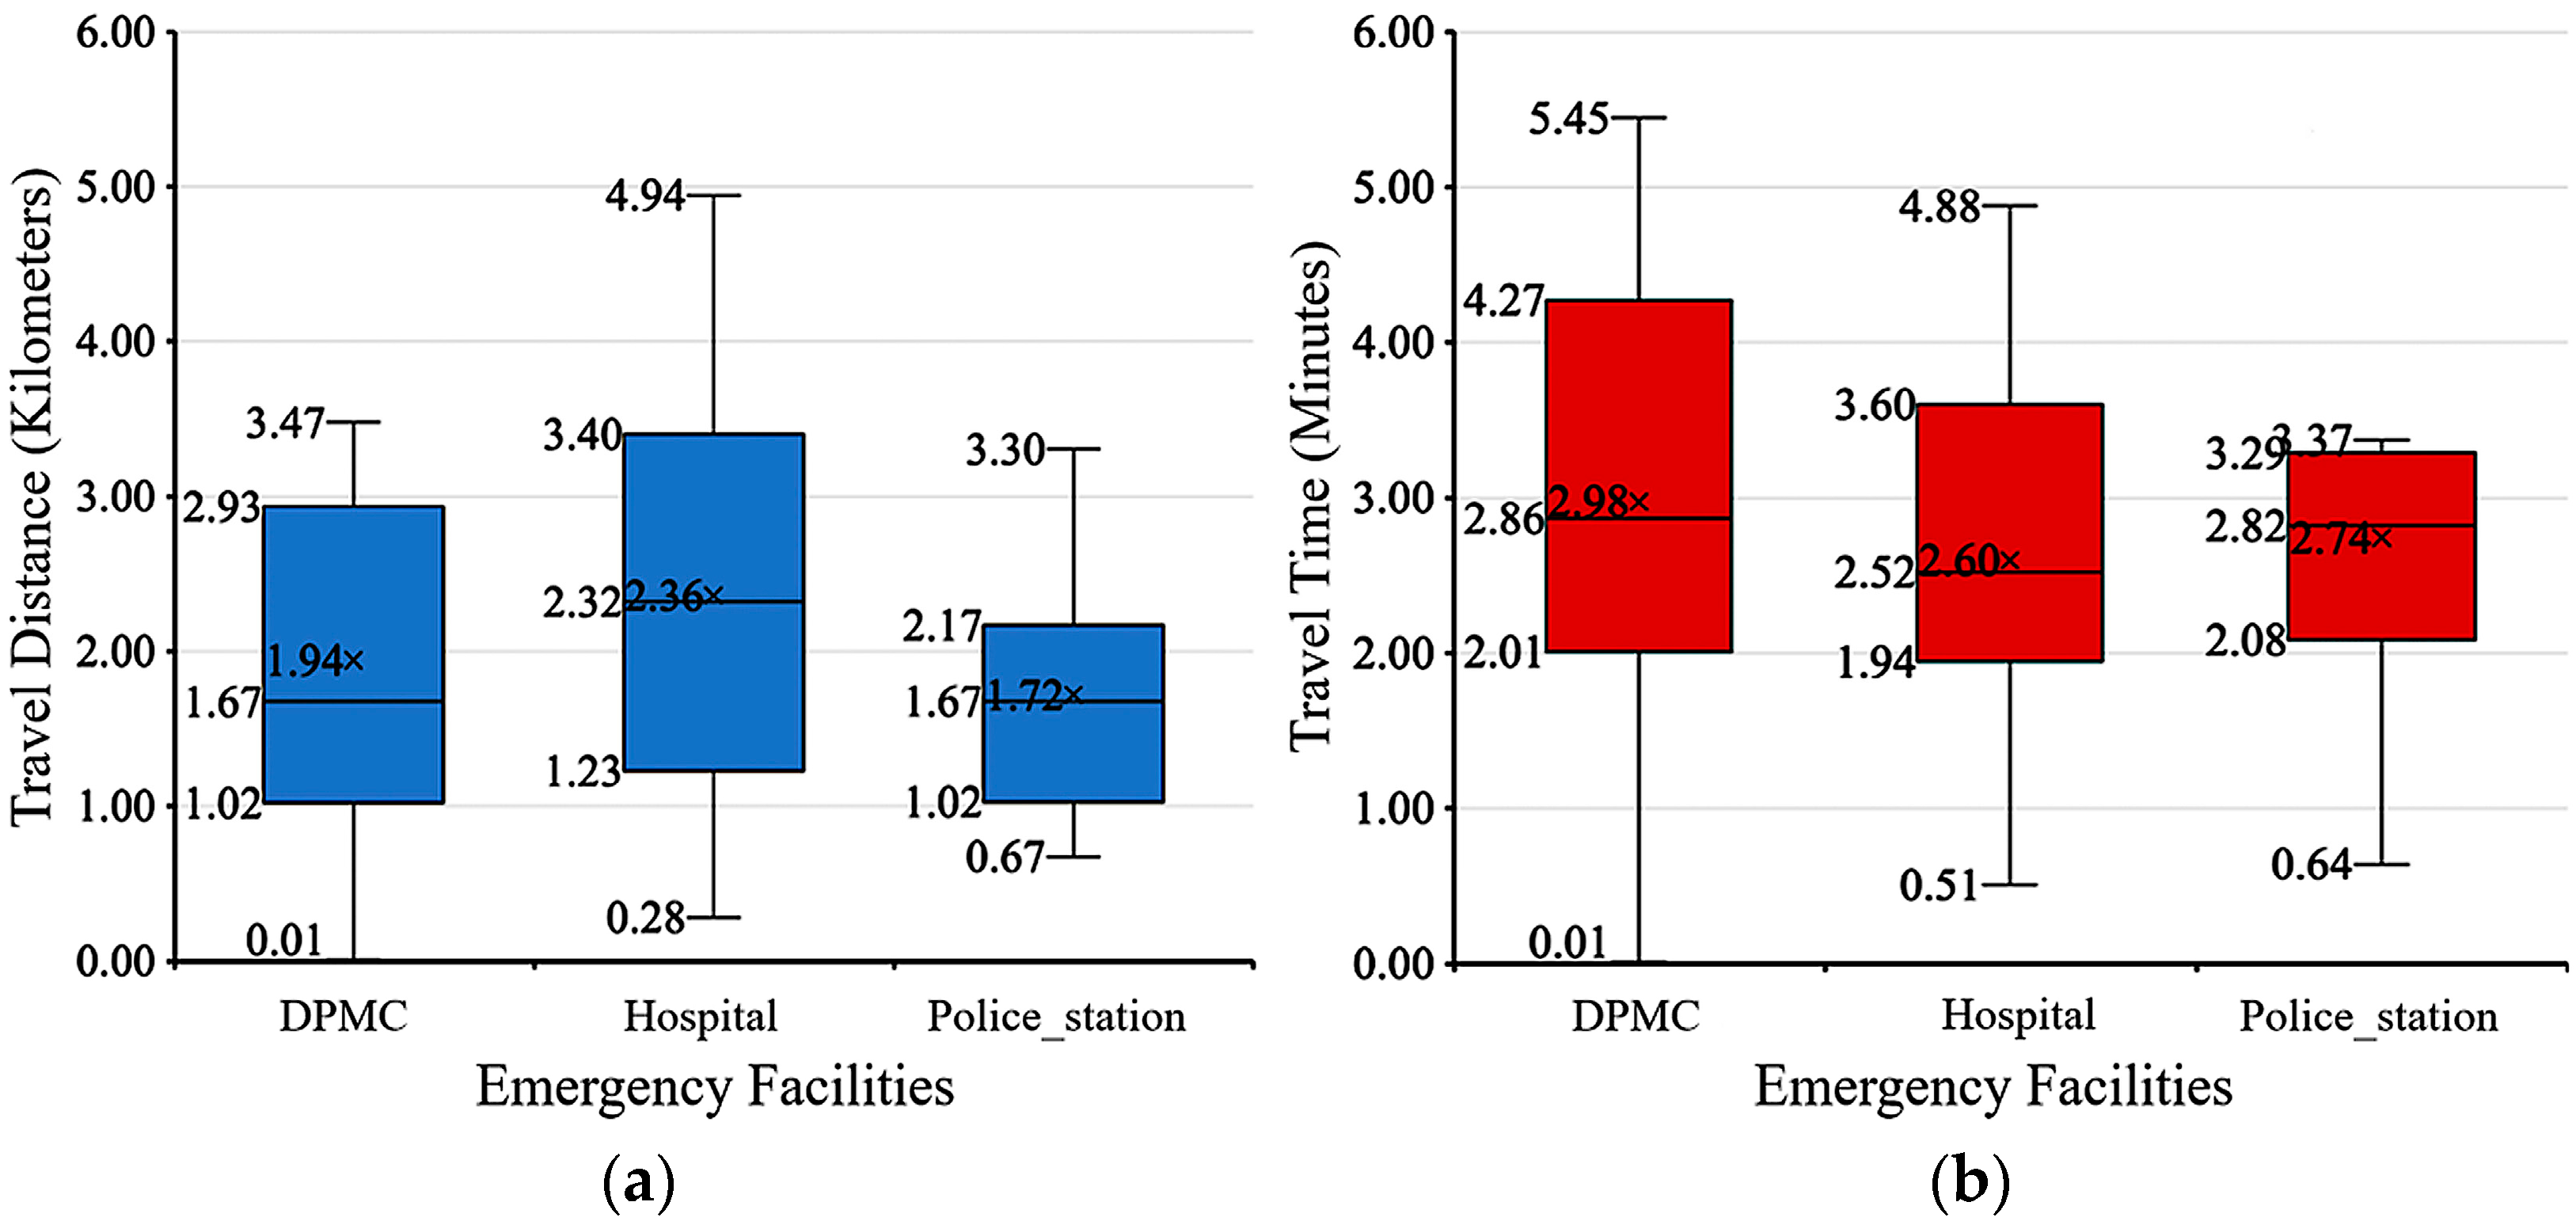
The results revealed that the average travel times to reach fire-risk locations were 2.98 min for DPMCs, 2.60 min for hospitals, and 2.74 min for police stations, as shown in
Figure 5a. These findings highlight efficient emergency response capabilities across the district, showcasing the effectiveness of the current emergency infrastructure in ensuring timely assistance in crisis situations. The average distances to fire-risk locations were 1.94 km for DPMCs, 2.36 km for hospitals, and 1.72 km for police stations. This spatial distribution indicates a strategic alignment of emergency services with the potential to respond swiftly in fire-risk scenarios, as illustrated in
Figure 5b.
4.2. Service Coverage Efficiency Analysis
Service coverage efficiency analysis is a vital tool in assessing the effectiveness of emergency response systems, particularly in terms of their ability to reach high-risk areas promptly. This evaluation focuses on two key metrics: travel time and distance, which determine the proportion of high-risk areas accessible within critical time thresholds.
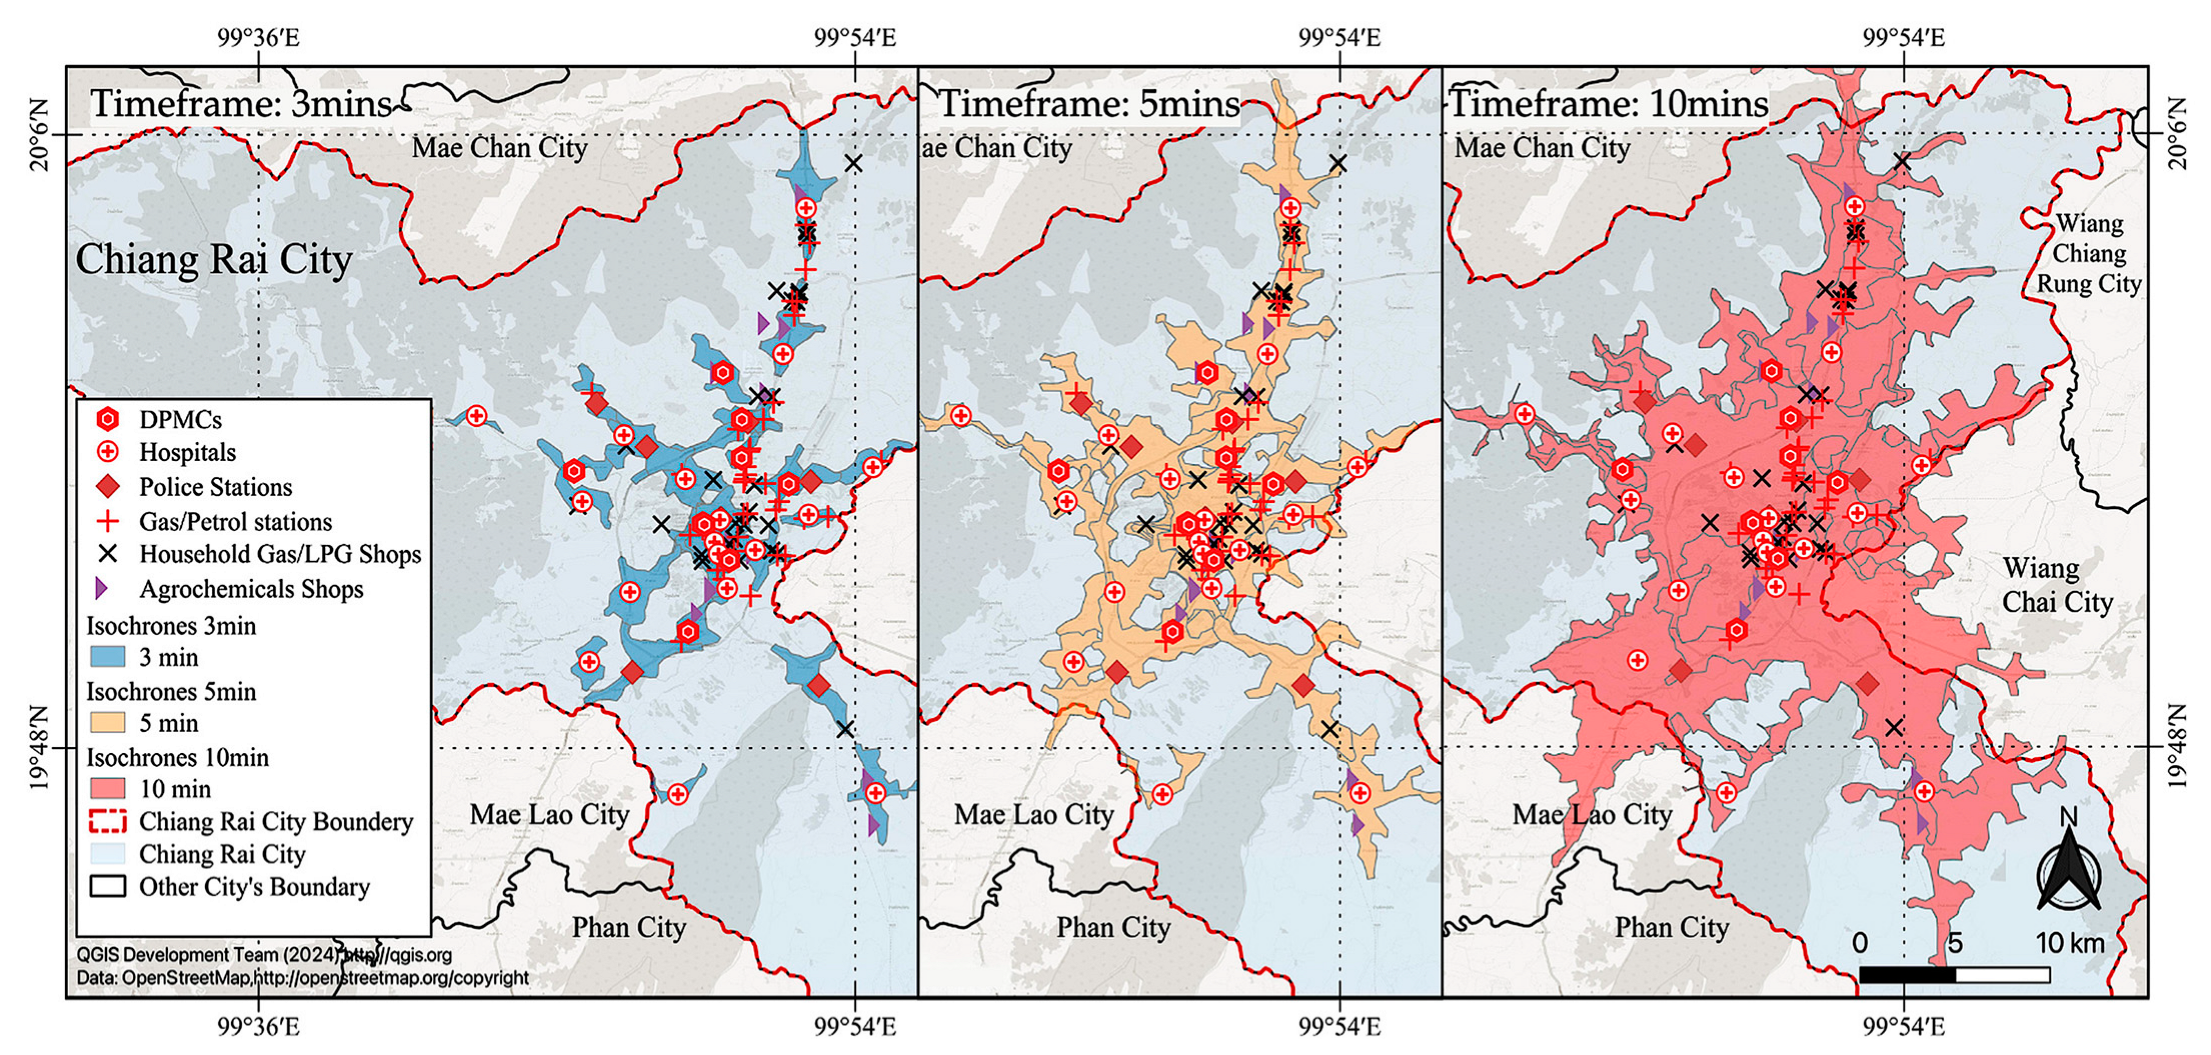
The methodological approach includes defining service coverage efficiency, with an emphasis on the percentage of fire-risk facilities reachable by emergency services within time intervals of 3, 5, and 10 min, based on standard benchmarks and the specific context of the area. The process involves collecting and preprocessing detailed geospatial data, followed by robust GIS-based spatial and network analyses to map emergency and fire-risk facilities and compute efficient travel routes, as depicted in
Figure 6. Coverage efficiency was calculated both individually and in aggregate across facilities, supported by statistical analysis that provides descriptive statistics and comparative insights. This analysis is more than just a metric; it is instrumental in revealing coverage gaps, guiding resource allocation, and enhancing infrastructure to bolster community resilience against fire disasters and other emergencies.
The results showed that within a 3 min threshold, hospitals covered 41.69% of fire-risk facilities, while DPMCs and police stations covered 38.87% and 44.73%, respectively. Expanding to a 5 min threshold, coverage improved significantly, with hospitals reaching 100.00%, DPMCs 84.52%, and police stations 80.19%. By the 10 min threshold, both DPMCs and police stations achieved 100.00% coverage. This analysis provides a clear picture of emergency service reach, highlighting areas with potential for improvement in emergency response speed and coverage, as shown in
Table 3.
In terms of emergency facility efficiency, hospitals stood out with the highest coverage efficiency, reflecting their strategic positioning for quick responses. DPMCs showed moderate efficiency, aligned with their focus on disaster prevention and mitigation. Police stations, however, exhibited the lowest coverage efficiency, due to their broader role in public safety beyond fire-related emergencies.
After evaluating the emergency facilities, the study focused on analyzing service coverage efficiency from the perspective of diverse types of fire-risk facilities. This analysis was crucial for understanding how well emergency services addressed the needs of specific high-risk locations. The study categorized fire-risk facilities into three groups: agrochemicals shops, gas/petrol stations, and household LPG shops, and assessed their coverage within the critical time thresholds of 3, 5, and 10 min.
The results were revealing. For agrochemical shops, 53.33% were reachable within 3 min, with coverage increasing to 100% within 5 min. Gas/petrol stations showed 62.86% coverage within 3 min, which escalated to 94.29% within 5 min and reached 100% by the 10 min mark. Similarly, household LPG shops achieved 57.14% coverage within 3 min, improving to 96.43% within 5 min, and reaching 100% within 10 min. These findings highlight the high responsiveness of emergency services to critical fire-risk locations, particularly within the 5 to 10 min window, reflecting an effective emergency response system tailored to various risk scenarios.
As detailed in
Table 4, the assessment of fire-risk facility accessibility indicates that agrochemical shops, gas/petrol stations, and household LPG shops are effectively covered within the 5 and 10 min response times, demonstrating the strong reach of emergency services. However, coverage within the crucial 3 min window is less comprehensive, suggesting opportunities for improving the speed of emergency response.
5. Discussion and Limitations
The findings of this study underscore the critical importance of optimizing the placement and coverage of emergency services in urban areas, particularly in rapidly expanding cities like Chiang Rai city, Thailand. The spatial analysis reveals that while hospitals provide the most effective coverage within critical timeframes, there are notable gaps in the coverage provided by police stations and DPMCs, especially within the crucial 3 min response window. This variability in response efficiency suggests a need for targeted improvements in the strategic allocation of emergency resources.
5.1. Implications of Findings and Proposed Strategies
The comprehensive analysis of emergency service coverage in Chiang Rai city leads to important implications and strategies for enhancing emergency response, particularly for fire–risk facilities. The observed variability in response efficiency among different emergency facilities, such as hospitals, DPMCs, and police stations, highlights the need for strategic resource allocation and facility placement.
To improve fire disaster response capabilities, especially for police stations, a more tactical approach in positioning and resourcing these facilities is imperative. Additionally, while the high coverage efficiency within the 5 and 10 min thresholds reflects a robust emergency response framework, the lower efficiency within the critical 3 min window points to areas needing urgent improvement. For scenarios requiring immediate intervention, revising emergency response protocols and optimizing resource allocation are essential. Proposed strategies to address these findings include enhancing road and traffic infrastructure to facilitate quicker emergency responses, improving emergency vehicle dispatch systems for more efficient mobilization, and increasing community awareness about the locations and capabilities of emergency services. Policymakers and emergency service providers in Chiang Rai city must focus on these areas to augment the district’s emergency response effectiveness.
Moreover, an integrated emergency management approach is recommended, considering geographical, infrastructural, and traffic-related factors in planning and operational strategies. Policymakers should prioritize enhancing road infrastructure, optimizing traffic management systems, and strategically placing emergency facilities to boost response capabilities. Special attention is needed in areas identified with coverage gaps. Engaging the community in emergency preparedness through awareness campaigns and involvement is crucial for quick disaster response and risk mitigation. These strategies aim to build a comprehensive emergency management framework, embracing not only immediate response but also strategic planning, infrastructure development, and community engagement. The integration of technology, such as GIS and data analytics, is pivotal in modern emergency management, offering precision in emergency preparedness and response capabilities. Policymakers can use these data-driven insights for strategic decision-making regarding resource allocation, facility placement, and infrastructure development. The research also opens avenues for further investigation, advocating for the inclusion of dynamic factors such as real-time traffic data and advanced spatial modeling. Continuous improvement in emergency services, informed by ongoing research and technological advancements, is crucial to adapt to evolving risks and enhance public safety and disaster resilience.
5.2. Limitations
Despite the valuable insights provided by this study, several limitations must be acknowledged. The reliance on static geospatial data does not account for dynamic factors such as real-time traffic conditions, road closures, and seasonal variations, which can significantly affect travel times and emergency response effectiveness. Moreover, while the study focuses on fire disaster risks, it does not encompass the full spectrum of potential emergencies, such as medical crises or natural disasters, limiting the generalizability of the findings. Another limitation is the study’s exclusion of temporal variations, such as peak and off-peak hours, which could impact the accuracy of the service coverage assessment. These temporal factors could influence the effectiveness of emergency response services, and their exclusion may lead to an incomplete assessment of service coverage.
Future research should aim to incorporate these dynamic and temporal factors to provide a more comprehensive understanding of emergency service coverage in urban areas. By addressing these limitations, future studies can offer even more accurate and actionable insights for improving emergency management strategies in rapidly growing cities like Chiang Rai city.
6. Conclusions
This study offers a detailed analysis of emergency service coverage in Chiang Rai city, with a specific focus on fire disaster risks. The findings reveal that while hospitals are strategically positioned to provide effective emergency coverage, there are significant gaps in the coverage offered by DPMCs and police stations, particularly within the crucial 3 min response window. These gaps highlight the need for targeted improvements in resource allocation and infrastructure to enhance the city’s overall emergency response capabilities.
To address these challenges, the study recommends several strategies, including optimizing the placement of emergency facilities, improving road and traffic infrastructure to facilitate faster response times, and increasing community awareness of emergency service locations and capabilities. Additionally, integrating real-time data into emergency planning could further refine response strategies, making them more adaptable to changing conditions. By implementing these recommendations, Chiang Rai city can better prepare for and respond to fire disasters and other emergencies, creating a more resilient and safer urban environment. The study underscores the importance of continuous improvement and adaptation in emergency management practices to meet the evolving challenges of urban disaster risk.
