Article

Functional or Neglected Border Regions? Analysis of the Integrated Development Plans of Borderland Municipalities in South Africa

Department of Social Geography and Regional Development Planning, Institute of Earth Sciences, Faculty of Science and Technology, University of Debrecen, 4010 Debrecen, Hungary
*
Author to whom correspondence should be addressed.
Urban Sci. 2024, 8(2), 46; https://doi.org/10.3390/urbansci8020046
Submission received: 1 February 2024 / Revised: 6 April 2024 / Accepted: 29 April 2024 / Published: 7 May 2024

Abstract

:
The mainstream approach of regional integration impact assessments is mainly limited to assessing cross-border development projects/programmes. There is still a lack of critical assessment of how stakeholders at different institutional levels conceptualise the border. Local (municipal) strategic plans provide a reflection of the spatial imaginaries of stakeholders, perception planners, institutional power structures, and, to some extent meaning of the border to the local people. Integrated Development Plans (IDPs) in South Africa were adopted as an important development planning strategy in the post-apartheid era. IDPs of 49 borderland municipalities were systematically reviewed using the Key-Word-in-Context (KWIC) content analysis technique of the keyword ‘border’ to determine the importance of state borders in light of regional integration. Border security and management is one of the most common themes associated with the border. This suggested that borders were mainly perceived as threats and barely considered as a potential resource for cross-border cooperation or integration.

1. Introduction

Cross-border spatial planning is a complex and multidimensional process. It offers the potential for exchanging information, coordination or cooperation concerning spatial development in a cross-border region [1,2]. It involves seeking harmonisation of plans and joint development strategies between actors on both sides of the border [3,4] and fully exploiting borders as a resource while addressing the needs of borderland residents. Regions are context-bound, and traditionally, spatial planning practices have largely been bounded to geographical territories lacking harmonisation of regional development. Cross-border spatial planning requires different territorial authorities on both sides of the border to pursue innovative interventions that reach beyond the existing state territorial jurisdictions in favour of cross-border spatial integration [5,6].
Many scholars in border studies focused on assessing the effectiveness of regional integration by evaluating the impacts of tools, policies, documents, and programs such as territorial strategic plans, cross-border spatial planning processes, and cross-border development projects/programmes [4,7,8,9], and a common thread is the stakeholder participation. This is mainly due to the recognition of contradictory challenges in territorial planning systems [10,11]. However, these impact assessments of cross-border interventions are mainly designed to evaluate the ex-ante and ex-post impacts of European Union (EU) integration initiatives [12], with some cross-border spatial plans designed, in particular, to define a political framework (European Security and Defence Policy, Territorial Agenda of the European Union, European Observation Network for Territorial Development and Cohesion) [3]. There is still a lack of critical assessment on how stakeholders at different levels conceptualise the border and how the pre-conceived ideological position of the border actually affects the outcome of the cross-border spatial planning process at different institutional levels outside the supranational integration agenda, i.e., the EU. Moreover, to what extent cross-border development exercises are a local interpretation of the meaning of territorial development? Given these insights, analysing strategic plan documents beyond established cross-border collaborations can shed light on the significance attached to borders. While this study approach falls short of fully uncovering stakeholders’ discursive articulations surrounding borders, it nonetheless offers a foundational understanding of ways in which stakeholders engage with border-related issues in development planning documents.
Strategic planning is considered a process [13]. It is more than producing a document. The emphasis is placed on practices applied to produce the strategic plan. For Healey (1997) [14], strategic planning demands a democratic process that involves a collaborative effort among the stakeholders through rational engagement to achieve a desired outcome within a particular group in society. It collectively expresses social, environmental, political and physical fabric [15]. This expression of the territorial identity enforces or reinforces the bordering process. Thus, local (municipal) strategic plans can be seen as an important reflection of spatial imaginaries of stakeholders, perception planners, institutional power structures, and, to some extent, the meaning of the border to the local people. This paper shifts from the mainstream approach of evaluating cross-border strategic plans principled around implementing cross-border projects/programmes to determine the impact of regional integration. Rather, it assesses existing municipal strategic plans that have been locally produced to understand spatial imaginaries of local stakeholders in borderlands.
The aim of the study is to apply a holistic approach by analysing existing strategic plans of borderland municipalities to determine regional integration’s importance (or lack) in border regions. Integrated Development Plans (IDPs), which are municipal strategic plans in South Africa, were analysed. Planners orchestrate IDP, involving various local stakeholders such as community members, researchers, investors, suppliers, interest groups, non-governmental organisations, associations and traders. Thus, an analysis of the IDP provides an overview of planning practices, inherent assumptions and spatial consciousness of border regions’ local stakeholders expressed in the strategic plan. The contribution of this work is to provide new insights into local stakeholders’ conceptualisation of the border and the extent to which municipal planning strategies are utilised as policy potentials for fostering cross-border integration.

1.1. Borderlands as Everyday Functional Spaces

Borderlands represent multicultural spaces where cultures meet, and those living on the edges discover common heritages and can construct new ones [16]. In the last three decades, there has been a renewed understanding of borders as more than a consequence of political power but also as a social phenomenon [17,18]. Borders are more than lines on maps dividing nation-states; but are also manifested in people’s daily lives, state-related practices and institutions such as language, culture, stereotypes, heritage, politics, legislation and economy [19]. The shift from observing borders as physical space to social space has revealed the dynamic process of borders and provided an understanding of people’s identities that create an attachment to the idea of a nation [20,21]. Border permeability, which refers to the degree of openness of borders for the free flow of people and goods [22,23], exerts control over borderland communities by promoting or inhibiting cross-border interactions. The borderland residents use high permeable borders as an integrated region for daily activities, and there is free movement between the two nations for various purposes [22]. The experienced reality of geographical borders shapes the livelihoods and imageries of borderland communities, making borders crucial for everyday lives.
Borderlands are ambiguous and often unstable sites of central importance where the territorial state power is most visible. In 1994, Oscar Martinez [24] presented four models that distinguished different borderland relations: (i) alienated borderlands, in which regular cross-border interaction is practically non-existent; (ii) co-existent borderlands, which consist of minimal cross-border interactions occurring when previously alienated nation-states have reached a dispute resolution; (iii) interdependent borderlands, where both sides of the border are mutually connected, allowing the free flow of economic and human resources and (iv) integrated borderland forms when factors hindering trade and human movement are eliminated, and cross-border relations are achieved. Although Martinez (1994) [24] emphasises the nation-state relation in promoting or inhibiting cross-border interaction, the author also acknowledged the socio-economic and cultural complexity of borderland spaces. Borderlanders may exploit the border in favour of regional interests and ignore nation-state cross-border interaction status. This contrast of cross-border relations between central governance and the local group in borderlands reveals the importance of assessing and understanding cross-border interactions at different levels of governance, i.e., national, regional and local. Paasi (2022) [25] posits that borders are mobilised by different actors, from individuals to institutions such as politicians, civil servants, and legislators, often resulting in contrary objectives in how borders are organised, governed, and regulated. Thus, national and local government-level strategic plans may reveal different degrees of attachment and visions towards the border.

1.2. Planning Policies in Border Regions and Border Regions in Planning Policies

In the last century, planning has undergone a series of rejuvenations. The Garden City movement, which began with planning forefather Ebenezer Howard, played a pivotal role in planning principles and approaches in the early 1900s. The second half of the twentieth century marked a rise of master plans that became a blueprint of planning practices post-World War II. In contemporary planning, boundaries and borders are increasingly becoming complex due to the emergence of megacity regions and peri-urban’s increasing significance in ecological and sociocultural conservation [26]. The complexity becomes even more disordered when spatial planning involves an international border.
Planners tend to consider borders as physical demarcations that create a confined geographical context for planning practice [10]. As a result, development concepts, strategies and plans for national, sub-national, regional, and local territories often ignore what lies beyond the border. This limits the understanding of the complexity of borders. International borders should not be taken for granted in planning practices but require a better understanding of the diversities and embracing cross-border regional integration.
The bordering process consists of functional variables and takes many forms, including geopolitical, sociocultural, economic, and biophysical boundaries [26,27]. Understanding different boundary components provides a means to determine border-related planning challenges and steer towards solving common challenges in border regions through regional integration. Geopolitical boundaries open up for understanding neighbouring countries’ different planning and legal processes that can be utilised to create a broad spectrum of stakeholder involvement, even across the border. Sociocultural boundaries demand recognition of the identities of social groups and the cultural heritages that divide or unite nation-state societies in border regions. Economic boundaries have been well documented as globalisation has accelerated economic transactions across borders, and it is widely known that no economy can successfully operate only within the border confinement. Biophysical boundaries encompass natural features, such as major rivers and nature conservation sites (e.g., Kgalagadi Transfrontier Park between Botswana and South Africa). These sites challenge planners to consider new approaches that will integrate cross-border critical ecological landscapes in spatial development plans to secure environmental protection, mitigate climate change-induced disasters, and promote tourism activities. Paasi (2011) [28] reiterates that borders are complex and context-bound phenomena. Thus, recognising such divergent components is crucial for strategic planning in border regions.
Cross-border regions require innovative government interventions that reach beyond the existing state’s territorial jurisdictions in favour of an integrated policy approach [5,6]. Strategic plans can play an instrumental role in coordinating, steering and guiding policies and stakeholders to counteract border-related limitations and exploit the border regions’ opportunities and potentials [8,29]. The well-planned spatial plans in borderlands should utilise borders as a resource, promote cross-border development initiatives, and attract private and public investments, innovation, and human capital.

1.3. Case of South Africa: Borderland Municipalities’ Strategic Plans

In South Africa, colonial and apartheid segregation served as highly sophisticated systems of labour regulation, racial segregation and exploitation, with a key of dispossessing Black African people of their land and livelihoods [30]. Under the apartheid regime, the role of local governments was limited to delivering basic services. Spatial development was implemented through a rigid top-down approach, with decisions mainly taken at the national level to benefit the White minority. Cities were the main sites of apartheid spatial order, resistance, struggles, and protest [31]. The apartheid officially ended in 1994, and the new democratic government came into power. However, the legacy of colonialism and apartheid had left the spatial layout of South Africa with a particular racially and class-segregated residential pattern known as the ‘Apartheid City’ [32]. Residential areas occupied by the White population had a concentration of socio-economic resources. In contrast, the Black African city dwellers lacked essential resources and socio-economic opportunities and lived marginalised in urban peripheries and rural areas. The post-apartheid government under the democratic leadership of the African National Congress (ANC) recognised that a conflict resolution of extreme inequality and lack of access to basic services within the Black African residential areas could not be secured without developmental interventions. The democratic government sought to implement spatial transformation to reverse the legacy of apartheid through various development initiatives. It adopted the grassroots approach and active involvement of civil society in development planning. Local municipalities were empowered to take responsibility for ‘developmental local government’.
Efforts to decentralise development planning included the adoption of the Integrated Development Plan (IDP) in 1995, supporting coordinated delivery for reconstruction and development. The Local Government Transition Act Second Amendment Act No.97 of 1996 made the IDP formulation a legal requirement for local councils [33]. The IDP enabled a municipal council’s integrated development and management of a municipal area. The White Paper on Local Government, launched in March 1998, further strengthened the coordination of the municipalities, making the local authorities the central body of the government’s development activities. The concept of developmental government expressed in the White Paper identified the importance of integrated development planning [34]. Today, the IDP remains one of the key strategic approaches to South Africa’s post-apartheid development [35].
Despite efforts to decentralise development planning, the national government maintains primary responsibility for coordinating and executing cross-border development plans. Departments such as the Department of Cooperative Governance and Traditional Affairs (COGTA) and the Department of International Relations and Cooperation (DIRCO) are tasked with managing intergovernmental relations, negotiating agreements with neighbouring countries, and supervising cross-border projects. Additionally, departments like the Department of Agriculture, Land Reform and Rural Development (DALRRD) may participate in specific areas of cross-border development, such as rural development and land reform initiatives. While local municipalities are empowered to engage in ‘developmental local government’, their involvement in cross-border development planning is typically subordinate to the provincial and national levels due to the intricate nature and broad scope of such projects.
The IDP in South Africa is essentially a five-year plan that each municipality compiles and is reviewed yearly. Its lifespan corresponds directly to the term of office for local councillors. After every local government election, the new council has to decide on the future of the IDP. The council can adopt the existing IDP or develop a new one that considers existing plans. The formulation of municipal Integrated Development Plans (IDPs) in South Africa is primarily the responsibility of the municipality itself, as outlined in legislation such as the Local Government Municipal Systems Act 32 of 2000 and the Spatial Planning and Land Use Management Act 16 of 2013. These laws mandate that municipalities must prepare and adopt IDPs, which serve as strategic plans guiding development activities within their jurisdictions. While municipalities may seek external assistance or consultation during the process of formulating their IDPs, such as hiring private consultants, the overall responsibility for developing and finalising the plan rests with the municipality and its officials. Private consultants may provide expertise, technical support, or assistance in data analysis, community engagement, or strategic planning, but the municipality remains accountable for the content and decisions made in the IDP. The extent of involvement of private consultants in IDP formulation may vary among municipalities, depending on factors such as available resources, capacity, and expertise within the municipality itself. However, the municipality ultimately retains ownership and oversight of the IDP process to ensure that it reflects the needs and priorities of the local community and complies with legal requirements. Strategic plans, in essence, also reveal the role of borderland municipalities in cross-border integration initiatives. Given the critical role IDP plays in developmental decisions in South Africa, the IDP documents of borderland municipalities were analysed to determine to what extent issues related to international borders are addressed.
Borderland municipalities can be described as municipal administrative areas along historically developed political and material borders where differences are constructed, especially between nation-states. Borders can act as a bridge or barrier to connecting or dividing nation-states [36]. Cross-border relations are the driving force for regional integration; they create cross-border flows between two or more sovereign entities or territories across the physical barriers and foster dynamic interaction, including various socio-economic, political and cultural exchanges [37]. Development policy approaches affect borders and may promote or hinder regional integration with neighbouring countries.

2. Materials and Methods

2.1. Spatial Analysis

Borderlands, serving as transitional zones between different geographic, political, or cultural entities, are pivotal in shaping regional dynamics and socio-economic interactions. Accurate delineation of these borderlands is imperative for effective spatial analysis, policy formulation, and regional planning. In this study, the Haggett Form Index was employed to systematically identify borderland municipalities within South Africa’s 2016 municipal boundary layer. The Haggett Form Index provides a quantitative measure of boundary complexity, enabling the objective delineation of geographic transitional areas.
The following formulas, adapted from Horváth (2007) [38], were employed to achieve this:
F = 1.27 t / d 2 ;
F = Haggett form index; t = area of the country; d = is furthest points of the country
F = 1.27 ( 1213090 ) / ( 1821 2 ) = 0.46
Width of the buffer zone: P = F ∗ (T/K); F = Haggett form index; P = width of the buffer zone; K = circumference of the shape; T = area of the shape
P = F T K = 0.46 1213090 6320 = 89   k m

2.2. Geographic Scope

The 89 km served as a quantitative borderland delineation to identify borderland municipalities within South Africa’s 2016 municipal boundary layer. Using QGIS, municipal boundary polygons were first converted into centroids. All centroids within the 89 km of the political boundary line were categorised as borderland municipalities. The non-borderlands were inland beyond 89 km or the coastal area. There are 48 borderland local municipalities and one borderland metropolitan municipality. Joe Morolong Local Municipality displays a special case which is accounted for in the delimitation process. Although its centroid is outside the buffer, the municipality is directly located along the international land boundary line, making it inherently a borderland municipality. Thus, Joe Morolong is included as part of the 48 borderland local municipalities (Figure 1).

2.3. Data Collection

The data collection process involved searches on the official websites of each municipality and retrieving the most recent iterations of IDP documents from 49 borderland municipalities. The dataset includes one document from 2012, one from 2018, five from 2020, four from 2021, and the majority, comprising 38 documents, sourced from 2022. This variation in document vintages reflects differences in municipalities’ capacity to regularly update and maintain their planning documents over time.

2.4. Thematic Coding

A qualitative content analysis was conducted using a deductive and inductive approach to allow for the interpretive analysis of the data [39,40]. The text coding process utilised the Key-Word-in-Context (KWIC) content analysis technique, which helps to determine the meaning of certain words in the text within its context [41]. The texts from IDPs of 49 borderland municipalities were coded, and themes were directly drawn from the collected data. The coding process involved four steps:
  • The pre-determined keyword ‘border’ was searched in the IDPs to analyse the context in which each word appeared;
  • Sentences that contained the keyword were retrieved for the text coding process. Words containing prefixes and suffixes were also included, while paragraph titles were excluded;
  • If the context of the keyword border was related to the South African internal boundary instead of the international boundary, these words were not included in the text coding process. For example, Setsoto Local Municipality is bordered by Mantsopa Local Municipality;
  • Coding emerging themes from the extracted sentences for each municipality and categories were formulated.
The limitation of this above-detailed systematic research method is that words with similar connotations and synonyms were not included, and only sentences containing the selected words were examined in their larger textual context.
A five-point Likert scale was used to group the municipalities based on the frequency of using the keyword border in their IDPs. Then, nine thematic categories were set up, defining the scope of information related to the word border. Finally, tables and figures were drawn to find the geographical and contextual interpretation of the international borders of South Africa.
During the analysis, special attention was given to the location of the municipalities with regard to the neighbouring countries. If a countrywide analysis is applied, it should be noted that the number of municipalities located along the borders influences the number of occurrences of the word border, but thematically it has less—or no—relevance. Therefore, the basic indicators of the border areas of South Africa are complemented with the so-called municipality concentration (MC) value (Column E), proposed by the authors to highlight a new aspect for the interpretation of the differences between the border municipalities of South Africa, as shown in Table 1.

3. Results

3.1. Word Analysis Approach: Frequency of Mentioning the Keyword Border

Borderland municipalities with direct border locations (39) geographically share one or more international boundary lines with South Africa’s neighbouring countries, and borderland municipalities with indirect border locations (10) do not have a geographical contact line with South Africa’s neighbouring countries. Table 2 shows that in the 49 IDPs, the keyword border appears only 5–6 times on average, with seven municipalities not mentioning it at all. In municipalities with indirect border locations, the IDP typically mentions the border rarely or very rarely (70%). It is only in 1 IDP (10%) where the border is mentioned more than five times. Conversely, the frequency of mentioning is more evenly distributed in the case of municipalities with direct border locations (rare or very rare: 46% and less frequent or frequent: 41%). This suggests that location plays a determining role in the frequency of the mentioning of the border in the IDPs.
The municipalities along the six border regions (Eswatini, Mozambique, Lesotho, Zimbabwe, Botswana and Namibia) have different physical geographical characteristics, size and demography, and consequently, vary in their economic potentials and social policies. Relatively (considering the length of the border and the number of municipalities along it), the number of municipalities is the lowest along the longest borders with the two northern neighbours (Namibia and Botswana) and along its shortest border with Zimbabwe (Table 1). At the same time, the municipalities along the eastern borders of South Africa (Lesotho, Eswatini) are the smallest in average area size, including the smallest municipalities, while the population size is among the highest and thus has relatively high population density (Table 3, Table 4 and Table 5). These indicators are in strong connection with the physical geographical and climatic features of South Africa. These factors are also considered, especially concerning the themes of the activities mentioned in relation to the keyword border.
Nine out of the first ten largest border municipalities exceeding 10,000 square kilometres can be found along the border with Namibia and Botswana. Nine of the ten smallest border municipalities are located along the borders with Lesotho or Eswatini, and their area is below 3400 square kilometres. A region constitutes the only (surprising) exception for both from the Mozambique-Zimbabwe border region (Musina and Thulamela, respectively, Columns H and I in Table 3). These values correspond with the municipality concentration values (except for Zimbabwe) of the examined border regions. Ranking the border municipalities along the six neighbouring countries shows exactly the same order as the ranking by the MC.
The population size distribution shows a more diverse trend, with the most extreme values present within the same border region. Only the municipalities along the border with Namibia are missing from the top ten municipalities, but they are dominating the last ten in the list with less than 80,000 people living on their territory, and two of them belong to those seven municipalities where the number of the population decreased in 2016 compared to the values of 2011. The population size has also been decreasing in many municipalities along the border with Botswana, which has similar physical geographical features as Namibia. It is seemingly becoming a ‘neglected’ border region. The municipalities along the border with Mozambique boast the highest population size, and the population showed a steadily increasing pattern between 2011 and 2016, with Musina producing the highest increase (+0.26%) among all border municipalities (Columns K, L and M in Table 4). There is no correspondence with the MC regarding the population size, which also suggests that the same is true for the population density observed along the six border sections (Table 5).
Considering the above-described municipal area and population values, the results of the population density study are not surprising. However, two-thirds of the border municipalities fall below the national value (South Africa: 46.28 in 2016), suggesting that border municipalities are less densely populated than the other non-border municipalities. The deviation is the highest in the border municipalities along Zimbabwe and the lowest in the municipalities along the border with Namibia—that is, there are the smallest differences between the municipalities in terms of population density.
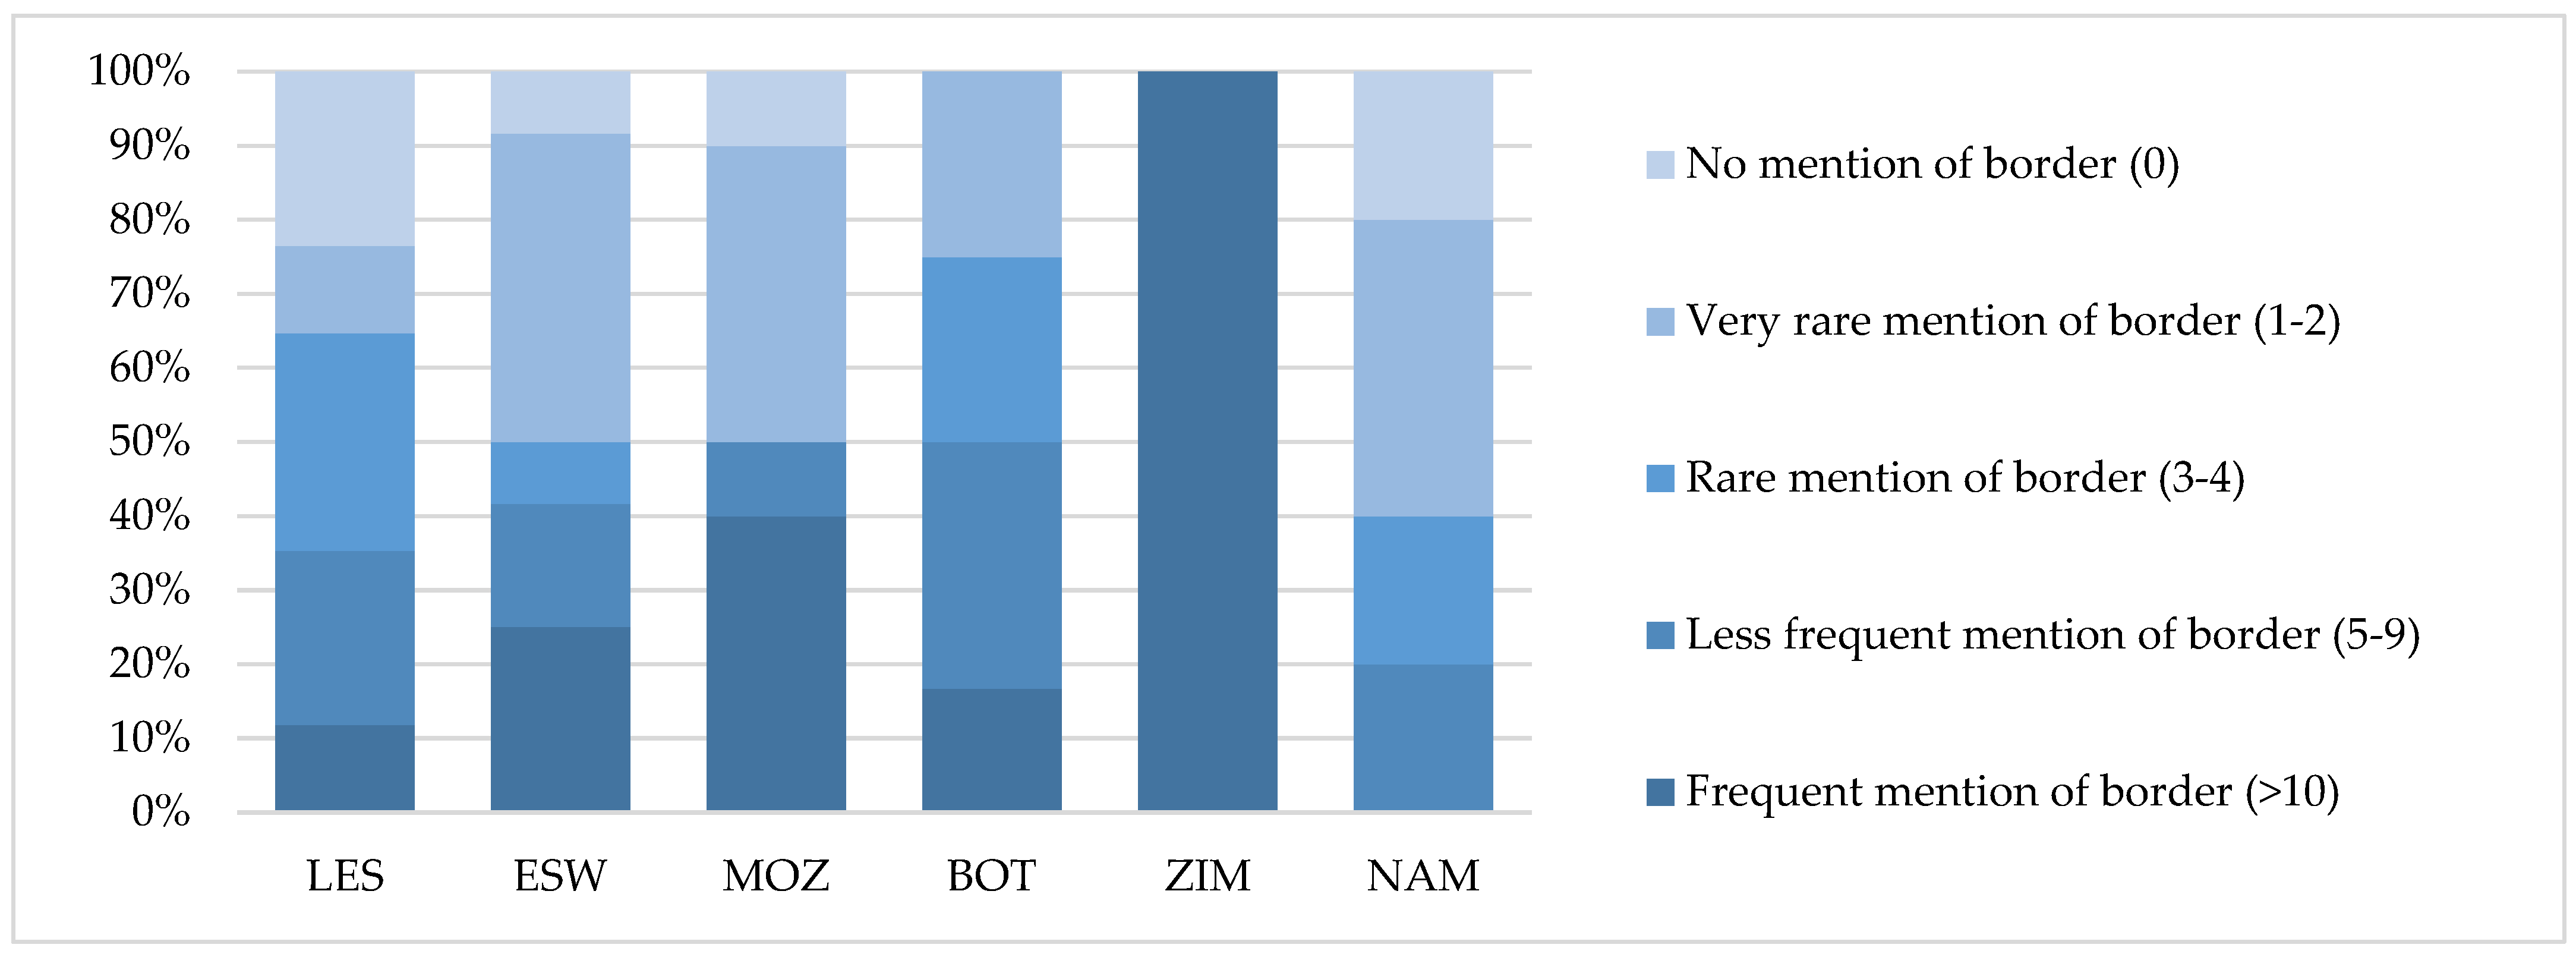
Data derived for the border regions reveal the local characteristics since it focuses on the occurrence of the keyword border in relation to the neighbouring countries. In this respect, it is evident that the municipalities bordering Zimbabwe (2) all consider borders important. Thus, these two local municipalities (Thulamela and Musina) fall into the category of frequent mentioning (Figure 2). It is worth noting that for the municipalities bordering Lesotho, the importance of the border seems to be the ‘least interesting’ (over 60% falls into the rare, very rare and no mention classification). In terms of frequency (more than five mentions in the IDP), the municipalities along the borders with Zimbabwe, Botswana and Mozambique are on top, exceeding 50%—although it should also be considered here that the municipality concentration (MC) of these three countries, the average size of the area and the population size of these municipalities are all different. The explanation for the relatively high number of references to the border can be found in the shared physical geographical features, and it is explained in the thematic section.
There is an association between the frequency of mentioning the keyword border and the municipality’s proximity to the international boundary line. Municipalities that directly share an international boundary with the neighbouring countries of South Africa have more frequent mention of the border except for one, Thulamela Local Municipality. Thulamela is located within 100 km of the state borders with Zimbabwe and Mozambique. Although the municipality lacks direct access to the neighbouring country, it is considered the gateway to the Kruger National Park, which forms part of the Great Limpopo Transfrontier Park connecting South Africa, Zimbabwe and Mozambique.
At the same time, five municipalities are located directly along the borderline but with no mention of the border. The reasons behind the lack of interest in the border location are complex. However, there are a few factors in common. Firstly, the lack of major regional or national road networks to link the municipalities with the neighbouring countries. Although some municipalities have major roads passing the territory, such as national roads (N5 and N3) passing through the Maluti-a-Phofung Local Municipality, they are poorly linked to the border. The Kai !Garib Local Municipality is an exception to the national route (N10) that connects with Namibia’s national highway (B3) at the border. Secondly, high unemployment rate; four municipalities have an unemployment rate above 40%, and the youth unemployment rate is over 50%. However, the Kai !Garib surprisingly has much lower employment, which can be attributed to its low population. The third possible factor is the high rural population ratio, as in four municipalities, the population lives in rural areas (traditional and farm areas). These factors create unfavourable conditions for promoting interest in developing cross-border relations. All five municipalities (Kai !Garib being relatively low) share common features, including low per capita income, high dependency ratio, high unemployment rate, and high ratio of the population living under the poverty line. Unfortunately, access to up-to-date exact data is very difficult due to differences in data supply varying between 2011 and 2019. Therefore, it can be interpreted only as trends for the past decade. The indicators included in the study have a significant influence on the living and acting in (border) regions—and it is clear that all of these factors are unfavourable for the promotion of productive (cross-border) cooperations in the case of the five municipalities directly located along the border but not mentioning the border (Table 6).

3.2. Thematic Analysis Approach: Emerging Themes Related to Border

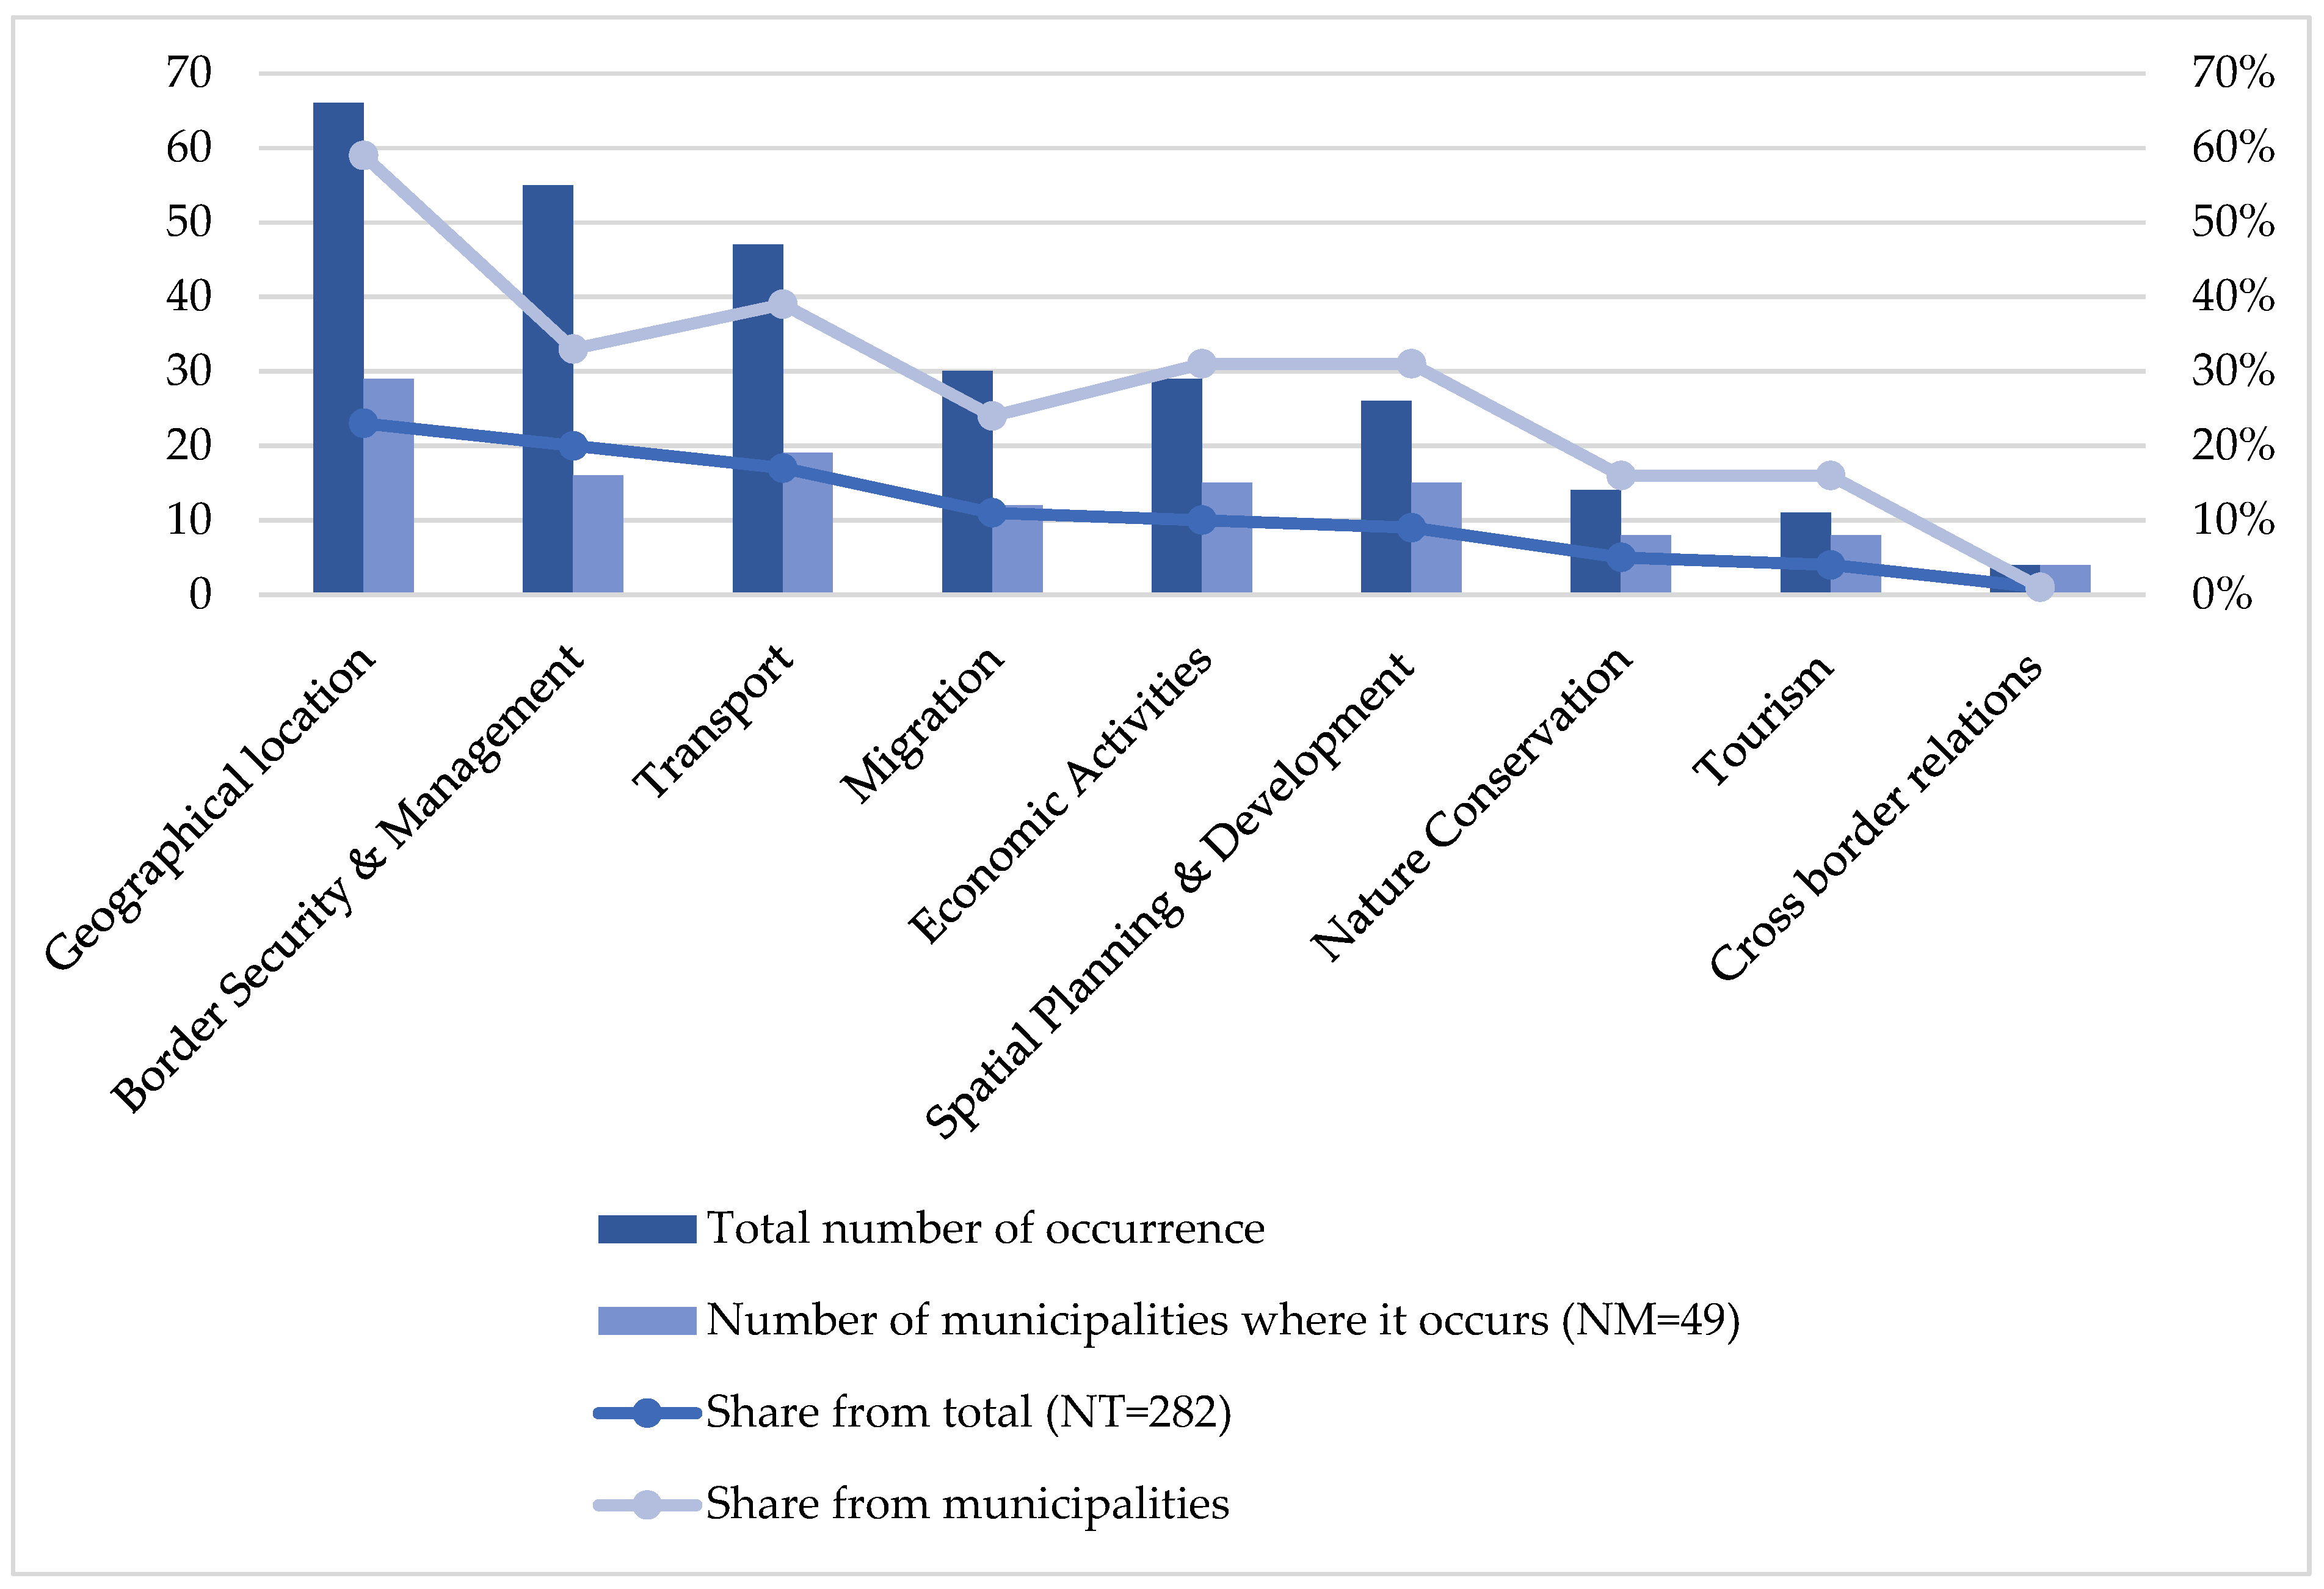
The themes emerging from the coded sentences suggest that borderland municipalities also show differences and share similarities. These were found to be in strong connection with the location of the municipalities. For thematic consideration, in the 49 IDPs, 282 sentences containing the keyword ‘border’ were extracted, and nine themes emerged from assessing the extracted sentences (Figure 3). In almost a quarter of the cases, the keyword border emerged within the context of the description of the geographical location of the municipalities. This shows a relatively weak identification with place and covers only 29 municipalities of the 49. Comparing the emerging themes, it can be seen that in four cases, the distribution of the occurrence was more even, with 30% of the municipalities mentioning the border related to (i) Geographical Location, (ii) Border Security and Management, (iii) Transport, (iv) Economic Activities and (v) Spatial Planning and Development. The issues of Migration, Nature Conservation and Tourism show a higher concentration of focus in the first case, resulting from the socio-economic situation of the neighbouring country and the others due to the natural features. These differences raise the question of whether there is a difference between the border sections, revealing the influence of the location and the relations with the neighbouring countries.
The thematic analysis included the consideration of the differences in the concentration of municipalities located along the borders of South Africa. Breaking down the border themes of municipalities’ IDP into six border regions highlighted the differences and showed that not all themes receive equal attention in the border regions (Table 7).
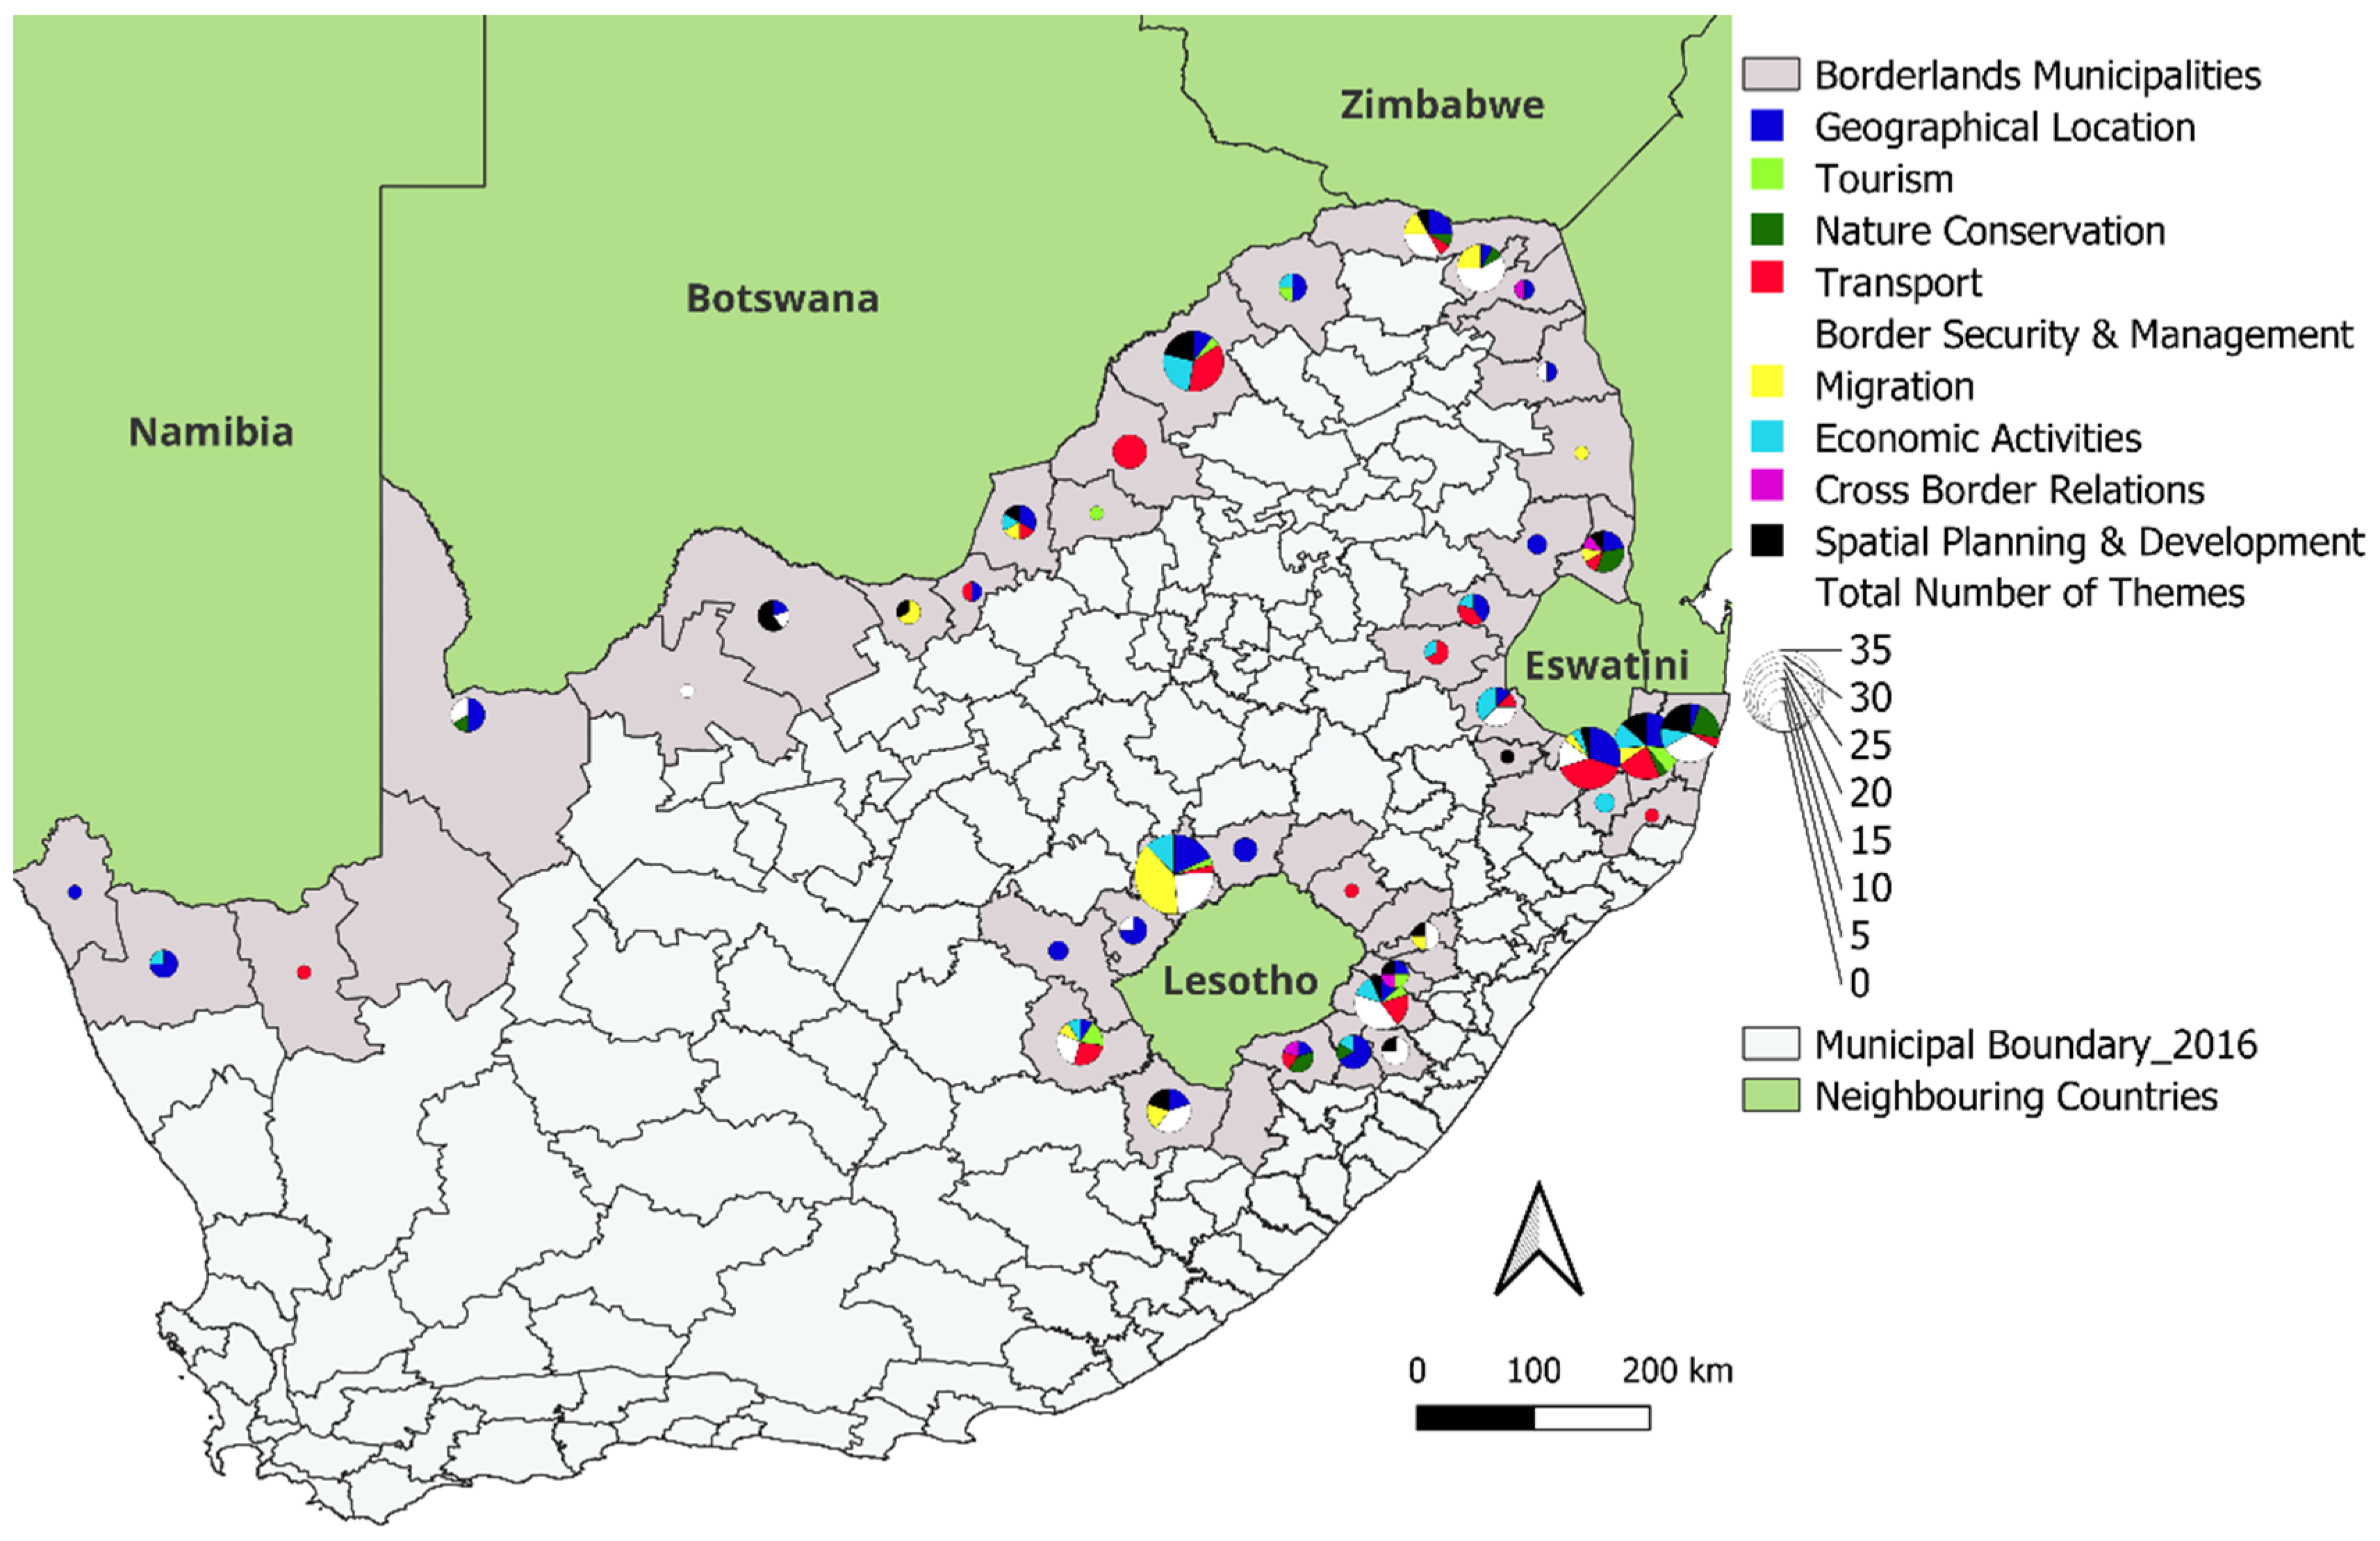
Mapping the frequency of mentioning the keyword border in terms of the thematic references by municipalities, the border regions along the borders with the six countries also show a distinct pattern. The number of mentions is the highest along the border with Eswatini and Lesotho and along the eastern part of the border with Botswana. Moreover, the thematic composition shows some signs of correlations: the mention of Transport is often paired with the mention of Economic Activities, while Migration and Border Security and Management also occur more frequently together in the IDPs of the same municipality. As these two-two themes may be considered interdependent, it suggests that a logically built and professionally well-supported approach is applied by the author(s) of the IDPs. The municipalities along the Namibian and Botswana borders have the lowest mention and the least diverse thematic considerations in general and in total. Contrary, the borders with Eswatini and Lesotho are the most diverse in terms of thematic diversity (Figure 4). These indicate a more intensive interest in borders, which suggests wider opportunities for potential cross-border activities.
After ranking the themes of the keyword border in the IDPs from the most frequently mentioned theme to the least by neighbouring countries, similarities and differences can be observed in the six border regions. Apart from the general description being present in most of the IDPs, the highest representation can be noted in the areas of Border Security and Management and Transport—as they were ranked first in five of the six border regions. However, these two themes also form a good basis for finding differences between the border regions. Where Border Security and Management is in the first place, Transport occupies only fourth or even fifth place, and vice versa. The border regions show the greatest variety in migration-related border actions. The most surprising is a similarity regarding the theme of Tourism which seems to be the least frequently used context for borders—even not mentioned at all in Zimbabwe and Namibia. Perhaps the presence—or rather absence—of Cross-Border Relations is not surprising, which is in the last place (or not even placed) in all cases (Table 8).
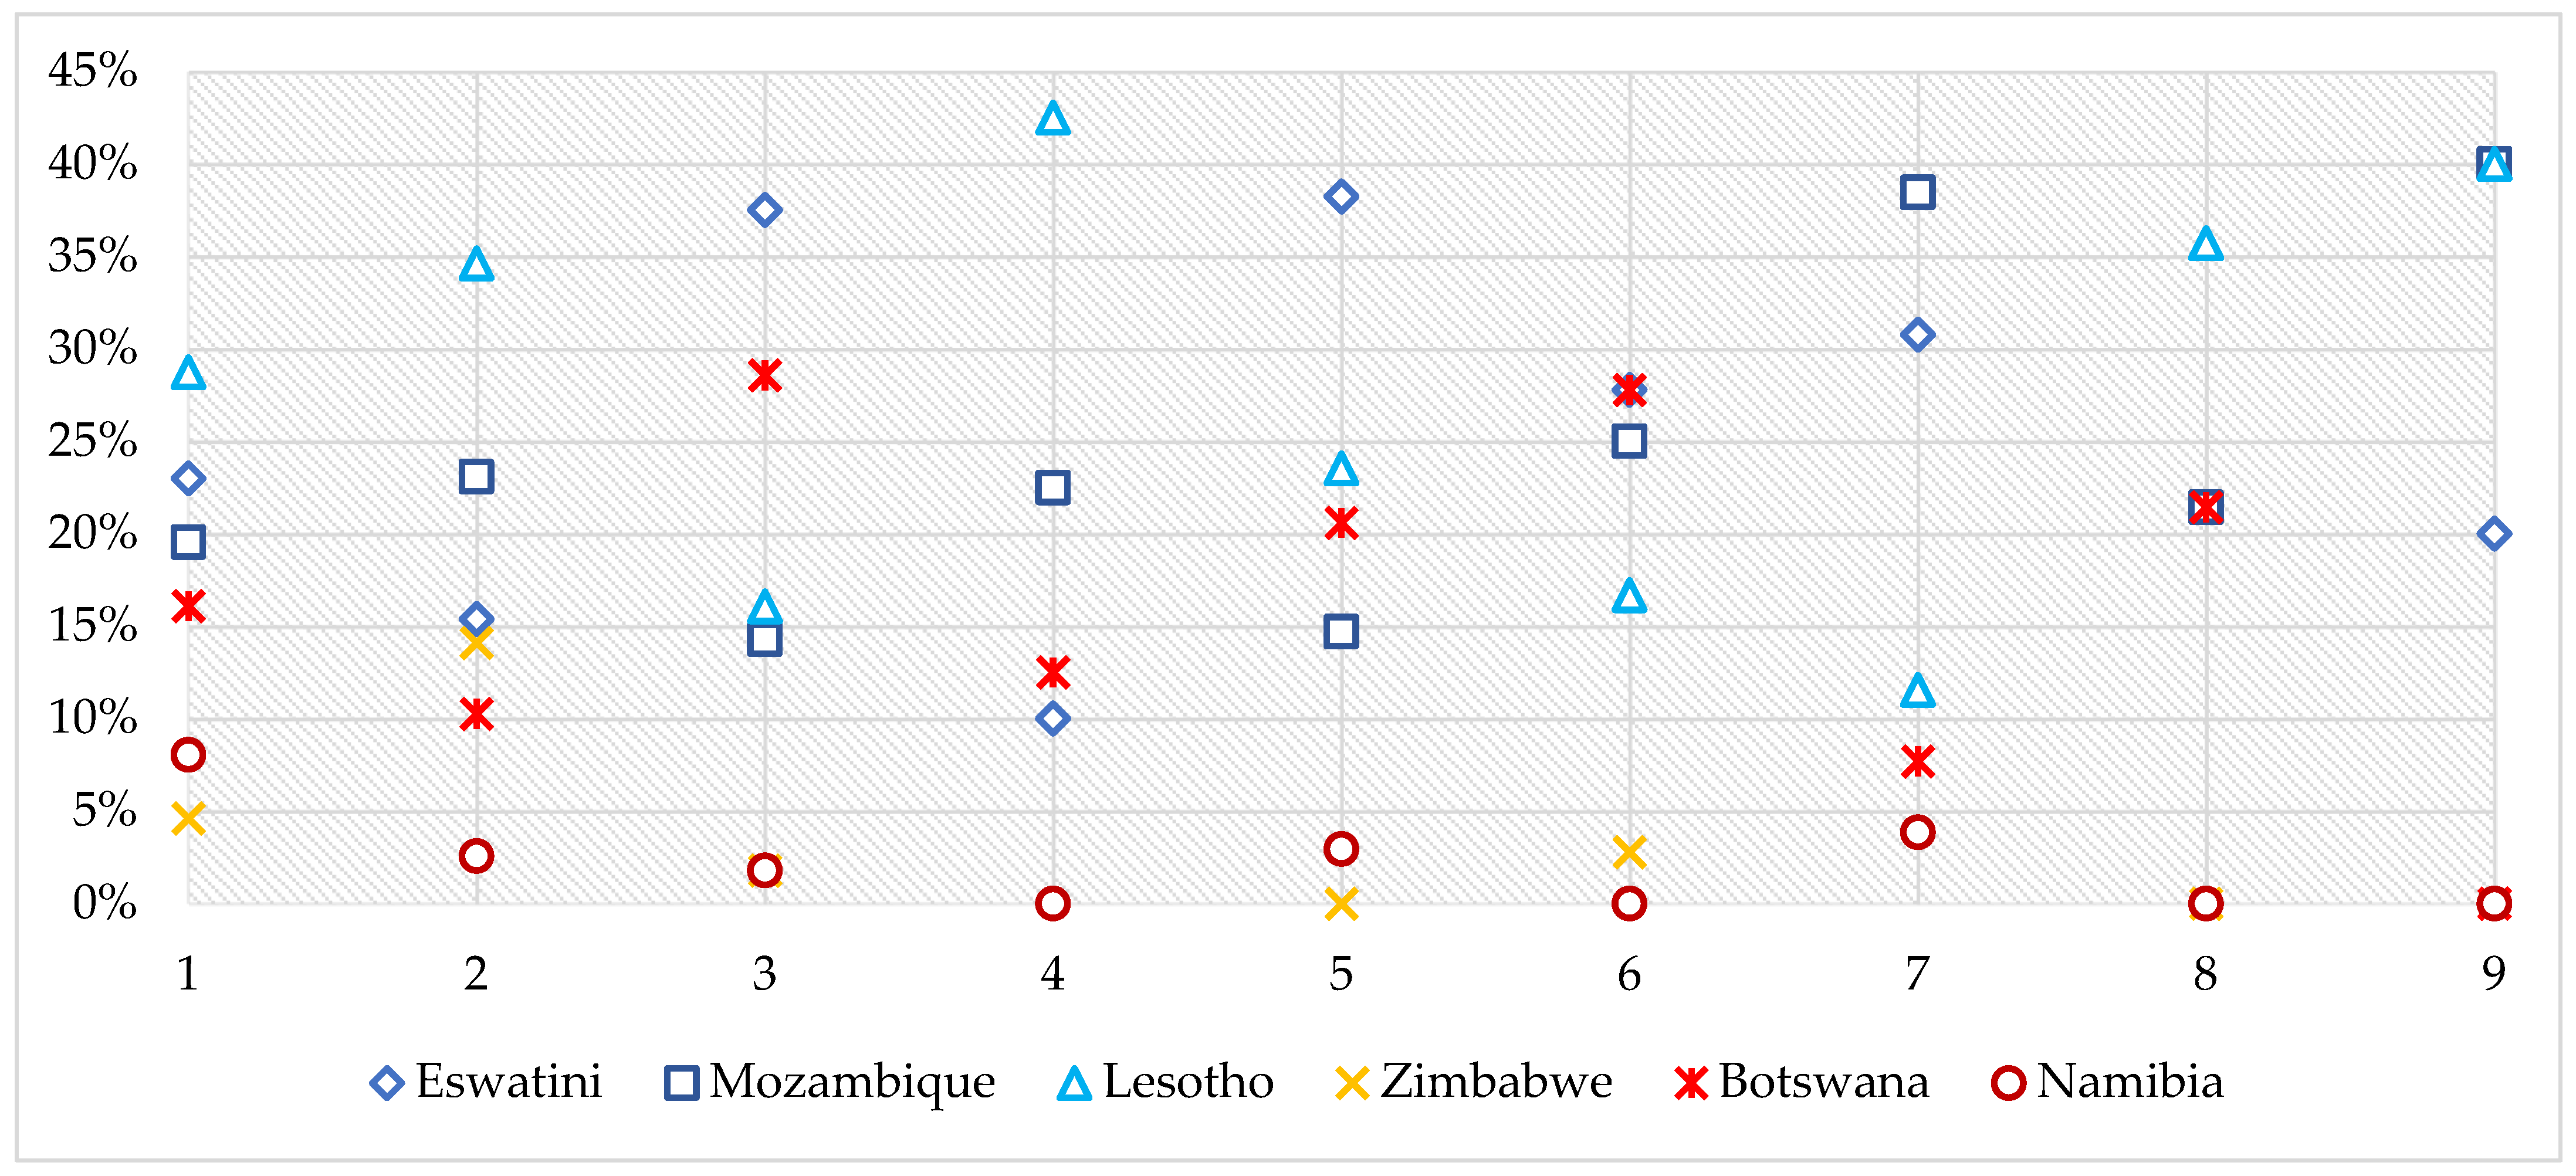
Based on further calculations and their analysis, it was found that the approaches for municipalities along the borders of South Africa can be divided into two distinct groups. Based on their common features, Namibia, Botswana and Zimbabwe are listed in Group 1, and Eswatini, Mozambique and Lesotho form Group 2 (Figure 5).
  • Group 1a: Less attention to the border with specific focuses—Neglected border regions
Albeit the border with Namibia is the second longest for South Africa, only five municipalities are located in the border region. This fact should not imply a neglect of this border region, but the analysis of their IDPs brought the poorest results. The keyword border is only mentioned as a feature used in describing the geographical location of the area in 3 of the municipalities. No (potential) development is associated with cross-border planning and integration. There are no plans with the border region regarding joint tourism issues or improving its transport network. Moreover, the IAi-IAis/Richtersveld Transfrontier Park, founded in 2003, is regarded as a unique mega-ecosystem of the world. However, it does not seem to play any critical role in fostering cross-border relations– and it is not even referred to as a specific cross-border element in the IDPs. It may be established that in this border region, potential border opportunities are not effectively utilised for spatial planning and development at the municipal level. Climatic conditions, physical features and vegetation are some factors that explain this lack of cross-border relations activities and associated developments. In the western border region, the Namib Desert stretches along the coast of South Africa and Namibia. Also, the Kalahari Desert is located along the South African-Namibian borderline in the northwestern part of South Africa. Due to these unfavourable conditions for human settlements, the population density in these border regions is relatively low, with low investment attraction for development. Another factor to be considered is the historical Orange River boundary dispute. Historically, Namibia claimed the border is in the middle of the river. At the same time, South Africa maintained that it is on the northern high-water mark, the boundary established when colonial powers Britain and Germany signed the Heligoland treaty in Berlin in 1890. Additionally, the fact that Namibia gained independence from South Africa in 1990 also affects the relationship between the two countries.
The border region with Zimbabwe also receives less attention than it deserves. Three themes (Economic Activities, Tourism, Spatial Planning and Development) do not even occur in the IDPs of the two municipalities. However, interestingly, Border Security and Management and Migration receive much greater attention than the other four themes. The relatively low interest in the border region can be explained by long-term economic stagnation and contraction in Zimbabwe, making it unattractive for cross-border development initiatives. Moreover, South Africa-Zimbabwe is the shortest border region. Although two municipalities are located along this border section, the border is not exclusive for either. Thulamela also borders Mozambique, and Musina is the only municipality located along three border regions (Mozambique, Zimbabwe and Botswana). Both IDPs have a rather high level of using the keyword border in the Border Security and Management and Migration themes, with 11 and 5 mentions, respectively.
  • Group 1b: Emerging awareness of border: on the edge—Gaining or losing interest in the future
The border region with Botswana could also be regarded as transitory from the level of attention given to borders at the municipality level. However, it still has lower values and mentions than the border regions listed in Group 2. Except for “Cross-border relations”, all other themes appear with some of them—like Economic Activities and Spatial Planning and Development—even suggesting potential cross-border cooperation in the future. The Kgalagadi Transfrontier Park, which opened in 2000, is one of Africa’s major transfrontier conservation areas and serves as an important element of the emerging joint economic development and ecotourism endeavours along the border between South Africa and Botswana [44]. Lephalale and Thabazimbi Local Municipality (located next to each other) both refer to the international border in relation to transport frequently, also stating that ‘border post and proposed border post…have the potential to establish closer links with Botswana’. In the case of Lephalale, the Transport theme is also paired with a frequency of mentioning Economic Activities and Spatial Planning and Development. This is evidence of willingness to create future cross-border relations in the border region. The IDP of Thabazimbi focuses exclusively on transport issues when mentioning the border, expressing its aim to upgrade roads linking South Africa with Botswana. Notably, the three easternmost municipalities are the only ones that mention the importance of border control in their IDPs. A high concentration of border security and management issues is found in this respect. In the case of the Joe Morolong Local Municipality, there is a reference to constructing a 25 km long border fence at Hotazel.
  • Group 2: Growing interest in border regions—Potential cross-border cooperations
The municipalities along the western borders of South Africa show more interest in the border and border-related activities. For example, all nine themes can be found in the IDPs of the municipalities along the border with Eswatini, Mozambique and Lesotho. As seen in Table 1, these borders also have higher municipality concentrations. Therefore, their categorisation into Group 2 could be seen as pre-determined. Notwithstanding, it is not only a mere consequence of numbers but also social and economic reasons behind it. The relationship between South Africa and these three countries differs from that with its northern neighbours. Though the border with Eswatini is relatively short, the relative number of municipalities is the highest here. The transport-related border issues are outstanding compared to the borders with the other five neighbouring countries, and Economic Activities are the most often mentioned issues concerning the border. As cross-border cooperation can be expected to emerge from the joint development of these two sectors, the municipalities along the border with Eswatini display high potential for establishing future cross-border cooperation. Another interesting observation is that the issue of Nature Conservation exclusively appears in the case of those four municipalities which belong to the border region with Mozambique as well—which suggests that this area can also be interpreted as a point of interest being a tripoint border.
Almost two-thirds of the municipalities along the border with Mozambique are also located in the border regions of other countries (Eswatini, Zimbabwe and Botswana), which provides special circumstances for them. The foundation of the Limpopo Transfrontier Park in 2000 explains the high importance of Nature Conservation related to borders in the IDPs, which differentiates it from the other two countries of Group 2. Paired with Spatial Planning and Development, this border region could become a good practice for cross-border nature conservation in South Africa and the six neighbouring countries.
The case of Lesotho is perhaps the most interesting, as it is an enclave country within South Africa (only three enclaves worldwide). This creates a unique situation for Lesotho. Any potential cross-border initiatives have only one neighbouring country as an option. It is also important to maintain good neighbourly relations as the location pre-determines some kind of dependence for Lesotho. Furthermore, Lesotho was a public opponent of apartheid in South Africa and granted political asylum for several South African refugees during the apartheid era. The Setsoto Local Municipality, located along the northern border section, pays the closest attention to border-related issues, especially Migration, Border Security and Management, and Economic Activities. Interestingly, the issue of migration was exclusively related to the restrictions as a consequence of the COVID-19 pandemic restrictions, with only weak references to the question of non-residential immigrants being present in Setsoto. As for the issue of border security and management, the region strives to tighten security, and the exact number and location of police stations and border posts are specified to maintain security in the municipality’s area. Existing border services and links are also regarded as factors contributing to economic activities between the two countries in the border region.
Overall, cross-border relations are mentioned four times in the IDPs of the 49 municipalities, of which two are located along the border with Lesotho (more precisely, along the southeastern border).

4. Conclusions

The occurrence of border-related themes in the Integrated Development Plans (IDP) varies in accordance with the direct or indirect location of borderland municipalities from the international border and by the neighbouring country. The following conclusions can be drawn from the aggregate results:
  • The frequency of the mentioning of the keyword border shows a close relation with the differences in municipality concentration along the borders, as well as with the area and population size of the border municipalities;
  • As expected, the keyword border is mentioned concerning the geographical description of over 50% of the municipalities along every border section of South Africa. In the case of Zimbabwe and Namibia, they occur in the IDPs of every border municipality;
  • ‘Border’ is least frequently mentioned in terms of three thematic considerations: Spatial Planning and Development, Tourism and Cross-border Relations. In Europe, tourism is the leading theme in cross-border projects, and regional planning and development is also the most frequently named element of cross-border projects (10th out of 42) [45].
  • Nature conservation is a theme pursued by at least 50% of the municipalities along the borders with three neighbours (Mozambique, Zimbabwe and Namibia). In Greater Giyani Local Municipality, which shares a very short border with Mozambique, the Great Limpopo Transfrontier Park could generate a common source of interest in the future.
This paper has contributed explicitly to understanding state borders’ importance (or lack thereof) within municipal planning strategies. Borderland municipalities’ IDP in the six border regions (Eswatini, Mozambique, Lesotho, Zimbabwe, Botswana and Namibia) show evidence of co-existent borderlands, in which municipalities, to some extent, are willing to interact with the nation-state on other sides of the border through themes such as Transport, Economic Activities, Spatial Planning and Development, Nature Conservation, Tourism and Cross-border Relations. However, the Border Security and Management theme was often associated with initiatives to make the border less porous. At the same time, the Migration theme was associated with concerns regarding the influx of illegal migrants in borderland municipalities and the flow of the labour market. These suggest that local stakeholders at the municipal level conceptualise the border mainly as a source of insecurity that must be combated. Thus, this finding challenges the role of stakeholders at different institutional levels in influencing the outcomes of the cross-border spatial planning processes. The thematic analysis based on the coded sentences strengthened our assumption that the geographical location had a determining role in the perception of borders and border regions in South Africa. Future research analysing border considerations in spatial development plans should go beyond considering the context of the keyword border and evaluate the sentiment of the keyword.
In the post-apartheid era, IDPs in South Africa remained primarily confined within a geographical context. The thematic considerations revealed the complexity of border issues along the borders of South Africa and also showed the differences between the stakeholders’ positions regarding the relevance of border issues for the development of the local municipalities. The research findings suggest that the main reason inhibiting cross-border spatial planning and development considerations is that local municipalities lack the skills and financial resources to foster cross-border planning and development. This is due to the persistent dominant role of the national government in coordinating cross-border development initiatives in South Africa. Moreover, unfavourable physical environmental features such as arid climatic conditions (see, for example, the Namibian border) make potential cross-border development unviable.
Municipal policymakers have a responsibility to formulate plans that consider the interrelatedness of the bordering process and the livelihoods of borderland municipalities. Local authorities need to recognise the importance of planning beyond borders, which enables collaboration from both sides of the border that are mutually connected and creates joint development to address common challenges in border regions. The development plans are ideal for actively addressing border-related challenges because they involve multiple stakeholders’ participation and, to some extent, represent a balanced consensus, i.e., planners, academics, developers, civil servants, and politicians. It is essential that borderland municipalities include a section in the development plans that deals explicitly with border-related issues and future regional integration mandates. This will allow for a collaborative, participatory process for coherent cross-border planning processes. However, to achieve the above, it is essential to maintain good relations with the neighbouring countries to improve accessibility by creating cross-border road networks and links, to reduce the unemployment rate and to achieve a balanced employment structure.

Author Contributions

Conceptualisation, T.L.M. and K.C.; methodology, T.L.M. and K.C.; software, T.L.M.; validation, T.L.M. and K.C.; formal analysis, T.L.M. and K.C.; investigation, T.L.M.; resources, T.L.M. and K.C.; data curation, T.L.M. and K.C.; writing—original draft preparation, T.L.M. and K.C.; writing—review and editing, T.L.M. and K.C.; visualisation, T.L.M. and K.C.; supervision, K.C. All authors have read and agreed to the published version of the manuscript.

Funding

This research received no external funding.

Data Availability Statement

The original contributions presented in the study are included in the article, further inquiries can be directed to the corresponding author/s.

Conflicts of Interest

The authors declare no conflicts of interest.

References

  1. Fricke, C. Spatial Governance across Borders Revisited: Organizational Forms and Spatial Planning in Metropolitan Cross-border Regions. Eur. Plan. Stud. 2015, 23, 849–870. [Google Scholar] [CrossRef]
  2. Paasi, A.; Zimmerbauer, K. Penumbral borders and planning paradoxes: Relational thinking and the question of borders in spatial planning. Environ. Plan. A Econ. Space 2016, 48, 75–93. [Google Scholar] [CrossRef]
  3. Durand, F. Challenges of Cross-Border Spatial Planning in the Metropolitan Regions of Luxembourg and Lille. Plan. Pract. Res. 2014, 29, 113–132. [Google Scholar] [CrossRef]
  4. Cappellano, F.; Kurowska-Pysz, J. The Mission-Oriented Approach for (Cross-Border) Regional Development. Sustainability 2020, 12, 5181. [Google Scholar] [CrossRef]
  5. Blair, N.; Adair, A.; Bartley, B.; Berry, J.; Creamer, C.; Driscoll, J.; McGreal, S.; Vigier, F. Delivering cross-border spatial planning: Proposals for the island of Ireland. Town Plan. Rev. 2007, 78, 485–509. [Google Scholar] [CrossRef]
  6. Walsh, C.; Knieling, J. Creating a Space for Cooperation: Soft Spaces, Spatial Planning and Territorial Cooperation on the Island of Ireland. In Proceedings of the Planning for Resilient Cities and Regions, AESOP-ACSP Joint Congress, Dublin, Ireland, 15–19 July 2013. [Google Scholar]
  7. Decoville, A.; Durand, F. Challenges and Obstacles in the Production of Cross-Border Territorial Strategies: The Example of the Greater Region. Trans. Assoc. Eur. Sch. Plan. 2017, 1, 65–78. [Google Scholar] [CrossRef]
  8. Plangger, M. Exploring the role of territorial actors in cross-border regions. Territ. Politics Gov. 2019, 7, 156–176. [Google Scholar] [CrossRef]
  9. Durand, F.; Decoville, A. A multidimensional measurement of the integration between European border regions. J. Eur. Integr. 2020, 42, 163–178. [Google Scholar] [CrossRef]
  10. Jacobs, J. Spatial planning in cross-border regions: A systems-theoretical perspective. Plan. Theory 2016, 15, 68–90. [Google Scholar] [CrossRef]
  11. Peña, S.; Durand, F. Mobility planning in cross-border metropolitan regions: The European and North American experiences. Territ. Politics Gov. 2022, 10, 219–236. [Google Scholar] [CrossRef]
  12. Medeiros, E. Spatial Planning, Territorial Development, and Territorial Impact Assessment. J. Plan. Lit. 2019, 34, 171–182. [Google Scholar] [CrossRef]
  13. Albrechts, L. Strategic (Spatial) Planning Reexamined. Environ. Plan. B Plan. Des. 2004, 31, 743–758. [Google Scholar] [CrossRef]
  14. Healey, P. Collaborative Planning; Macmillan Education: London, UK, 1997; 338p. [Google Scholar] [CrossRef]
  15. Healey, P. In Search of the “Strategic” in Spatial Strategy Making. Plan. Theory Pract. 2009, 10, 439–457. [Google Scholar] [CrossRef]
  16. Petrón, M.A.; Greybeck, B. Borderlands Epistemologies and the Transnational Experience; Fronteras Epistemológicas y la Experiencia Transnacional. GiST Educ. Learn. Res. J. 2014, 8, 137–155. [Google Scholar] [CrossRef]
  17. Paasi, A. Inclusion, exclusion and territorial identities. The meanings of boundaries in the globalizing geopolitical landscape. Nord. Samhallsgeografisk Tidskr. 1996, 23, 3–17. [Google Scholar]
  18. Newman, D. Contemporary Research Agendas in Border Studies: An Overview. In The Ashgate Research Companion to Border Studies; Wastl-Walter, D., Ed.; Ashgate: Farnham, NY, USA, 2011; pp. 33–47. [Google Scholar]
  19. Johnson, C.; Jones, R.; Paasi, A.; Amoore, L.; Mountz, A.; Salter, M.; Rumford, C. Interventions on rethinking “the border” in border studies. Political Geogr. 2011, 30, 61–69. [Google Scholar] [CrossRef]
  20. Madsen, K.D. The Alignment of Local Borders. Territ. Politics Gov. 2014, 2, 52–71. [Google Scholar] [CrossRef]
  21. Bhaumik, S. Everyday Lives in Peripheral Spaces: A Case of Bengal Borderlands. Bord. Glob. Rev. 2021, 3, 12–23. [Google Scholar] [CrossRef]
  22. Wastl-Walter, D. Borderlands. In International Encyclopedia of Human Geography, 1st ed.; Kitchin, R., Thrift, N., Eds.; Elsevier: Amsterdam, The Netherlands, 2009; pp. 332–339. [Google Scholar]
  23. Popescu, G. Bordering and Ordering the Twenty-First Century: Understanding Borders; Rowman & Littlefield Publishers: Lanham, MA, USA, 2012. [Google Scholar]
  24. Martinez, O.J. The dynamics of border interaction: New approaches to border analysis. In Global Boundaries; Schofield, C.H., Ed.; Routledge: London, UK, 1994; pp. 1–15. [Google Scholar]
  25. Paasi, A. Examining the persistence of bounded spaces: Remarks on regions, territories, and the practices of bordering. Geogr. Ann. Ser. B Hum. Geogr. 2022, 104, 9–26. [Google Scholar] [CrossRef]
  26. Steele, W.; Alizadeh, T.; Eslami-Andargoli, L. Planning across borders. Aust. Plan. 2013, 50, 96–102. [Google Scholar] [CrossRef]
  27. Haselsberger, B. Decoding borders. Appreciating border impacts on space and people. Plan. Theory Pract. 2014, 15, 505–526. [Google Scholar] [CrossRef]
  28. Paasi, A. A Border Theory: An Unattainable Dream or a Realistic Aim for Border Scholars? In The Ashgate Research Companion to Border Studies; Wastl-Walter, D., Ed.; Ashgate: Farnham, NY, USA, 2011; pp. 11–31. [Google Scholar]
  29. Pallagst, K.; Hartz, A. Spatial planning in border regions: A balancing act between new guiding principles and old planning traditions? In Border Futures—Zukunft Grenze—Avenir Frontière: The Future Viability of Cross-Border Cooperation; Pallagst, K., Hartz, A., Caesar, B., Eds.; Verlag der ARL: Hannover, Germany, 2022; pp. 77–95. [Google Scholar]
  30. Donaldson, R.; Marais, L.; Etienne, N. Secondary Cities in South Africa. In Urban Geography in South Africa; Perspective and Theory, 1st ed.; Massey, R., Gunter, A., Eds.; Springer Nature: Cham, Germany, 2019; pp. 121–137. [Google Scholar]
  31. Maylam, P. Explaining the Apartheid City: 20 Years of South African Urban Historiography. J. South. Afr. Stud. 1995, 21, 19–38. [Google Scholar] [CrossRef]
  32. Christopher, A.J. Towards the post-apartheid city. L’Espace Géographique 1999, 28, 300–308. Available online: https://www.jstor.org/stable/44382626 (accessed on 10 January 2024). [CrossRef]
  33. Binns, T.; Nel, E. Devolving Development: Integrated Development Planning and Developmental Local Government in Post-apartheid South Africa. Reg. Stud. 2002, 36, 921–932. [Google Scholar] [CrossRef]
  34. Pycroft, C. Integrated development planning or strategic paralysis? Municipal development during the local government transition and beyond. Dev. South. Afr. 1998, 15, 151–163. [Google Scholar] [CrossRef]
  35. Odendaal, N.; McCann, A. Spatial planning in the global South: Reflections on the Cape Town Spatial Development Framework. Int. Dev. Plan. Rev. 2016, 38, 405–423. [Google Scholar] [CrossRef]
  36. Wastl-Walter, D. Borderlands. In International Encyclopedia of Human Geography, 2nd ed.; Kobayashi, A., Ed.; Elsevier Science: Amsterdam, The Netherlands, 2019; pp. 373–379. [Google Scholar]
  37. Nshimbi, C.C.; Moyo, I.; Oloruntoba, S.O. Borders, Informal Cross-Border Economies and Regional Integration in Africa. Afr. Insight 2018, 48, 3–11. [Google Scholar]
  38. Horváth, E. A földrajzi centrum és periféria lehetséges lehatárolásai. (Possible methods for demarcating core and periphery areas in geography). Tér Társadalom (Space Soc.) 2007, 21, 159–170. [Google Scholar] [CrossRef]
  39. Berg, B.L.; Lune, H. Qualitative Research Methods for the Social Sciences, 9th ed.; Pearson: Boston, MA, USA, 2017; 251p. [Google Scholar]
  40. Kibiswa, N. Directed Qualitative Content Analysis (DQlCA): A Tool for Conflict Analysis. Qual. Rep. 2019, 24, 2059–2079. [Google Scholar] [CrossRef]
  41. Weber, R.P. Basic Content Analysis, 2nd ed.; Sage University Papers Series; Quantitative Applications in the Social Sciences; McElroy, S., Ed.; Sage Publications: Newbury Park, CA, USA, 1990. [Google Scholar]
  42. Municipalities of South Africa. Available online: www.municipalities.co.za (accessed on 10 January 2024).
  43. Statistical Data of South Africa. Available online: https://www.statssa.gov.za/ (accessed on 10 January 2024).
  44. South African National Parks. Great Limpopo Transfrontier Park. Available online: https://www.sanparks.org/conservation/transfrontier/great-limpopo/overview (accessed on 10 January 2024).
  45. Aggregated Data Regarding Projects and Beneficiaries of European Union Cross-Border, Transnational and Interregional Cooperation Programmes. Available online: https://keep.eu/statistics (accessed on 12 January 2024).
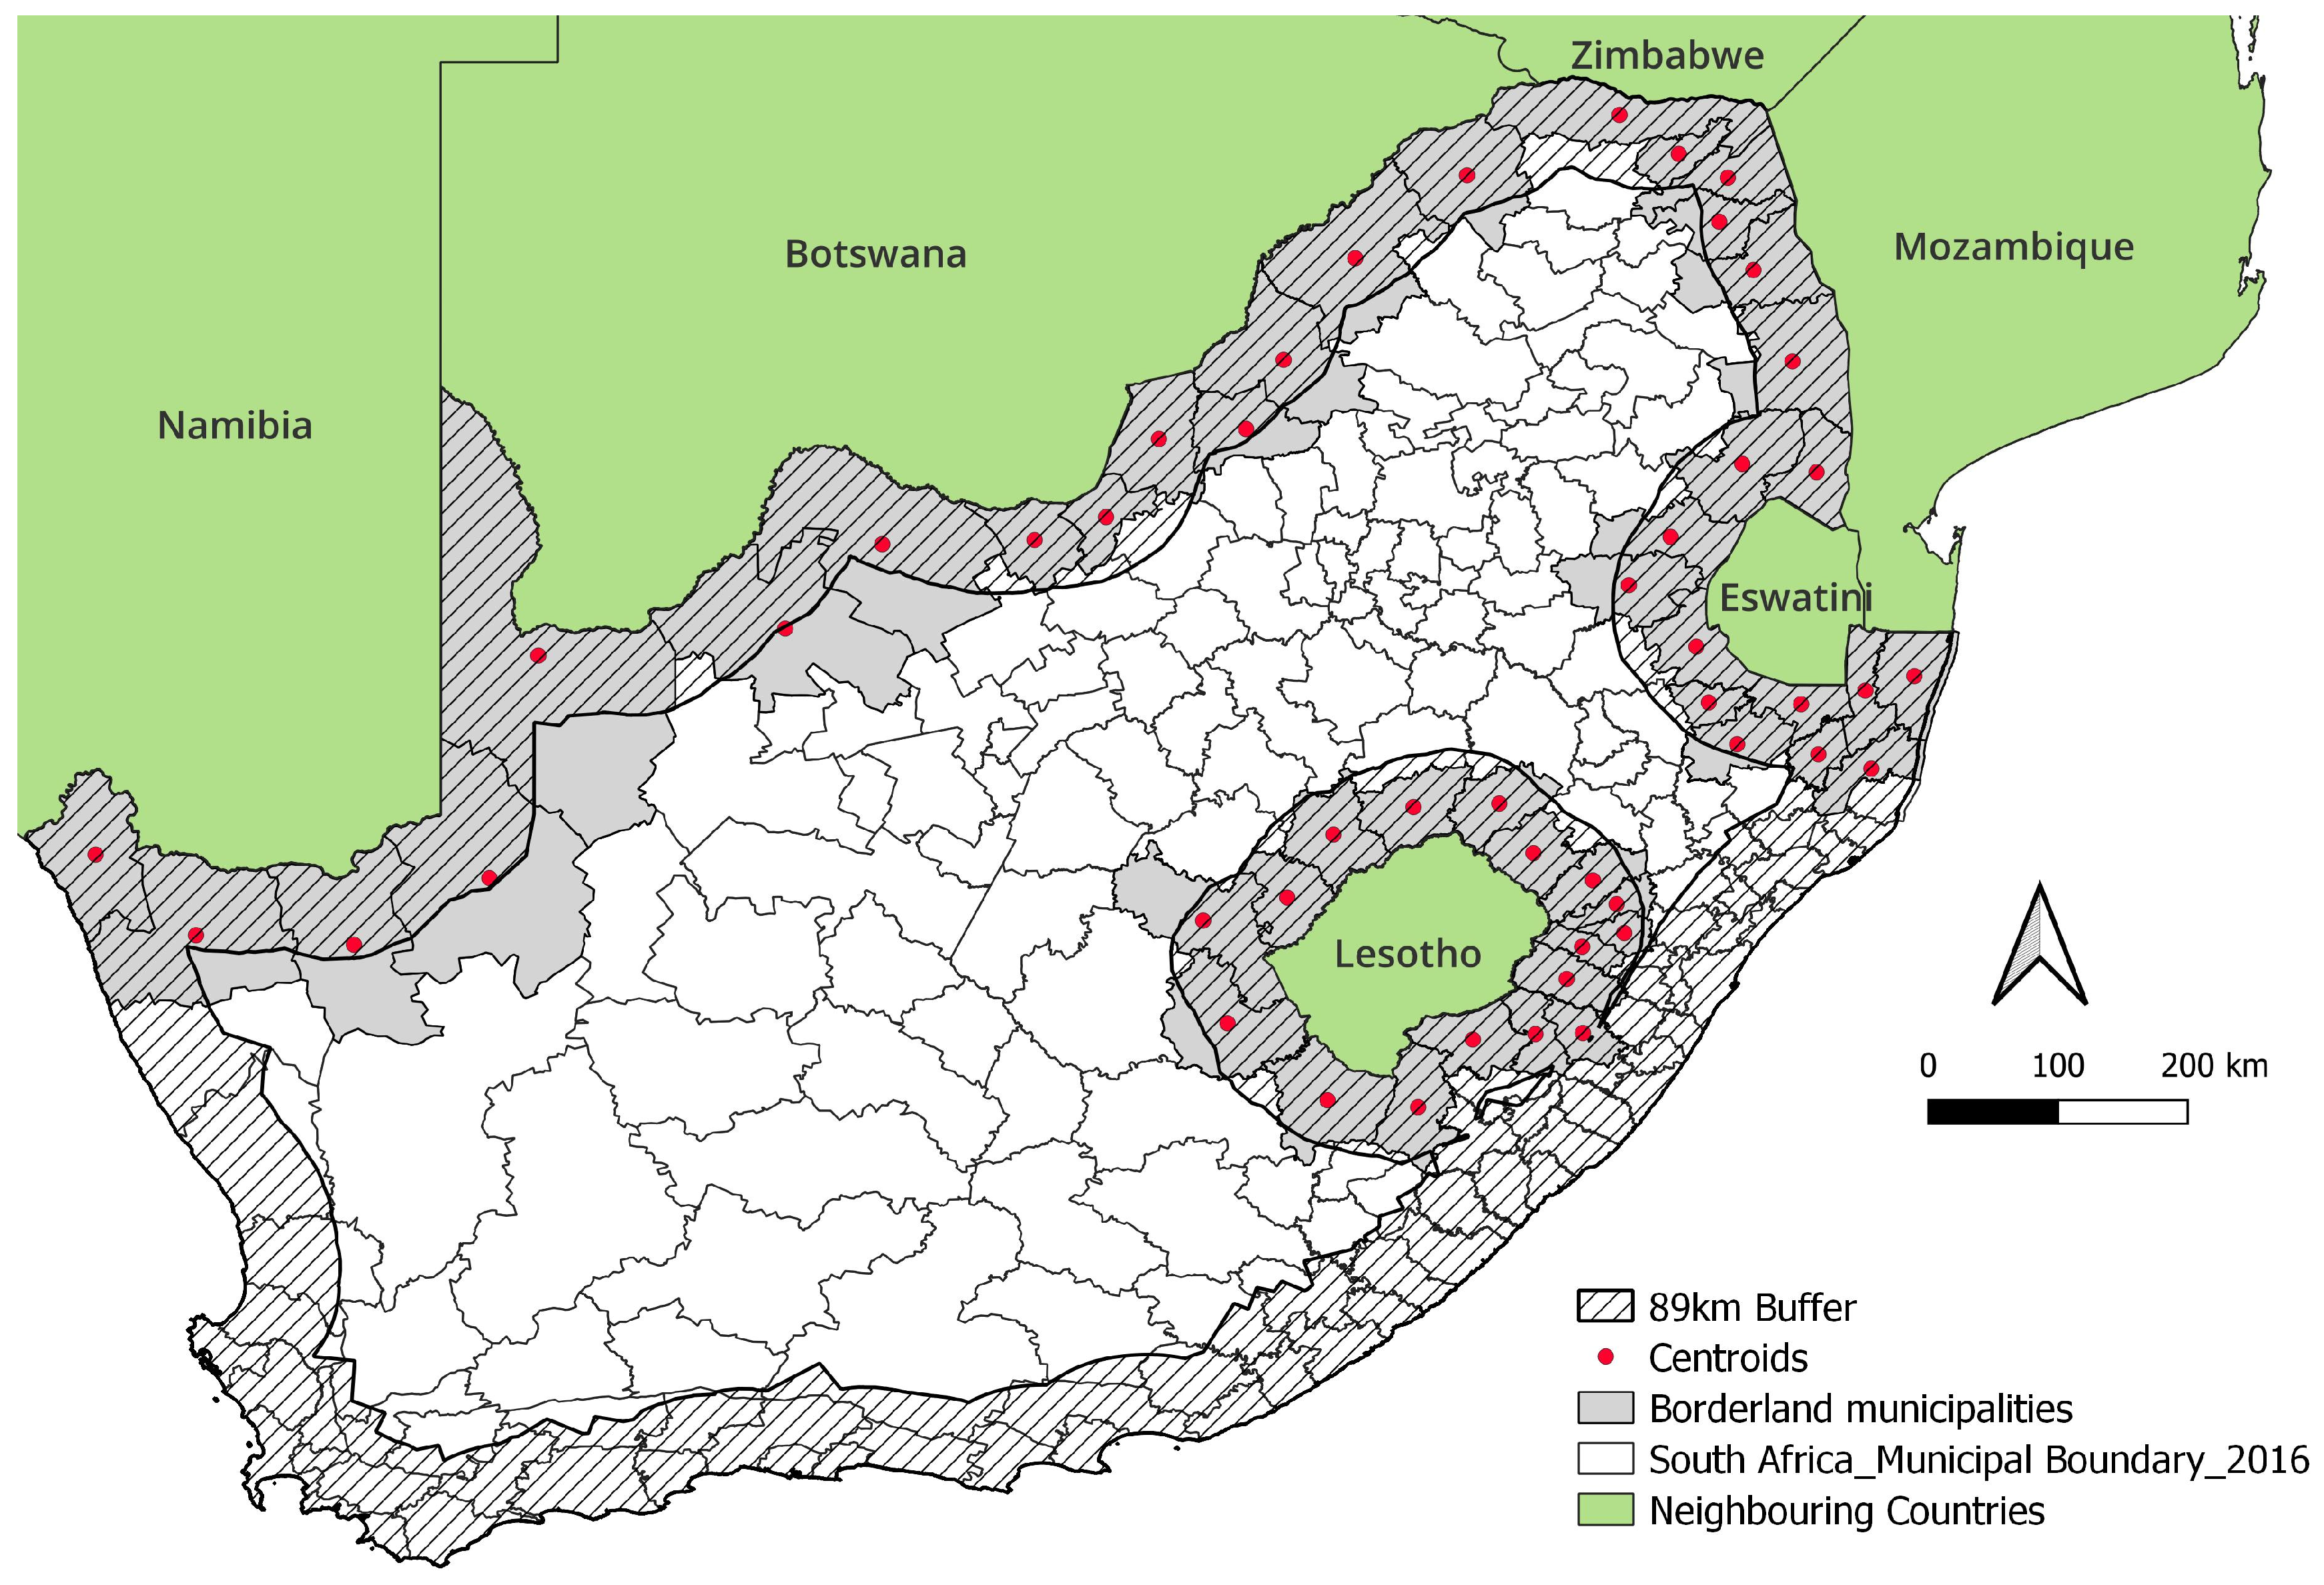
Figure 1. Delimitation of borderland municipalities (Source: own work).
Urbansci 08 00046 g001
Figure 2. The frequency of mentioning border location in the IDPs of the 49 municipalities by proximity to neighbouring countries (in % by neighbouring countries) (Source: own work).
Urbansci 08 00046 g002
Figure 3. Thematic considerations of the occurrence of the keyword ‘border’ in the IDPs by their total number of occurrences (NT = 282) and by the number of municipalities (NM = 49) where it occurs.
Urbansci 08 00046 g003
Figure 4. Pie charts representation of emerging themes in IDP by municipalities (Source: own work).
Urbansci 08 00046 g004
Figure 5. Percentage of mentions by border sections within total mentions by themes (Source: own work). Legend: 1—Geographical location; 2—Border Security and Management; 3—Transport; 4—Migration; 5—Economic activities; 6—Spatial Planning and Development; 7—Nature Conservation; 8—Tourism; 9—Cross-border Relations.
Urbansci 08 00046 g005
Table 1. Municipality concentration along the borders of South Africa (Source: own work).
ABCDE
CountryLength of Border (km)Number of MunicipalitiesLength of Border per Municipalities (km) (B/C)Municipality Concentration by Border (C/B)
Eswatini4301235.82.79
Mozambique4911049.12.03
Lesotho9091753.51.87
Zimbabwe2252112.50.89
Botswana184011167.30.59
Namibia9675193.40.52
Table 2. The mentioning of border location in the IDPs of the 49 municipalities by exact border location (number of municipalities) (Source: own work).
Direct Border LocationIndirect Border LocationTotal
Frequent mention of border (>10)718
Less frequent mention of border (5–9)909
Rare mention of border (3–4)8210
Very rare mention of border (1–2)10515
No mention of border (0)527
Total391049
Table 3. Features of the area of the South African municipalities along its borders by neighbouring countries (2016) (Source: based on data from [42]).
AFGHIJ
CountryTotal Area of
Municipalities (km2)
Average Area of
Municipalities (km2)
Smallest
Municipality (km2)
Largest
Municipality
(km2)
Standard
Deviation
Eswatini51,8284319194371521553.4
Mozambique60,2496025264210,3472691.5
Lesotho75,2644427152198862387.5
Zimbabwe12,9896495264210,3475448.3
Botswana154,85614,078364644,39911,846.2
Namibia113,94822,790960844,39913,469.3
Total469,1349689152144,3997714.6
Table 4. Features of the population size of the South African municipalities along its borders by neighbouring countries (2016) (Source: based on data from [42]).
AKLMNO
CountryTotal Population Size of Municipalities (Capita)Average Population Size of Municipalities (Capita)Lowest
Population Size (Capita)
Highest
Population Size (Capita)
Standard
Deviation
Eswatini2,821,555235,12989,614695,913165,847.5
Mozambique3,425,611342,561132,009695,913190,556.7
Lesotho2,912,739171,33829,526787,803178,667.7
Zimbabwe629,246314,623132,009497,237258,255.2
Botswana1,656,807150,61884,021314,39470,726.9
Namibia247,42249,48412,333107,16140,195.0
Total9,347,852190,772.512,333787,803162,025.4
Table 5. Features of population density of the South African municipalities along its borders by neighbouring countries (2016) (Source: based on data from [42]).
APQRST
CountryPopulation Density
(Capita/km2)
Average Population Density
(Capita/km2)
Lowest Population Density
(Capita/km2)
Highest Population Density
(Capita/km2)
Standard
Deviation
Eswatini54.4454.4927.4297.3025.31
Mozambique56.8668.3212.76188.2049.69
Lesotho38.739.94.0881.4825.94
Zimbabwe48.44100.4812.76188.20124.06
Botswana10.721.142.4186.2324.44
Namibia2.171.940.782.630.85
Total40.1547.710.78188.235.31
Table 6. Socio-economic and demographic characteristics of the five municipalities which are located directly at the border but have no mention of it all in its IDP (Source: [43]).
Maluti-a-PhofungElundiniInkosi LangalibaleleGreater GiyaniKai !Garib
Neighbouring countryLesothoLesothoLesothoMozambiqueNamibia
Transport connectionNational roads
(N5 and N3)
Provincial roads
(R396 and R56)
National roads (N3), Provincial roads (R103 and R74)Provincial roads (R81, R529 and R578)National roads (N10 and N14)
Population size (2016)353,452144,929215,182256,12768,929
Growth rate (2001–2011)−0.71%0.05%1.30%0.14%1.16%
Per capita incomeR 32,400 (2019)R 26,600 (2016)R 30,000 (2011)R 30,000 (2011)R 15,000 (2011)
Economically active population34% (2019)18.5% (2011)n.a.n.a.71.65% (2016)
Dependency ratio per 100 (15–64 years)62.6 (2016)75.7 (2016)67.8 (2016)74.72 (2011)38 (2016)
Rural population proportion (2016)62.5%67.1%65.9%86.6%23.8%
Unemployment rate (2011)41.8%44.4%42.7%47%10%
Youth unemployment rate (15–34 years) (2011)53%52.8%52.8%61.2%10%
Ratio of the population under the poverty line *73.09% (2019)69.48% (2016)76% (2011)82.9% (2013)51.92% (2018)
* StatsSA defines the upper poverty line as the level of consumption at which individuals are able to purchase both sufficient food and non-food items without sacrificing one for the other. This variable measures the number of individuals living below that particular level of consumption for the given area and is balanced directly with the official upper poverty rate as measured by StatsSA.
Table 7. The number of municipalities by the thematic context where ‘border’ is referred to in the 49 IDPs (using the order of municipality concentration by border).
EswatiniMozambiqueLesothoZimbabweBotswanaNamibia
Geographical Location7810273
Border Security and Management347241
Transport845151
Migration354230
Economic Activities724031
Spatial Planning and Development545150
Nature Conservation352221
Tourism114030
Cross-border Relations122000
Number of municipalities *1210172115
* Six municipalities are located along two borders, and one municipality is along three borders; hence, the total number in this line is over 57 instead of 49.
Table 8. Ranking of themes by borders regions (Source: own work).
Theme *EswatiniMozambiqueLesothoZimbabweBotswanaNamibia
1222321
2411142
3154513
474325
5365 63
654653
7638483
8877 7
9999
* Legend: 1—Geographical location; 2—Border Security and Management; 3—Transport; 4—Migration; 5—Economic activities; 6—Spatial Planning and Development; 7—Nature Conservation; 8—Tourism; 9—Cross-border Relations.
Disclaimer/Publisher’s Note: The statements, opinions and data contained in all publications are solely those of the individual author(s) and contributor(s) and not of MDPI and/or the editor(s). MDPI and/or the editor(s) disclaim responsibility for any injury to people or property resulting from any ideas, methods, instructions or products referred to in the content.