
Cities’ Hands Are Tied: Short-Term Economic Impacts of COVID-19 on Natural Population Growth in Metropolitan Greece

 , ,
, ,
Abstract
:1. Introduction
2. Methodology
2.1. Study Area
2.2. Data and Indicators
2.3. Quantitative Analysis
2.3.1. Descriptive Statistics
- (i)
- an aggregate index quantifying evenness in the statistical distribution of the target variable and calculated as E = eH/T, where H is the Shannon index and T is the number of time intervals with non-null NAT;
- (ii)
- Brillouin’s index (B), another measure of diversity in the rate of the natural population balance, calculated as follows: B = (ln(T!) − ∑iln(NATi!))/T;
- (iii)
- Menhinick’s richness index (M), providing a gross estimation of heterogeneity in the statistical distribution of NAT as follows: M = T/√N;
- (iv)
- the Margalef index (H), ranging from zero to infinity and evaluating the inherent diversification in the rates of natural population growth, as follows: H = −∑i (NATi)ln(NATi);
- (v)
- the equitability (namely, Pielou’s evenness, J) index, computed as the Shannon diversity index (H) divided by the logarithm of T, the number of time intervals with non-null NAT.
- (vi)
- Berger and Parker’s index estimating the dominance pattern in a statistical distribution. The index ranges from 0 (all natural balances, hereafter NAT, are equally intense) to 1 (NAT at a given time dominates the time series completely) and was calculated as S = 1 − ∑i(NATi)2.
2.3.2. Inferential and Correlation Statistics
2.3.3. Multivariate Analysis
3. Results
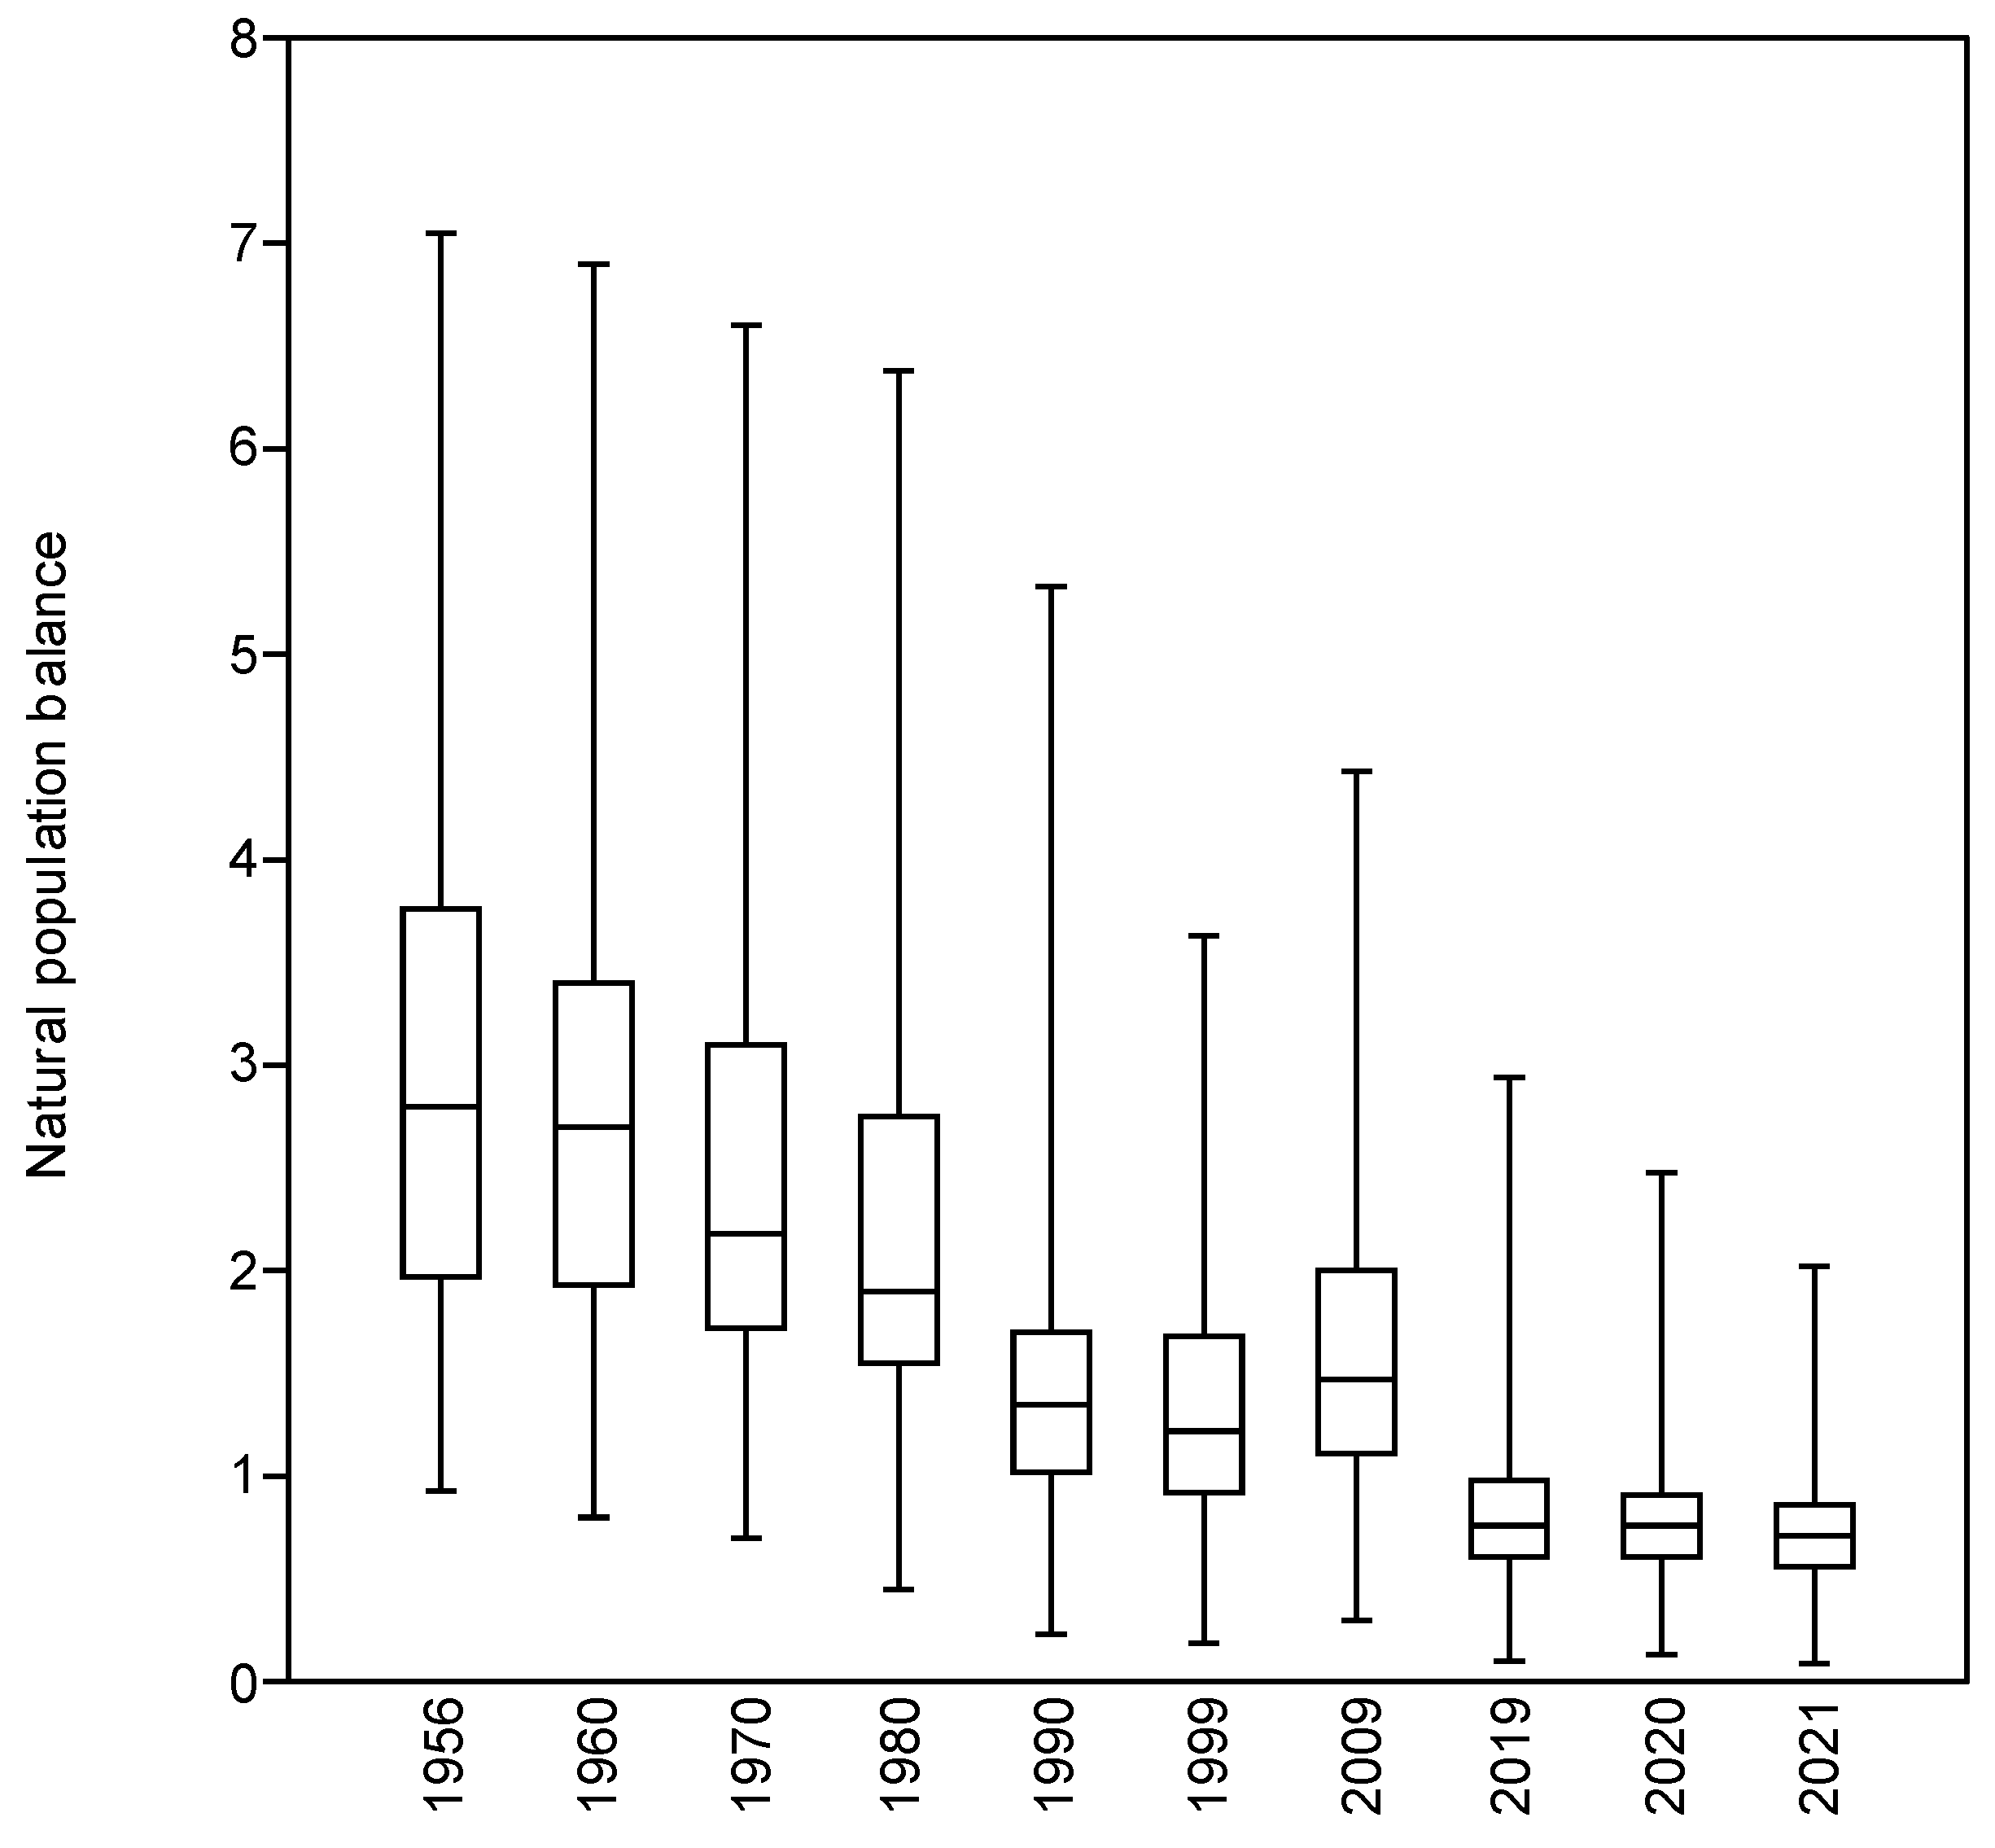
3.1. Descriptive Statistics
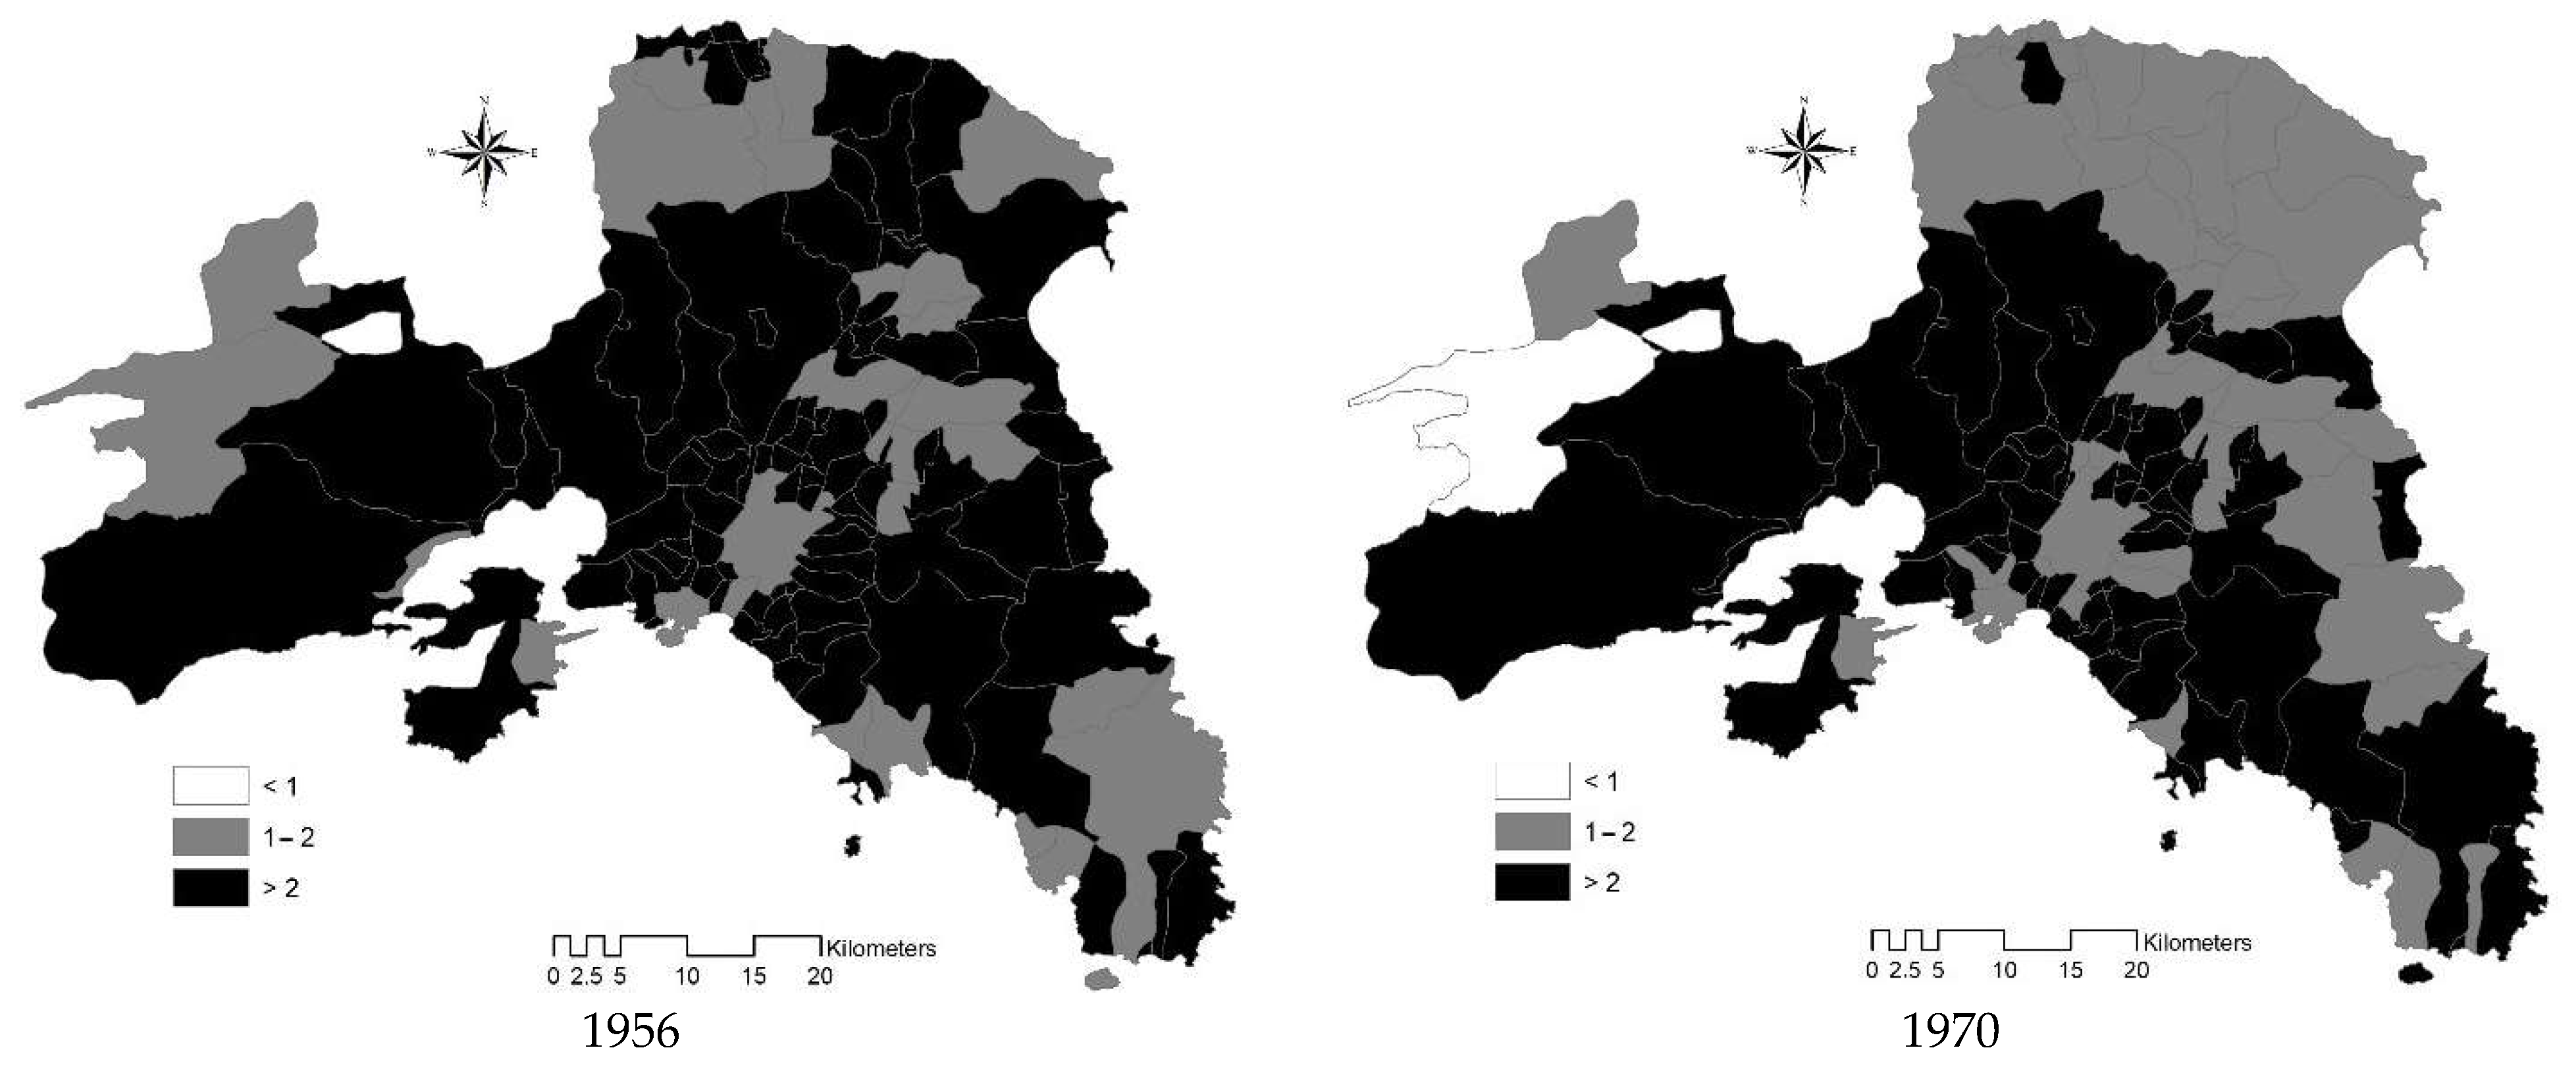
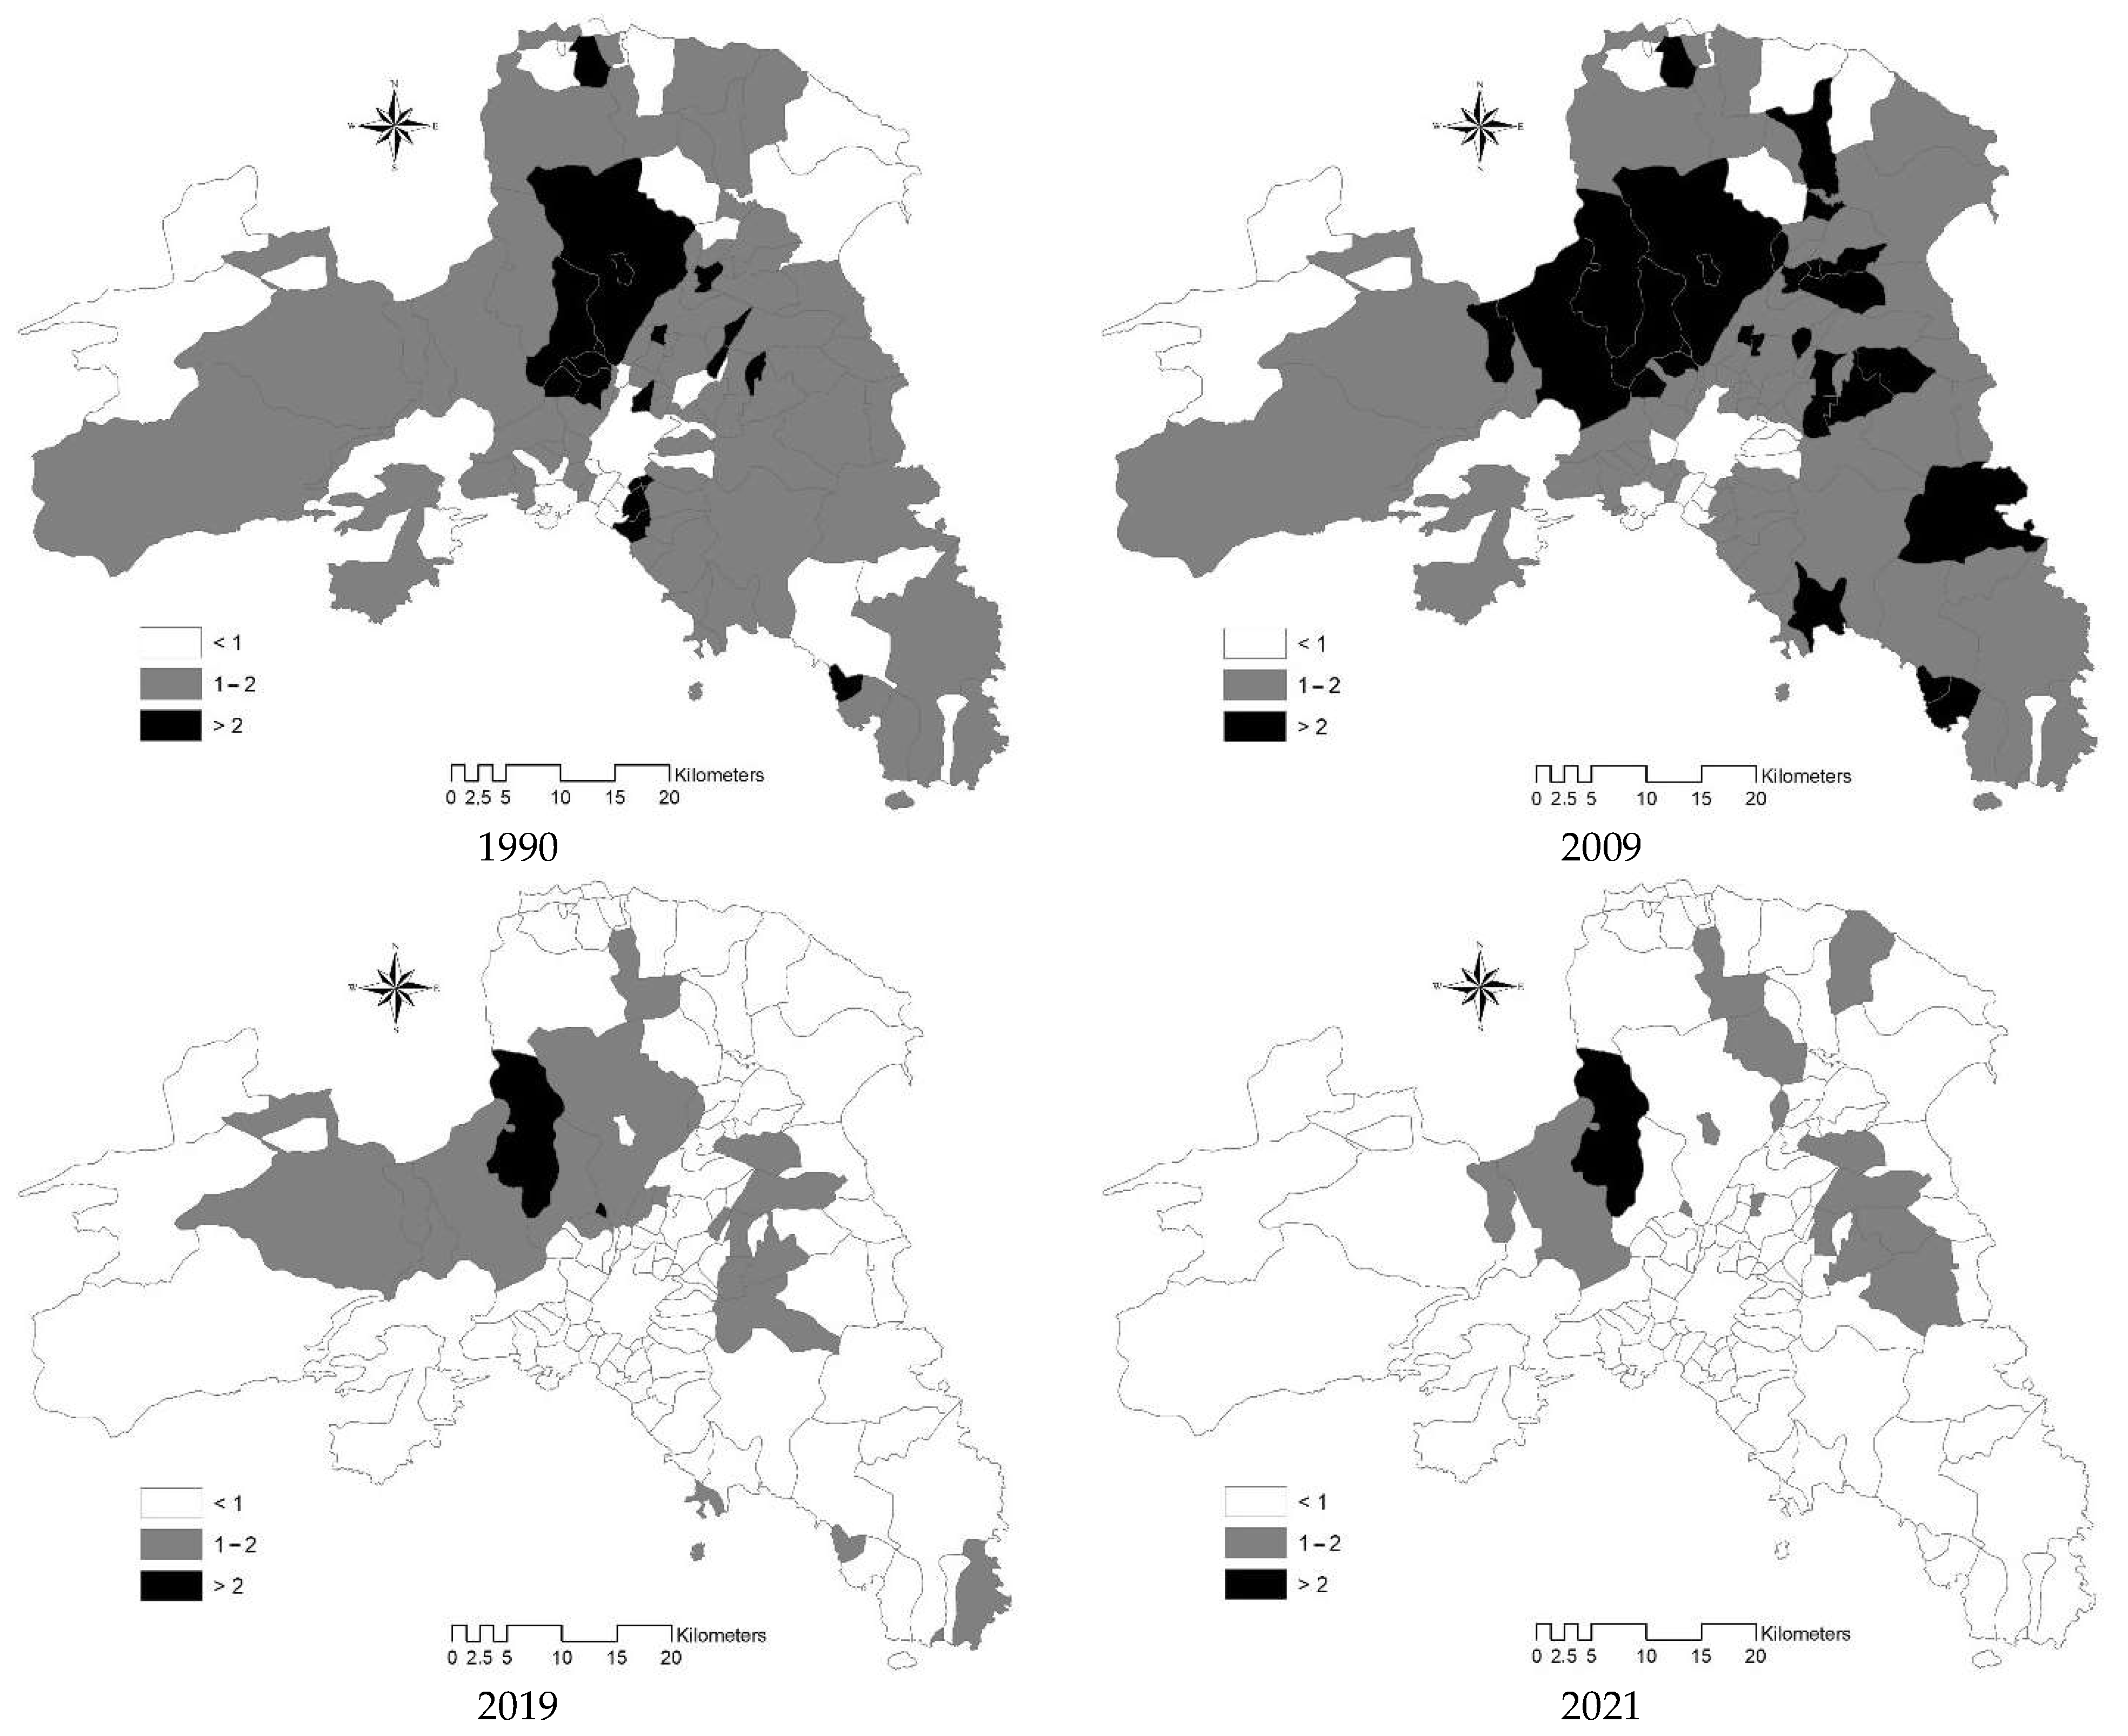
3.2. Spatial Analysis
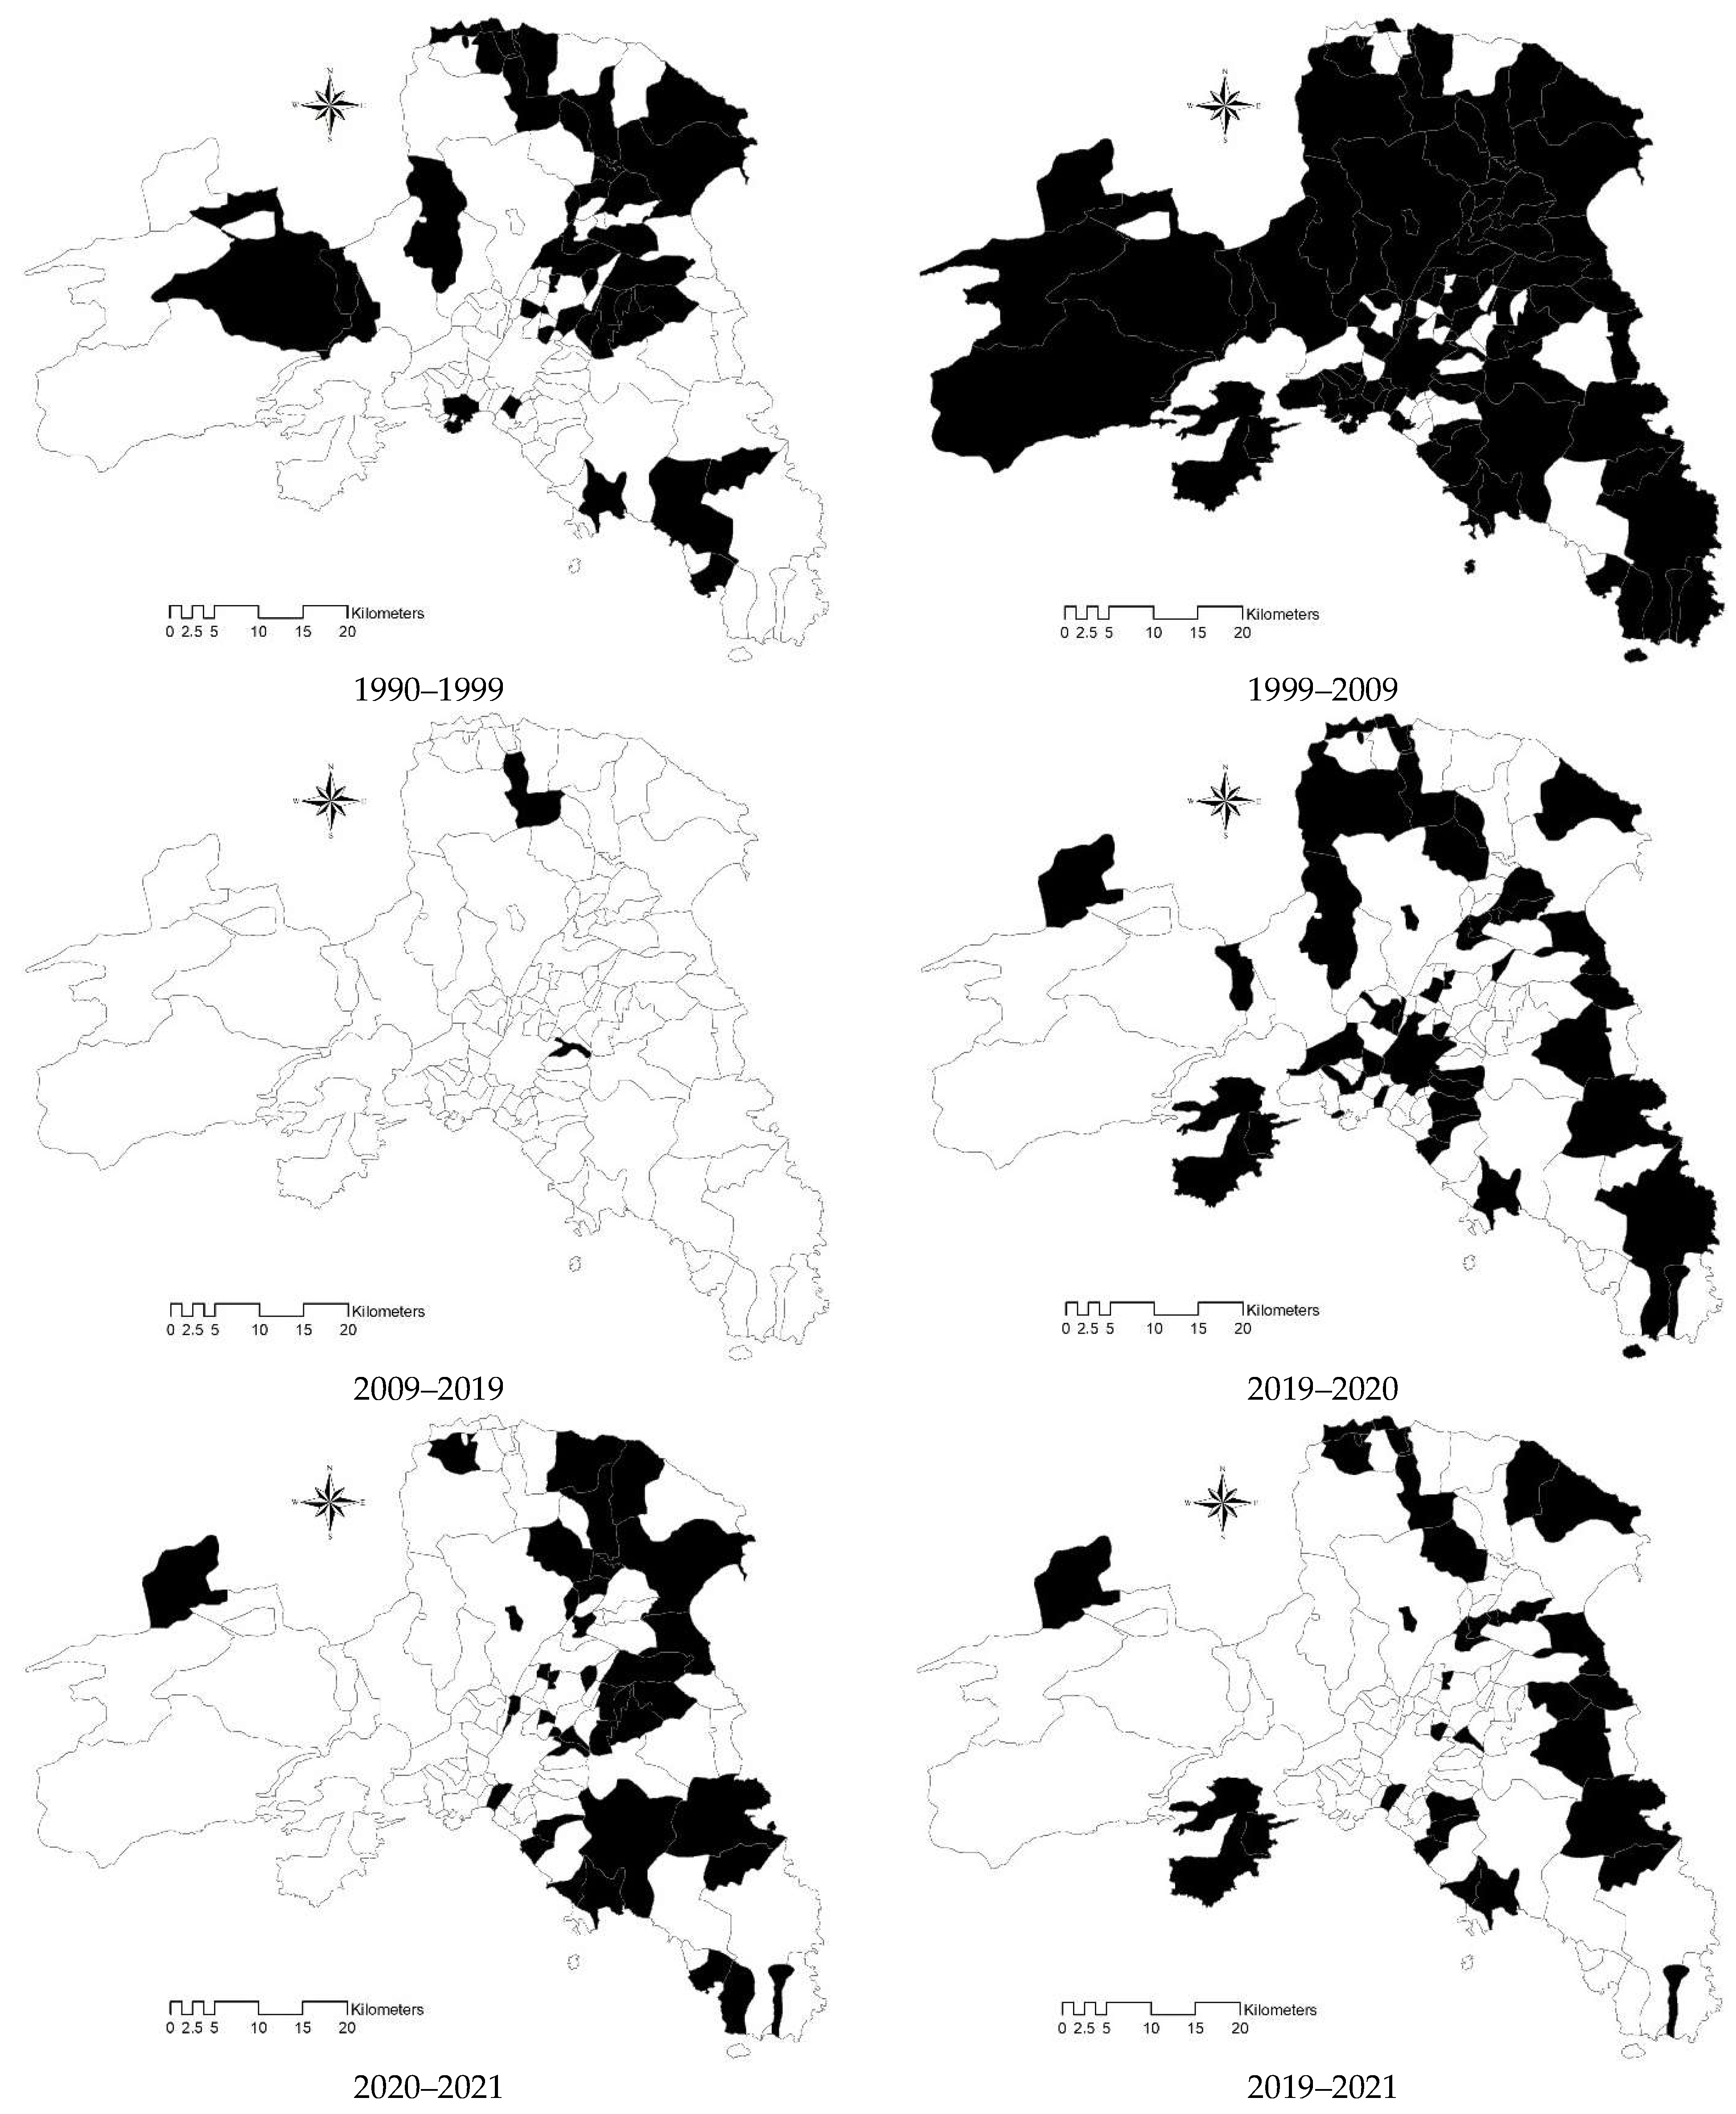
3.3. Inferential Analysis
3.4. Multivariate Analysis
4. Discussion
5. Conclusions
Author Contributions
Funding
Data Availability Statement
Conflicts of Interest
References
- Aassve, A.; Cavalli, N.; Mencarini, L.; Plach, S.; Livi Bacci, M. The COVID-19 pandemic and human fertility. Science 2020, 369, 370–371. [Google Scholar] [CrossRef] [PubMed]
- Luppi, F.; Arpino, B.; Rosina, A. The impact of COVID-19 on fertility plans in Italy, Germany, France, Spain, and the United Kingdom. Demogr. Res. 2020, 43, 1399–1412. [Google Scholar] [CrossRef]
- Castro, M.C. Spatial demography: An opportunity to improve policy making at diverse decision levels. Popul. Res. Policy Rev. 2007, 26, 477–509. [Google Scholar] [CrossRef]
- Carbonaro, C.; Leanza, M.; McCann, P.; Medda, F. Demographic decline, population aging, and modern financial approaches to urban policy. Int. Reg. Sci. Rev. 2018, 41, 210–232. [Google Scholar] [CrossRef]
- Dijkstra, L.; Garcilazo, E.; McCann, P. The effects of the global financial crisis on European regions and cities. J. Econ. Geogr. 2015, 15, 935–949. [Google Scholar] [CrossRef]
- Lerch, M. Internal and international migration across the urban hierarchy in Albania. Popul. Res. Policy Rev. 2016, 35, 851–876. [Google Scholar] [CrossRef] [PubMed]
- Bernardi, F. Public policies and low fertility: Rationales for public intervention and a diagnosis for the Spanish case. J. Eur. Soc. Policy 2005, 15, 123–138. [Google Scholar] [CrossRef]
- Stockdale, A. Contemporary and ‘Messy’ Rural In-migration Processes: Comparing Counterurban and Lateral Rural Migration. Popul. Space Place 2016, 22, 599–616. [Google Scholar] [CrossRef]
- Boyle, P. Population geography: Does geography matter in fertility research? Prog. Hum. Geogr. 2003, 27, 615–626. [Google Scholar] [CrossRef]
- Voss, P.R. Demography as a spatial social science. Popul. Res. Policy Rev. 2007, 26, 457–476. [Google Scholar] [CrossRef]
- Sobotka, T.; Skirbekk, V.; Philipov, D. Economic recession and fertility in the developed world. Popul. Dev. Rev. 2011, 37, 267–306. [Google Scholar] [CrossRef] [PubMed]
- Salvati, L. Endogenous Population Dynamics and Metropolitan Cycles: Long-Term Evidence from Athens, an Eternally Mediterranean City. Eur. J. Popul. 2022, 38, 835–860. [Google Scholar] [CrossRef] [PubMed]
- González-Leonardo, M.; Spijker, J. The demographic impact of COVID-19 during 2020 and its regional differences. How will the pandemic affect Spain’s future population? Boletín Asoc. Geógrafos Españoles 2022, 93. [Google Scholar]
- Wolff, M.; Haase, A.; Leibert, T.; Cunningham Sabot, E. Calm ocean or stormy sea? Tracing 30 years of demographic spatial development in Germany. Cybergeo: Eur. J. Geogr. 2022, 3. [Google Scholar] [CrossRef]
- Strozza, S.; Benassi, F.; Ferrara, R.; Gallo, G. Recent demographic trends in the major Italian urban agglomerations: The role of foreigners. Spat. Demogr. 2016, 4, 39–70. [Google Scholar] [CrossRef]
- Fostik, A. COVID-19 and fertility in Canada: A commentary. Can. Stud. Popul. 2021, 48, 217–224. [Google Scholar] [CrossRef] [PubMed]
- Caltabiano, M. Has the fertility decline come to an end in the different regions of Italy? New insights from a cohort approach. Population 2008, 63, 157–172. [Google Scholar] [CrossRef]
- Vitali, A.; Billari, F.C. Changing determinants of low fertility and diffusion: A spatial analysis for Italy. Popul. Space Place 2017, 23, e1998. [Google Scholar] [CrossRef]
- Kreyenfeld, M.; Andersson, G.; Pailhé, A. Economic uncertainty and family dynamics in Europe: Introduction. Demogr. Res. 2012, 27, 835–852. [Google Scholar] [CrossRef]
- Wachter, K.W. Spatial demography. Proc. Natl. Acad. Sci. USA 2005, 102, 15299–15300. [Google Scholar] [CrossRef]
- Goldstein, J.; Kreyenfeld, M.; Jasilioniene, A.; Örsal, D.D.K. Fertility reactions to the “great recession” in Europe: Recent evidence from order-specific data. Demogr. Res. 2013, 29, 85–104. [Google Scholar] [CrossRef]
- Lerch, M. Regional variations in the rural-urban fertility gradients in global South. PLoS ONE 2019, 14, e0219624. [Google Scholar] [CrossRef]
- Ehlert, A. The socio-economic determinants of COVID-19: A spatial analysis of German county level data. Socio-Econ. Plan. Sci. 2021, 78, 101083. [Google Scholar] [CrossRef] [PubMed]
- Karimian, H.; Fan, Q.; Li, Q.; Chen, Y.; Shi, J. Spatiotemporal transmission of infectious particles in environment: A case study of COVID-19. Chemosphere 2023, 335, 139065. [Google Scholar] [CrossRef] [PubMed]
- Chen, Y.; Li, Q.; Karimian, H.; Chen, X.; Li, X. Spatio-temporal distribution characteristics and influencing factors of COVID-19 in China. Sci. Rep. 2021, 11, 3717. [Google Scholar] [CrossRef] [PubMed]
- Wang, H.; Paulson, K.R.; Pease, S.A.; Watson, S.; Comfort, H.; Zheng, P.; Murray, C.J. Estimating excess mortality due to the COVID-19 pandemic: A systematic analysis of COVID-19-related mortality, 2020–2021. Lancet 2022, 399, 1513–1536. [Google Scholar] [CrossRef] [PubMed]
- Plach, S.; Aassve, A.; Cavalli, N.; Mencarini, L.; Sanders, S. COVID-19 Policy Interventions and Fertility Dynamics in the Context of Pre-Pandemic Welfare Support. Popul. Dev. Rev. 2023, 5. [Google Scholar] [CrossRef]
- O’Brien, M.L.; Eger, M.A. Suppression, spikes, and stigma: How COVID-19 will shape international migration and hostilities toward it. Int. Migr. Rev. 2021, 55, 640–659. [Google Scholar] [CrossRef]
- González-Leonardo, M.; Rowe, F.; Fresolone-Caparrós, A. Rural revival? The rise in internal migration to rural areas during the COVID-19 pandemic. Who moved and where? OSF Prepr. 2022, 96, 332–342. Available online: https://pure.iiasa.ac.at/id/eprint/18170/(10.31219/osf.io/g4wvd) (accessed on 26 February 2024). [CrossRef]
- MacKellar, L.; Friedman, R. COVID-19 and the Global Demographic Research Agenda; Population Council: New York, NY, USA, 2021. [Google Scholar]
- Kalabikhina, I.E. Demographic and social issues of the pandemic. Popul. Econ. 2020, 4, 103–122. [Google Scholar] [CrossRef]
- Dumont, G.F. COVID-19: A global demographic break? Popul. Avenir 2021, 753, 3. [Google Scholar]
- Chakraborty, I.; Maity, P. COVID-19 outbreak: Migration, effects on society, global environment and prevention. Sci. Total Environ. 2020, 728, 138882. [Google Scholar] [CrossRef] [PubMed]
- Goujon, A.; Natale, F.; Ghio, D.; Conte, A. Demographic and territorial characteristics of COVID-19 cases and excess mortality in the European Union during the first wave. J. Popul. Res. 2021, 539, 33–556. [Google Scholar] [CrossRef]
- Del Bono, E.; Weber, A.; Winter-Ebmer, R. Fertility and economic instability: The role of unemployment and job displacement. J. Popul. Econ. 2015, 28, 46–479. [Google Scholar]
- Schneider, D. The great recession, fertility, and uncertainty: Evidence from the United States. J. Marriage Fam. 2015, 77, 1144–1156. [Google Scholar] [CrossRef]
- Vignoli, D.; Drefahl, S.; De Santis, G. Whose job instability affects the likelihood of becoming a parent in Italy? A tale of two partners. Demogr. Res. 2012, 26, 42–62. [Google Scholar] [CrossRef]
- Billari, F.C.; Kohler, H.-P.; Andersson, G.; Lundström, H. Approaching the limit: Long-term trends in late and very late fertility. Popul. Dev. Rev. 2007, 33, 149–170. [Google Scholar] [CrossRef]
- Cherlin, A.; Cumberworth, E.; Morgan, S.P.; Wimer, C. The effects of the great recession on family structure and fertility. Ann. Am. Acad. Political Soc. Sci. 2013, 6501, 214–231. [Google Scholar] [CrossRef]
- Caltabiano, M.; Castiglioni, M.; Rosina, A. Lowest-low fertility: Signs of a recovery in Italy? Demogr. Res. 2009, 21, 681–718. [Google Scholar] [CrossRef]
- Wang, D.; Chi, G. Different Places, Different Stories: A Study of Spatial Heterogeneity of County-Level Fertility in China. Demogr. Res. 2017, 37, 493. [Google Scholar] [CrossRef]
- Gavalas, V.S.; Rontos, K.; Salvati, L. Who becomes an unwed mother in Greece? Socio-demographic and geographical aspects of an emerging phenomenon. Popul. Space Place 2014, 20, 250–263. [Google Scholar] [CrossRef]
- Rubiera-Morollón, F.; del Rosal, I.; Díaz-Dapena, A. Can large cities explain the aggregate movements of economies? Testing the ‘granular hypothesis’ for US counties. Lett. Spat. Resour. Sci. 2015, 8, 109–118. [Google Scholar] [CrossRef]
- Tragaki, A.; Bagavos, C. Male fertility in Greece: Trends and differentials by educational level and employment status. Demogr. Res. 2014, 31, 137–160. [Google Scholar] [CrossRef]
- Goldstein, J.R.; Sobotka, T.; Jasilioniene, A. The end of lowest-low fertility? Popul. Dev. Rev. 2009, 35, 663–700. [Google Scholar] [CrossRef]
- Salvati, L. Towards a Polycentric Region? The Socio-economic Trajectory of Rome, an ‘Eternally Mediterranean’ City. Tijdschr. Voor Econ. En Soc. Geogr. 2014, 105, 268–284. [Google Scholar] [CrossRef]
- Kallis, G. Socio-environmental coevolution: Towards an analytical approach. Int. J. Sustain. Dev. World Ecol. 2007, 14, 9–19. [Google Scholar] [CrossRef]
- Tragaki, A.; Bagavos, C. Fertility variations in the recession context: The case of Greece. Genus 2019, 75, 18. [Google Scholar] [CrossRef]
- Kroll, F.; Kabisch, N. The Relation of Diverging Urban Growth Processes and Demographic Change along an Urban-Rural Gradient. Popul. Space Place 2012, 18, 260–276. [Google Scholar] [CrossRef]
- Masini, E.; Tomao, A.; Barbati, A.; Corona, P.; Serra, P.; Salvati, L. Urban growth, land-use efficiency and local socioeconomic context: A comparative analysis of 417 metropolitan regions in Europe. Environ. Manag. 2019, 633, 322–337. [Google Scholar] [CrossRef]
- Salvati, L.; Ferrara, A.; Chelli, F. Long-term growth and metropolitan spatial structures: An analysis of factors influencing urban patch size under different economic cycles. Geogr. Tidsskr. Dan. J. Geogr. 2018, 118, 56–71. [Google Scholar] [CrossRef]
- Bagavos, C.; Verropoulou, G.; Tsimbos, C. Assessing the contribution of foreign women to period fertility in Greece, 2004–2012. Population 2018, 73, 115–130. [Google Scholar]
- Ferrara, C.; Carlucci, M.; Grigoriadis, S.; Corona, P.; Salvati, L. A comprehensive insight into the geography of forest cover in Italy: Exploring the importance of socioeconomic local contexts. For. Policy Econ. 2017, 75, 12–22. [Google Scholar] [CrossRef]
- Butler, D. The fertility riddle. Nature 2004, 432, 38–39. [Google Scholar] [CrossRef] [PubMed]
- Rees, P.; Bell, M.; Kupiszewski, M.; Kupiszewska, D.; Ueffing, P.; Bernard, A.; Edwards, E.C.; Stillwell, J. The impact of internal migration on population redistribution: An international comparison. Popul. Space Place 2017, 23, e2036. [Google Scholar] [CrossRef]
- Salvati, L. The ‘niche’ city: A multifactor spatial approach to identify local-scale dimensions of urban complexity. Ecol. Indic. 2018, 94, 62–73. [Google Scholar] [CrossRef]
- Delfanti, L.; Colantoni, A.; Recanatesi, F.; Bencardino, M.; Sateriano, A.; Zambon, I.; Salvati, L. Solar plants, environmental degradation and local socioeconomic contexts: A case study in a Mediterranean country. Environ. Impact Assess. Rev. 2016, 61, 88–93. [Google Scholar] [CrossRef]
- Modena, F.; Rondinelli, C.; Sabatini, F. Economic insecurity and fertility intentions: The case of Italy. Rev. Income Wealth 2014, 60, S233–S255. [Google Scholar] [CrossRef]
- Myrskyla, M.; Kohler, H.-P.; Billari, F. Advances in development reverse fertility declines. Nature 2009, 460, 741–743. [Google Scholar] [CrossRef]


| Partition | 1956 | 1960 | 1970 | 1980 | 1990 | 1999 | 2009 | 2019 | 2020 | 2021 |
|---|---|---|---|---|---|---|---|---|---|---|
| Average | ||||||||||
| Urban | 3.26 | 3.01 | 2.65 | 2.44 | 1.44 | 1.13 | 1.35 | 0.76 | 0.75 | 0.68 |
| Rural | 2.37 | 2.35 | 1.96 | 1.63 | 1.31 | 1.30 | 1.67 | 0.78 | 0.80 | 0.75 |
| Athens region | 2.80 | 2.70 | 2.18 | 1.90 | 1.35 | 1.22 | 1.47 | 0.76 | 0.76 | 0.71 |
| Coefficient of variation | ||||||||||
| Urban | 0.42 | 0.40 | 0.41 | 0.41 | 0.49 | 0.41 | 0.38 | 0.41 | 0.22 | 0.22 |
| Rural | 0.34 | 0.34 | 0.38 | 0.40 | 0.47 | 0.47 | 0.47 | 0.53 | 0.56 | 0.51 |
| Athens region | 0.44 | 0.42 | 0.44 | 0.46 | 0.49 | 0.44 | 0.45 | 0.47 | 0.45 | 0.41 |
| Variable | 1956 | 1960 | 1970 | 1980 | 1990 | 1999 | 2009 | 2019 | 2020 | 2021 |
|---|---|---|---|---|---|---|---|---|---|---|
| Statistical metrics | ||||||||||
| Max–min/med | 2.0 | 2.1 | 2.4 | 2.7 | 3.4 | 2.6 | 2.6 | 3.4 | 3.0 | 2.6 |
| 75–25th/median | 3.1 | 2.7 | 2.3 | 1.9 | 0.9 | 0.9 | 1.2 | 0.2 | 0.1 | 0.1 |
| Median/mean | 0.94 | 0.95 | 0.88 | 0.85 | 0.90 | 0.93 | 0.92 | 0.91 | 0.97 | 0.97 |
| Skewness | 0.90 | 1.02 | 1.13 | 1.33 | 2.13 | 1.04 | 1.35 | 2.02 | 1.94 | 1.35 |
| Std. error | 0.122 | 0.112 | 0.100 | 0.096 | 0.069 | 0.054 | 0.067 | 0.037 | 0.033 | 0.028 |
| Urban/rural | 1.38 | 1.28 | 1.35 | 1.50 | 1.10 | 0.87 | 0.81 | 0.97 | 0.94 | 0.90 |
| Athens/Attica | 0.53 | 0.62 | 0.84 | 0.97 | 0.70 | 0.64 | 0.60 | 0.84 | 0.85 | 0.78 |
| Diversity indexes | ||||||||||
| Evenness, eH/T | 0.914 | 0.920 | 0.916 | 0.907 | 0.903 | 0.909 | 0.912 | 0.906 | 0.913 | 0.922 |
| Brillouin | 4.2 | 4.2 | 4.1 | 4.1 | 3.9 | 3.9 | 3.9 | 3.6 | 3.6 | 3.5 |
| Menhinick | 6.2 | 6.4 | 6.8 | 7.2 | 8.8 | 9.4 | 8.5 | 11.8 | 12.2 | 12.5 |
| Margalef | 19.5 | 19.7 | 20.2 | 20.6 | 22.1 | 22.7 | 21.9 | 25.0 | 25.4 | 25.7 |
| Equitability, J | 0.981 | 0.982 | 0.982 | 0.980 | 0.979 | 0.980 | 0.981 | 0.979 | 0.981 | 0.983 |
| Berger–Parker | 0.021 | 0.021 | 0.023 | 0.025 | 0.031 | 0.024 | 0.024 | 0.031 | 0.028 | 0.024 |
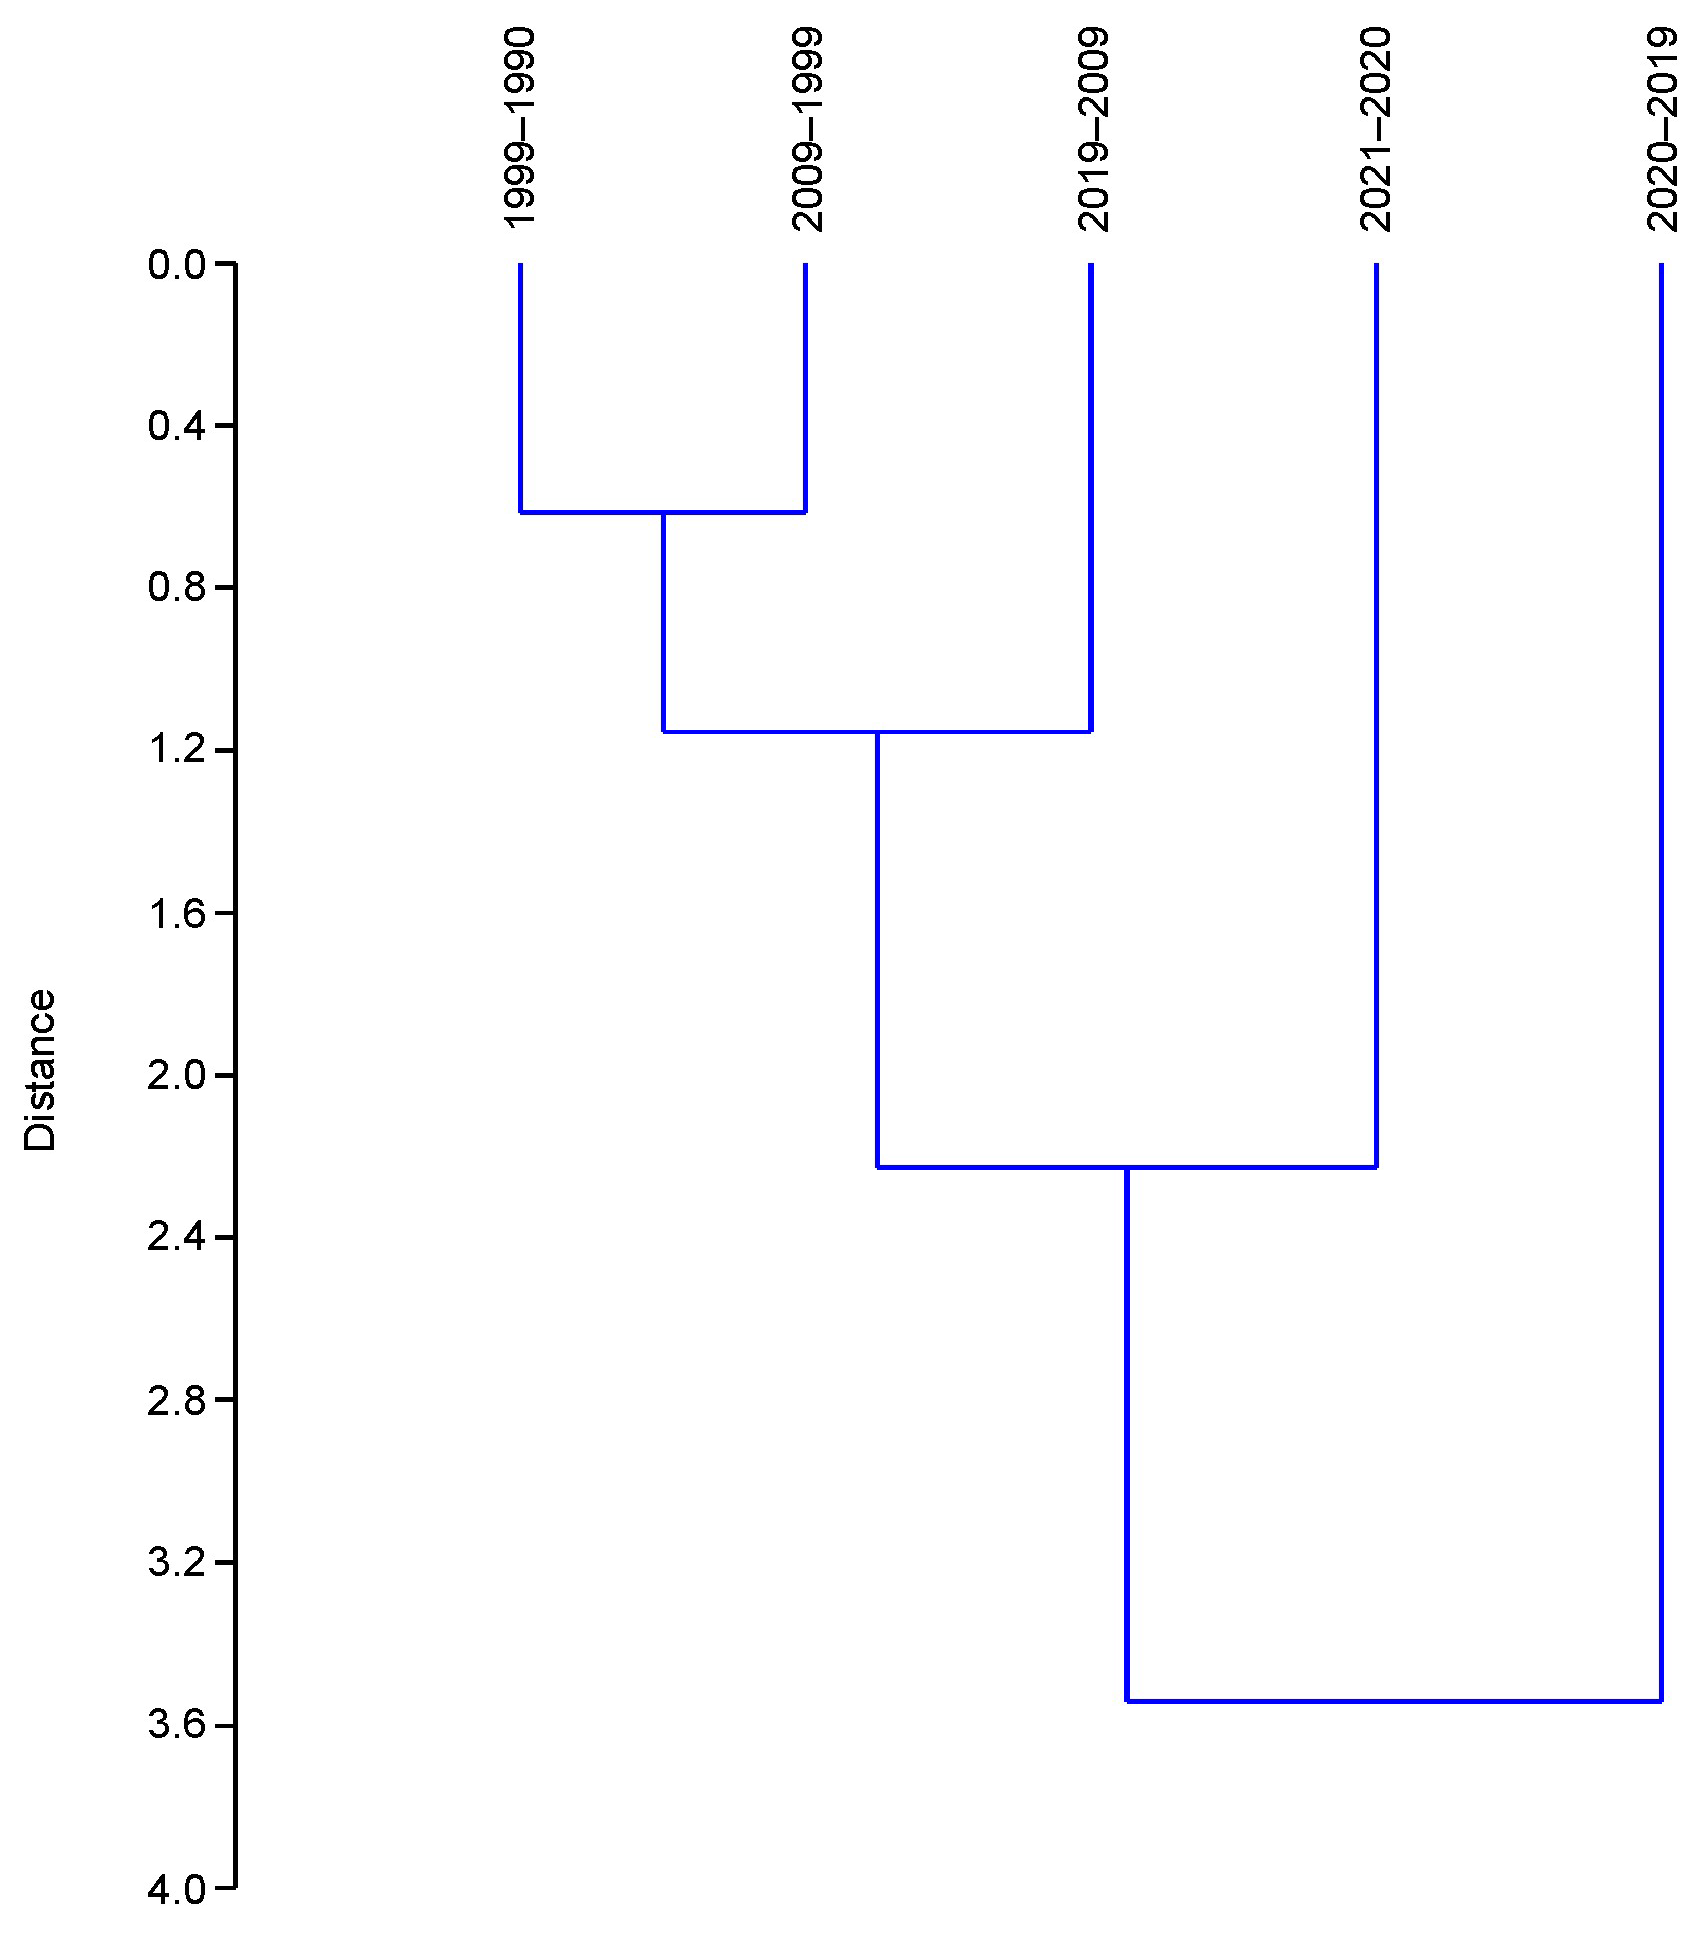
| 1999–1990 | 2009–1999 | 2019–2009 | 2020–2019 | |
|---|---|---|---|---|
| Pearson | ||||
| 2009–1999 | 0.08 | |||
| 2019–2009 | −0.11 | −0.64 | ||
| 2020–2019 | 0.19 | −0.01 | 0.03 | |
| 2021–2020 | 0.04 | 0.06 | −0.17 | −0.35 |
| 2021–2019 | 0.22 | 0.03 | −0.10 | |
| Spearman | ||||
| 2009–1999 | −0.04 | |||
| 2019–2009 | −0.07 | −0.45 | ||
| 2020–2019 | −0.01 | −0.09 | 0.07 | |
| 2021–2020 | 0.09 | −0.02 | −0.03 | −0.42 |
| 2021–2019 | 0.07 | −0.12 | 0.06 | |
| Kendall | ||||
| 2009–1999 | −0.03 | |||
| 2019–2009 | −0.05 | −0.34 | ||
| 2020–2019 | 0.00 | −0.06 | 0.05 | |
| 2021–2020 | 0.06 | −0.01 | −0.02 | −0.30 |
| 2021–2019 | 0.05 | −0.08 | 0.04 |
| 1999–2009 | 2009–2019 | 2019–2020 | 2020–2021 | 2019–2021 | ||
|---|---|---|---|---|---|---|
| 1990–1999 | Wilcoxon (z) | 6.96 ** | 6.99 ** | 0.99 | 1.98 * | 4.17 * |
| Mann–Whitney (z) | −7.43 ** | −8.00 ** | −1.34 | −2.46 * | −4.58 * | |
| Kolmogorov (D) | 0.47 ** | 0.48 ** | 0.28 | 0.36 * | 0.47 * | |
| 1999–2009 | Wilcoxon (z) | 9.13 * | 3.64 ** | 4.64 ** | 5.88 ** | |
| Mann–Whitney (z) | −12.3 * | 4.66 ** | −5.41 ** | −7.05 ** | ||
| Kolmogorov (D) | 0.83 * | 0.48 ** | 0.51 ** | 0.60 ** | ||
| 2009–2019 | Wilcoxon (z) | 1.93 * | 0.86 | 1.51 | ||
| Mann–Whitney (z) | −2.54 * | −1.28 | −1.35 | |||
| Kolmogorov (D) | 0.39 * | 0.34 * | 0.28 | |||
| 2019–2020 | Wilcoxon (z) | 0.53 | ||||
| Mann–Whitney (z) | −0.58 | |||||
| Kolmogorov (D) | 0.08 |
| Year | Downtown Athens (A) | Metropolitan Attica (B) | Greece (C) | B/A Ratio | C/B Ratio |
|---|---|---|---|---|---|
| 2013 | 1.38 | 1.31 | 0.91 | 0.95 | 0.69 |
| 2014 | 1.64 | 1.20 | 0.82 | 0.73 | 0.68 |
| 2015 | 1.62 | 1.11 | 0.76 | 0.69 | 0.68 |
| 2016 | 1.83 | 1.14 | 0.79 | 0.62 | 0.69 |
| 2017 | 1.80 | 1.02 | 0.72 | 0.57 | 0.71 |
| 2018 | 1.86 | 1.03 | 0.72 | 0.55 | 0.70 |
| 2019 | 1.75 | 0.98 | 0.68 | 0.56 | 0.69 |
| 2020 | 1.65 | 0.95 | 0.65 | 0.58 | 0.68 |
| 2021 | 1.23 | 0.88 | 0.59 | 0.72 | 0.67 |
| 2022 | 1.23 | 0.8 | 0.54 | 0.65 | 0.68 |
| 2023 | 1.23 | 0.8 | 0.55 | 0.65 | 0.69 |
Disclaimer/Publisher’s Note: The statements, opinions and data contained in all publications are solely those of the individual author(s) and contributor(s) and not of MDPI and/or the editor(s). MDPI and/or the editor(s) disclaim responsibility for any injury to people or property resulting from any ideas, methods, instructions or products referred to in the content. |
© 2024 by the authors. Licensee MDPI, Basel, Switzerland. This article is an open access article distributed under the terms and conditions of the Creative Commons Attribution (CC BY) license (https://creativecommons.org/licenses/by/4.0/).
Share and Cite
Muolo, A.; Zagaglia, B.; Marucci, A.; Escrivà Saneugenio, F.; Sateriano, A.; Salvati, L. Cities’ Hands Are Tied: Short-Term Economic Impacts of COVID-19 on Natural Population Growth in Metropolitan Greece. Urban Sci. 2024, 8, 26. https://doi.org/10.3390/urbansci8020026
Muolo A, Zagaglia B, Marucci A, Escrivà Saneugenio F, Sateriano A, Salvati L. Cities’ Hands Are Tied: Short-Term Economic Impacts of COVID-19 on Natural Population Growth in Metropolitan Greece. Urban Science. 2024; 8(2):26. https://doi.org/10.3390/urbansci8020026
Chicago/Turabian StyleMuolo, Alessandro, Barbara Zagaglia, Alvaro Marucci, Francisco Escrivà Saneugenio, Adele Sateriano, and Luca Salvati. 2024. "Cities’ Hands Are Tied: Short-Term Economic Impacts of COVID-19 on Natural Population Growth in Metropolitan Greece" Urban Science 8, no. 2: 26. https://doi.org/10.3390/urbansci8020026