1. Introduction
In 2021, 4.45 billion people, globally, lived in urban areas, equivalent to 56% of the global population [
1], and urban expansion trends estimate higher rates in lower-income countries [
2]. In Brazil, the urban land expansion ratio of 2100/2000 is expected to be 1.3 or 4.5 [
2]; in 2022, 120 million people were already reported to live in urban concentrations, which corresponds to 61% of the country’s population. It has been estimated that more than 16 million live in precarious areas, which can be considered as slums [
3]. Residents of slum areas (also called “favelas” and referred to as “subnormal clusters” by the Brazilian Institute of Geography and Statistics—IBGE (Current nomenclature and the proposed concept for slums and urban communities by IBGE. Available online:
https://eventos.ibge.gov.br/downloads/infofavela2023/tabela_encontro_favelas_e_comunidades_urbanas.pdf (accessed on 13 December 2023))) face a lack of infrastructure due to an unregulated growth model and the absence of more suitable public policies.
Cartographic resources have been extensively employed for research and outreach projects for various purposes and themes, including identifying and mitigating social vulnerabilities within slums. However, mapping these spaces ethically and systematically requires a close relationship between the researcher and the mapped area actors [
4]. This proximity provides the researcher with more than just research data; it offers an academic experience that awakens the need to counter unilateral narratives, and deconstruct superficial, stereotypical, prejudiced, and limited views of these places and people.
Identifying factors that render people and places vulnerable is important for anchoring efforts in the relentless pursuit of improving the lives of this population [
5], but recognizing their potential, rather than solely showcasing the actions taken for the benefit of the researchers [
6] is equally important. Understanding the territory through collective learning challenges the elitist learning paradigm, as it creates a cartography of social mobilization and fosters the use of cartographic resources by residents of these areas to advocate for their rights.
Appropriating social resources through research projects with direct participation from slum residents can generate data that enable the demand for suitable public policies, stimulate and produce elements of resilience and social equity, and reinforce the living space as a transformational environment by taking a denaturalized view of existing social problems [
7]. However, in a scenario where digital illiteracy opposes significant technological advances (e.g., Big Data, Industry 4.0, GNSS equipment, RPAs), how can such accomplishments be achieved? How can cartographic resources become part of an environment that lacks the minimal structures for their utilization (lack of resources to access the internet, such as computers, tablets, and smartphones or having only devices with memory that is incompatible with certain applications, and so forth)? How can strategies be developed to motivate the appropriation of cartographic resources to make them an integral part of the fight for rights? To break down the conventions produced by hegemonic cartography, it is necessary to create multiple user profiles that, through their own narratives, can appropriate cartographic resources to produce a “popular cartography,” or, rather, a “slum cartography” [
8].
The literature extensively showcases academic outreach practices in this direction, detailing experiences utilizing participatory, collaborative, and social cartography for local improvements [
9,
10,
11,
12]. However, these reported experiences lack in-depth exploration of the cartographic resources used, as [
12] observe, and their relationship with the specific user, the
favela resident [
13]. To address this research gap, a qualitative, in-depth study was conducted on five projects. One of our goals is to provide insights for enhancing cartographic resources (applications and usage methods) potentially suitable for residents of favelas participating in academic research projects.
Furthermore, we seek to promote equitable university–community interaction though cartographic resources and aid academic and vulnerable community users in choosing a better platform for their work, identifying the potential limitations of the employed cartographic resources, and determining their functionalities in meeting the primary objectives of their projects.
2. Interaction between Researchers and Communities through Mapping
The relationships between universities and society are enabled through the exchange of knowledge from different perspectives (academic and non-academic). This process strengthens the social dissemination of knowledge, where there is no space for authorship definition, but rather a bilateral sequence of horizontal interactions.
The role of universities should be participatory and committed to the common good, especially addressing the urgencies of grassroots communities [
14]. It is important to seek mechanisms that reduce vulnerability stemming from the lack of material or symbolic resources inherent to individuals or groups of individuals that are left in situations of exclusion or marginalization and do not benefit from the opportunities available in society [
15].
Paulo Freire [
16] defines academic outreach as an educational endeavor where educators and learners engage as aware participants in a horizontal relationship with the dialogic intervention process. This involves exchanging theoretical and practical knowledge with residents, such as discussing urban rights while mapping the neighborhood or creating a garden. The goal is to avoid operating with a naive interpretation of reality and to steer clear of instruments of domination and cultural invasion.
In research and outreach projects, cartography transcends mere data collection and data reading; it becomes essential for comprehending relationships, space, and time [
17]. It is crucial to have sensitivity to direct an attentive journey to various issues, including ethics. A research project should provide shared experiences built around trust and care for the investigated individuals from start to finish, as individual or collective data location should not be used to discriminate, exploit, or cause harm [
18].
Local data are pivotal for research and actions ranging from vaccine distribution to running basic health units in the municipality [
19], to up to continental railway infrastructure planning [
20] or risk management [
21]. However, an integral part of these research projects and actions is the local community itself. Their participation is necessary in government processes for major public works, for example, and in methodological designs where a local actor is the “collector” of information. Yet, as activist Nicera Wanjiru denounces [
6], these local actors often feel exploited by researchers who arrive in the communities, collect data, and write a good report or project, but the community is not better off than before engaging in the research.
This embodies an exploratory and colonialist model in which the knowledge, power, and existence of the colonizer predominate, to which we conform and perpetuate, especially within university structures and practices, as elucidated by Castro-Gómez [
22] and Cruz [
23]. The exclusivity of official or academic cartography needs to be questioned by asking, “What motivates the subject to want to understand and map space?” ([
24], p282), so that we can (re)position the subject as a cartographer subject who possesses and produces cartographic/geographic knowledge while simultaneously challenging the legacy of Eurocentrism [
24]. Some characteristics of this colonial heritage in cartography are ethnocentrism, exclusion, mimetic representation, reinscriptions, control, and prioritization of the product over the process [
23,
24,
25].
In this context, there is great potential in the application of collaborative tools and participatory methodologies. Actively and consciously marking a feature on the map demands that the user expands their contextual vision about that category, the space it occupies, and the importance of that data. When accompanied by a technological and thematic training process in the user’s area of interest, this activity can be transformative, as articulated and advocated by [
26]. Whether for health, infrastructure, environmental, social, or other issues, mapping processes and maps can be significant instruments of resistance and resilience [
6]. To assess the potential of online cartography for decolonial purposes, [
24] employed 21 criteria grouped into the following categories: cautious charring, acquisition/control/ownership, critical reframing, restorative, and change-oriented, among others.
In this sense, allowing data ownership and introducing benefits for the public is a solution pointed out by Diop et al. [
27] for digital colonialism and the low motivation of participants. Based on the extensive literature review presented, the authors argue that “it is important for the public to know that their efforts to collect and/or share data/information will be accessible to them or will result in solutions, technologies, or policies that will assist them, not exploit them” [
27].
The relentless pursuit of emancipatory cartography transforms previously invisible individuals, who were long excluded from their own history, into visible actors by actively engaging them. Dominant cartography (a mapmaking approach that often reflects the perspectives and interests of those in positions of power or authority) gives way to marginalized cartography and maps of contestation [
28]. Similar to geographic information system (GIS) software, capable of collecting, analyzing, manipulating, and producing data [
29], maps, whether analog or digital, composed of elements like titles, scales, legends, data sources, references, orientation, cartographic projections, and coordinate grids [
30], act as tools for yielding robust responses to a range of demands in research projects involving slum communities. Serving as vehicles for knowledge transmission, these maps can be broad and diverse or narrow and objective, carrying the author’s viewpoint, a question, or a theme, or even general reference, topographic, or cadastral maps [
31].
Another aspect to emphasize is cartographic resources in the web system. With the advent of Web 2.0, geographic information once exclusive to experts is accessible to any web user, exemplified by Google Earth and Google Maps [
32]. The interactive–collaborative nature of Web 2.0 aligns with the participatory ideal of decision-making through the formation of a democratic consensus involving intensive communication and discussion (interaction) among participants [
33]. The number of interactive websites, static or not, offering geographical information via browser services continues to grow [
34]. Furthermore, a significant number of these resources have incorporated one or more GIS functionalities, enabling users to manipulate, analyze, query, retrieve, visualize, and plot multiple types of georeferenced data (most of those functionalities were already present in GIS software more the 20 years ago [
35]).
In the context of cartographic resources, it is essential to understand that GIS software is just one of the six components within the framework of a system that aims to be implemented, which also includes hardware, data, processes, networks, and people [
36]. Moreover, it reflects the multiplicity of its use and the ability to provide mechanisms to combine multiple information through manipulation, analysis, querying, retrieval, visualization, and plotting of georeferenced data.
3. Materials and Methods
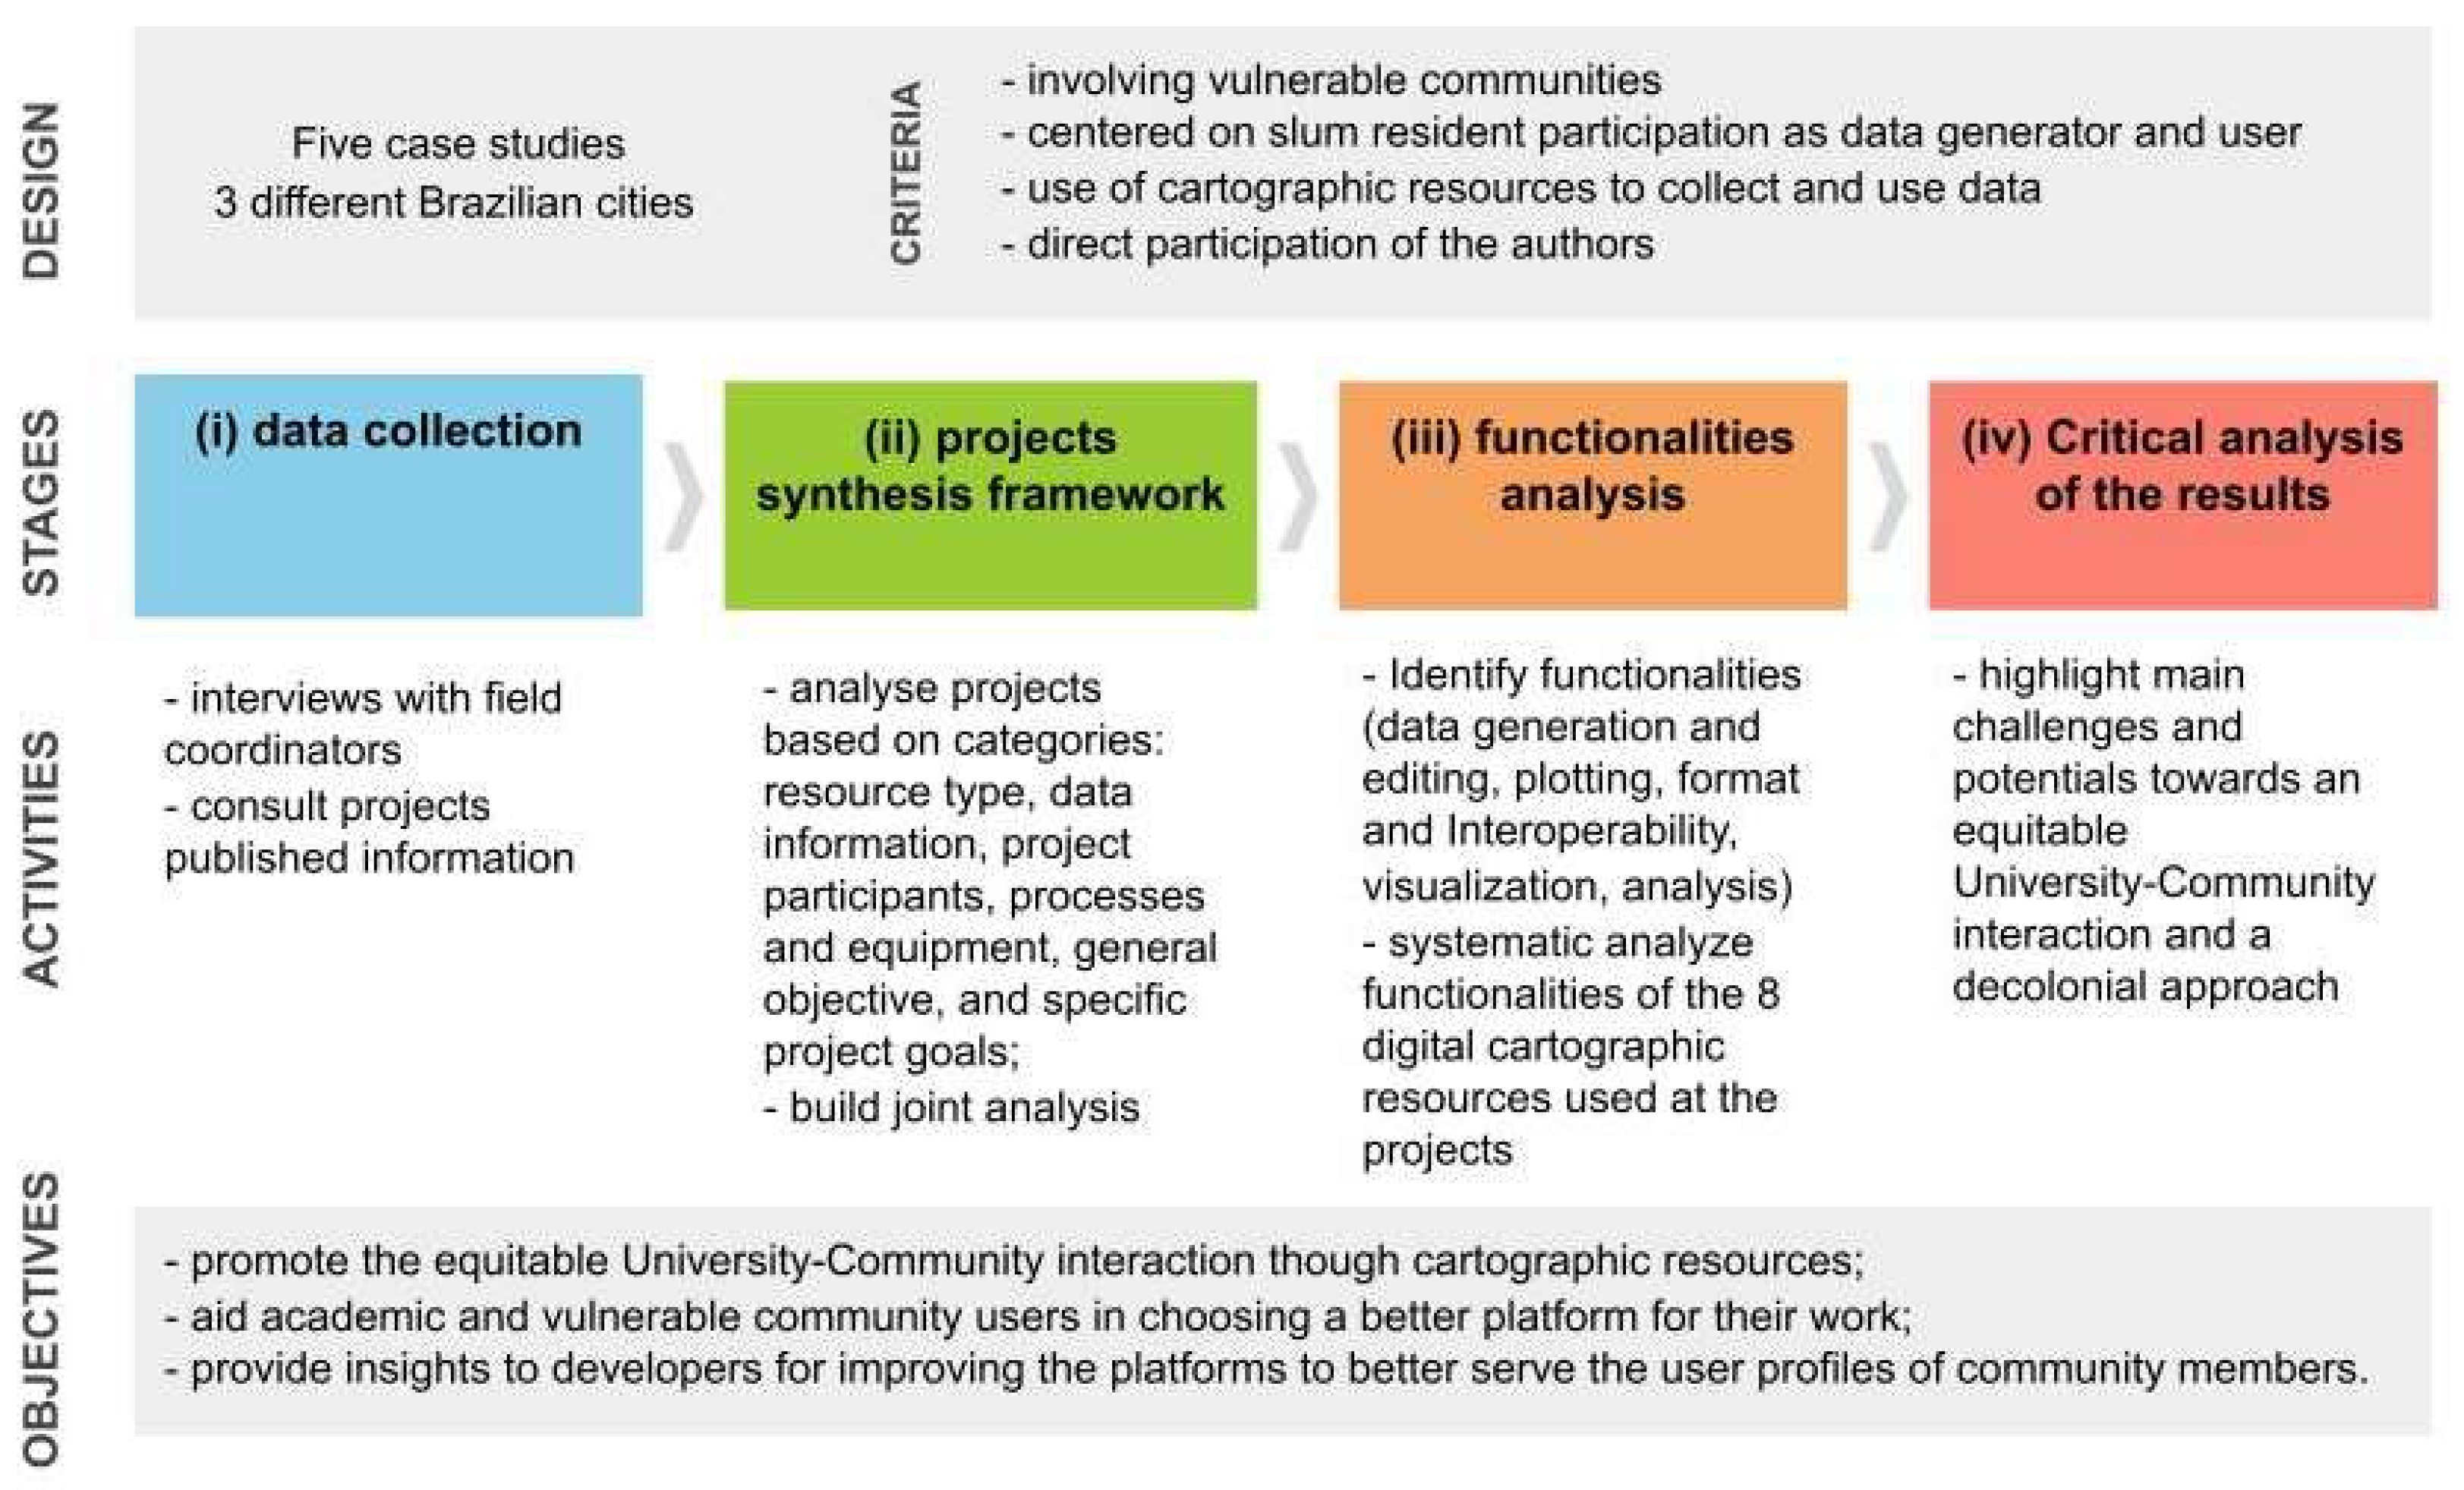
Five case studies which took place in three Brazilian cities were selected using the following selection criteria: the involvement of low-income communities, the use of cartographic resources centered on the collection and use of geospatial information by slum residents, and direct participation or close contact of the authors with the communities. The development of this work was carried out in four stages (
Figure 1).
The first stage involved data collection through the analysis of available information about the projects (e.g., articles, blogs), and individualized interviews were conducted with the coordinators of each project to gather the necessary information about them.
During the second stage, the synthesis framework (based on five GIS components [
36] and project objectives) was created, composed of seven categories filled with information from the first phase: cartographic resources (analog or digital maps, digital platforms, or media), data (geospatial information used or produced within the project), personnel (main profiles of the project’s organizers and participants), processes and equipment (procedures and equipment utilized in the creation or use of geoinformation), general objectives, and specific project goals. Subsequently, based on the information contained in the synthesis framework, a joint analysis of the five case studies was conducted, highlighting the common elements that were seen as essential to meeting the related objectives of each project. Then, a list of the main characteristics and most frequent activities (such as registering a point feature at the map project) related to the use of cartographic resources by the studied projects was generated.
In the third stage, we analyzed the main functionalities of the 8 digital cartographic resources in the 5 case studies to assess their potential and limitations in meeting specific research demands. Functionalities were grouped into five categories and were selected based on the most frequent and valuable activities, taking into account each of the project goals. This understanding of each resource’s capabilities, suitability for project objectives, and limitations may aid community and academic users in choosing a better platform for their work. It could also provide insights to developers for improving the platforms to better serve the user profiles of community members.
Finally, in the fourth stage of the process, critical analyses of the results, we highlighted the main challenges and benefits of the projects and cartographic resources studied towards equitable university–community interaction and the decolonial approach to research.
4. Characterizations of the Case Studies
As a result of the first stage of this work, it was possible to collect the relevant materials for each case study. This section provides brief project overviews to offer context and enhance understanding of the joint systematic analysis presented in the following section. Interview forms, pictures, extended characterization table, and more can be found in the Community Mapping Portal (It is available online at
https://sites.google.com/view/portalmapeamentocomunitario (accessed on 20 December 2023)) and in [
37]. The first two projects presented are held in Salvador, Bahia, Northeast region of Brazil, and integrates the Health Risk Perception project conducted by the Institute of Collective Health at UFBA—ISC/UFBA.
4.1. Research Project on Perceived Risk vs. Objective Risk
A study of perception in public health risk was conducted on four endemic areas for leptospirosis, an infectious disease caused by a bacterium called Leptospira, which is present in the urine of rats and other animals, and mainly transmitted to humans during floods [
38]. This ailment is associated with both behavioral and socio-environmental conditions and is recurrent in impoverished areas with high levels of social inequality in developing countries, resulting in significant social and economic losses [
39]. Those endemic areas studied are located in the city of Salvador, Brazil, and are classified as low-income neighborhoods (Alto do Cabrito, Marechal Rondon, Nova Constituinte, and Rio Sena). The objective was to understand, through a perception map, whether there is a correlation between objective risk points for leptospirosis (identified through serum surveys in residents of these communities) and known health-risk predictors (e.g., accumulated waste, open sewers). The activities were divided into two stages: the first related to data collection in the field and the second in the facilities of the Computer Lab of the Institute of Collective Health at the University of Bahia—ISC/UFBA and the Polytechnic School of UFBA. This is where the georeferencing and processing of the collected data took place. Additionally, four young individuals directly involved in the field data collection were trained to use the Vicon Saga platform, enabling them to utilize its functionalities to generate printed maps and georeference the collected data. This platform has been developed through a 100% Brazilian and cost-free initiative by UFRJ (it is available online at
https://www.viconsaga.com.br/).
During the application of a questionnaire with discourse-based risk perception questions, residents—usually the head of the family—were presented with a printed map as a backdrop, featuring a high-resolution image from the WorldView-3 satellite, covering the study area. Respondents were instructed to use geometric primitives (point, line, or polygon) to indicate their residence and locations they deemed as health-risk spots in their neighborhood, assigning risk levels (0-none, 1-low, 2-medium, and 3-high) to all spots.
With this information in hand, four young participants chosen for the questionnaire application visually georeferenced this data (geometric primitives) using the Vicon Saga platform. The base map for Vicon Saga is composed of satellite images from Google Maps. Whenever necessary, tools like Street View in Google Earth Pro or Vicon Saga itself were used to aid in spatializing the study area.
At the conclusion, with the health risk data indicated by georeferenced residents, the geoprocessing team, composed of undergraduate, master’s, and doctoral students, as well as researchers in the fields of cartography, computing, and public health, was responsible for quality control, processing, and spatial analysis using software such as QGIS 2.18.
4.2. Workshop Mapping with Milton Santos
Workshop classes were conducted throughout the year 2019 as part of a project called “Young Innovators” at the Emília Machado Association, located in the Marechal Rondon neighborhood in the city of Salvador. Its purpose was to develop critical skills and perception regarding urban inequalities in the city, based on the analysis of the living environment. The workshop was grounded in an extract from Milton Santos’ book (Milton Santos, a black man born in Bahia, was internationally acknowledged as one of Brazil’s foremost intellectuals. In 1994, he became the first geographer from the Southern Hemisphere to receive the prestigious Vautrin Lud Award, often dubbed the ‘Nobel Prize of Geography.’ He was also honored with titles from numerous global universities in recognition of his contributions to geography and critical thinking. Available online:
https://miltonsantos.com.br/site/biografia/ (accessed on 13 December 2023))) titled “
Space and Method” [
40].
With the direct participation of 45 young residents from the Alto do Cabrito, Marechal Rondon, and Rio Sena communities, along with undergraduate, master’s, and doctoral students and researchers from the fields of geology, biology, social assistance, geoprocessing, and public health at the Federal University of Bahia—UFBA, the workshop captured photographic records of urban inequalities in these three neighborhoods along a predefined route. It also produced printed maps that served as aids for field location. Mapillary (a street- imagery platform that scales and automates mapping using collaboration, cameras, and computer vision, available at
www.mapillary.com) and Vicon Saga were the cartographic resources used for data collection, georeferencing, data analysis, and the production of analog maps. At the end of the workshop, discussions were held on the urban structures of Salvador, focusing on spatial aspects and the concept of space and territory defined by Milton Santos.
4.3. Community Mappers Training Project at the Polytechnic School of UFBA
Extension courses for community mapper training in epidemic combat emerged as a continuation of activities from the GeoCombate COVID-19 group, which was formed in March 2020 to collaborate on the response to the COVID-19 pandemic in the municipality of Salvador and the state of Bahia, Brazil. Its objective was to provide and generate data and create maps with a focus on geospatial analysis of population flows and mobility, as well as urban and socioeconomic vulnerabilities. Since its establishment, the group has published technical notes and articles, conducted lectures and workshops, and supported knowledge dissemination activities. These are available online at
https://sites.google.com/view/geocombAba (accessed on 10 September 2023). In addition, Mobiliza RAU+E is a group formed by participants of the Residency in Architecture, Urbanism, and Engineering at UFBA, established in 2020 with the aim of bringing visibility to communities, donors, and support actions to better connect them. It created networks to facilitate access to emergency contributions during the pandemic (Available online
https://residencia-aue.ufba.br/pt-br/mobiliza-raue-3 (accessed on 10 September 2023)). Both groups stem from other actions at the Federal University of Bahia. Their objective was to contribute to the strengthening actors involved in pandemic response in the most vulnerable communities of Salvador-BA, Brazil.
The course involved professors from three different academic units (engineering, architecture, design, and nursing) and received support from the Youth Mappers group at UFBA. The workshop took place in three editions (2020–2021) and, in all cases, the activity was integrated with long-term curriculum and extension activities (60 h) offered to students from various degree programs at the Federal University of Bahia, as well as to students and professionals not within this profile. It involved an approximate total of 100 people.
The Google My Maps platform was chosen for the first edition, and the Vicon Saga platform for the second and third editions. This choice was due to the participants’ limitations in having access to computers. Both platforms allow the creation of points, lines, and polygon features using a mobile phone, in addition to enabling the manipulation of layer visualization, thereby offering practical experience with basic geographic information system elements.
Throughout the activities, data points of vulnerability and risk, as well as points of potential, health facilities, boundaries of community health agent micro-areas, and clusters in certain vulnerable areas of Salvador, were generated. Epidemiological data related to COVID-19 were spatially analyzed by neighborhood. The situation in the agents’ micro-areas of operation (in terms of urban–environmental and health vulnerabilities) was discussed. This evaluation assessed the potential use of maps to support their work and the need for communication among agents and the population. The activities aimed to explore studies and practices involving mapping techniques for territorial reading and recognition and to broaden the sense of belonging [
41].
4.4. URBE LATAM Project (Morro do Preventório/Niterói-Rio de Janeiro state)
Working with the community of the favela on the slopes of Morro do Preventório, the
URBE LATAM project (Understanding Risks and Enhancing Capacities in Latin American Cities, 2019–2023) employs community mapping as a dialogic and empowerment tool for communities in conditions of social vulnerability. With a multi-disciplinary team of researchers from geological, social, statistical, engineering, and GIS sciences and community leaders, the project identified the need for interventions that minimize imminent disaster risks and build on existing social, economic, and environmental dynamics within the community [
42].
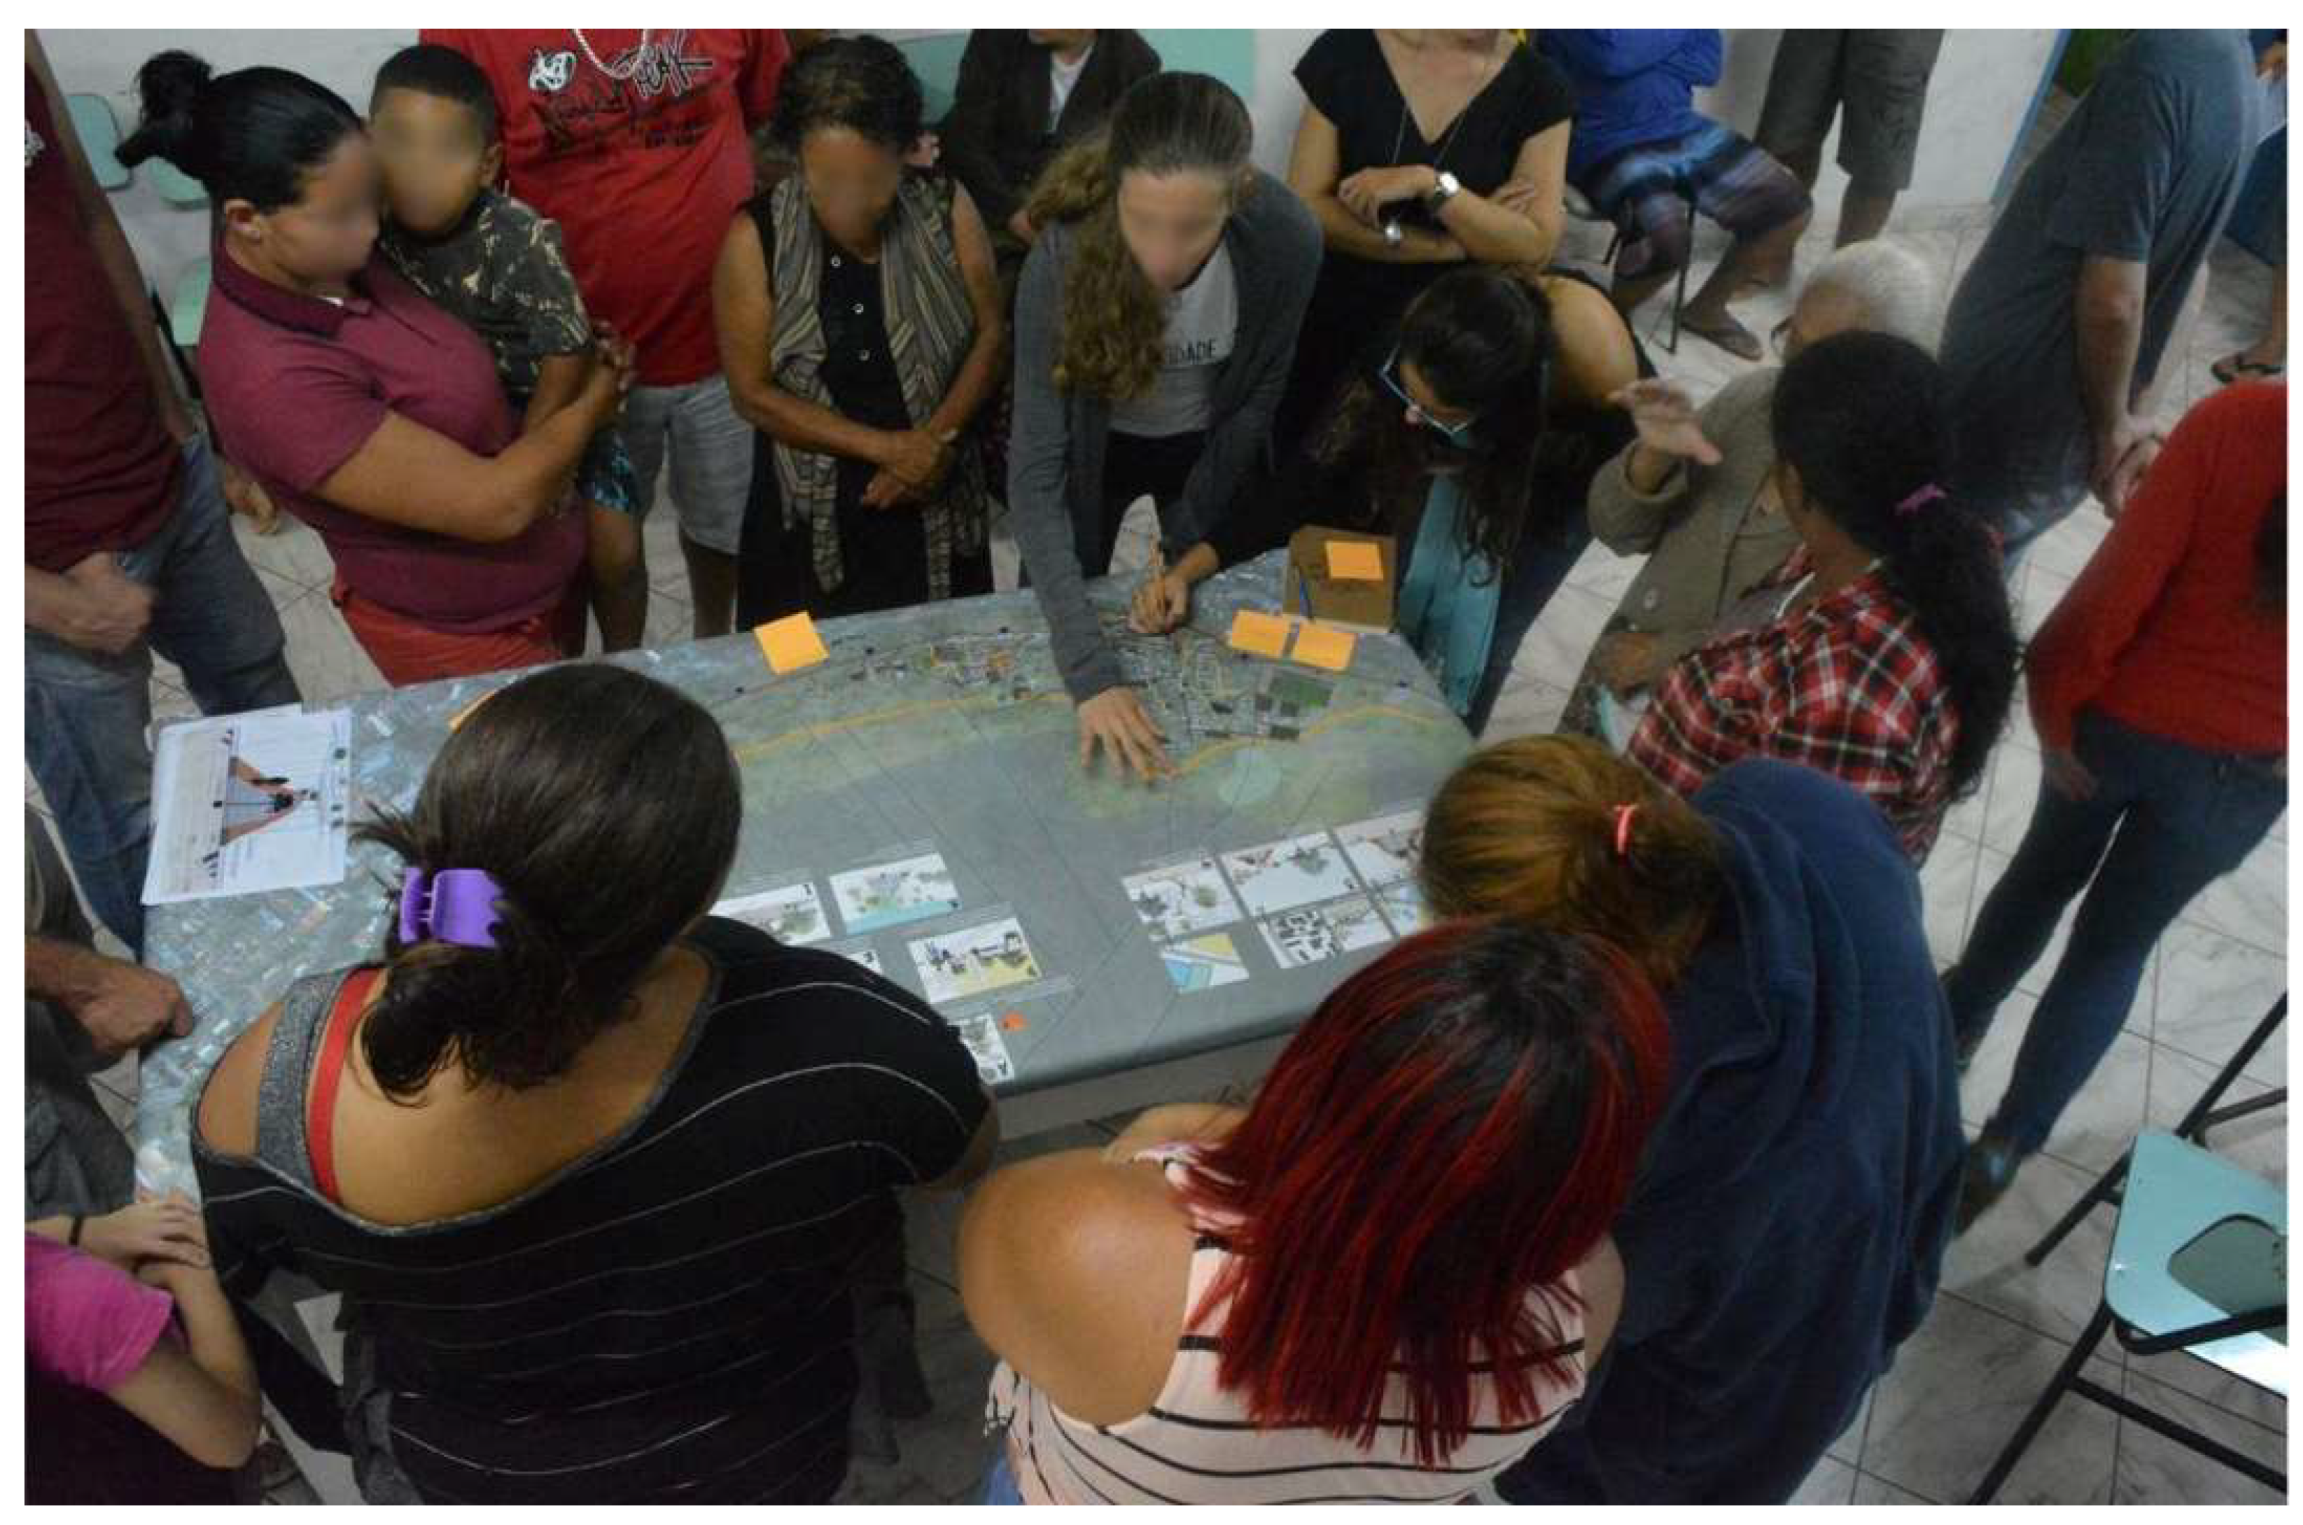
With direct participation from residents, recognizing the importance of their lived experiences and the promotion of a sense of belonging to their community, the project utilized various cartographic resources. These resources included online platforms for data collection (Kobo Toolbox) and participatory mapping such as OpenStreetMap, as well as a combination of Google Maps and printed maps (
Figure 2) to create a base map for field mapping by trained residents. Digital maps were also created, along with rapid-updating methodologies for these maps, and a mapping application called
Tô no Prevê. With community members as the protagonists of their own narrative, the project promoted emancipatory cartography and contributed to the development of mapping agents.
It is important to highlight that this “cartographic emancipation” emerged from the involvement of cartographic resources in the field work. The body thinks about where the feet will walk, and the body of the community investigators is also formed by the resources that are on the walk with them, including cartographic resources. This experience produced a working method that was pedagogically organized in four dimensions: legitimacy, technologies, community planning, and mapping and local actions.
Each dimension can be briefly explained as follows: (i) Legitimacy is the recognition, by territory, of the work of community leaders. In this way, legitimacy is born out of the trust between the people of Morro do Preventório and those who carried out the mapping with them—as well as the protagonism of community leaders. (ii) The technologies dimension simply puts into practice the complex relationship between map construction tools and the experimentation of these tools by mappers while working in the territory. Practice is not carried out by just replicating the traditional “how to use” instructions of any tool, but by adapting them so that they make better sense for each reality, including having the perception of when not to use them. (iii) Community planning concerns the team’s day-to-day work, in which the priority of meeting the needs of the territory is greater than carrying out the mapping itself. This is because the urgencies of the community are different from those of the university, and, as it is a team made up of community leaders, the needs of their colleagues, friends, and neighbors are more important than following an idealized schedule in the planning stage. Given the premise that what matters is taking care of the people, replanning the project’s activities based on community urgencies is nothing more than strengthening the legitimacy dimension and, consequently, the validation of the mapping. (iv) Mapping and local actions bring out the power of pre-existing local institutions that sustain local actions that take place simultaneously with community-mapping processes. Considering the Community Bank as part of the project, he points out a way to learn how to perform the mapping: slowly and taking care of people, following the principles of solidarity economy.
These dimensions structure a method that supports the main “result” of this project, the territorialized capacity to produce data and maps that, in effect, brings a potential for updating data and maps of the territory.
In addition to making their community visible, this process allowed residents to bring in their perceptions of physical landslide risk within the neighborhood, and dialogically identify opportunities to address factors of social vulnerability with existing community structures and potentialities. For example, as a result of these efforts, the community bank created a new credit line to enable residents to make structural improvements to their housing in collaboration with a DIY collective of women residents which had also already been active in the neighborhood. Thus, in addition to co-productively making visible the historically marginalized areas, the mapping exercise dialogically addressed factors of physical vulnerability by building on existing community potentialities for resilience.
4.5. Popular Urbanization and Land Regularization Plan for the Banhado Community—São José dos Campos/SP
Covering an area of approximately 420,000 m
2 and with a population of 2000 people, the Banhado community in São José dos Campos, SP, consists of 460 families who have been residing there for over 80 years. It comprises two settlement nuclei: Nucleus I, built along the railway line, densely populated by individuals who sought work in industries during the period from 1960 to 1980, and Nucleus II, occupied by small farmers since 1930 in an area scattered with small farms [
43]. The residents of the Banhado community live in constant conflict with the public authorities for recognition of their belonging to this place.
The project emerges from the perspective of countering the master plan defined by the public authorities, which, in its construction, presents characteristics contradictory to the interests of the Banhado and Jardim Nova Esperança communities in the central region of São José dos Campos, SP [
44]. Through the partnership between academia and its outreach activities, along with the Banhado community, the project sought to contribute to the empowerment of residents through a series of actions such as workshops and seminars that were held in 2017 with approximately 200 participants in total. These activities included the utilization of cartographic resources such as remotely piloted aircraft (RPA) and QGIS software, to collect and generate various cartographic products (
Figure 3), including vector data of different features (e.g., dwellings, water sources, roads, and sewage channels), orthophotos, and the creation of topographic, planimetric, cadastral, and thematic maps, as well as generating a digital surface model (DSM) and digital terrain model (DTM). These products played a significant role in the understanding of the physical characteristics of the studied territory, thus proving necessary for decision making, fostering autonomy, and strengthening the sense of belonging.
5. Analysis of Components and Functionalities Applied to Cartographic Resources
As can be observed, the five case studies have distinct characteristics and objectives, yet they share several common points. In this section, we will present the results of the remaining stages of the study: (ii) the project synthesis framework (
Table 1), (iii) the analysis of the functionalities (
Table 2), and (iv) the critical analysis of the results.
Table 1 provides a synthesis of the characteristics across the studied projects. Some of these characteristics are evident in all five case studies, such as the production of various types of thematic map, visual analysis through layer overlay, creation of vector features, layout design for map printing, online access to satellite images from Google, participation of both young and adult residents from the study areas, and community associations. Among the identified processes and methods, three are common to all studies: meetings between the team and community members, training of community members to use cartographic resources, and data manipulation, processing, and validation. It is also noteworthy that all five projects utilized computers or notebooks and photographic cameras.
Regarding the eight identified objectives, five were common across all projects: raising awareness among residents regarding features related to health risks, urban inequalities, promoting equitable resilience, identifying local vulnerabilities and potentials, and giving voice to the community. However, the Popular Urbanization and Land Regularization Plan for the Banhado Community project presents highly specific characteristics, such as generating orthophotos of the study area using RPAS, utilizing old plans and maps (digitized as images) from public entities, and involving researchers from the field of law.
In
Table 1, it can be observed that, digital GIS tools, as well as web maps, were widely used as cartographic resources (Item 1). It is important to note that some of these applications (e.g., reference system conversion, file transformation to different formats, and utilization of geoprocessing tools) were carried out solely by university participants without community involvement.
In Item 2, it is evident that digital cartographic resources were extensively employed to generate vector data. Vector data for natural and constructed features, as well as public health risk variables, were generated in four out of the five case studies. Other different variables of interest were generated by some of the projects. Vector data originating from VGI platforms such as Google Maps and OpenStreetMap were used to support the activities of three projects.
Regarding raster data, four of the studied projects generated maps for printing. However, concerning the acquisition of aerial images using RPAs (Remotely Piloted Aircraft) and the generation of orthophotos, only the Popular Urbanization Plan of the Banhado Community project employed this approach, benefiting from the employment of qualified professionals for its generation. Projects such as Perceived Risk vs. Objective Risk and URBE LATAM—Morro do Preventório utilized orthoimages provided by public entities.
Considering the people component (Item 3), users of cartographic resources were categorized into three groups in all five case studies: coordination, researchers and extension workers, and community members. Four out of the five projects were led by individuals with backgrounds related to cartography or similar fields, while the URBE LATAM—Morro do Preventório project did not have individuals with such experience in their team at the beginning.
Regarding the working methodology (Item 4), it is evident that all five projects involved direct participation from community members, whether in meetings with academic teams, data collection, or training activities. During these activities, community members utilized cartographic resources, and the significance of this practice is emphasized by [
45] in the context of insurgent cartography. Additionally, regarding processes, all five projects included data manipulation, processing, and validation procedures, given that the collected data, whether from community members or external researchers, required an assessment of their quality.
Electronic equipment (Item 5) such as computers, cell phones, tablets, and cameras played a pivotal role in the research projects. In
Table 2, for instance, it is evident that all five case studies utilized cameras and computers for community-related activities.
Cameras serve as sources of record (cataloging) for relevant information in the production of reports, articles, and other scientific documents. When georeferenced, they provide organized and easily accessible information sources. For example, in the Workshop Mapping with Milton Santos project, the Mapillary platform was fed photographs taken by community members using tablets, as well as images captured with 360° cameras operated by project researchers. The data collected pertained to areas not covered by Google Street View.
Another interesting example is the RPAs used in the Popular Urbanization Plan of the Banhado Community project, which require cameras attached to their structures to capture aerial images of the study areas, subsequently generating different cartographic products such as orthoimages, digital terrain models (DTM) and digital surface models (DSM). Collaboration with community associations is crucial in this process. They act as intermediaries, providing spaces for the installation of computers used during project activities within communities and coordinating with residents for the take-off and landing of RPAs and other field surveys. The physical security of participants who are not from the communities is a recurrent concern that can be effectively addressed through this collaboration.
Despite having distinct objectives, Item 6 reveals that all five case studies share common focuses, such as raising awareness among residents regarding health risks, identifying urban inequalities, promoting equitable resilience [
46], pinpointing local vulnerabilities and potentialities, and empowering community voices. These objectives underline the existence of an exclusionary socio-spatial structure (including health risks, urban inequalities, and vulnerabilities) in the favela communities.
Based on the characteristics presented in the five case studies, it was possible to identify the demanded functionalities of eight of the digital cartographic resources used in these projects. These functionalities were grouped and described according to their fulfillment in
Table 2.
The functionalities offered by each cartographic resource to address specific purposes may or may not contribute to achieving more accurate responses.
Table 2 can aid researchers in this regard. The QGIS software proved to be almost comprehensive for all required activities. However, in none of the projects, community members were proficient in using it due to its complexity.
Among the other analyzed cartographic resources, “Vicon Saga” stands out for the number of functionalities it fulfills compared to other resources, and for its user-friendly interface. As a web map, Vicon Saga is part of a completely Brazilian, free initiative that can be used on different devices (cell phones, tablets, and notebooks). It encompasses various GIS characteristics within its structure and can be applied to various research projects and collaborative work involving diverse user profiles. Additionally, it serves as an excellent data collection resource to support information management and offers flexibility in constructing customized georeferenced forms.
Regarding the listing of functionalities and the exploration of tools that can address the demands represented in the five case studies, some of the key factors to observe were: QGIS, being a geographic information system (GIS) software, was the most comprehensive resource within the analysis framework. The Vicon Saga platform achieved a high-performance rating of eight, as it features tools enabling more complex spatial analysis (e.g., generating heat and flow maps), as well as the capability to construct georeferenced digital forms. Google Earth Pro distinguishes itself with its 3D base map visualization function and historical satellite image series that can, for instance, serve as an element to aid the understanding of the territorial occupation processes under study. OSM ID and HOT Task Manager are platforms with the potential to allow users to digitize and input data about the physical features present in the territory. In the context of vulnerable communities, this territory is often not densely mapped, not even by official bodies.
Google Maps/Street View and Mapillary differentiate themselves by providing access to georeferenced photographs. Notably, Mapillary is user-fed, allowing a temporality that can be adjusted to local demands.
Critical Analysis of the Results
Despite distinct project objectives, this research identified common focuses across all five case studies. Shared objectives, such as raising awareness, identifying urban inequalities, and empowering community voices, contribute to a collective effort transcending individual project goals. The research emphasizes the involvement of diverse user profiles, recognizing that cartography is applicable across various disciplines and life backgrounds, breaking away from the traditional academic-centric approach, as advocated by [
14,
16]. This is highlighted by the direct participation of community members in various activities, such as meetings, data collection, and training, ensuring the community has a voice in the cartographic process and aligning with principles of inclusivity. It is not solely about the exploitation of local labor, as exposed by [
6].
The use of electronic equipment, such as computers, cell phones, tablets, and cameras, also promotes digital inclusivity, breaking down barriers due to technological disparities, a challenge pointed out by [
12]. The projects aim to promote user-friendly cartographic tools, like “Vicon Saga” or 3D models, to make geospatial data accessible to, and usable by, community members, regardless of proficiency levels. The authors of Projects 1, 2, and 3 highlight the importance of involving young individuals, given their openness and eagerness to explore digital technologies. Additionally, there is a need for sensitivity and respect from members of the academic community when engaging with participants lacking in technological knowledge or interest. Within the group, it is crucial to recognize these differences and value the territorial and local knowledge held by other participants, often older individuals. It is strategically important for the community to be aware of the potential of these tools, enabling them to advocate for, and support, digital mapping activities.
Concerning colonial and exploitative university–community approaches, this study reveals that the projects challenge characteristics associated with colonial heritage in cartography. It demonstrates a move away from ethnocentrism (one of the colonial heritages in cartography according to [
24]) by acknowledging and prioritizing diverse user profiles. The involvement of community members in all stages of the research and emphasis on utilizing tools accessible to them counter the tendency to impose unfamiliar or complex standards, breaking away from the traditional academic-centric approach emphasized by [
22]. It also amplifies local voices and narratives, countering the erasure of existing cultures (reinscription) and the exclusion of the spaces and lives of marginalized populations in maps. As a result of active participation that seeks the appropriation of technologies and processes (in addition to thematic discussions), Projects 1, 2, and 4 yielded unplanned outcomes, leading to the establishment of local initiatives focused on the qualification of individuals and community spaces. Examples include the Community Research Station (established as a department of the Preventório Community Bank (Preventório Bank website. Available online:
https://bancopreventorio.org.br/ (accessed on 5 January 2023))) and the social startup ComuniTech (CommuniTech social media. Available:
https://www.instagram.com/_communitech/ (accessed on 5 January 2023)) in Salvador.
The collaborative use of RPAs with community associations challenges traditional power structures related to land use. Instead of enforcing dispossession, providing tools that are part of a free Brazilian initiative (Vicon Saga) and map collaboration empower communities by allowing them in decision-making about their territories, their data and technology. A practical application of the pedagogy of autonomy advocated by Paulo Freire [
26].
The authors also emphasize the constructed process as relevant to reinforcing the resistance of the Banhado
favela (Project 1), which has been facing constant attacks aimed at its removal (Banhado Resiste website. Available online:
https://www.facebook.com/Banhadoresiste/ (accessed on 5 January 2023)), but the community has persisted up to the present moment. Critical technological appropriation is also reflected in the use of local terms (e.g., in Morro do Preventório, mapathons are referred to as “multirão de mapeamento” the equivalent to “mapping brigade”, an analogy to the “house community brigade” activities), and the co-development of proprietary applications like Tô no Prevê (App “Tô no Prevê” blog. Available online:
https://urbe-latam.cos.ufrj.br/2023/06/18/to-no-preve-apresentacao/ (accessed on 5 January 2023)) (Project 4) and +Lugar (Platform “+Lugar” website. Available online:
www.maislugar.org (accessed on 5 January 2023)) (Projects 1 and 2).
The use of collaborative platforms like Vicon Saga and OpenStreetMap as data sources recognizes the subjectivity in map creation challenging a mimetic representation that assumes maps accurately depict reality without acknowledging biases. It also emphasizes mapping processes, including data manipulation and validation, underscoring a shift toward prioritizing the participatory process. This counters the historical tendency to prioritize the final product.
However, it is also possible to identify some potential challenges to be faced. The analysis of the cartographic resources reveals that some applications, especially those related to more complete and/or complex tools, such as QGIS and RPAs, were carried out solely by university participants without community involvement. This lack of community participation in certain aspects of the process may lead to a technological gap hindering the empowerment of community members in utilizing these tools. It also may lead to a situation where community members are unable to fully engage in the decision-making processes related to cartographic activities. It could contribute to a hierarchical distribution of knowledge and decision-making power, impacting the overall equity of collaborative efforts.
Despite the projects’ objectives, challenges related to health risks, urban inequalities, and vulnerabilities persist. The acknowledgment of these challenges suggests that the projects may face difficulties in fully addressing and mitigating these issues. Participants, both community and academic, must be aware that the maps produced should not consolidate existing socio-spatial disparities, but should evidence the disparities that must be transformed.
6. Conclusions
In summary, the research outcomes highlight methods and tools that can move research and outreach academic projects towards more equitable University–community interactions through cartographic resources. The emphasis on inclusivity, collaboration, participatory methodologies, and the use of accessible technologies contributes to a more balanced and mutually beneficial relationship between academic institutions and the communities they serve.
The projects presented emphasize that the utilization of these resources can form strategies to promote improvements, highlight potentialities, and advocate for more suitable rights and public policies. Recognizing the user profile of cartographic resources, their needs, the most effective methods, and timing for community empowerment is of paramount importance. The adoption of these resources will only occur if the tools assist them in addressing existing demands. Furthermore, such efforts can contribute to the resilience of these communities, strengthening their self-awareness through data production. These data also serve as instruments for political negotiations with governmental bodies.
The analysis framework of functionalities allows the identification of the potentialities and limitations of eight digital cartographic resources used in the five case studies. Combined with the joint analysis table they can provide insightful observations to be considered when working on research projects with a similar profile. We also believe that the presented products can support developers in defining mapping system requirements targeted towards users living in slums.
One limitation of this research pertains to the participants involved. The interview was exclusively conducted with a single community member, who concurrently served as an academic researcher and the fieldwork coordinator within the Morro do Preventório project. Despite the active engagement of all interviewers and the provision of information regarding the project and cartographic resources, we recognize the absence of the viewpoint of our main users—the residents of the slum. To address this gap, supplementary studies employing complementary methods, including questionnaires and usability tests, are currently underway to capture this crucial perspective.
In conclusion, this study can encompass a larger number of research projects and cartographic resources, covering a broader range of experiences and possibilities. It is also valuable to advance studies by evaluating the usability among residents of slums and conducting surveys to prioritize system requirements being considered in the making of platforms, and to foster better ethical and professional interactions between researchers and residents of these areas.


 ,
, 


