
The Scale of Urbanism

Social Sciences Division, University of Chicago, Chicago, IL 60637, USA
Urban Sci. 2023, 7(3), 87; https://doi.org/10.3390/urbansci7030087
Submission received: 22 May 2023
/
Revised: 14 August 2023
/
Accepted: 15 August 2023
/
Published: 17 August 2023
Abstract
While scale is an essential factor in discussions about sustainable cities, there is no common understanding of what scale is or how it should be measured. This paper sheds light on the issue of scale by suggesting how it might be measured and evaluated. My purpose is to offer both a methodological and empirical contribution to the understanding of scale, using Chicago as a case study. Using historical Sanborn maps, I first investigate scale change over time, focusing on a selection of 31 sites that are now “mega-developments” but were originally composed of small-scale buildings and blocks. I quantify that the historical urban fabric had five times as many buildings, and a much higher percentage of buildings with mixed use. I then look at the city as a whole and compare urban scale to pedestrian quality to assess whether there is a quantifiable difference between large- and small-scale urbanism. I find that, at least for Chicago, small scale urbanism is associated with higher pedestrian quality. For the third part of the analysis, I correlate scale and socio-economic characteristics at the census tract level. The results illuminate a mixed set of differences between scale and socio-economic characteristics like income and housing value.
1. Introduction
The sustainable city, a concept that started in the 1970s as an “eco-city” movement that sought to build cities in balance with nature [1], is now generally defined as a city that exerts minimal damage on the environment while maintaining a diverse and resilient economy, an equitable distribution of resources, and a means of citizen participation. On all of these fronts—diversity, equity, engagement—small-scale urbanism is thought to have a better alignment with sustainability goals than large-scale urbanism [2]. Following the work of Jane Jacobs [3], urbanists have been promulgating the benefits of small-scale urbanism, denouncing the liabilities of large-scale form and arguing that neighborhoods that develop or redevelop on a small scale are the ones that are the most sustainable and resilient [4]. Large-scale urban developments—“mega-projects” in the form of town centers, university campuses, and other large format urban schemes—are viewed as antithetical to Jane Jacobs’ brand of incremental change, and the very opposite of a resilient and sustainable city [5,6].
While scale is an essential factor in discussions about sustainable cities, there is no common understanding of what scale is or how it should be measured. Is it about buildings, lots, and block sizes? Is it about single vs. corporate ownership of land? Is it about the geographical distances between points? Cities are aggregations of all of these elements —small lots with single family homes, 200-acre parcels with multi-use buildings with thousands of square feet, and infrastructure and public spaces ranging from intimate to vast. The variation of the scale of urbanism from small to large creates a multitude of effects and experiences.
This paper is intended to shed some light on the issue of scale by working through examples of how it might be measured and evaluated. For the purposes of this study, which is a quantified analysis of scale, I define scale as a physical condition of the urban environment that can be assessed based on building size and building size per block. Specifically, scale is measured by (1) the size of buildings, including stories and square footage; and (2) the mean and percentage of buildings of different sizes on a block.
I do not propose a definitive nor an inclusive treatment of scale, since the number of possible forms and measures is much larger than a single paper. My goal, instead, is to offer specific examples of how scale, as an essential variable in sustainability debates, might be defined and measured. I do this by attempting to answer a set of questions related to scale: How has scale changed over time? What variables correlate with different urban scales? Are there measurable differences regarding block quality and socio-economic factors that can be linked to the scale of buildings and blocks? My purpose is to offer both a methodological and empirical contribution to the understanding of scale, using the City of Chicago as a case study. In my particular conceptualization, scale is measured on the basis of building type and block size.
The analysis is in three parts. I first look at the site level to investigate scale change over time. I wanted to know what occupied large development projects before they were built, and, using historical Sanborn maps, offer a way to characterize urban scale change over time. Thirty-one sites were selected for historical vs. current comparison, using data on publicly funded major developments constructed over the past several decades. I was able to quantify that the historical urban fabric had five times as many buildings, and a much higher percentage of buildings with mixed use. Despite the larger format of buildings (in terms of footprint and height), the historical urban fabric also had five times the amount of building square footage.
The second part of my analysis involved comparing urban scale to block characteristics like pedestrian quality. I wanted to know whether there is a quantifiable difference between large- and small-scale urbanism in terms of objective measures of urban quality. This required devising (1) a typology of urban scale and (2) a block rating system. I first compared the block characteristics of the 31 mega-development project sites to the block characteristics of their surroundings. I then compared block characteristics and scale for the city as a whole. I found that, in the City of Chicago, small-scale urbanism is associated with higher pedestrian quality.
For the third part of the analysis, I correlate scale and socio-economic characteristics at the census tract level. The results illuminate a mixed set of differences between scale and socio-economic characteristics like income and housing value.
Knowing how to approach the issue of scale is a fundamental dimension of urban analysis, perhaps as important as understanding how to measure population decline or revenue gain. The research presented here is a methodological and empirical contribution that applies a specific approach to scale definition, measurement, and analysis. I offer a delineation of scale ranging from “small” to “large”, propose a method of measurement, and then apply several techniques to examine how scales of urban development have evolved and what their associated characteristics are.
2. Literature Review
Cities have long developed at multiple scales simultaneously, for different purposes and with different effects. Large-scale development was an expression of political power, of absolutism, or of the centralizing force of an authoritarian regime. Monumental scale is a natural fit for authority and control, presupposing an “unentangled decision-making process” and expressing that the ruling authority has the necessary power to get things done [7] (p. 217). Alongside this larger scale, small-scale urban fabric was created and recreated by individual owners, developers of various sizes, and builders working in a more incremental manner. Urban change was accomplished lot by lot, block by block, through the work of many individual owners rather than despots, governments, or large developers [8].
A few important studies have attempted to document these scale changes. Warner and Whittemore [8] chart the evolution of an imagined U.S. city amalgamized from Boston, Philadelphia, and New York. They describe how, through the mid-18th century, most dwellings were small in part due to the high costs of construction. Even in the early streetcar era of massive rowhouse neighborhood expansion, most were built by craftsman at a rate of three to six per year, yet a homogeneity of style tended to develop outside of legal regulation. Hunter categorizes homes into three types: freestanding, attached, and apartments, and charts their evolution as forms in the American landscape [9]. Scheer expands this typology to include not just non-residential buildings, but also patterns of land subdivision, and emphasizes how historical patterns may constrain redevelopment possibilities [10].
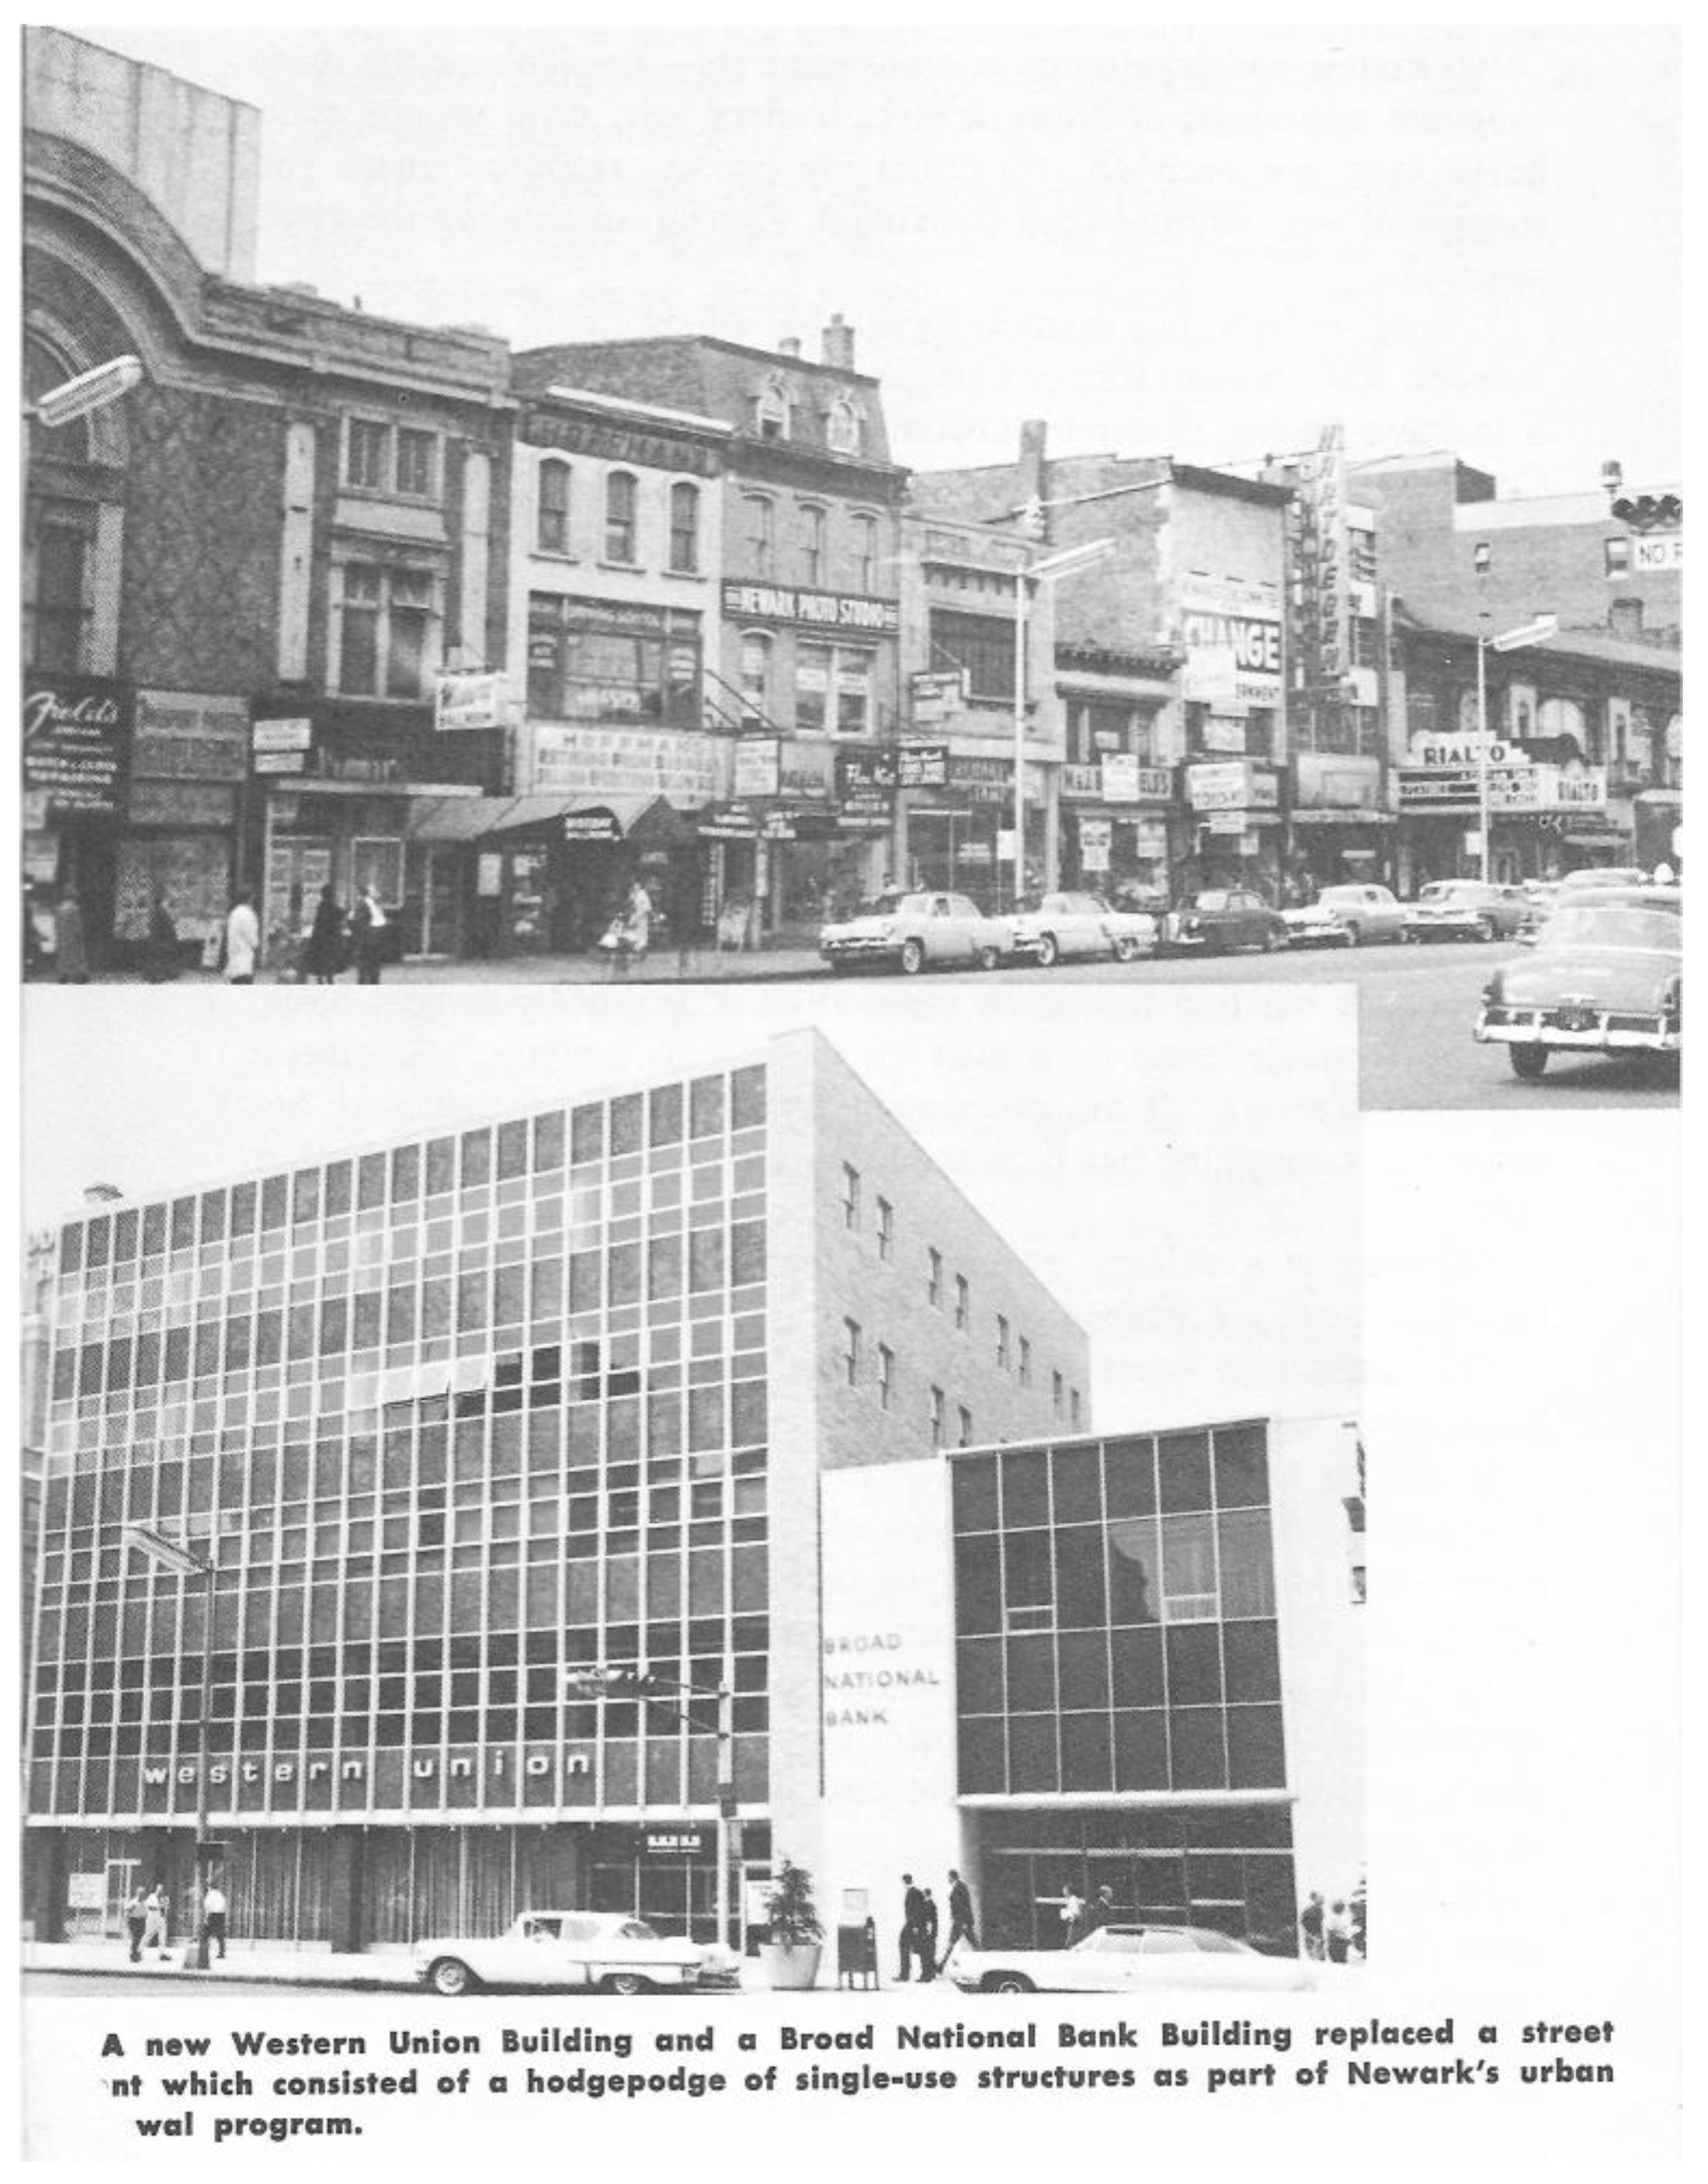
Beyond historical analysis, the literature on scale has focused on debating the pros and cons of different scales. Debates about the effect of scale go back at least to the foundations of the field of planning, particularly in the U.S., when Daniel Burnham’s famously declared “make no little plans, for they fail to stir the hearts of men” [11]. Proponents of large development argue that this is the scale at which jobs are generated, infrastructure is financed, and city revenues are increased. The impulse to “go big” in city planning was further promulgated by modernist concepts of urbanism promoted through planners and architects associated with the Congres Internationaux d’Architecture Moderne, known as CIAM [12]. The large scale of modernist towers and freeway schemes prompted Jane Jacobs, among others, to castigate planners [3]. Mid-twentieth century urban renewal (Figure 1) was done at a large scale around the globe, and resulted in widespread displacement. In the U.S., large-scale urban renewal was often directed at African-Americans, prompting further debate about the issue of scale. Relatedly, Jacobs included the scale of finance in her critique, praising the benefits of “gradual money” over the deleterious effects of the “cataclysmic money” inherent in most large plans [3] (p. 291–317). These debates evolved into the 1970s economics of “Small is Beautiful” [13] and calls for informal incremental development as a solution to housing in the developing world [14].
In the 1980s and 1990s, scale debates pinned urban-minded preservationists as small-scale revitalizers working against status quo over-sized suburban sprawl and large “public−private” development schemes [15,16]. As the preservationists worked to revitalize disinvested urban areas, others called for zoning reform to allow small, multi-unit buildings [17,18]. Urban designers [19,20,21,22] argued that small-scale urbanism was not only more visually appealing and experientially rewarding, but it was better able to support diverse economic and social activity. The New Urbanist movement pitched itself as a champion of small-scale urbanism battling large-scale development that they regarded as an enabler of car-based urban form [23].
While the benefits of small-scale—and the negative impact of large-scale—urbanism were widely recognized by the end of the 20th century, large-scale urbanism continued. This was partly a consequence of boosterish claims about the return of central cities [24,25,26,27], which stimulated larger-scale private investment in inner-city sites, often enticed by municipal subsidies [28]. Some cities, such as Vancouver, B.C., attempted to infuse urban placemaking principles in these new large-scale developments [29]. Yet the large scale—in both physical form and in terms of the aggregation of finance and capital—was critiqued for contributing to an affordability crisis [30,31] and for creating a global homogenized urban aesthetic irrespective of local conditions [32]. Projects often ran over budget and failed to provide the affordable housing and municipal revenue proponents had claimed [33,34].
The term “mega-project” entered the lexicon as a descriptor of the expanding scale of city building. Flyvbjerg, Bruzelius, and Rothengatter [35] loosely define mega-projects as those over USD 1 billion in costs with a focus on infrastructure. Fainstein and others define mega-projects as “very big, mixed-use developments [that cities use] as attractors of multinational business and sites for new housing,” [32] (p. 768); see also [36,37]. These projects are often built on obsolete or under-utilized industrial land, a distinction from the residential displacement associated with mid-twentieth century urban renewal [38].
There is a perception that these recent mega-projects are “lacking the layering of old and new, small and big, that gives central cities their ambiance and opportunities”, [32] (p. 783), and urbanists have turned their attention to the benefits of “human-scale”—which is mostly “small-scale”—development. Research on urban morphogenesis (the processes that shape the physical form of cities over time) and urban morphology (patterns, typologies, and configurations of urban form) ties into these interests because scale is a significant aspect of the analytical approach. For example, Hillier and Hanson [39] analyzed spatial configuration, including pattern and scale, to understand the relationship between form and function. Busquets [40] examined Barcelona’s urban morphology to understand how it contributes to a human-scale environment. Research on cities like Copenhagen, Amsterdam, and Paris have explored the successful implementation of policies and design strategies that enhance human-scale qualities and promote active modes of transportation, which often translates to what would be considered “small-scale” urbanism [41,42]. Jan Gehl [43] studied the relationship between urban design and human behavior, emphasizing the importance of creating pedestrian-friendly environments and human-scale interventions aimed at increasing social interaction, healthier lifestyles, and improved overall urban livability.
Appreciation of small-scale urban form has translated to practice in several ways. Some focus on temporary and smaller-than-a-building scale “Tactical” or Do-It-Yourself (DIY) interventions [2,44]. Others looks for ways to encourage and support small-scale development through developer trainings and networks, such as the Incremental Development Alliance (incrementaldevelopment.org) or through advocacy, research, and consultancy (smalldevelopmentcounts.org; recastcity.com). These advocates argue that the current development milieu accommodates single-family detached housing and larger buildings over four stories, but thwarts “Missing Middle” smaller-scale development that falls in between [17,45]. There has been some focus on the regulatory and financial barriers small-scale urbanism endures [5]. Others have focused on the integrated role small-scale manufacturing can play toward revitalization [46]; see also [47].
Another theme advanced by proponents is the greater affordability and thereby equity that could be achieved through increasing the housing supply with small-scale development. Relatedly, proponents tout small, incremental development [4] and small-scale main street businesses [48] with integrated manufacturing [46] as tools towards building more vibrant, equitable communities. This small-scale urbanism is often positioned, both implicitly and explicitly, as either a more equitable alternative to large-scale capital and subsidy-intensive mega-projects, or a neglected co-contributor to urban vitality. Critics from the left point to the racialized social construction of housing values that would nevertheless persist [49]; for a response to the critique, see [50]. There are also critiques of incremental urbanism for its inability to redress inequities [51,52]. Large-scale social housing, if done right, is still not ruled out as an appropriate scale at which to solve the affordability crisis [53,54,55].
These large-scale private developments are often subsidized. In the U.S., this is done through Tax Increment Financing (TIF), a financing tool that allows administrators to pay for programs with future tax revenues generated within a TIF district (an area that has demonstrated “blight” conditions). The property taxes from the TIF district are fixed for a certain period of time (often 20 years), and tax growth above the fixed base level is diverted away from general revenue capture toward a separate TIF district fund (the difference in revenue is the tax increment). The subsidies are justified as necessary to both attract investment to desired areas and mobilize the large amounts of capital required for public infrastructure and amenities. Proponents claim that these subsidized, large-scale developments create jobs, tax revenues, and infrastructure investments that could never be generated in an incremental fashion. U.S. city governments are much more focused on subsidizing large-scale private developments in the name of revitalization, justified as necessary for mobilizing the large amounts of capital needed for public infrastructure and amenities.
But critics argue that TIFs and the mega-scale they tend to be associated with are a form of corporate subsidy, used as a cost-free instrument to secure deals with corporations, frequently in areas that do not need supplementary public support [56]. Common examples of TIF use in Chicago include the subsidization of corporate headquarter relocation or renovation, the provision of general support and monetary incentives for private companies, and upscale development in and around the economically advantaged downtown area (the “Loop”). For example, United Airlines received USD 31 million to relocate to downtown Chicago, CNA received USD 13.7 million to renovate its headquarters, and Carbide and Carbon received USD 8.5 million to renovate the Hard Rock Hotel [57]. While not a TIF specifically, the outcry against and eventual rejection of New York City’s bid for Amazon’s H2Q suggest that public and professional opinion on the efficacy of government-subsidized mega-projects as a planning strategy may be shifting [58].
This brief literature review, covering the history and pros and cons of small-scale and incremental projects vs. mega-projects, tends to focus on individual cases, or cases of a similar sub-type, such as transportation infrastructure. My research proposes and then tests a methodology to analyze the urban fabric at a range of scales. My goal is to better understand scale change and how it might be measured and evaluated.
3. Methods
I evaluate scale at three levels in order to tease out different kinds of associations: (1) a historical site-level investigation of scale change over time; (2) a block-level quantitative look at the relationship between scale and block quality; and (3) a census tract analysis comparing scale and socio-economic characteristics. Each approach uses the same definition of scale—a physical condition of the urban environment assessed using building size and building size per block—but each level associates scale with a different set of variables (historical, block quality, socio-economics). This makes possible different interpretations of scale associations and outcomes. Below I discuss the data and methods for each level of analysis.
3.1. Historical Analysis
To better understand how mega-projects compare to the urban fabric they replaced, I first needed to select a sample of large-scale developments. I sought mixed-use, large format development projects completed after 1990, where land ownership had been consolidated. “Large format” was defined as projects involving more than USD 10 million in project costs, and where the size of the development is that of a standard city block or larger. These cut-offs ensured a large enough sample (31), but kept the number to a manageable size (since the labor-intensive analytical process involved manual tracing of building outlines). The majority of these sites were selected from the City of Chicago’s list of Tax Increment Financing Projects (TIF), which features both districts and site-specific projects receiving funding through TIF. The remaining sites were selected from Google Maps by visually scanning satellite imagery for larger developments and higher concentrations of retail/residential development, and from personal knowledge. Purely infrastructural projects, such as those solely concerning Chicago’s metro and rail systems, were excluded because they do not cover the living/working areas of the city. A few purely commercial projects, such as Englewood Square and Chinatown Square, were selected to ensure representation of contemporary developments in areas with relatively lower incomes and less recent private investment. In total, 31 sites were analyzed (Table 1). Images representative of the general character of these sites are provided in Figure 2, Figure 3 and Figure 4.
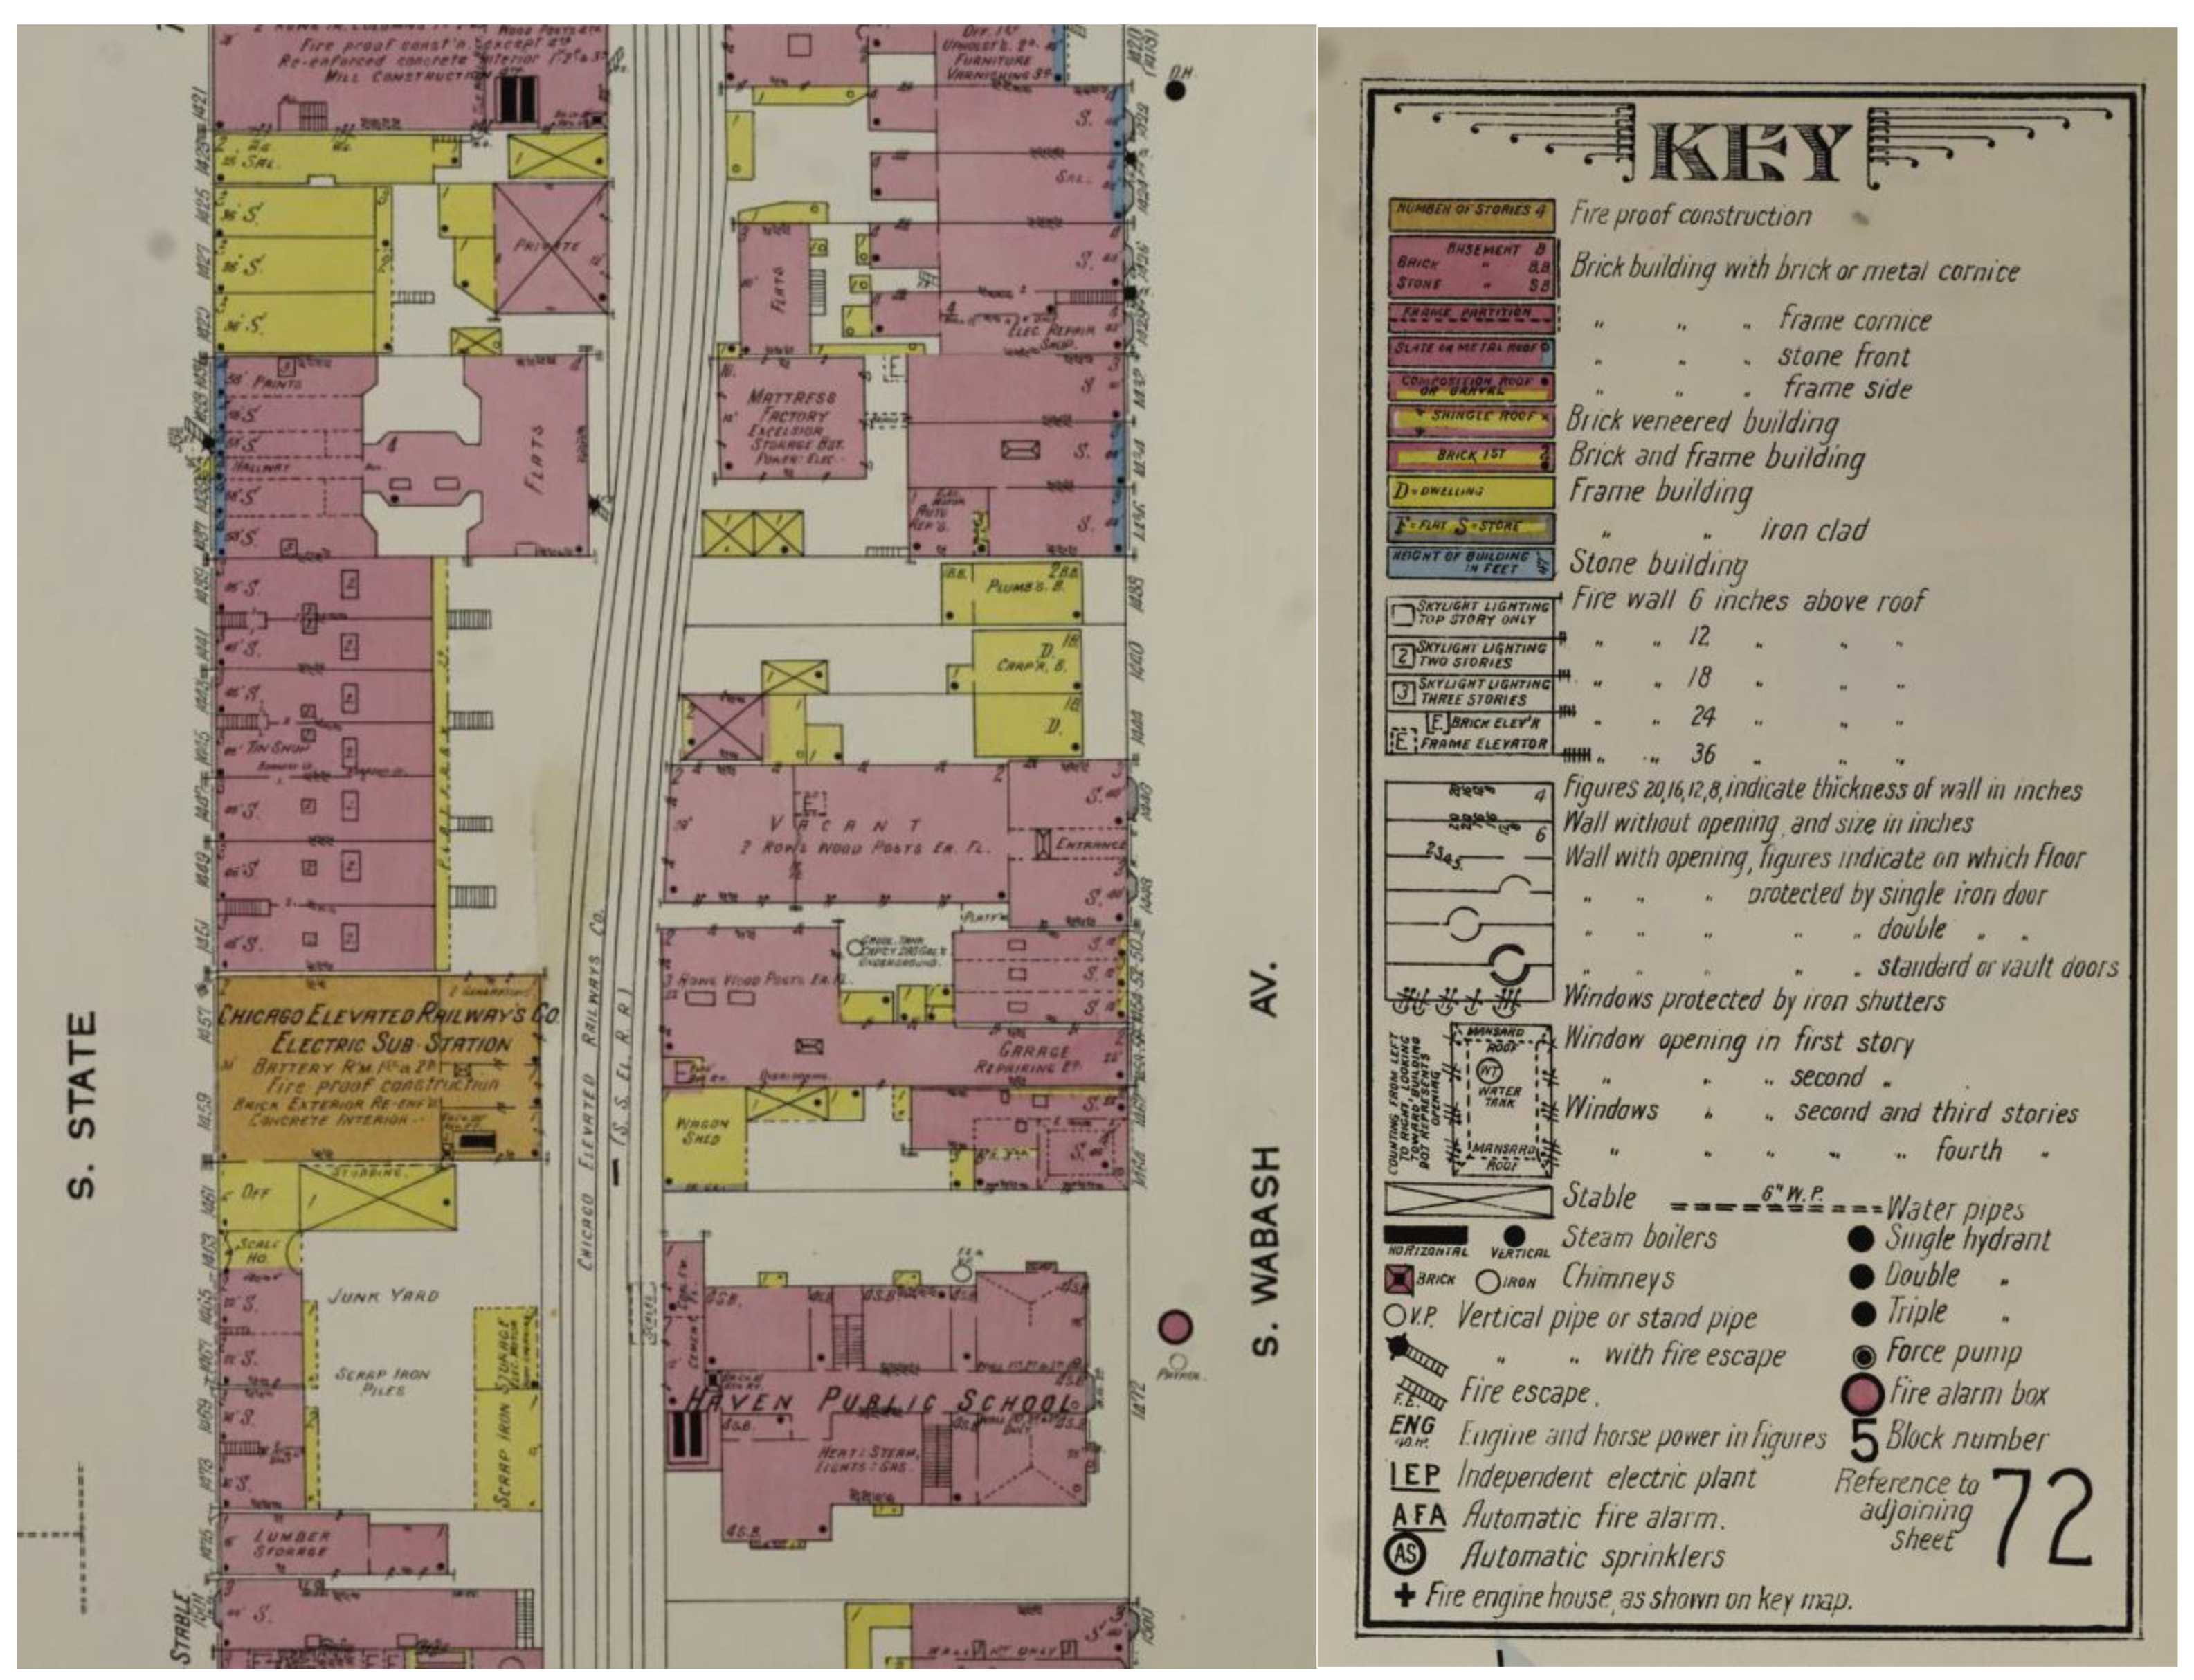
I measured both the historical and the contemporary scale of urbanism for my selected sites. For historical data, a team of student research assistants manually traced and entered building footprints and data for the 31 sites using fire insurance maps produced by the Sanborn Map Company, from 1906 to 1950. Sanborn maps provide information on building footprint, number of stories, and use (an example Sanborn map is shown in Figure 5). For greater Chicago the company mapped 60 volumes (Volumes 1 through 49 and Volumes A through K) between 1894 and 1951. As the volumes were completed successively and only periodically updated, they cannot provide a snapshot of the entire city in any given year. However, as many U.S. industrial cities such as Chicago reached their peak population in the 1950s followed by a near half-century of population decline and disinvestment before the recent revitalization, comparing urban fabric from 1900 to 1950 to fabric developed post-1990 captures scale change.
For contemporary building data, I obtained building footprints from the City of Chicago’s open data portal. Back buildings and garages (footprints under 500 square feet) were excluded from the analysis. Because many buildings were missing square footage and height, I estimated these variables in one of three ways: manually using Google Earth (for a smaller set—769—of large buildings), multiplying shape area calculation by number of stories, or extrapolating using census block group (BG) polygons and building counts.
3.2. Block-Level Analysis
To assess the relationship between scale and block quality, I first compared block quality (see below) for blocks in the 31 mega-developments (181 blocks) with blocks immediately surrounding (within one-half mile) of the 31 sites (6602 blocks), blocks with commercial uses (175,790 blocks), and all other blocks (219,950 blocks). I then categorized the scale of all blocks in the city, and then compared those measures to block quality using analysis of variance (ANOVA). A 5-category scale typology of buildings is summarized in Table 2: single-unit detached; 2 to 4 units; 5 units plus up to three stories; mid-rise/large-footprint; and high rise. The latter two categories are defined on the basis of building size and footprint rather than number of units, as they might be non-residential (e.g., office or commercial buildings, as the goal here is to capture scale as opposed to density). The typology was developed through a review of the literature as well as interviews with stakeholders (market and non-profit developers, as well as planners, architects, economists, and other scholars).
For the scale typology detached category, nearest neighbor distances were calculated for all shapefile footprints using the QGIS NNJoin plug-in. Buildings more than three feet from the nearest building were considered detached. The other categories were assigned to buildings using either City data for number of units or the combination of city supplied data and my own previously described calculated estimates for building stories and square footage. The scale typology number (1 to 5) was joined to a building points layer, and this was used to calculate the mean and median scale by block. The mean measure was determined to be a more accurate reflection of block scale. For example, in a block with two high-rise towers on the ends (categories 5s) and townhouses (category 2s) in between, a mean in the range of a 3 would better reflect both the perceptions of a pedestrian and the density of land use versus a median in the range of a 2 due to a greater number of townhouses versus towers on the block. Calculations were also made to determine the percentage of buildings at each scale per block.
For block quality, I developed an indicator, BlockScore. My measure is a variation of the index previously developed by Talen and Jeong [59] that uses Chicago business license data combined with amenities to quantitatively evaluate blocks based on four categories: daily life, mixed use, block character, and degrading factors. The BlockScore index adds together daily life, mixed use, and block character, and subtracts degrading factors. To summarize, each category is worth four points, giving the index a potential range from −4 to 12 (although the actual range was −4 to 6, as no block scored a perfect 12). For Daily Life, blocks receive one point for each “daily life” use they contain (such as a grocery store). To account for the size of blocks and the potential for a bias in scoring toward larger blocks, blocks were categorized by size and the amenity count was divided accordingly. To calculate Mixed Use, each block received one point if at least two uses in the Daily Life category were present along with another workplace use (such as office or hotel; thus my mixed-use dimension captures a more stringent concept of mix, involving employment and services as opposed to simply the mix of residential and commercial). Block Character was based on a combination of block size and the presence of historic buildings (by convention, pre-World War II era buildings, or those built before 1939). To calculate Degrading Factors, I measured factors that would diminish the pedestrian experience on the block, such as block length, vacant lots, or absence of a sidewalk. Figure 6 shows selected distributions of these scores. The figure shows that blocks with daily life uses are more common in the downtown and on the north side (which is wealthier and whiter), mixed-use blocks are more evenly distributed, and that blocks with a score of at least a “2” in terms of block character (which prioritizes smaller blocks) are more common and more evenly distributed.
3.3. Tract-Level Analysis
The scale typology used in the previous analysis is also correlated with tract-level census variables. The percentages of each scale in a tract are computed, along with mean building square footage. I then regress a selection of tract variables on these scales and building square footages, omitting the first scale to avoid multicollinearity. The dependent variables (census tract data) were selected on the basis of what might reasonably be connected to scale: population density, income level (median income and poverty rate), housing value (median value), housing tenure (percent renter-occupied), population migration (percent living in same house in previous year), social diversity (income diversity and unit type diversity), and unit age (percent built prior to 1940). The data are from 2010 and are from the Minnesota Population Center [60].
4. Results
4.1. Historical Analysis
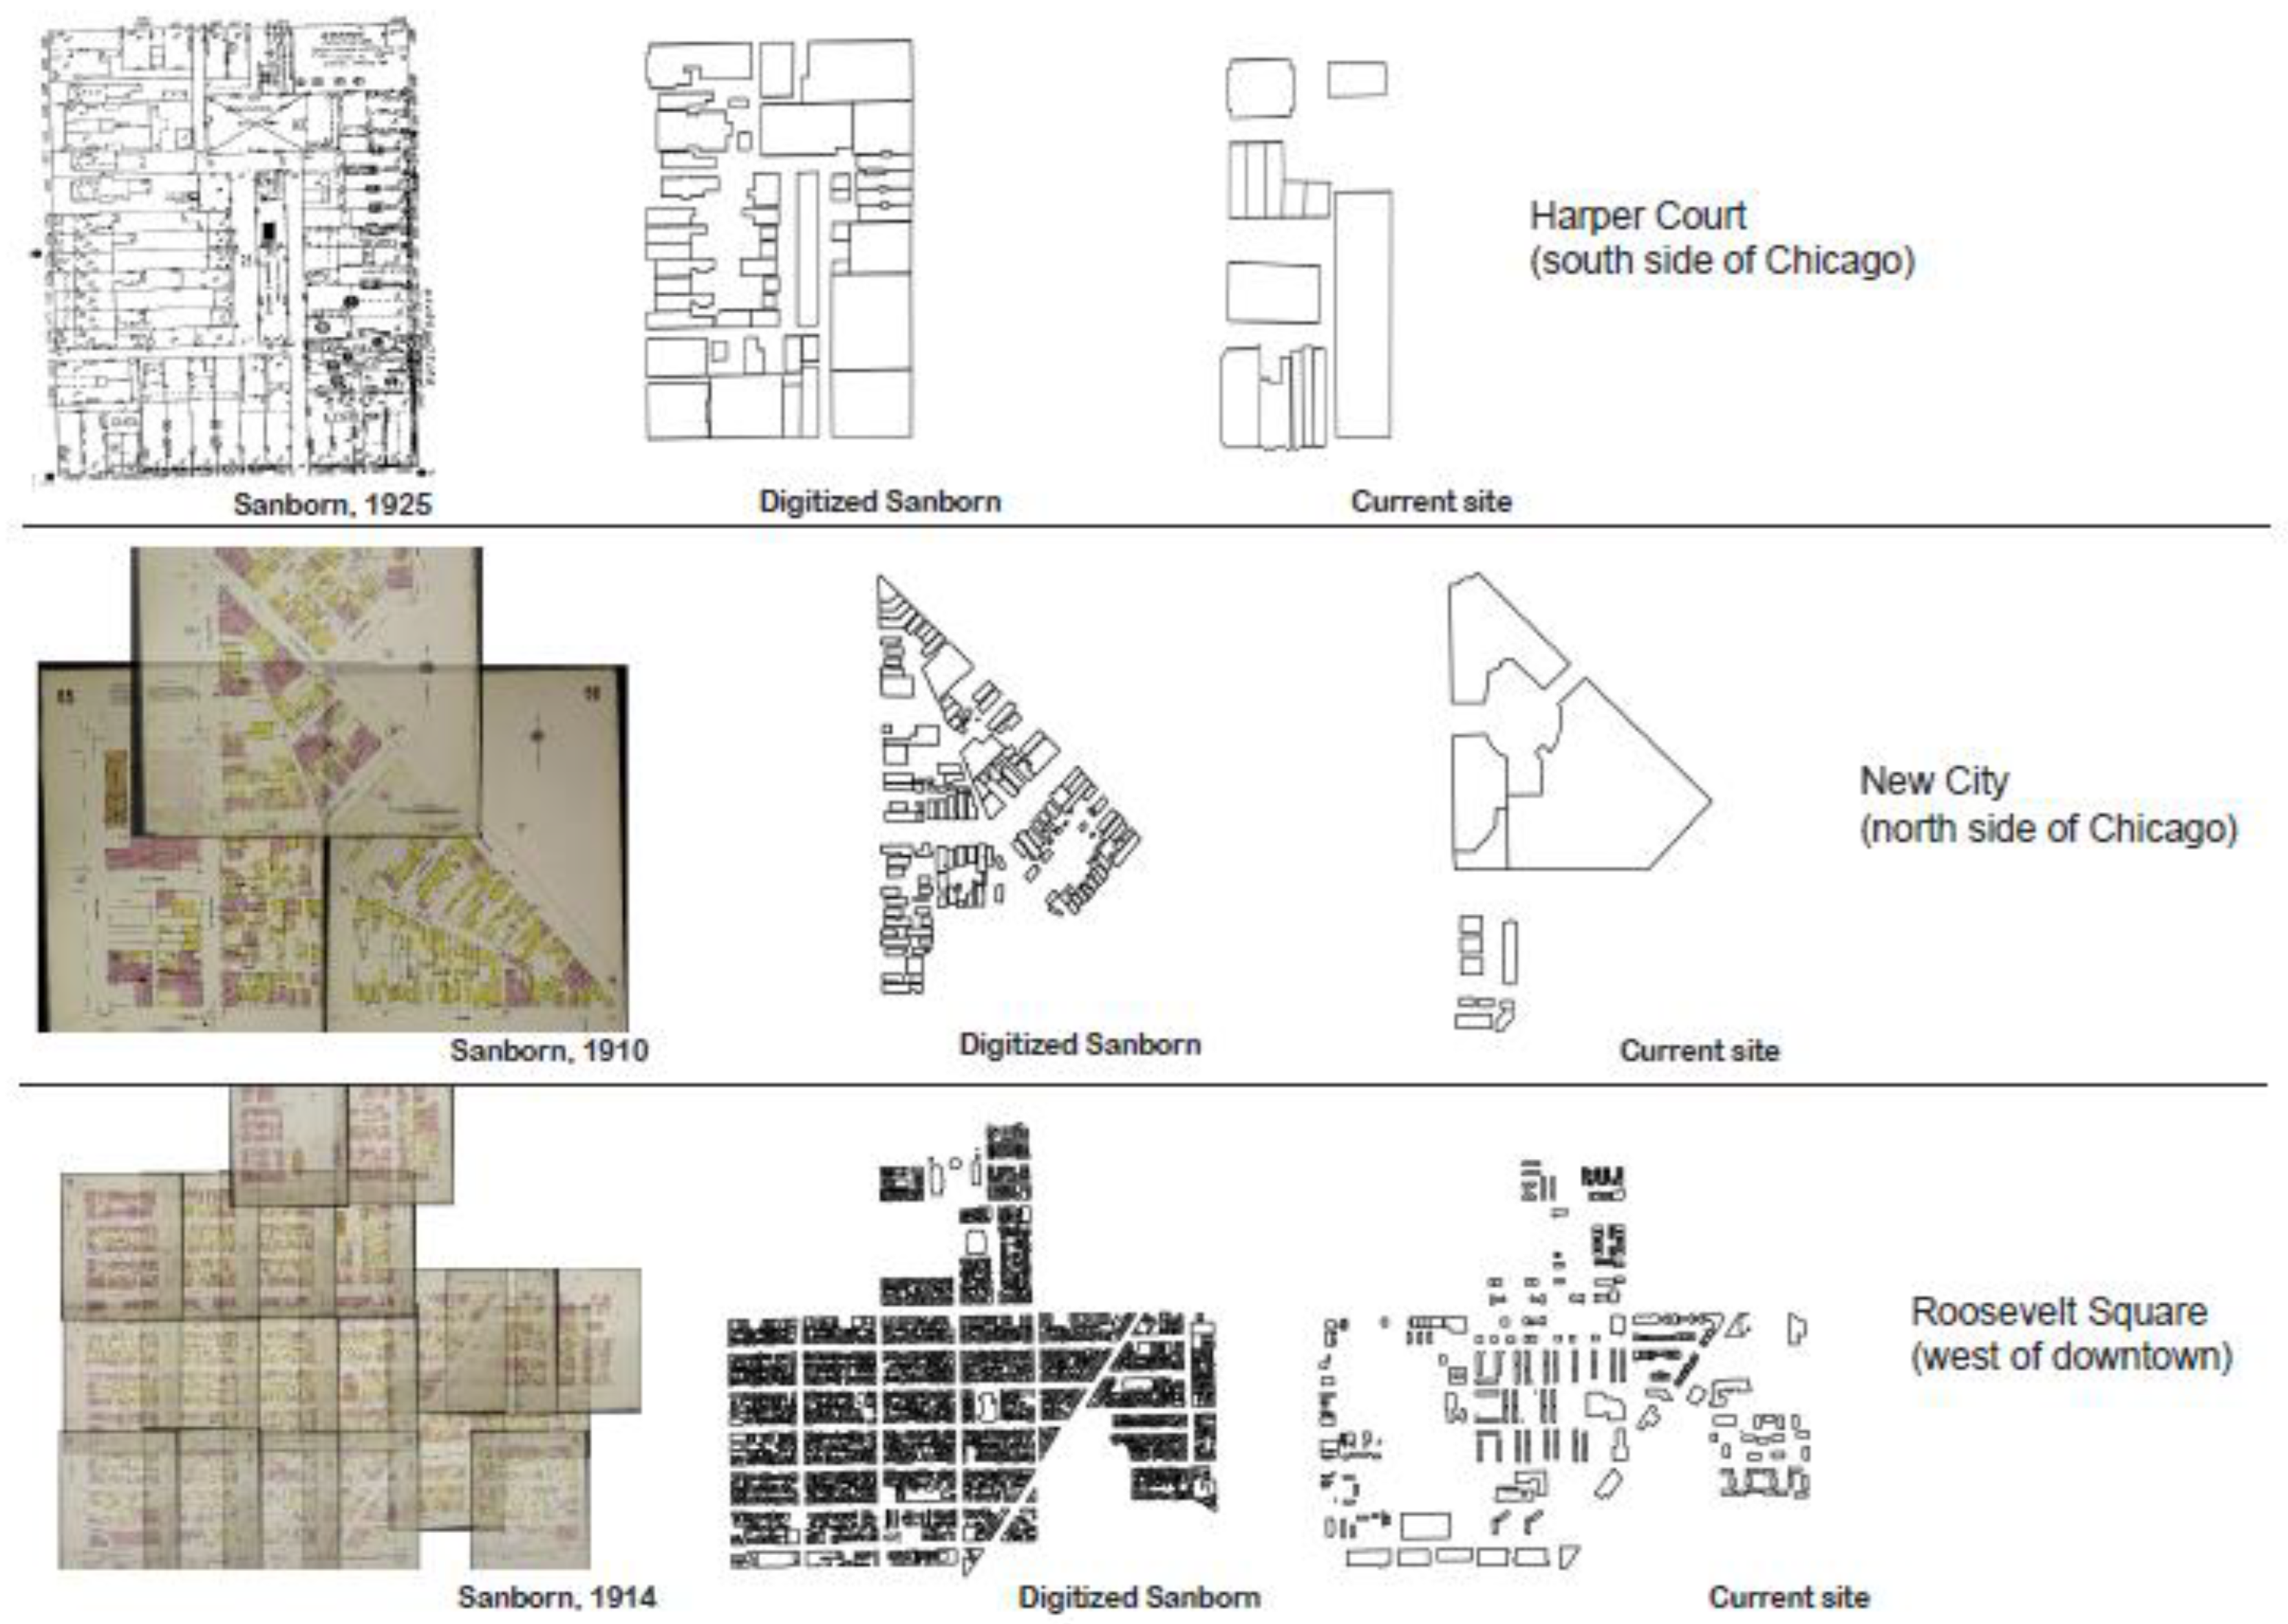
Figure 7 shows three comparisons between historical and contemporary urban scales for a selection of my 31 sites. As expected, the figures show a rather stark kind of urban change, from multiple small buildings (likely with many individual owners) to large footprint buildings under more consolidated ownership. The texture of urbanism is radically different. The smaller buildings likely created a street vibrancy as a result of diverse uses and façade treatments, and individually articulated building types with variation in heights (albeit all in small format). Smaller scale often correlates with a closer relationship between public and private space, with windows and doorways connected more directly to the public realm of the sidewalk. Although it is important not to sentimentalize the vitality that the maps and images of the older, smaller fabric suggest—as there was likely a higher degree of disorder, inequity, and possibly blight—it is difficult not to imagine a higher degree of vibrancy and life emanating from storefronts, residences, and small factories. Buildings, uses, and people shared a public realm that was closely integrated—or at least more so than what is suggested by the standard design and programming of many large-format buildings in the U.S.—by virtue of these smaller scales.
Table 3, Table 4 and Table 5 quantify these impressions. Table 3 is a comparison of the number of buildings and housing units and the average and total square footage of the historical urban fabric (“Sanborns”) and the current development pattern. There are almost five times as many buildings on the historical sites, which supports the impression that these areas likely contained a much more vibrant mix of people and activities. Average building square footage was much smaller, as expected; less than a tenth the size of the average building within the currently existing sites. The table also shows that the total square footage was much greater historically, almost 25 million square feet of building space on the Sanborns as opposed to 5.6 million in the current sites.
Interestingly, the number of housing units is similar comparing the two time periods, with the current sites showing slightly more housing units than Sanborns. Thus, the argument that large scale development is needed to increase the housing supply does not really hold—at least not using my sample of sites. Alternatively, given the extreme decrease in total square footage mentioned above, one could argue that the new developments writ large never attempted to increase the housing supply, despite the abundance of developable area. The current units are also contained in much fewer buildings and in the form of apartments. Table 4 quantifies this difference. The Sanborn sites were made up of buildings that were one or two stories, with only 19% in the 3–4 story range and only 1% above four stories. These units consisted of housing over stores, single-family houses, and small apartment buildings. The contemporary situation has most buildings in the 3–4 range, and 14% with more than 4 stories.
Table 5 gives details on the range and types of uses for the two time periods. Uses on the historic sites were much more varied. About 18% of the buildings had mixed uses within the same building, mostly a mix of commercial and residential. The large format sites are predominantly residential or commercial, with only 2% mixed use.
4.2. Block-Level Analysis
Figure 8 shows the spatial distribution of each scale type. Each map shows the percentage of buildings of a particular scale in a block. Scale 1 is capturing single-family housing and other detached, smaller buildings (under 5000 square feet), and the distribution is predictably in the outer suburban locations of Chicago. There is very little of this scale in the downtown (“Loop”) or inner ring of the city. The blocks with higher percentages of “missing middle” housing, scales 2 and 3, are quite even distributed throughout the city, although scale 2 buildings are slightly more prominent on the north side (which is wealthier and whiter). Scale 4 buildings are more clustered and scale 5 buildings are mostly confined to the downtown area. Thus scale, at least in Chicago, is following a somewhat predictable pattern for the low and high ends of the scale, but is variegated for the middle scales.
Table 6 compares scale and BlockScores for four groups: blocks with mega-developments, blocks immediately around them, blocks with commercial uses (excluding the first two sets of blocks), and all other blocks. Score percentages are not markedly different, although the BlockScore with the highest percentage for mega-development blocks is “0”, whereas for all other categories it is “1”.
Table 7 summarizes ANOVA regression results in which BlockScore and block scale are compared for the city as a whole—not just for my 31 mega-development sites. Each score dimension was converted to a dummy variable. For example, if a block had a minimum score of 1 for the “Mixed Use” dimension, it received a “1”; if a block had a minimum score of 1 for “Daily life uses,” it received a “1”, etc.
The results show that mixed use, degrading factors, and daily life uses share the same associations; all are positively associated with larger building scales (i.e., mean building square footage is higher). For the three dimensions, all scales are positively correlated except building scale 1. This is perhaps not a surprising result for daily life and mixed use, which by my stringent definition (for mixed use, a minimum of two daily life uses plus one other non-residential use on the block) is unlikely to be associated with small footprint buildings, most of which are single-family dwellings. What is more surprising is that daily life and mixed use are not the sole domain of large buildings but are also correlated with all scales except scale 1. Degrading factors are also higher for all building scales except scale 1.
One variation that the table shows is that block character is higher for scale 2 buildings—missing middle housing in the form of 2–4 unit structures, less than 4 stories. Overall, the higher the block character score the lower the mean building square footage, but this is not driven by scale 1 buildings—it is only associated with scale 2 buildings. High block character is significantly correlated with lower percent scale 1 and percent scale 3 buildings (the larger “missing middle” category). There was no association, higher or lower, with larger-scale buildings.
4.3. Tract-Level Analysis
Table 8 is a summary of tract-level regression results, where I regressed the mean building square footage and percent of each scale type (within a tract) on socio-economic variables. The table reports only significant results (p ≤ 0.001, and an R-square > 0.1). Population density has an inverse relationship with mean building square footage in a block, although it is positively associated with all scale percentages. This is a provocative finding, as it signals the importance of context and net density calculation at the tract level. It could signify that lower-scale buildings might actually have the same density level as larger-scale buildings, depending on site (tract) coverage. It also shows that scale 1 percentage (single family detached) is a strong predictor of density: when the regression is run with scale 1 included and one of the other scales omitted (to avoid multi-collinearity), mean building square footage and scale 1 are strongly and negatively associated, and all other scales lose significance.
Again scale 2—the lower end of missing middle housing—has some interesting associations. It is a significant variable in every case, and the only variable with significance for median housing value. Thus, buildings in the 2–4 unit range, or under 12,000 square feet, have a positive linear association with income, housing value, percent rental, unit type diversity, and percent older housing (building before 1939). The picture that emerges is that scale 2 with its dense, historic, unit diverse, and smaller scaled texture is also the scale that emerges as higher income and higher valued—the classic walkable, gentrified neighborhoods of Chicago’s north side.
The largest scale—scale 5—also has some interesting associations. Like scale 2, scale 5 has a positive linear association with density and median income, and a negative association with percent living in same house in previous year. However, unlike scale 2, the association with unit type diversity is negative, perhaps showing that larger-scale contexts tend to be more monolithic. In addition, unlike scale 2, there is no association with median value, percent rental, income diversity, or building age.
In sum, the first method (historical analysis) showed that small-scale urbanism had five times the amount of building square footage and a much higher percentage of buildings with mixed use, as compared to the current, larger building scale. The second method (block analysis) showed that small-scale urbanism is associated with higher pedestrian quality. The third method (tract analysis) showed that smaller-scale urbanism is associated with higher income, higher housing value, and unit type diversity, while the largest scale had a positive association with income but a negative association with unit type diversity.
5. Conclusions
Having a firm grasp of scale changes and their spatial variation provides an important part of my understanding of urban change and its impacts, positive and negative. In addition, understanding scale and how it changes may shed light on answering a number of questions, such as how scale impacts livability, pedestrian quality, access, affordability, or crime. In order to delve into these and other scale-related topics, urbanists need an approach to scale measurement and analysis.
This three-part analysis of historical progression, block scale and tract scale provided a way to visualize and quantify scale change in one large U.S. city. Quantified evaluation of scale is important for several reasons. First, although scale is an essential factor in urban development, current understanding of it is improvised at best. This study made an attempt to translate scale from ad hoc understanding to meaningful empirical research. Second, if planners are going to advocate for a particular side in the scale debates—and most city planners seem to be advocates of small-scale development—they need a more developed set of arguments about why a particular scale matters. This study provided empirical evidence that small-scale urbanism is capable of delivering quantified benefits: significantly more square footage, higher pedestrian quality, and higher unit type diversity. The association with higher income and higher housing value attests to its intrinsic desirability, but it also shows the need to ensure equitable access and to address the associated gentrification and displacement issues. Finally, by mapping and measuring scale changes over time, it is possible to provide a more detailed understanding of scale and how urban fabric has evolved, insights important to our understanding of urban place quality.
I am not able to conclude that the context of large-scale buildings is one of more degrading factors than small-scale buildings. Nor do large-scale buildings have lower levels of mixed use or daily life uses compared to small-scale buildings. I was, however, able to show that scale 2 buildings—missing middle housing in 2–4 unit structures, with buildings under 12,000 square feet and under 4 stories—are associated with higher block character than other scales. This may have to do with the relatively historic quality of many scale 2 buildings and my inclusion of historic buildings as a variable in calculating block character. Had I conducted this analysis in a city with more historical four, six, or nine story buildings, I may have found different results.
Also of note are the dramatic differences in total square footage between the historic and redeveloped city. Of the 31 redeveloped sites examined, total square footage shrank by over three-quarters, mixed uses declined from almost 20 to down to 2%, while the number of residential units stayed relatively the same. While my buildings have gotten larger, they now provide significantly less interior space for social and economic activity. Could that former space have been put to better use as either affordable social housing or small-scale industrial, institutional, or commercial uses? These findings suggest ample room for urbanists to push for the inclusion of more mixed uses and affordable housing in development projects receiving government subsidies.
Several limitations in my method need to be acknowledged. First, the inclusion of just 31 historical sites was somewhat opportunistic and necessarily selective, so generalizations about scale change for the city as a whole, or for other cities in the U.S., is limited. Second, the scale typology and block score calculations included judgement calls about cut-off points, variables to include or exclude, and estimations needed to fill in for missing data (e.g., estimation was needed for some building height calculations). This kind of variability introduces the possibility that different kinds of measures and variables would yield different outcomes, signaling the need for a sensitivity analysis. It is also important to acknowledge that other variables important for gauging pedestrian quality were not included, such as street frontage continuity and sidewalk-facing entrances. This was only one approach to analyzing scale, selected because of the quantitative nature of the study. Other methods are needed to gauge scale in ways that better capture its relation to urban space quality, access, forms of movement, and modes of travel.
It is also important to realize that more recent mega-developments than the ones I surveyed might be more sensitive to design problems. This brings up the question of whether certain issues I’ve uncovered have more to do with design than scale, meaning that a better design—rather than a smaller scale—might be capable of resolving some issues. It may be true that my results indicating an association between large-scale projects and reduced pedestrian quality are specific to certain eras (pre-2000) and places (rust-belt cities like Chicago). Megaprojects in cities like Washington, DC, especially those built since the 2000s, often have no surface parking, plenty of underground parking, and connections to transit—all of which is likely to resolve some of the quality-related liabilities. In addition, design regulations in places like Vancouver, BC have successfully recreated the more integrative connections between building frontage and sidewalk that smaller scales traditionally accomplished.
These are open questions. However, as tensions exist between proponents of small vs. large scale urban development, additional research is needed to examine the role scale might play in promoting sustainability, livability, affordability, and social diversity. What is the relationship between scale and community cohesion, support for small business, and neighborhood investment? A better awareness of these phenomena and relationships would help residents, designers, and policymakers understand the impact of proposed scale changes.
Incremental urbanism is distinguished by being in direct opposition to top–down, capital intensive, and bureaucratically sanctioned urban change of the kind most often associated with urban planning. There is a need to understand the impact of scale associated with these kinds of investment strategies—an evaluation that goes beyond economic calculation.
Funding
This research received no external funding.
Data Availability Statement
Data sharing is not applicable to this article.
Conflicts of Interest
The author declares no conflict of interest.
References
- Roseland, M. Eco-City Dimensions: Healthy Communities, Healthy Planet; New Society Publishers: Gabriola Island, BC, Canada, 1997. [Google Scholar]
- Arefi, M.; Kickert, C. (Eds.) The Palgrave Handbook of Bottom-Up Urbanism; Palgrave: Cham, Switzerland, 2019. [Google Scholar]
- Jacobs, J. The Death and Life of Great American Cities; Vintage: New York, NY, USA, 1961. [Google Scholar]
- Heid, J. Building Small: A Toolkit for Real Estate Entrepreneurs, Civic Leaders, and Great Communities; Urban Land Institute: Washington, DC, USA, 2021. [Google Scholar]
- Dittmar, H. DIY City: The Collective Power of Small Actions; Island Press: Washington, DC, USA, 2020. [Google Scholar]
- Montgomery, C. Happy City: Transforming Our Lives Through Urban Design; Farrar, Straus and Giroux: New York, NY, USA, 2013. [Google Scholar]
- Kostof, S. The City Shaped; Thames & Hudson, Ltd.: London, UK, 1991. [Google Scholar]
- Warner, S.B.; Whittemore, A. American Urban Form: A Representative History; The MIT Press: Cambridge, MA, USA, 2013. [Google Scholar]
- Hunter, C. Ranches, Rowhouses & Railroad Flats: American Homes: How They Shape my Landscapes and Neighborhoods; W.W. Norton: New York, NY, USA, 1999. [Google Scholar]
- Scheer, B.C. The Evolution of Urban Form: Typology for Planners and Architects; Planners Press: Chicago, IL, USA, 2010. [Google Scholar]
- Burnham, D.H.; Bennett, E.H. Plan of Chicago; Commercial Club of Chicago: Chicago, IL, USA, 1909. [Google Scholar]
- Mumford, E. The CIAM Discourse on Urbanism, 1928–1960; MIT Press: Cambridge, MA, USA, 2000. [Google Scholar]
- Schumacher, E.F. Small is Beautiful; Harper Collins: New York, NY, USA, 1973. [Google Scholar]
- Turner, J.; Wakely, P. Fifty Years of the Community-Led Incremental Development: Paradigm for Urban Housing and Place-Making. In Ground Rules in Humanitarian Design; Min Soo Chun, A., Brisson, I.E., Eds.; Wiley: Hoboken, NJ, USA, 2015; pp. 36–55. [Google Scholar] [CrossRef]
- Gratz, R.B. The Living City: How America’s Cities are Being Revitalized by Thinking Small in a Big Way; Simon and Schuster: New York, NY, USA, 1989. [Google Scholar]
- Moe, R.; Wilkie, C. Changing Places: Rebuilding Community in the Age of Sprawl; Henry Holt & Co: New York, NY, USA, 1997. [Google Scholar]
- Wegmann, J. Death to Single-Family Zoning…and New Life to the Missing Middle. J. Am. Plan. Assoc. 2020, 86, 113–119. [Google Scholar] [CrossRef]
- Manville, M.; Monkkonen, P.; Lens, M. It’s Time to End Single-Family Zoning. J. Am. Plan. Assoc. 2020, 86, 106–112. [Google Scholar] [CrossRef]
- Moudon, A.V. Built for Change: Neighbourhood Architecture in San Francisco; MIT Press: Cambridge, MA, USA, 1985. [Google Scholar]
- Alexander, C.; Ishikawa, S.; Silverstein, M.; Jacobson, M.; Fiksdahl-King, I.; Angel, S. A Pattern Language; Oxford University Press: New York, NY, USA, 1977. [Google Scholar]
- Lynch, K. Good City Form; MIT Press: Cambridge, MA, USA, 1981. [Google Scholar]
- Gehl, J. Life between Buildings: Using Public Space; Van Nostrand Reinhold: New York, NY, USA, 1987. [Google Scholar]
- Talen, E. New Urbanism and America Planning: The Conflict of Cultures; Routledge: London, UK, 2005. [Google Scholar]
- Florida, R. The Rise of the Creative Class—Revisited, 2nd ed.; Basic Books: New York, NY, USA, 2012. [Google Scholar]
- Glaeser, E. The Triumph of the City: How My Greatest Invention Makes Us Richer, Smarter, Greener, Healthier, and Happier; Penguin Books: New York, NY, USA, 2011. [Google Scholar]
- Ehrenhalt, A. The Great Inversion and the Future of the American City; Knopf Doubleday Publishing Group: New York, NY, USA, 2012. [Google Scholar]
- Gallagher, L. The End of the Suburbs; Portfolio/Penguin: New York, NY, USA, 2013. [Google Scholar]
- Carr, J.H.; Servon, L.J. Vernacular Culture and Urban Economic Development: Thinking Outside the (Big) Box. J. Am. Plan. Assoc. 2008, 75, 28–40. [Google Scholar] [CrossRef]
- Beasley, L. Vancouverism; UBC Press: Vancouver, BC, Canada, 2020. [Google Scholar]
- Stein, S. Capital City: Gentrification and the Real Estate State; Verso: Brooklyn, NY, USA, 2019. [Google Scholar]
- Khafagy, A. A Growing Movement Takes on the Mega-Development. Bloomberg Com. CityLab. 2020. Available online: https://www.bloomberg.com/news/articles/2020-08-21/amazon-hq-opponents-shift-focus-to-sunnyside-yard (accessed on 21 August 2020).
- Fainstein, S.S. Mega-Projects in New York, London and Amsterdam. Int. J. Urb. Reg. Res. 2008, 32, 768–785. [Google Scholar] [CrossRef]
- Flyvbjerg, B. What You Should Know about Megaprojects and Why: An Overview. Proj. Manag. J. 2014, 45, 6–19. [Google Scholar] [CrossRef]
- Flyvbjerg, B. Introduction: The Iron Law of Megaproject Management. In The Oxford Handbook of Megaproject Management; Flyvbjerg, B., Ed.; Oxford University Press: Oxford, UK, 2017; pp. 1–20. [Google Scholar]
- Flyvbjerg, B.; Bruzelius, N.; Rothengatter, W. Megaprojects and Risk: An Anatomy of Ambition; Cambridge University Press: Cambridge, UK, 2003. [Google Scholar]
- Lehrer, U.; Laidley, J. Old Mega-Projects Newly Packaged? Waterfront Redevelopment in Toronto. Int. J. Urb. Reg. Res. 2008, 32, 786–803. [Google Scholar] [CrossRef]
- Jones, G.A.; Moreno-Carranco, M. Megaprojects. City 2007, 11, 144–164. [Google Scholar] [CrossRef][Green Version]
- Orueta, F.D.; Fainstein, S.S. The New Mega-Projects: Genesis and Impacts. Int. J. Urb. Reg. Res. 2008, 32, 759–767. [Google Scholar] [CrossRef]
- Hillier, B.; Hanson, J. The Social Logic of Space; Cambridge University Press: Cambridge, UK, 1984. [Google Scholar]
- Busquets, J. Barcelona: The Urban Evolution of a Compact City; ORO Editions: New York, NY, USA, 2014. [Google Scholar]
- Moreno, C.; Allam, Z.; Chabaud, D.; Gall, C.; Pratlong, F. Introducing the “15-Minute City”: Sustainability, resilience and place identity in future post-pandemic cities. Smart Cities 2021, 4, 93–111. [Google Scholar] [CrossRef]
- Huiders, E. Amsterdam: A Metropolitan Village; Lannoo Publishers: Tielt, Belgium, 2013. [Google Scholar]
- Gehl, J. Cities for People; Island Press: Washington, DC, USA, 2010. [Google Scholar]
- Finn, D. DIY urbanism: Implications for cities. J. Urb. Int. Res. Place. Urb. Sus. 2014, 7, 381–398. [Google Scholar] [CrossRef]
- Parolek, D. Missing Middle Housing: Thinking Big and Building Small to Respond to Today’s Housing Crisis; Island Press: Washington, DC, USA, 2020. [Google Scholar]
- Preuss, I. Recast Your City: How to Save Your Downtown with Small-Scale Manufacturing; Island Press: Washington, DC, USA, 2021. [Google Scholar]
- Hatuka, T.; Ben-Joseph, E. Industrial Urbanism: Typologies, Concepts and Prospects. Built Environ. 2017, 43, 10–24. [Google Scholar] [CrossRef]
- Fitzgerald, M.A.; Muske, G. Family Businesses and Community Development: The Role of Small Business Owners and Entrepreneurs. Commun. Dev. 2016, 47, 412–430. [Google Scholar] [CrossRef]
- Imbroscio, D. Rethinking Exclusionary Zoning or: How I Stopped Worrying and Learned to Love It. Urb. Aff. Rev. 2021, 57, 214–251. [Google Scholar] [CrossRef]
- Goetz, E.G. Democracy, Exclusion, and White Supremacy: How Should We Think About Exclusionary Zoning? Urb. Aff. Rev. 2021, 57, 269–283. [Google Scholar] [CrossRef]
- Mould, O. Tactical Urbanism: The New Vernacular of the Creative City. Geog. Comp. 2014, 8, 529–539. [Google Scholar] [CrossRef]
- Douglas, G.C. The formalities of informal improvement: Technical and scholarly knowledge at work in do-it-yourself urban design. J. Urb. Int. Res. Place. Urb. Sus. 2016, 9, 117–134. [Google Scholar] [CrossRef]
- Robbins, G. A New Agenda for Public Housing. City 2020, 24, 85–96. [Google Scholar] [CrossRef]
- Tsenkova, S. Affordable Housing and the Future of Cities. In Cities and Affordable Housing: Planning, Design and Policy Nexus; Tsenkova, S., Ed.; Routledge: New York, NY, USA, 2021; pp. 1–12. [Google Scholar]
- Vale, L.J. After the Projects: Public Housing Redevelopment and the Governance of the Poorest Americans; Oxford University Press: New York, NY, USA, 2018. [Google Scholar]
- Weber, R. Selling City Futures: The Financialization of Urban Redevelopment Policy. Econ. Geog. 2010, 86, 251–274. [Google Scholar] [CrossRef]
- Velez, J.-P. TIF Aided Public and Private Projects Almost Evenly, Analysis Shows. The New York Times. 6 August 2011. Available online: https://www.nytimes.com/2011/08/07/us/07cnctif.html?unlocked_article_code=lNq1fl_HCOL0QmqbQ2qur5uk2ydPDGYtB3qWhrRG2pjLG9XklGJZCKXQyMqlN5OAhTagyZed6LGQInqUuQsm29rFWecWElOaCCHyDBshFMKnY8gIsCp6p0vMfg3E2pRD48NlLleFLeWj-Js6cQezKDa_D9t1RWGBpRtSgJkyAZEHrVLGArHCN8YLuJ4pHyV9I0yMZFV5so6T4LfDriKRqRxbkN-wRDFtkVSmWlbfvgkuxipUkmwk7_m5K4rMML23n-PbiW2eUJtP9dXmNkx49PEmcfy20zevDZFpv_M3Ui_9LjfKClSXrU5DdsYd&smid=url-share (accessed on 6 August 2011).
- Gupta, P.S. The fleeting, unhappy affair of Amazon HQ2 and New York City. Trans. Leg. Theo. 2019, 10, 97–122. [Google Scholar] [CrossRef]
- Talen, E.; Jeong, H. What Is the Value of ‘Main Street’? Framing and Testing the Arguments. Cities 2019, 92, 208–218. [Google Scholar] [CrossRef]
- Manson, S.; Schroeder, J.; Van Riper, D.; Kugler, T.; Ruggles, S. IPUMS National Historical Geographic Information System: Version 15.0 [dataset]; IPUMS: Minneapolis, MN, USA, 2020. [Google Scholar] [CrossRef]
Figure 1.
Scale Change in the Urban Renewal Period. Mid-twentieth century urban renewal programs resulted in significant changes in scale. Above is an example from Newark, NJ, USA, c. 1950 and 1969. The bottom photograph replaced the upper one as part of Newark’s urban renewal program.
Figure 1.
Scale Change in the Urban Renewal Period. Mid-twentieth century urban renewal programs resulted in significant changes in scale. Above is an example from Newark, NJ, USA, c. 1950 and 1969. The bottom photograph replaced the upper one as part of Newark’s urban renewal program.

Figure 2.
Wilson Yard, Chicago.

Figure 3.
Harper Court, Chicago.

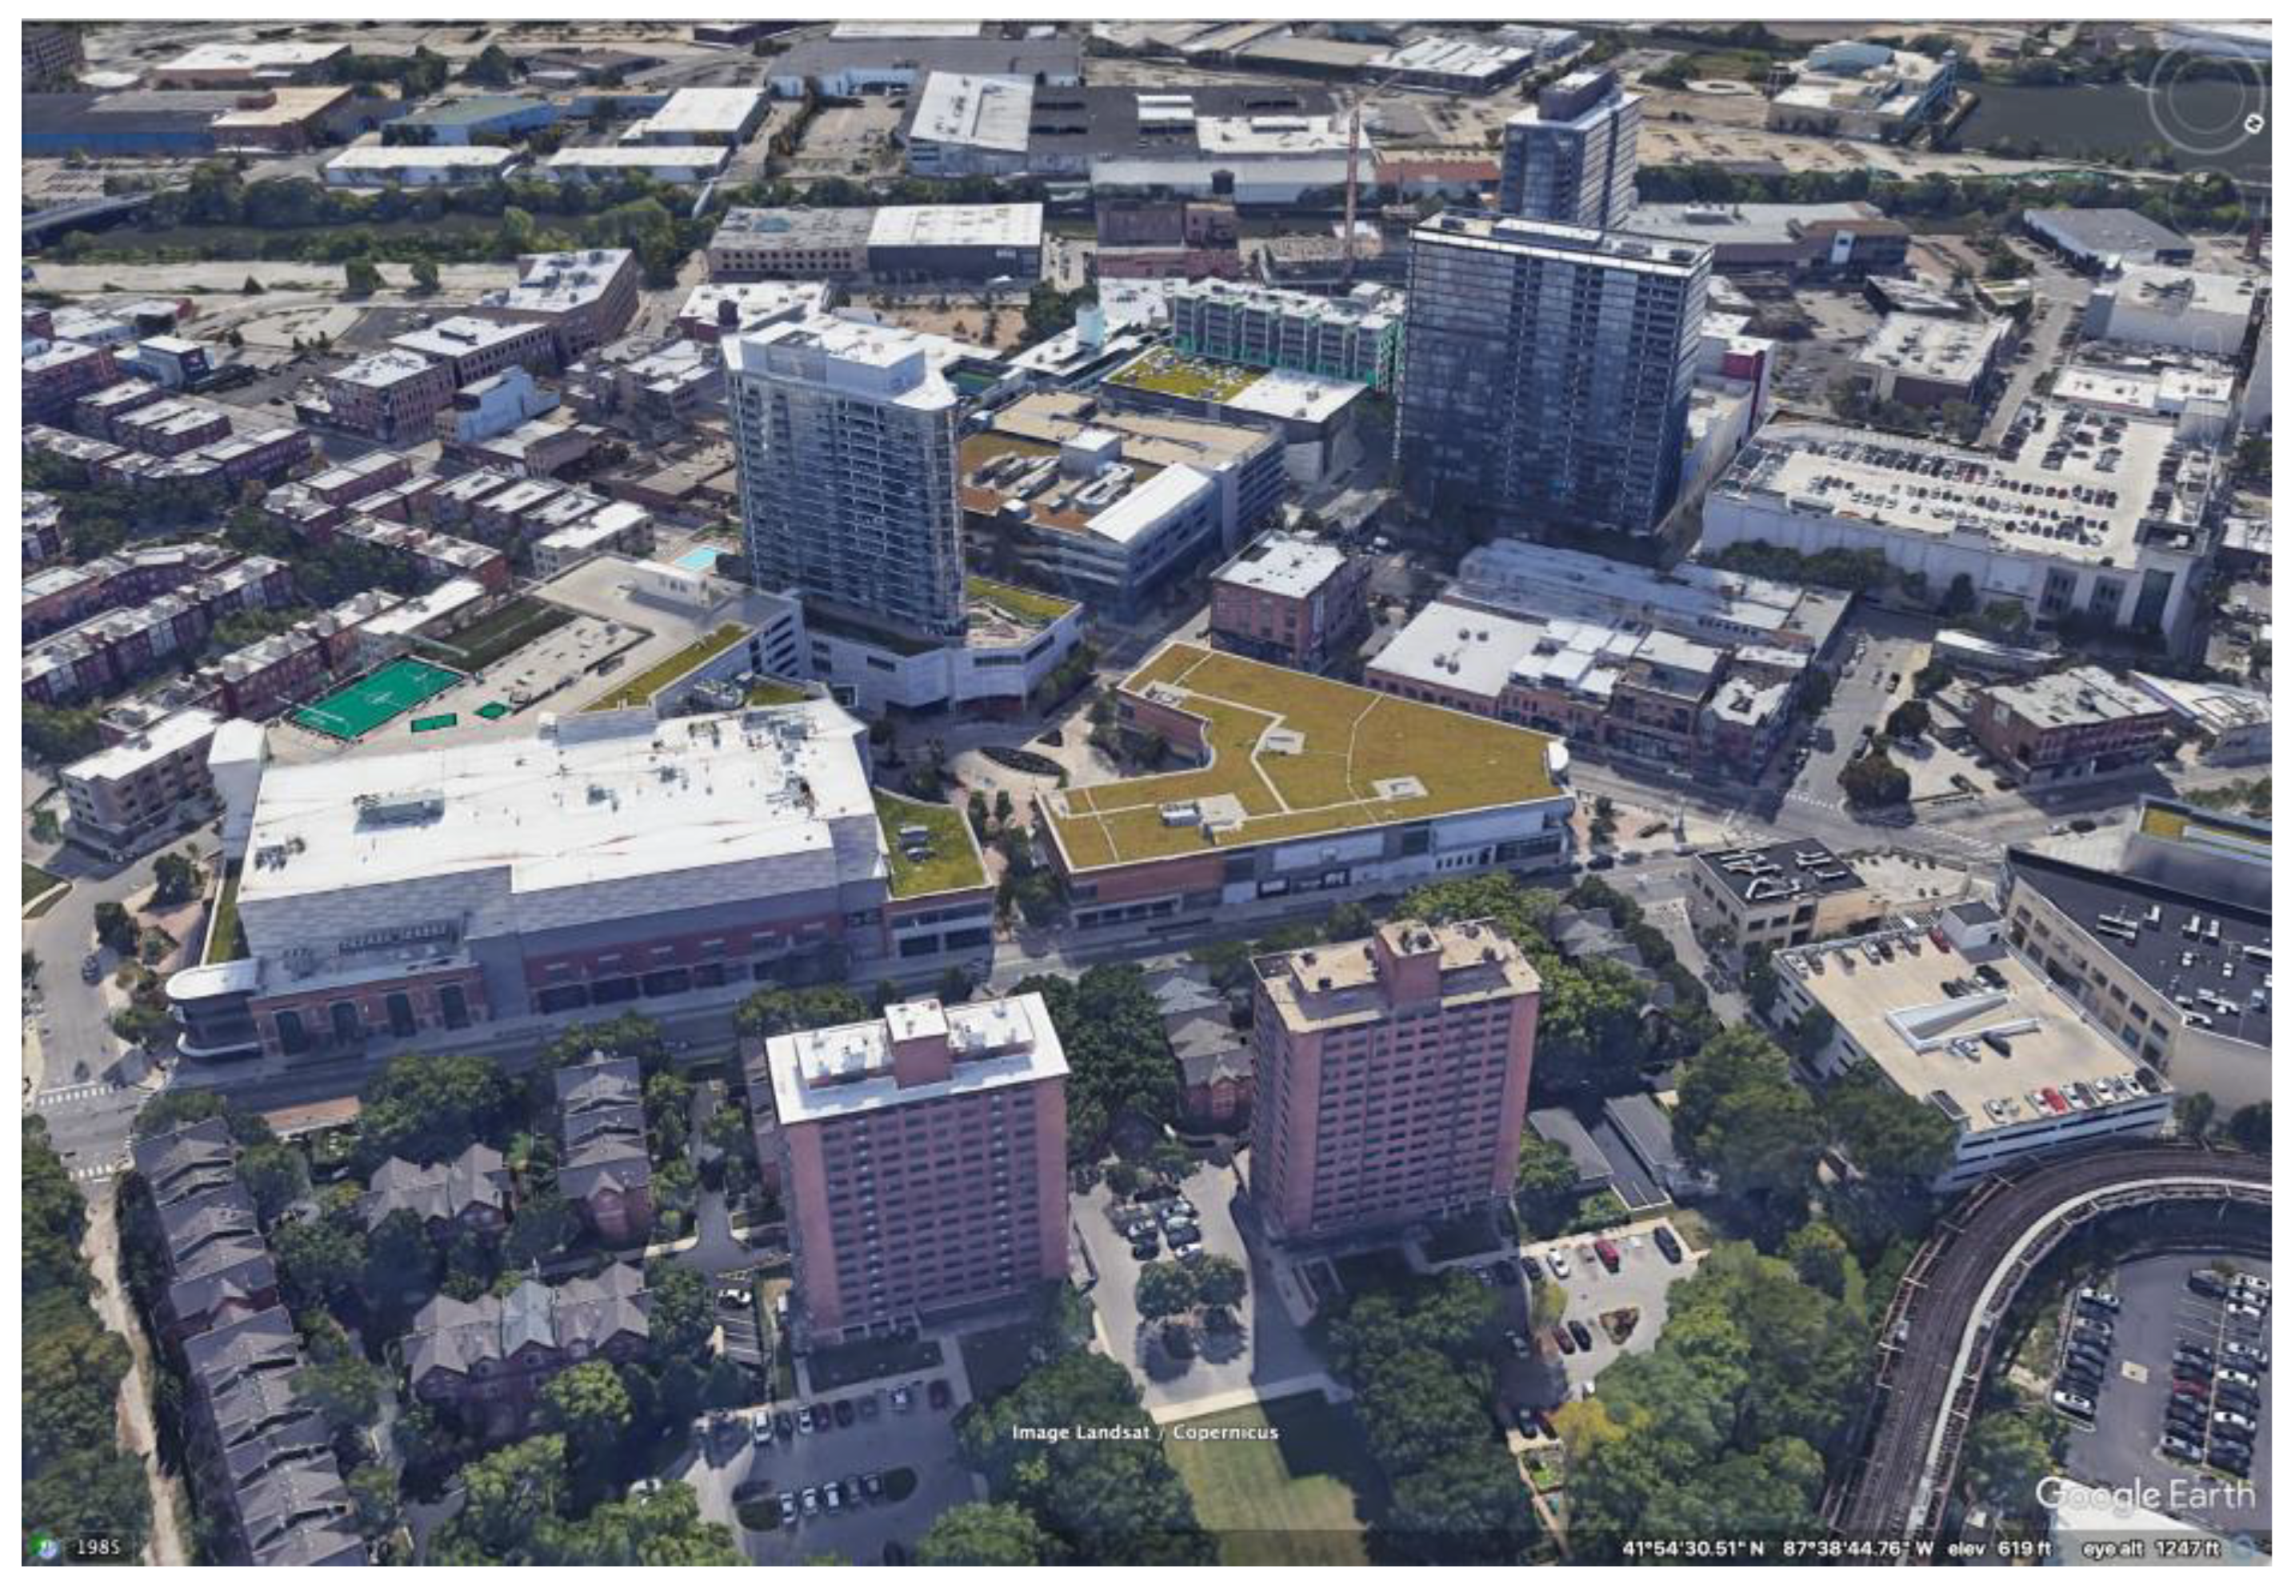
Figure 4.
New City, Chicago.

Figure 5.
Sample Sanborn map and key, 1914.

Figure 6.
Distribution of selected dimensions of BlockScore.

Figure 7.
Historic scale vs. current scale: three examples.

Figure 8.
Spatial distribution of building scale in Chicago.


Table 1.
List of redevelopment sites, Chicago.
| Name of Site | Year Built | Total Project Costs (in Millions USD) | TIF (in Millions USD) | Sanborn Year | |
|---|---|---|---|---|---|
| 1 | Chinatown Square | 1993 | 31 | 7 | 1911 |
| 2 | Lincoln-Belmont-Ashland, LLC. | 1994 | 37 | 8 | 1923 |
| 3 | 201 N. Wells Street | 2000 | 41 | 7 | 1906 |
| 4 | 950 W. Monroe | 2005 | 35 | 3 | 1917 |
| 5 | Florsheim-Footwear Factory | 2006 | 56 | 9 | 1921 |
| 6 | Sauganash Place | 2007 | 64 | 10 | 1925 |
| 7 | Hollywood House Apartment | 2010 | 33 | 10 | 1928 |
| 8 | Green Exchange | 2010 | 53 | 9 | 1921 |
| 9 | Chicago/Kingsbury | 2010 | 287 | 33 | 1906 |
| 10 | Wilson Yard | 2011 | 163 | 54 | 1905 |
| 11 | Howard/Paulina | 2012 | 73 | 8 | 1937 |
| 12 | Randolph Tower–II | 2012 | 145 | 34 | 1906 |
| 13 | Zapata Apartments | 2013 | 25 | 4.61 | 1921 |
| 14 | Harper Court [LLT2] | 2013 | 112 | 20 | 1925 |
| 15 | Shops and Lofts at 47 | 2014 | 46 | 13 | 1925 |
| 16 | Clybourn and Division | 2015 | 38 | 8 | 1925 |
| 17 | Englewood Square | 2016 | 12 | 12 | 1926 |
| 18 | City Hyde Park | 2016 | 113 | 11 | 1925 |
| 19 | Eight Eleven Uptown | 2016 | 125 | 16 | 1905 |
| 20 | Rosenwald Courts | 2016 | 134 | 25 | 1925 |
| 21 | New City | 2016 | 275 | * | 1910 |
| 22 | Central Station | 2017 | 122 | 14 | 1911 |
| 23 | The Sinclair | 2017 | 200 | * | 1910 |
| 24 | Kleo Art Residences | 2019 | 23.33 | 6.35 | 1925 |
| 25 | 45th Cottage Grove Phase 1 | 2019 | 37 | 7 | 1925 |
| 26 | Lakeshore East | 2019 | 4000 | * | 1906 |
| 27 | Lincoln Common | 2019 | 20 | * | 1910 |
| 28 | Roosevelt Square | on-going | 962 | 53 | 1914, 1917 |
| 29 | Lincoln Yards | Under const. | 6000 | 490 | 1914 |
| 30 | the 78 | Under const. | 7000 | 551 | 1911 |
| 31 | River District | Under const. | * | * | 1906, 1916 |
* Data unavailable.
Table 2.
Building typology.
| Scale | Description | # Buildings |
|---|---|---|
| 1–Detached | >3 ft apart or single-unit and under 5000 SqFt | 298,936 |
| 2–Missing middle A | ≤3 ft apart or 2–4 units or under 12,000 SqFt (see Fourplex) and ≤3 Stories | 158,956 |
| 3–Missing middle B | 5–24 units or between 12,000 and 100,000 SqFt and ≤3 Stories | 24,525 |
| 4–Mid-rise/large footprint | 4–7 Stories; or <4 Stories and >100,000 SqFt | 5886 |
| 5–Hi-rise | 8+ Stories | 2547 |
Note: total buildings = 490,850 (excludes back buildings, i.e., buildings less than 500 sq. ft.).
Table 3.
Site comparisons.
| # Bldgs | Avg. bldg. sq. ft. | Total sq. ft. | Housing Units | ||||
|---|---|---|---|---|---|---|---|
| Sanborns | Current | Sanborns | Current | Sanborns | Current | Sanborns | Current |
| 5523 | 1078 | 4501 | 52,200 | 24,857,366 | 56,271,262 | 6326 | 6986 |
Table 4.
Building height comparison.
| Historical | % of Total | Current * | % of Total | |
|---|---|---|---|---|
| 1 story | 2091 | 38% | 121 | 11% |
| >1 or 2 stories | 2331 | 42% | 282 | 26% |
| 3 or 4 stories | 1042 | 19% | 529 | 49% |
| More than 4 stories * | 59 | 1% | 146 | 14% |
| Total | 5523 | 1078 |
* For current, there are 95 buildings with 5–9 stories, and 51 buildings with 10+ stories.
Table 5.
Use comparison.
| Historical | % of Total | Current * | % of Total | |
|---|---|---|---|---|
| Residential | 2248 | 41% | 757 | 59% |
| Commercial | 247 | 4% | 312 | 24% |
| Industrial | 303 | 6% | 29 | 2% |
| Institutional | 51 | 1% | 0 | - |
| Mixed Commercial-Residential | 877 | 16% | 24 | 2% |
| Mixed Commercial-Industrial | 59 | 1% | 0 | - |
| Mixed Industrial Residential | 31 | 0.6% | 0 | - |
| Mixed Commercial-Industrial-Residential | 14 | 0.25% | 0 | - |
| Other/Unclassified | 1693 | 30% | 157 | 12% |
| Total | 5523 | 1279 |
* Uses are obtained from their associated parcels; some buildings are associated with more than one parcel.
Table 6.
BlockScores and block type.
| BlockScore | Mega-Developments | Blocks Surrounding Mega-Developments | Commercial Blocks | All Other Blocks |
|---|---|---|---|---|
| −4 | 0% | 0% | 0% | 0% |
| −3 | 0% | 0% | 0% | 0% |
| −2 | 6% | 3% | 3% | 2% |
| −1 | 19% | 22% | 16% | 17% |
| 0 | 31% | 23% | 29% | 28% |
| 1 | 27% | 29% | 36% | 39% |
| 2 | 12% | 18% | 14% | 13% |
| 3 | 4% | 4% | 2% | 1% |
| 4 | 2% | 1% | 0% | 0% |
| 5 | 0% | 0% | 0% | 0% |
| 6 | 0% | 0% | 0% | 0% |
Mega-developments = 181 blocks. Blocks surrounding = 6602 blocks. Commercial blocks = 17,579 blocks. All other blocks = 21,995 blocks.
Table 7.
ANOVA regression comparing block scale to block score.
| Mixed Use | Mean bldg sq ft is | higher | Mixed Use is associated with larger-scale buildings; this is true at all scales except the smallest |
| % of Scale 1 | lower | ||
| % of Scale 2 | higher | ||
| % of Scale 3 | higher | ||
| % of Scale 4 | higher | ||
| % of Scale 5 | higher | ||
| Block Character | Mean bldg sq ft is | lower | Block Character is associated with smaller buildings; this seems to be driven by scale 2 buildings |
| % of Scale 1 | lower | ||
| % of Scale 2 | higher | ||
| % of Scale 3 | lower | ||
| % of Scale 4 | No diff | ||
| % of Scale 5 | No diff | ||
| Degrading Factors | Mean bldg sq ft is | higher | Degraded quality on blocks is associated with larger buildings, although all scales except scale 1 have this association |
| % of Scale 1 | lower | ||
| % of Scale 2 | higher | ||
| % of Scale 3 | higher | ||
| % of Scale 4 | higher | ||
| % of Scale 5 | higher | ||
| Daily life uses | Mean bldg sq ft is | higher | Daily uses are associated with larger buildings, although all scales except scale 1 have this association |
| % of Scale 1 | lower | ||
| % of Scale 2 | higher | ||
| % of Scale 3 | higher | ||
| % of Scale 4 | higher | ||
| % of Scale 5 | higher |
Table 8.
Summary of tract-level regression analysis.
| Dependent: | Explanatory: | Significant? | Pos or Neg? | R-Squared |
|---|---|---|---|---|
| Population density | Mean bldg sq ft | Y | Negative | 0.1596 |
| % of Scale 2 | Y | Positive | ||
| % of Scale 3 | Y | Positive | ||
| % of Scale 4 | Y | Positive | ||
| % of Scale 5 | Y | Positive | ||
| Median income | Mean bldg sq ft | -- | 0.1481 | |
| % of Scale 2 | Y | Positive | ||
| % of Scale 3 | -- | |||
| % of Scale 4 | -- | |||
| % of Scale 5 | Y | Positive | ||
| Median value | Mean bldg sq ft | -- | 0.1112 | |
| % of Scale 2 | Y | Positive | ||
| % of Scale 3 | -- | |||
| % of Scale 4 | -- | |||
| % of Scale 5 | -- | |||
| Pct rental | Mean bldg sq ft | -- | 0.3470 | |
| % of Scale 2 | Y | Positive | ||
| % of Scale 3 | Y | Positive | ||
| % of Scale 4 | Y | Positive | ||
| % of Scale 5 | -- | |||
| Pct same house | Mean bldg sq ft | -- | 0.2860 | |
| % of Scale 2 | Y | Negative | ||
| % of Scale 3 | Y | Negative | ||
| % of Scale 4 | Y | Negative | ||
| % of Scale 5 | Y | Negative | ||
| Income diversity | Mean bldg sq ft | -- | 0.1661 | |
| % of Scale 2 | Y | Negative | ||
| % of Scale 3 | -- | |||
| % of Scale 4 | Y | Negative | ||
| % of Scale 5 | -- | |||
| Unit type diversity | Mean bldg sq ft | -- | 0.3940 | |
| % of Scale 2 | Y | Positive | ||
| % of Scale 3 | Y | Negative | ||
| % of Scale 4 | Y | Negative | ||
| % of Scale 5 | Y | Negative | ||
| Pct before 1939 | Mean bldg sq ft | -- | 0.1737 | |
| % of Scale 2 | Y | Positive | ||
| % of Scale 3 | -- | |||
| % of Scale 4 | Y | Negative | ||
| % of Scale 5 | -- |
Note: Scale 1 omitted to avoid multi-collinearity.
Disclaimer/Publisher’s Note: The statements, opinions and data contained in all publications are solely those of the individual author(s) and contributor(s) and not of MDPI and/or the editor(s). MDPI and/or the editor(s) disclaim responsibility for any injury to people or property resulting from any ideas, methods, instructions or products referred to in the content. |
© 2023 by the author. Licensee MDPI, Basel, Switzerland. This article is an open access article distributed under the terms and conditions of the Creative Commons Attribution (CC BY) license (https://creativecommons.org/licenses/by/4.0/).
Share and Cite
MDPI and ACS Style
Talen, E. The Scale of Urbanism. Urban Sci. 2023, 7, 87. https://doi.org/10.3390/urbansci7030087
AMA Style
Talen E. The Scale of Urbanism. Urban Science. 2023; 7(3):87. https://doi.org/10.3390/urbansci7030087
Chicago/Turabian StyleTalen, Emily. 2023. "The Scale of Urbanism" Urban Science 7, no. 3: 87. https://doi.org/10.3390/urbansci7030087
APA StyleTalen, E. (2023). The Scale of Urbanism. Urban Science, 7(3), 87. https://doi.org/10.3390/urbansci7030087