Article

Towards a Model of Urban Evolution Part IV: Evolutionary (Formetic) Distance—An Interpretation of Yelp Review Data

1
School of Cities, University of Toronto, Toronto, ON M5S 0C9, Canada
2
Computer Science, Federal University of Technology, Curitiba 80230-901, Brazil
*
Authors to whom correspondence should be addressed.
Urban Sci. 2022, 6(4), 86; https://doi.org/10.3390/urbansci6040086
Submission received: 1 April 2022 / Revised: 31 October 2022 / Accepted: 1 November 2022 / Published: 1 December 2022

Abstract

:
This paper is part IV of “towards a model of urban evolution”. It demonstrates how the Toronto Urban Evolution Model (TUEM) can be used to encode city data, illuminate key features, demonstrate how formetic distance can be used to discover how spatial areas change over time, and identify similar spatial areas within and between cities. The data used in this study are reviews from Yelp. Each review can be interpreted as a formeme where the category of the business is a form, the reviewer is a group and the review is an activity. Yelp data from neighbourhoods in both Toronto and Montreal are encoded. A method for aggregating reviewers into groups with multiple members is introduced. Longitudinal analysis is performed for all Toronto neighbourhoods. Transversal analysis is performed between neighbourhoods within Toronto and between Toronto and Montreal. Similar neighbourhoods are identified validating formetic distance.

1. Introduction

Central to the analysis of the evolution of cities is measuring how cities change over time. Using the Toronto Urban Evolution Model (TUEM) signatures of spatial areas (We refer to spatial areas instead of cities, as the model applies to parts of a city, such as neighbourhoods, as it does to a city as a whole. Each being a spatial area.), we can measure to what extent the forms, groups and activities differ between any pair of signatures. A transversal analysis compares two different spatial areas. A longitudinal analysis compares the same spatial area at different times. A longitudinal analysis allows us to study the trajectory of the city–how it evolves over time. By examining the formemes that comprise these signatures, we can determine what has changed over time, and more importantly the formemes that lead to success or failure. Transversal analysis tells us to what extent two different spatial areas share similar combinations of forms, groups and activities. The analysis allows us to understand how similar spatial areas are and why they are similar (or dissimilar).
This paper applies the Toronto Urban Evolution Model, defined in [1,2,3], to Yelp review data. It demonstrates how Yelp data can be mapped into our model, and how the model, in particular the use of similarity metrics (formetic distance), provides insight into the forms, groups and activities in the neighbourhoods where the review events take place.
Section 2 provides details on the Yelp data used in this study and how it is encoded in TUEM. It shows how a reviewer’s review of a business is mapped onto TUEM forms and groups. In particular, a business ID is mapped to a form, a user ID onto a group, and a neighbourhood onto a spatial area.
Section 3 provides a review of TUEM’s signature distance functions which are the basis for the formetic distance analysis. Two functions are described. The first is based on the degree to which forms and groups are shared across neighbourhoods. The second is based on a weighted version of the first where the number of times a shared form and group appear in reviews is included.
Section 4 focuses on measuring longitudinal and transversal signature distance within and between Toronto neighbourhoods, respectively. Longitudinal distance measures how a neighbourhood evolves over time with respect to the groups and forms captured in a spatial area’s signature as it changes over time. The greater the distance between a neighbourhood’s signatures over time, the more a neighbourhood has changed. In other words, the Yelp users and the categories of venues are a proxy for the types of people and types of businesses that occupy a neighbourhood. Transversal distance measures the degree of similarity between neighbourhoods, again using Yelp users and categories as a proxy for the types of people and types of businesses that occupy a neighbourhood.
Section 5 focuses on longitudinal and transversal signature distance analysis again but with aggregated forms. In the Yelp data each review is associated with a single business ID. If the business ID is retained as the form, then there could be no intersections across neighbourhoods. To address this problem we replace the business ID with the Yelp category of business associated with the business ID. Hence, multiple business IDs are aggregated by Yelp category.
Section 6 focuses on longitudinal and transversal signature distance analysis again but with aggregated groups. In the Yelp data, each review is associated with a single user (which we refer to in the TUEM as a singleton group). In this section, singleton groups are aggregated into groups containing multiple users. The method of aggregation is based on the Apriori algorithm where users are grouped according to their having reviewed the same subset of forms (i.e., business categories).
Section 7 applies transversal signature distance analysis to pairs of neighbourhoods in Toronto and Montreal. The goal is to determine whether the model can identify similar neighbourhoods between the two cities. It uses form and group aggregation to allow for common forms and groups to be found.
Section 8 discusses a number of questions regarding validity of aggregation, and evolutionary insights drawn from the model. We conclude with Section 9.
Appendix A summarizes the formal model defined in [1].

2. Encoding Yelp Data in TUEM

Yelp is a consumer review social media site, with more than 150 million unique users providing millions of reviews in several languages. It contains information about (i) points of interest (POI) and (ii) their users. POIs are mainly businesses such as restaurants and coffee shops, but also may include public spaces such as parks or hiking trails. Each POI is classified within a hierarchical list of categories and may contain reviews provided by users containing evaluative assessments. The reviews are date stamped and correspond to a GPS location, enabling geospatial and temporal analysis.
The Yelp data encoded in our model is from the Yelp.com academic dataset. They are reviews of restaurants that spanned 2189 days (6 years), covering 140 Toronto neighbourhoods (Figure 1), and containing 327,188 reviews. Details about the dataset may be found in [4]. For a review of research using Yelp as a data source, as well as of its strengths and limitations, see [5].
The neighbourhoods discussed in this report (Note that our analysis was performed across all neighbourhoods and only a subset are discussed to illustrate the ideas.) are:
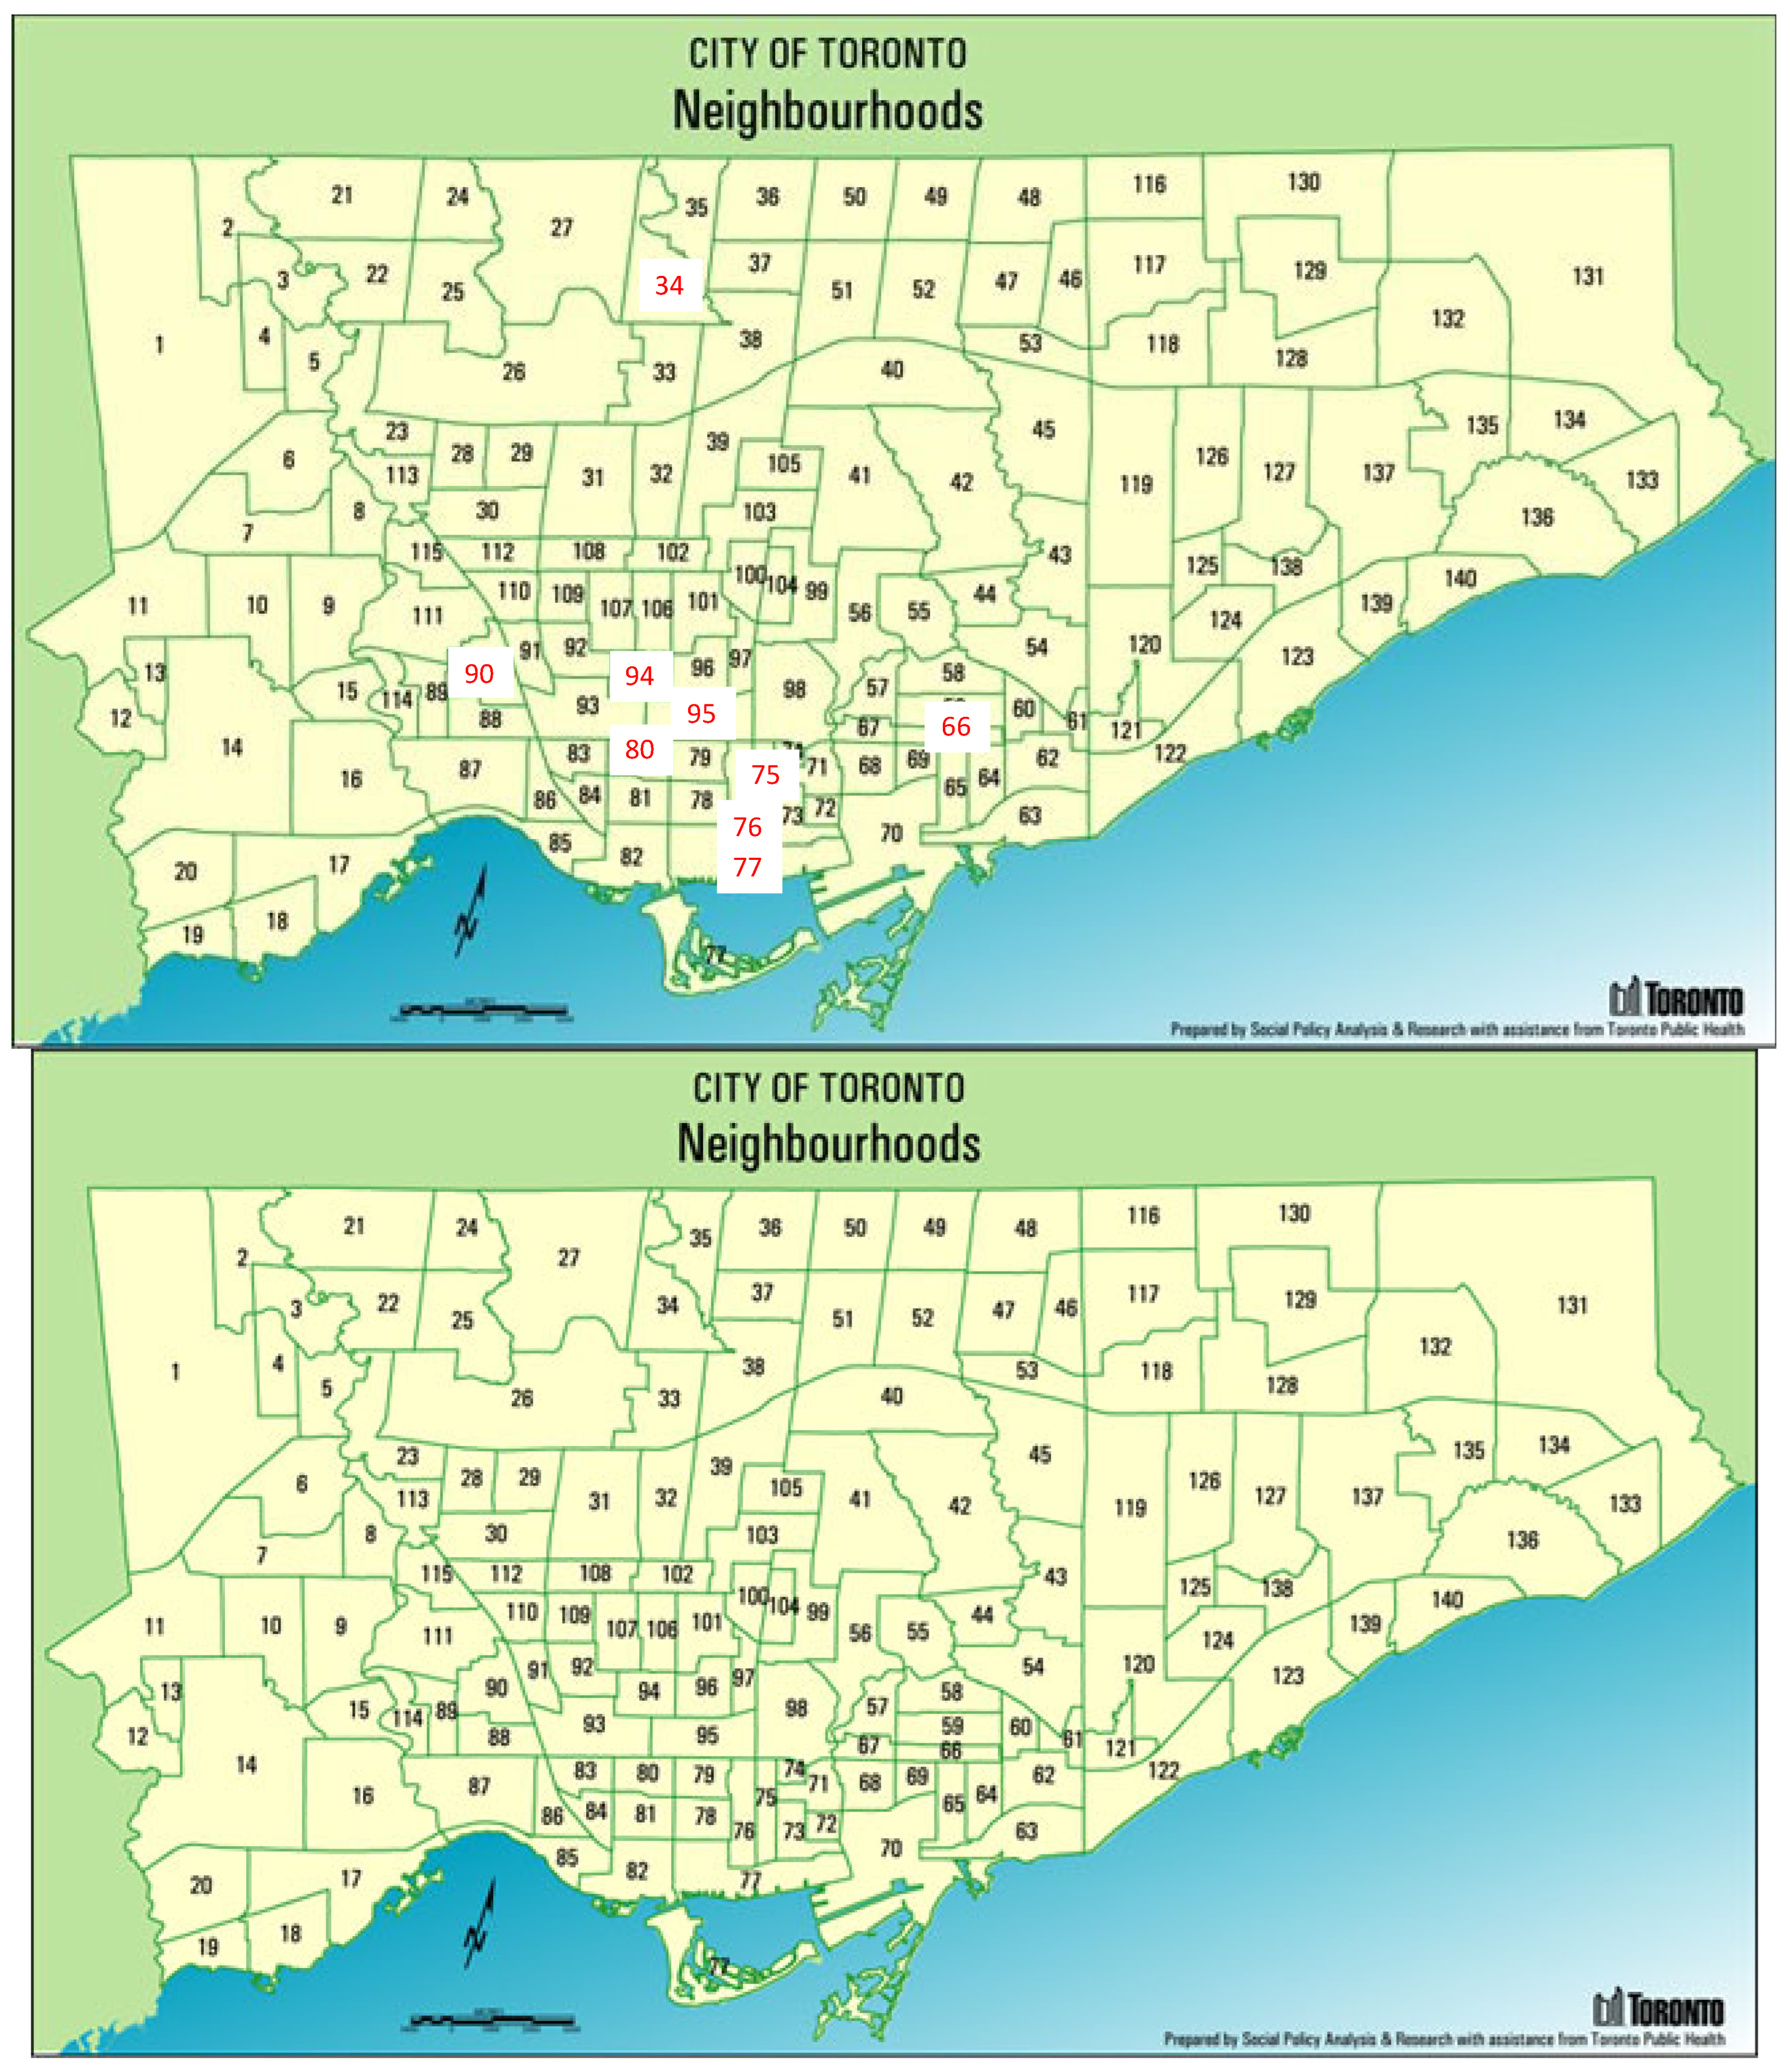
  • Annex (95)—High income predominately residential with retail;
  • Bathurst Manor (34)—Middle income bedroom community;
  • Bay Street Corridor (76)—Middle to high income mixed commercial and residential;
  • Church-Yonge Corridor (75)—Middle income with retail;
  • Danforth (66)—Middle income with retail;
  • Junction Area (90)—Middle and low income with retail;
  • Palmerston–Little Italy (80)—Middle income residential;
  • Waterfront Communities-The Island (77)—Middle income with retail and commercial;
  • Wychwood (94)—Middle to high income residential.
The number following the neighbourhood name is the City of Toronto’s numbering. These neighbourhoods are highlighted in red in Figure 1.
Each review is composed of a:
  • Time stamp.
  • Business ID: a unique identifier for the business being reviewed.
  • Neighbourhood ID: a unique identifier for the neighbourhood in which the business is located. There are 140 neighbourhoods in Toronto.
  • User ID: a unique identifier for the reviewer. There are 73,504 unique reviewers in this set.
  • Categories: one or more categories, from the Yelp taxonomy of business categories, that the business is classified as. There are 854 unique categories (excluding top level categories) in this Yelp dataset.
The Yelp review data was translated into the TUEM model as follows:
  • Spatial Areas (C): a spatial area c corresponds to a Toronto neighbourhood.
  • Forms (P): a form p corresponds to a unique Yelp business ID.
  • Groups (G): a group g corresponds to a unique User ID, i.e., reviewer.
  • Activities (A): an activity a corresponds to the implicit activity of reviewing.
The formemes were partitioned into spatial areas (i.e., neighbourhoods), and within each spatial area into years. Each year-neighbourhood partition corresponds to a signature; one signature for each neighbourhood for each of the six years, resulting in 840 signatures. The formemes associated with a particular signature were assigned to the signature’s Hunome H, as they reflect the users and uses in the neighbourhood.

3. Formeme and Signature Distances

As defined in Parts II [1] and III [3], an important concept in modelling urban evolution is the degree to which formemes are similar. By similarity, we mean the degree to which they share the same elements: forms, activities, and groups. The hypothesis is the more similar the population of formemes, the more similar the evolutionary path. However, if areas with similar initial populations of formemes diverge over time, what are the key differences in elements that lead to the change?
We reproduce from part II the function fdist that returns the formetic distance between two formemes.
fdist(f1, f2): measures the formetic distance between formemes f1 and f2.
The smaller the value, the more similar the formemes are. There can be many different distance metrics. We constrain the definition of fdist as follows:
Axiom 1.
Reflexivity fdist(f1, f1) = 0.
Axiom 2.
Symmetry fdist(f1, f2) = fdist(f2, f1).
Axiom 3.
Subadditivity fdist(f1, f2) + fdist(f2, f3) ≥ fdist(f1, f3).
In order to measure how similar urban genomes or hunomes are, we defined the distance between two sets of formemes F1 and F2:
Fdist(F1, F2): measures the similarity between formeme sets F1 and F2.
The smaller the value, the more similar the formeme sets are. There can be many different distance metrics. We constrain the definition of Fdist() as follows:
Axiom 4.
Reflexivity Fdist (F1, F1) = 0.
Axiom 5.
Symmetry Fdist (F1, F2) = Fdist (F2, F1).
Axiom 6.
Subadditivity Fdist (F1, F2) + Fdist (F2, F3) ≥ Fdist (F1, F3).
One possible definition of Fdist(), which we refer to as the “basic distance metric” bFdist, counts the number of element types shared between the formeme sets divided by the total number of element types across both formeme sets. In particular, bFdist’s fraction numerator sums the size of the sets created by the intersection of formeme elements, namely p, a and g. The numerator is dived by the denominator which is the sum of the size of the sets created by the union of the same formeme elements. The more elements in common between F1 and F2, i.e., the more similar they are, the closer the value of the fraction is to one. We then subtract the fraction from zero to get the distance, i.e., a distance of zero implies the faction is one and the F1 and F2 share the same elements.
bFdist ( F 1 ,   F 2 ) = 1 |   F 1 [ p ]       F 2 [ p ]   | + |   F 1 [ a ]       F 2 [ a ]   | + |   F 1 [ g ]       F 2 [ g ]   | |   F 1 [ p ]       F 2 [ p ]   | + |   F 1 [ a ]       F 2 [ a ]   | + |   F 1 [ g ]       F 2 [ g ]   |
We defined an alternative Fdist, which we refer to as the “weighted distance metric” wFdist. wFdist takes into account the frequency with which elements appear in a set of formemes. If two sets of formemes have the same elements, then bFdist will determine that they are the same, i.e., zero distance between them. However, if one set of formemes has a greater frequency of elements than the other, bFdist will still return a zero distance. For example, let’s assume that every neighbourhood has one of each category of venue and group, the bFdist will return a distance of zero between pairs of neighbourhoods. However, if one neighbourhood has a very large number of Chinese venues, we would refer to this neighbourhood as “Chinatown”. So, the frequency with which elements such as forms (venues in Yelp) occur in formemes is an important component of measuring distance. In order capture the possible imbalance in the number of occurrences of elements in one neighbourhood versus another, wFdist weights the results. Unlike bFdist where the number of shared elements are counted in the numerator, we substitute the sum of the minimum number of occurrences of each element measured by Fsize. Fsize(F, e) returns the number of formemes f in F that contain the element e. The denominator sums the maximum number of occurrences of each element measured by Fsize.
wFdist ( F 1 ,   F 2 ) = 1 e     Elements ( F 1 ,   F 2 ) min ( Fsize ( F 1 , e ) ,   Fsize ( F 2 ,   e ) ) e     Elements ( F 1 ,   F 2 ) max ( Fsize ( F 1 , e ) ,   Fsize ( F 2 ,   e ) )
where Elements(F1, F2) is the set of all elements contained in F1 and F2
Elements(F1, F2) = F1 [p] ⋃ F2 [p] ⋃ F1 [g] ⋃ F2 [g] ⋃ F1 [a] ⋃ F2 [a].
In this paper, we measure the distance between Hunomes H of different spatial areas, as we wish to measure how similar the conceptions of urban form carried by the users of urban space.

4. Signature Distances: Unaggregated Data

In this section we perform a longitudinal and transversal analysis on the “raw” signatures of two neighbourhoods in Toronto. Highlighting these two neighbourhoods helps to build intuition about our measures before moving to more general analysis. By “raw”, we mean neither the forms (venues) have their business ID replaced by their business category, nor are individual users/reviewers IDs aggregate into groups containing more than one unique user/reviewer.

4.1. Longitudinal Analysis

In this section the evolution of the Waterfront neighbourhood is analysed over a six year period. Waterfront Communities-The Island (77) is situated at the foot of Lake Ontario. It is both a popular tourist area with many event spaces, restaurants, and upper income condominiums. The choice of this neighbourhood is based on the changing demographics and activities. During the period of the Yelp data, it was initially a tourist destination, but became more residential with the continuing addition of residential condominium buildings. See Figure 2 for the boundaries of the neighbourhood, which is numbered 77.
Table 1 depicts the longitudinal distance of the Waterfront Neighbourhood for a six-year period, illustrating how to measure how a single neighbourhood changes over time. For example, row Yr 1 shows the weighted distance (wFdist) between Yr 1 and subsequent years. An analysis of longitudinal distance, the distance ranges from 0.536 from year 1 to 2, to 0.84 from year 1 to 6.
It may seem puzzling that the distance from year 1 to 2 is 0.536 and then grows by 0.1 approximately to each subsequent year. An analysis of the data in Table 2 provides an explanation.
Table 2 depicts the longitudinal metrics for the Waterfront neighbourhood.
For each year, except year 1, the following metrics are displayed:
  • Number of non-unique elements in component: total number of elements across the three components, P, A and G, of H.
  • Number of unique elements in component: total number of unique elements across the three components, P, A and G, of H.
  • Intersection of elements with prior year: total number of unique elements across the three components, P, A and G, in the intersection of this year’s elements (metric #1) with the prior year.
  • Union of elements with prior year: total number of unique elements across the three components, P, A and G, in the union of this year’s elements (metric #1) with the prior year.
  • Intersection %: Percentage of unique elements that are common to this year’s metric #1 and the prior year.
  • Cumulative intersection since year 1: total number of unique elements across the three components, P, A and G, in the intersection of this year’s elements (metric #1) with all prior years.
  • Cumulative Intersection %: Percentage of unique elements that are common to this year’s metric #1 and all prior years.
The distance between any two adjacent years ranges from 0.536 to 0.597, and is relatively stable. The reason for this is that from year to year, about 60% of the venues reviewed do not change (Intersection %), while 90% of the reviewers change from one year to the next. However, the cumulative intersection of venues reviewed since Year 1 drops from 42% in year 3 down to 21% in year 6. In other words, the marginal increase in distance from year 1 to years 3 and beyond is due to the slow change in venues that are reviewed from year 1 to 6. Individual reviewers come and go, but the underlying types of venues remain more stable.

4.2. Transversal Distance

In this section we explore measuring the distance between pairs of neighbourhoods during Year 1.
Table 3 depicts the transversal distance between 8 neighbourhoods. The neighbourhoods were chosen for their variation in neighbourhood types, from inner suburb residential (Bathurst Manor), to midtown residential (Wychwood), to residential with vibrant nightlife (Annex, Palmerston-Little Italy), to commercial/residential (Church-Yonge), to downtown high tourist area (Waterfront), to a neighbourhood in transition from industrial to residential/nightlife (Junction). In most cases, the pair-wise distances are quite high with Annex, Church, and Waterfront being more similar to each other. All three have a mid/downtown residential component plus vibrant nightlife.
Table 4 depicts the data underlying the Annex–Bathurst Manor transversal distance metric for year 1:
  • The lines listing the neighourhoods specify the number of unique elements for each of the components P, G, and A.
  • Intersection of elements specifies the number of unique elements in the intersection of the two neighbourhoods.
  • The union of elements specifies the number of unique elements in the union.
  • The intersection % specifies the number of unique elements in the intersection divided by the number in the union.
Since the venues are located in only one neighbourhood, the number of venues at the intersection of the neighbourhoods is zero. Consequently, the only information the distance measures is the extent to which reviewers have posted reviews for venues in both neighbourhoods in the same year. Being an inner suburb residential community, Bathurst Manor has few venue reviews and the percentage of reviewers posting reviews in both neighbourhoods is 0.5%.
The Church-Yonge Corridor neighbourhood (Table 5) is the closest to the Annex in terms of distance. 21.1% of the reviewers posted reviews in both neighbourhoods in the same year. The Palmerston-Little Italy and Waterfront neighbourhoods (Table 6) also share reviewers with the Annex, ranging between 16.9% and 21.1%.
The transversal analysis indicates that relative to other neighbourhood pairings, the Annex, Palmerston-Little Italy and Waterfront neighbourhoods are more similar to each other in the types of people (reviewers) they attract. In subsequent sections, the analysis will focus on four neighbourhoods: Annex, Bathurst Manor, Church Corridor and Waterfront–The Island.

5. Signature Distances: Aggregated Forms

The previous experiment treated both groups (reviewers) and forms (venues) as unique. No attempt was made to aggregate either. The problem with the unaggregated data is that a venue’s business ID is unique to a neighbourhood and therefore the intersection of venues between neighbourhoods is zero, as we saw in the previous section. Hence, we cannot get a true picture of the distance between neighbourhoods. In this experiment we substitute venue category for a venue’s businessID. Each venue may have more than one category. For example, a restaurant may be categorized as both an Italian restaurant and a pizzeria. We transform a single review into multiple reviews, one for each assigned category. We also introduce a weight for a review where a single review with three categories has a weight of 1/3 assigned to each duplicate review. In terms of our model of evolution, each review is interpreted as a formeme composed of a reviewer (G), review (A) and venue category (P) plus a weight:
  • Form f: single business category;
  • Activity a: Review—same for all formemes;
  • Group g: group ID—the reviewer’s unique User ID;
  • Weight w.
If a single review assigned 3 categories to a business ID, then we would generate three formemes:
-
<category 1, Review, Group 28, 0.333>
-
<category 2, Review, Group 28, 0.333>
-
<category 3, Review, Group 28, 0.333>
In this measurement approach, formemes capture each category separately, but the weight of the formeme is reduced in order to reduce the impact of assigning multiple categories in TUEM’s distance metric.
The Yelp business categories are embedded in a taxonomy with the following top level categories (Table 7):
Venues choose their category and often choose multiple categories starting with the top of the taxonomy. This results in formemes dominated by top level categories which do not adequately differentiate neighbourhoods. Consequently, the distance between neighbourhoods is reduced because they contain many of these top level categories. To reduce the impact of the top level categories on the distance analysis, we remove any formemes whose form (category) is one of these top level categories.

5.1. Longitudinal Distance

5.1.1. Longitudinal Case: Waterfront Communities-The Island (77)

Table 8 returns to the Waterfront and depicts its longitudinal distance for a six-year period. For example, row Yr 1 shows the weighted distance between Yr 1 and subsequent years. The distance ranges from 0.471 from year 1 to 2, to 0.803 from year 1 to 6.
Neighbourhood Venue (Form) Changes. Examination of the Waterfront data shows that greater than 80% of the reviews from one year to the next are for the same categories of venues, whereas over the six year period the cumulative intersection of venue categories reviewed drops to approximately 50%, possibly reflecting an evolution in the categories of venues in the neighbourhood over the six year period. Within the restaurant industry, the decrease in intersecting venues is consistent with the average life span of a restaurant—the majority do not last more than a year and those that do, 70% will close within five years (https://yourbusiness.azcentral.com/average-life-span-restaurant-6024.html, accessed on 17 January 2022). This is validated by the cumulative intersection of non-aggregated forms (venues) in year 6 of Table 9 of 20%, implying that many restaurants have probably closed, but still greater than the average. Nevertheless, the analysis also indicates that the neighbourhood retains a sizable share of its orientation over the period, with the churn in particular businesses matched by a greater stability in the types of businesses present. In other words, the genome U for the neighbourhood influences the persistence of venue categories which in turn influences a persistence in the activities associated with them. Although some change in the actual activities in Hunome H occur, the persisted impact of U is clearly felt.
Neighbourhood Reviewer (Group) Changes. From one year to the next there is about 10% repeat reviewers-the same person will generate at least one review each year over a two year period. However, over the six years the number of people who submit reviews for each of the years reduces to 0.3%. Hence, the reviewer population appears to be transient, which is consistent with the Waterfront being a tourist area. The Waterfront therefore illustrates a type of urban evolution where the population of local formemes is likely adapted to the expectations of a mobile tourist population of users.

5.1.2. Longitudinal Case: Annex (95)

Table 10 depicts the longitudinal distance of the Annex Neighbourhood for a six-year period, with aggregated forms (venues). The longitudinal distance ranges from 0.471 from year 1 to 2, to 0.727 from year 1 to 6, showing a slightly less cumulative change than the Waterfront.
Table 11 provides detailed data that underly the longitudinal metrics for the Annex neighbourhood. About 50% of the venue categories reviewed each year are the same throughout the sixth year period. In the early years, 7–11% of the reviewers are the same from year to year. Over the six-year period, the number of reviewers that posted reviews across all years was negligible.

5.1.3. Observations

To the extent that Yelp reviews provide a window into neighbourhood “scene” [6], the categories of forms are ever changing, all be it at a slow rate. Anecdotally, the Annex scene has always been evolving. In 1960s and 70s, the restaurant scene was dominated by Hungarian restaurants. This evolved into one dominated by Japanese and then Korean restaurants. Rather than reflecting a change in the groups inhabiting the area, which has remained largely stable, i.e., students, faculty, retirees, it reflects their evolving culinary tastes.

5.2. Transversal Distance

In this section we explore transversal distance between pairs of neighbourhoods during Year 1, where forms (venues) have been aggregated by business category. The analysis focuses on 3 neighbourhoods, each very different from each other: Annex, Bathurst Manor and Waterfront.
Table 12 depicts the transversal distances for eight neighbourhoods in Year 1. Focusing on The Annex, it is most similar to the Church-Yonge neighbourhood (distance of 0.53), and least similar to the Bathurst Manor neighbourhood (distance of 0.995). In the remainder of this section we dig deeper into the data.

5.2.1. Transversal Case: Annex (95)—Church-Yonge Corridor (75)

The Annex and Church-Yonge neighbourhoods are more similar than any other pairings with the Annex—0.53. An analysis of Table 13 shows that 52% of the venue categories are common to the neighbourhoods, but more interestingly, 21% of the reviewers are common to both—these evolution of these areas’ is therefore likely influenced to a relatively high degree by their shared users. This is especially notable when longitudinally, the commonality of reviewers between subsequent years in the Annex is between 7 and 11% (see Table 11).

5.2.2. Transversal Case: Annex (95)—Bathurst Manor (34)

The Annex and Bathurst Manor neighbourhoods are very dissimilar, with a distance of 0.995. Table 14 shows that they neither share any significant numbers of venue categories (2.4%) nor reviewers (0.5%). Their evolution therefore proceeds largely in parallel to one another, though they are likely influenced by their common environment to some degree.

5.2.3. Transversal Case: Annex (95)—Waterfront Communities-The Island (77)

The Annex and Waterfront neighbourhoods (Table 15) are more similar, with a distance of 0.668, but not as similar as the Annex and Church-Yonge neighbourhoods. Both the venue categories and reviewers the Annex shares with Waterfront are much greater than shared with Bathurst Manor, but not as high as shared with Church-Yonge.

6. Signature Distances: Aggregating Groups

The experiment conducted in Section 5 saw the aggregation of forms (venues) by business category, providing a more accurate picture of the distances between neighborhoods. However, the data remains unaggregated with respect to groups, i.e., each reviewer constitutes their own group in a formeme. This discrepancy between the data as it stands and the model of urban evolution results in an inaccurate measure of the distance between neighborhoods (because reviewer activity is likely localized, i.e., reviewers may be more inclined to visit certain venues near places of work or residence) as well as between years (because reviewers may change the frequency of their Yelp logging activity over time).
In this experiment, we use the Apriori algorithm [7] to aggregate reviewers by the types of venues they visit. Performing group aggregation using a level-wise search, this algorithm abstracts groups based on the forms they conducted reviewing activities for. In particular, singleton groups (i.e., individual reviewers) are aggregated into groups based on their reviewing a common set of forms (venue categories). The minimum group size was set to 5000 and the maximum number of shared forms (venue categories) was set to 10. This resulted in 29 groups that shared 2 forms, and 6 groups that shared 3 forms. Appendix B lists the groups and the forms (venue categories) they share. If a singleton group (reviewer) was assigned to more than one aggregate group, then when mapping a formeme’s singleton group into an aggregate group, the aggregate group chosen was determined by:
  • The aggregate group whose defining forms contained the formeme’s form;
  • the aggregate group with the largest number of forms used to define the aggregate group.
If there does not exist an aggregate group whose defining forms contain the formeme’s form, then no mapping is performed.
The formemes in all signatures were transformed by mapping unique forms (Business ID’s) to one or more aggregate forms (Yelp categories) as described in Section 5. Secondly, singleton groups (reviewers) that were a member of an aggregate group were mapped into the aggregate group as described earlier. The following describes the longitudinal and transversal distances based on the aggregated signatures.

6.1. Longitudinal Distance

6.1.1. Waterfront Communities-The Island (77)

Table 16 depicts the longitudinal distances within the Waterfront Neighbourhood over a six-year period. Again, a cell contains the weighted distance between corresponding years. For example, row Yr 1 shows the weighted distance between Yr 2 and subsequent years. With the aggregation of groups, we find that the difference ranges from 0.204 for years 1 and 2 to 0.703 for years 1 and 6 (with a distance growth of approximately 0.15 for subsequent years). Comparing these values to the range for unaggregated data (0.536 to 0.84) and for aggregation of forms only (0.471 to 0.803), it is clear that aggregation (of groups especially) plays a large role in regularizing the distances between longitudinal signatures and thus providing a more accurate depiction of the evolution of the Waterfront Neighbourhood over time.
Examining the Waterfront data in greater detail in Table 17, the evolution of forms (venue categories) in column P remains identical to the results in Table 9 (which has no group aggregation). This confirms that the differences in longitudinal distances are a direct result of the aggregation of groups (reviewers). With the aggregation of groups (reviewers), there are now approximately 75% fewer unique elements in the group component of each year. The intersection of group elements from year to year appears to be significantly lower than that which is observed inTable 9, but this is due to the fact that frequency of group elements is not taken into account with set operations.

6.1.2. Annex (95)

Table 18 depicts the longitudinal distance of the Annex Neighbourhood for a six-year period with group aggregation. The difference ranges from 0.207 for years 1 and 2 to 0.562 for years 1 and 6. While the distance between subsequent years grows by around 0.1 at first, between years 5 and 6 the distance only increases by 0.027. Comparing these longitudinal distances to those for the Waterfront Neighbourhood (which have a range of 0.204 to 0.703 and a distance growth of approximately 0.15 for subsequent years), there is a larger persistence of form or group elements over time for the Annex than the Waterfront. This greater stability is a reflection of the greater stability of the formetic bases of the Annex in its recurrent users and forms.
Table 19 depicts the longitudinal metrics for the Annex. Again, the values for the form component (venue categories) in Table 19 are identical to those displayed in this table’s non-group-aggregated counterpart (Table 11). Unlike the longitudinal metrics for the Waterfront (Table 18), the cumulative intersection of the group components here is much higher than in the non-group-aggregated metrics (Table 11). This may be because the metrics have captured the activity of a diverse group of tourists visiting the Waterfront compared to the more consistent choices of the student and professional population visiting venues in the Annex Neighbourhood. Either way, such underlying evolutionary mechanisms are reflected in the smaller cumulative change over the six years depicted in Table 18.

6.2. Transversal Distance

In this section, we explore measuring the distance between pairs of neighbourhoods during Year 1, which we briefly touched upon when comparing the metrics for the Waterfront and Annex Neighbourhoods in the previous section. Table 20 depicts the transversal distances for eight neighbourhoods in Year 1. Focusing on the Annex Neighbourhood, it is most similar to the Church-Yonge Neighbourhood (distance of 0.37), and least similar to the Bathurst Manor Neighbourhood (distance of 0.994). Compared to the transversal distances calculated prior to group aggregation, distances of 0.53 and 0.995, respectively, the grouping of reviewers now provides a clearer picture of the distance between the Annex and Church-Yonge Neighbourhoods while the distance between the Annex and the Bathurst Manor Neighbourhoods groups was large enough to not be significantly affected.

6.2.1. Transversal Case: Annex (95)—Bathurst Manor (34)

The Annex and Bathurst Manor neighbourhoods are very dissimilar, with a distance of 0.994. Table 21 shows that even with group aggregation, they do not share any significant numbers of venue categories (2.4%) or reviewers (0.9%).

6.2.2. Transversal Case: Annex (95)—Waterfront Communities-The Island (77)

The Annex and Waterfront neighbourhoods are more similar (Table 22), with a distance of 0.585, but not as similar as the Annex and Church-Yonge neighbourhoods. Both the venue categories and reviewers the Annex shares with Waterfront are much greater than shared with Bathurst Manor, but not as high as shared with Church-Yonge.

6.2.3. Transversal Case: Annex (95)—Hurch-Yonge Corridor (75)

The Annex and Church-Young Corridor are a much more similar than the Annex-Waterfront, with a distance of 0.37 (Table 23). Although the intersection of forms and groups are only marginally better (2–4%), it is the frequency with which these intersecting elements occur in both signatures that draws them closer.

7. Transversal Distances between Toronto and Montreal Neighbourhoods

Next, we explore the transversal distances between pairs of neighbourhoods in Toronto and Montreal.
To do so, we conducted form and group aggregation for Yelp reviews collected in Toronto and Montreal and calculated the transversal distances between all neighbourhood pair combinations (The complete formetic distance matrix is too large to display in this paper, but can be found at: http://ontology.eil.utoronto.ca/urbangenome/yelpLogReviewsFull-cv-td-1096.html, accessed on 1 April 2022). In Table 24 we display some notable distances between three neighbourhoods in Toronto (Annex, Bathurst Manor, and Bay Street Corridor) and three neighbourhoods in Montreal (Lachine-Ouest, René-Lévesque and Sainte-Marie).
Color coding Toronto neighbourhoods in blue and Montreal neighbourhoods in red, cells that represent the distance between pairs of neighbourhoods in different cities are indicated in purple. Most significantly, notice that the distances between the Annex in Toronto and René-Lévesque in Montreal as well as the Bay Street Corridor and René-Lévesque are lower than distances between most neighbourhoods in the same city. This finding indicates that formetic information is only loosely determined by common membership of areas in the same spatial environment, and that the relevant selection mechanisms often involve the tastes and expectations of users regarding what particular parts of different cities should offer. This means that much urban evolution operates at the level of neighbourhoods rather than the city or region as a whole.
To provide some context for our analyses, René-Lévesque is located in downtown Montreal and sits adjacent to both McGill and Concordia University, much in the same way that the Annex sits adjacent to the University of Toronto. (Interestingly, the Royal Ontario Museum, which is the largest museum in Canada, can be found in the Annex while the Montreal Museum of Fine Arts, which is the largest art museum in Canada, can be found in René-Lévesque). While the Annex also consists of a large number of residences, its business activity is defined by cafés, restaurants, and bars that draw students and university staff alike. Although René-Lévesque is also home to retail stores, its eateries are similarly frequented by the students and staff of the two nearby universities. Considering the overlap in forms and groups in the Annex and René-Lévesque, it is unsurprising that their transversal distance indicates a high degree of similarity between these two neighbourhoods. However, this unsurprising fact would not be easily detectable by analyzing each neighbourhood within the context of its own city alone, as their cross-city commonalities would not come into view.
The Bay Street Corridor runs along the eponymous Bay Street in Toronto and is the home to a variety of forms including eateries, retail chains, hospitals, and the Toronto Financial District. It also lies adjacent to the University of Toronto and Toronto Metropolitan (formerly Ryerson) University, suggesting the activity in this neighbourhood is also driven by students and staff in addition to the professionals that work in the vicinity. The similarities in forms (eateries and retail stores) and groups (university students and staff) that characterize the Bay Street Corridor and René-Lévesque again provides a reasonable explanation for the small transversal distance between these two neighbourhoods.
Taking a closer look at the distance between the Annex and René-Lévesque (Table 25), we can see that there is considerable overlap between the forms and groups found in both neighbourhoods. That is, comparing the intersection of form elements with the number of form elements found in each neighbourhood, the Annex and René-Lévesque each share over 60% of the business categories populating each area. Furthermore, comparing the intersection of group elements with the number of group elements found in each neighborhood, we find there is an overlap of over 20% of Annex groups with René-Lévesque groups and an overlap of nearly 16% of René-Lévesque groups with Annex groups. As these two neighbourhoods are in different cities, our model has clearly picked up on key visitor attributes through our use of aggregated groups instead of individual reviewers.
From the Bay Street Corridor and René-Lévesque transversal metrics displayed in Table 26 we can see a similar intersection of forms and groups is found in this neighbourhood pairing. In fact, René-Lévesque shares over 73% of its forms and 22% of its groups with the Bay Street Corridor (which are the highest intersection percentages found in Table 26 and Table 27). Conversely, the Bay Street Corridor shares only 61% of its forms and 19% of its groups with René-Lévesque (which are among the lowest intersection percentages found in Table 25 and Table 26). This phenomenon can be explained by revisiting the neighbourhood characteristics that we previously identified. Namely, all of the major forms that define the René-Lévesque neighbourhood (eateries and retail stores) can be found in the Bay Street Corridor but not all of the forms of the Bay Street Corridor (eateries, retail stores, hospitals and the Toronto Financial Distract) can be found in René-Lévesque. Therefore, the intersection percentages in René-Lévesque and the Bay Street Corridor match our qualitative understanding of the area well. We call this phenomenon Signature Subsumption, where the signature of one spatial area subsumes another it implies that the formemes in the subsumed signature are an approximate subset of the subsuming signature. In this case, the Bay Street Corridor subsumes René-Lévesque.
Interestingly, although we see a greater intersection of elements for the Bay Street Corridor and René-Lévesque neighbourhood pair (Table 26) compared to the Annex and René-Lévesque neighbourhood pair (Table 25), the distance of the former pair is larger (0.627 compared to 0.565). This can be explained by our choice of weighted distance as the transversal distance heuristic and the fact that the numbers presented in Table 25 and Table 26 count the number of unique elements and do not take into account the frequency of elements. Thus, our chosen distance heuristic weighs the distance by the frequency with which elements appear in the reviews of each neighbourhood, which is not captured in Table 25 and Table 26.
All in all, our analysis of distances and the element intersection of pairs of neighbourhoods in markedly different cities is supported by the characteristics of the neighbourhoods themselves. Therefore, it seems that our model is correctly picking up on the forms and groups that are essential to defining the urban activity of a neighbourhood.

8. Discussion

Our formal model of representing and analysing urban evolution provides a means for determining the similarity of spatial areas based on formetic distance, i.e., the degree of sharing of formemes, composed of forms, groups and activities, weighted by the frequency of occurrence. In this section we discuss questions raised by this work.
Is Formetic Distance meaningful?
We use Yelp data as a source of forms and groups that populate the formemes. Its content is limited, relative to the representational capabilities of our model. Recognizing the limitation in using Yelp data as a proxy for more general types of forms, groups and activities, nevertheless it does provide an approach to validating the model.
Pairwise analysis of neighbourhoods both within Toronto and between Toronto and Montreal demonstrates that neighbourhoods that are descriptively similar (By descriptively similar, we mean the informal characterization of a neighbourhood by those knowledgeable of the area.), such as the Annex and Bay St. Corridor in Toronto, are also similar using formetic distance. More interestingly, neighbourhoods in Toronto and Montreal, such as the Annex and René-Lévesque that were found to be similar using formetic distance, were also found to be descriptively similar upon subsequent examination.
For example, the Montreal neighbourhood found to be most similar (0.7) to Bathurst Manor in Toronto is Sault-au-Récollet. The latter is described as:
“is a small, semi-suburban and scenic neighbourhood, … there’s some scenic spots and great parks, … a bit out of the way from the busier parts of the city, … isn’t a place where you go to party, … one of the parts of the city where the middle-aged and elderly might outnumber the younger folks. A lot of families move out here to settle and buy homes for the long run. As such, many of the residents of this area are long-term inhabitants who want to enjoy the feeling of suburbia but still be close to downtown, … bit out of place, especially since there are some industrial zones nearby, … find restaurants, drugstores and groceries. Though there aren’t too many choices for amenities overall …” (https://nexthome.ca/neighbourhoods/montreal-sault-au-recollet/142959/, accessed on 27 January 2021)
Bathurst Manor is also an inner suburb and primarily a bedroom community bordering both a commercial/industrial area and two major parks. While Bathurst Manor may not be characterized as scenic, the major parks are. Similarly, it has two shopping plazas and several small strip malls that provide restaurants, drugstores, groceries, etc., but with limited choices.
Neighbourhoods that are descriptively dissimilar, such as the Annex and Bathurst Manor, and Bathurst Manor and René-Lévesque are also dissimilar using formetic distance.
The coupling of form, group and activity into formemes and using them to measure formetic distance between neighbourhoods demonstrates that our distance metric is consistent with the descriptive characterization of neighbourhoods. Neighbourhoods that are similar, have similar forms and to some extent groups—to the extent that Yelp data allows.
Is aggregating individuals from different cities into the same group valid?
The Yelp review data pairs an individual reviewer with an individual venue. It also provides one or more categories for each venue reviewed. Our group aggregation algorithm generates groups composed of individuals whose reviewed venue categories have maximum overlap. As venue categories are common across all cities, it is possible to group individuals regardless of the neighbourhood the venue is located in. Individuals within the same group have reviewed (a subset of) venues within the same categories. The implication is that a group denotes a set of individuals who are interested in similar types of food or services. That should imply that where there is an overlap in venue categories between neighbourhoods, there should be an overlap in groups visiting those venues.
By plotting and comparing the weighted intersection of forms to the weighted intersection of groups for every pair of neighbourhoods (This corresponds to a weighted version of the “intersection %” row in Table 19.) in Toronto, we can determine if our intuition is correct. Figure 3 depicts the plot of all Toronto neighbourhood pairs where the x-axis represents the percentage intersection of a pair of neighbourhoods’ forms, and the y-axis the percentage intersection of the two neighbourhoods’ groups. It appears that the weighted intersection of groups is dependent on the weighted intersection of forms above a 20% threshold. That is, the higher the weighted intersection of forms is for a pair of neighbourhoods, the higher the weighted intersection of groups is likely to be as well. However, this relationship is asymmetric in that form intersection does not seem to be dependent on group intersection. Overall, these observed patterns strongly indicate that where there is a critical mass of similar venues, similar groups of reviewers will be attracted. In other words, the genome of a neighbourhood influences the groups in the Hunome more strongly than vice versa, at this time scale. Additionally, our calculations of R2 indicate that between 31 and 55% of the variation in the weighted intersection of groups observed in the Yelp data can be explained by the weighted intersection of forms. Therefore, our exploration of the correlation between the intersection of forms and groups seems to confirm that our aggregation of individuals from different cities based on their reviewing activity is valid.
Additionally, we observe (Figure 4) an interesting temporal pattern in the distribution of form and group intersections, wherein the weighted intersection of groups appears to decrease over time, resulting in the nested structure observed in our scatterplot. In fact, when only comparing the intersections of forms and groups for neighbourhoods similar to the Waterfront, this temporal trend is even more apparent. In Figure 4 the blue dots represent year 1 and the brown dots year 6. There is a clear downward progression each year.
Looking at the most prolific group of reviewers (by far) from all 4 neighbourhoods, we found that while the number of reviews they made over time increased (Figure 5), the proportion of their reviews to the total number of reviews made in each neighbourhood in each year decreased. This pattern also held true for other groups common to all 4 neighbourhoods.
Because we found this trend present in several groups, this suggested that the number of groups making reviews has been increasing over time, resulting in the smaller proportions of the total number of reviews per neighbourhood per year. We determined the exact number of groups active as well, finding a clear increase in the number of groups making reviews in each neighbourhood over time (Figure 6).
Therefore, as the number of groups making reviews in each neighbourhood increases from a few hundred to a few thousand over the course of six years, it is unsurprising that we observe a decrease in the intersection of groups between neighbourhoods over time (it is more difficult to share thousands of common groups than hundreds). The correlation between the weighted intersection of forms and groups would have likely been stronger without this dampening effect on the weighted intersection of groups.
What does Yelp data tell us about the Model?
In [1], several propositions regarding density and its role in the selection process are defined. In our aggregation discussion above, a different type of density proposition emerges. The 20% form intersection threshold can be interpreted as a “density threshold” where higher levels of form intersection leads to higher levels of group intersection. On the other hand, Figure 5 tells us that the most active groups continue to remain active, but represent a smaller percentage of reviews over time due to the attraction of new groups interested in the forms. This demonstrates the attractive force of neighbourhoods that specialize in forms and their associated activities. Secondly, it implies that signalling is occurring from the neighbourhood to other groups interested in the forms and activities they support, leading to an increase in groups in the neighbourhood over time, providing a rough indication of the notion of signal reach. An open question is whether the change in groups over time will in turn alter the forms.
What does the model tell us about Yelp data?
Table 27 compares the longitudinal cumulative intersection of both forms and groups with respect to the first year of the Annex and Waterfront. With respect to forms, both neighbourhoods show decrease over the six year period from 76–81% commonality of venues reviewed to 50–56% by the sixth year. Whether this represents a change in the categories of venues found in each neighbourhood over time, or reviewer fatigue is unclear. On the other hand, the cumulative intersection of groups indicates a less transient reviewer population in the Annex than the Waterfront—which is understandable given the Waterfront is more of a tourist area. Nevertheless, over the six year time period the cumulative intersection of both forms and groups consistently decreases, signifying change in both venues and reviewers.
As we observed in Figure 6 this decrease in the cumulative intersection of groups is driven by the increasing number of groups making reviews per neighbourhood over time. The increase in groups could be due to a larger, more varied Yelp user base as the platform establishes itself. However, it may also be due to the signalling effect of Yelp.

9. Conclusions

The Toronto Urban Evolution Model provides an interesting framework for thinking about how urban areas may evolve overtime. The introduction of formemes as both the representation of a spatial area’s “genes” and as what is signalled among spatial areas provides an intriguing way of how to think about urban evolution. The model has been applied descriptively to several examples of urban evolution [4,8,9,10,11]. The goal of this research is to explore how large amounts of data can be encoded in the model, and to see what insights the model enables us to draw. Yelp data was chosen both for its availability and that it reduces model complexity by having a single activity. However, Yelp data presents many challenges, including the lack of precision in its category taxonomy, business choice of categories, lack of groupings of individual reviewers, and the extent which reviews are consistent with actual activity in a neighbourhood.
Despite the limitations of the Yelp data, the application of TUEM has led to a number of insights, such as the persistence of forms in certain neighbourhoods over time (amidst broader social change), and the ability of these persistent forms to draw new groups to the neighbourhood. However, the most interesting insights emerged from the formetic distance between pairs of neighbourhoods in Toronto and between Toronto and Montreal. Neighourhoods found to be formetically close to each were confirmed by their descriptive characterizations.
The analysis performed here is only the tip of the iceberg. With higher quality data and more diverse types of data, we can only imagine the insights TUEM will afford us.

Author Contributions

Conceptualization, M.S.F., D.S.; Methodology: M.S.F.; Formal Analysis, M.S.F., X.Z.; Writing, M.S.F., D.S., X.Z.; Review: M.S.F., D.S.; Visualization: X.Z.; Data Curation: T.S. All authors have read and agreed to the published version of the manuscript.

Funding

This work was supported, in part, by a University of Toronto Connaught Global Challenge Award, and the University of Toronto School of Cities Urban Challenge Fund.

Acknowledgments

We thank for their input during the development of this work Rob Wright, Ultan Byrne, Khalil Martin, Noga Keidar, Fernando Calderon Figueroa, Clara Bitter, Andre Sorenson, Marion Blute, Juste Raimbault, Yaara Rosner-Manor, Bernard Koch, and Abid Mehmood.

Conflicts of Interest

The authors declare no conflict of interest.

Appendix A. Formal Model

This section summarizes the formal model introduced in Part II [1].
At the core of the model is the spatial area that is being modelled.
   C: the set of all spatial areas in the domain.
Members of C can be spatially related using standard geo-spatial or administrative primitives. We denote that spatial area c2 is contained within or equal to spatial area c1 by: c2 ⊆ c1. A model can be created for any member of C, allowing for the modelling of an urban area at different levels of aggregation and alternative spatial boundaries.
Our model of a spatial area c has three “components”:
   P: the set of all possible types of physical forms in the domain.
   A: the set of all possible types of activities (uses) in the domain.
   G: the set of all possible types of groups (users) in the domain.
Any member of a component is referred to as an element (e). For example, a warehouse is an element of the component P. The elements of each component determine how expressive the model will be.
Central to our model is the recognition that P, A and G are interdependent. Forms enable activities performed by groups. But the relationship is not uni-directional. Groups enact their own interpretation of forms in order to carry out activities for which the forms may not have been designed.
To capture the relationship among elements of P, A and G, we introduce the concept of Formeme. Formemes encode the information in a space, enabling their replication elsewhere, their maintenance into the future, or their recoding into new configurations. A Formeme f is defined to be a triple composed of P, A and G.
f = <f[p], f[a], f[g]> where f[p] ⊆ P ∧ f[g] ⊆ G ∧ f[a] ⊆ A.
f[p] can be understood as a way of encoding space with a physical design, which we might summarize “be made out of this stuff arranged in this way”.
The Genome of a spatial area captures its physical forms and their expected activities and groups. It codifies the evolution of a spatial area at some time t. It defines the expected uses of the urban form in terms of the activities to be performed and the groups who are to perform them.
We define a genome U as a set of Formemes:
U = {u|Formeme(u)}
Expressed another way, U is a subset of the powerset of Formemes: U ⊆ 𝓕
We define
   ui: the ith formeme in U
   ui [p]: the set of forms in the ith formeme in U
   ui [a]: the set of activities in the ith formeme in U
   ui [g]: the set of groups in the ith formeme in U
We define the Urban Genome (aka U Genome) as tying a specific genome U to a spatial location c, at time t:
Genome(c, t, U, w) where,
   c: denotes a spatial area
   t: denotes the time at which the genome describes c,
   w: denotes the world in which U exists. [In most cases, we will omit this parameter, but when we need to compare alternative scenarios for the for the same space c and time t, w will be used to distinguish them (i.e., alternative worlds)].
In this document we sometimes use the function UG:
UG(c, t) = U = {u|Formeme(u)}
in other words c and t uniquely identify a specific genome.
If the genome describes the way a space is organized physically and for certain uses and users, it does not determine that it will in fact be used that way. Hence we refer to Hunome H: the actual as opposed to expected uses, users, and things they use. This introduces the beginning of a dynamic component to the model. We define uses, users and what they use as a set of Formemes H (aka H Genome). U is what the space expects from its users; H is what the users expect from their spaces.
H = {h|Formeme(h)}
Expressed another way, H is a subset of the powerset of Formemes: H ⊆ 𝓕
We define
   hi: the ith formeme in H
   hi [p]: the set of physical forms in the ith formeme in H
   hi [a]: the set of activities in the ith formeme in H
   hi [g]: the set of groups in the ith formeme in H
and
   H[p] = ⨆i hi[p] set of all forms in H
   H[a] = ⨆i hi[a] set of all activities in H
   H[g] = ⨆i hi[g] set of all groups in H
We can now define the function HG:
   HG(c, t) = H = {hi|formeme(hi)} for some space c at time t
Signals are crucial in our urban evolutionary model. Any code must be communicated via some mechanism and we call that mechanism the Signal (S). We define S to be a set of signals, where each signal is composed of a
  • formeme that communicates a fragment of a genome. This fragment may be assimilated by another spatial area, first as a change to hunome H, and if it survives, eventually as a change to U;
  • the source of the signal a spatial area receives. Where a signal comes from affects how it is received;
  • method of communication. A formeme may be communicated in more than one way, and depending on the method of communication, the signal may travel only within c (intra-spatial signal), or between c’s (inter-spatial signal), or both (bi-spatial signal);
  • the capacity of a signal to alter the recoding costs in the area that receives the signal; and
  • the number of times the signal has been received. A signal that is received with a high frequency may have a higher probability of assimilation in H.
S = {si|si = <f, r, c, sf, cm, n>}
where
f is a formeme that is being signaled
r is a function that transforms the recoding cost function R in the receiving signature
c is a spatial area from which the signal originates
sf is a set of formemes that is the source of the signal in c
cm is the set of communication methods
n is the number of times si has been received from c during the time span of the signature
We define:
   si: the ith signal in S
   si[f]: is the Formeme f of the ith signal
   si[r]: is the recoding cost transform
   si[c]: is the spatial area from which the signal originates
   si[cm]: is the communication methods of the ith signal
   si,[n]: is the frequency of the ith signal
and
   S[p] = ⨆i si[p] set of all forms in S
   S[a] = ⨆i si[a] set of all activities in S
   S[g] = ⨆i si[g] set of all groups in S
   S[f] = ⨆i si[f] set of all formemes in S
To complete the definition of our model, we introduce a spatial area’s Signature. A signature combines the aforementioned concepts to provide a complete representation of a spatial area at some time t. It tells us what the spatial area was geared toward, i.e., the genome (U), the orientations of its actual users, uses and what is used, the hunome (H), and the formemes received as signals (S). In addition, a Signature includes a recoding cost function R which captures the cost of recoding/transforming a formeme into another. U, H, S and R are referred to as the constituents of the Signature.
Signature(c, t, U, H, S, R, w)
We can now define the function:
SIG(c, t, w) = <U, H, S, R>
in other words, the complete signature for space c at time t

Appendix B. Aggregate Groups

The following are the 35 aggregate groups. The second column identifies the set of Yelp categories that define the groupgenerated by the Apriori algorithm. The third column is the number of singleton groups (unique User IDs) that are members of the group. An examination of the categories used to defined the groups shows that the removal of the top level categories could have been extended to the next level of their taxonomy, or that two levels of category could be conjoined into a single category.
Group IDYelp CategoriesGroup Size
Group-1[‘American (New)’, ‘Bars’]7135
Group-2[‘American (New)’, ‘Breakfast & Brunch’]5475
Group-3[‘American (New)’, ‘Canadian (New)’]9337
Group-4[‘American (Traditional)’, ‘Bars’]7124
Group-5[‘American (Traditional)’, ‘Canadian (New)’]5675
Group-6[‘Bars’, ‘Breakfast & Brunch’]9845
Group-7[‘Bars’, ‘Burgers’]5485
Group-8[‘Bars’, ‘Cafes’]5093
Group-9[‘Bars’, ‘Canadian (New)’]12,015
Group-10[‘Bars’, ‘Cocktail Bars’]5216
Group-11[‘Bars’, ‘Coffee & Tea’]6709
Group-12[‘Bars’, ‘Italian’]7428
Group-13[‘Bars’, ‘Japanese’]6398
Group-14[‘Bars’, ‘Lounges’]5344
Group-15[‘Bars’, ‘Pubs’]9029
Group-16[‘Bars’, ‘Sandwiches’]5703
Group-17[‘Bars’, ‘Specialty Food’]5103
Group-18[‘Breakfast & Brunch’, ‘Canadian (New)’]8484
Group-19[‘Breakfast & Brunch’, ‘Coffee & Tea’]6466
Group-20[‘Breakfast & Brunch’, ‘Italian’]5701
Group-21[‘Breakfast & Brunch’, ‘Sandwiches’]5565
Group-22[‘Cafes’, ‘Coffee & Tea’]5689
Group-23[‘Canadian (New)’, ‘Coffee & Tea’]5520
Group-24[‘Canadian (New)’, ‘Italian’]5910
Group-25[‘Canadian (New)’, ‘Pubs’]5280
Group-26[‘Coffee & Tea’, ‘Desserts’]5143
Group-27[‘Ethnic Food’, ‘Specialty Food’]5061
Group-28[‘Italian’, ‘Pizza’]5874
Group-29[‘Japanese’, ‘Sushi Bars’]7071
Group-30[‘American (New)’, ‘Bars’, ‘Canadian (New)’]6863
Group-31[‘American (New)’, ‘Breakfast & Brunch’, ‘Canadian (New)’]5258
Group-32[‘American (Traditional)’, ‘Bars’, ‘Canadian (New)’]5031
Group-33[‘Bars’, ‘Breakfast & Brunch’, ‘Canadian (New)’]6658
Group-34[‘Bars’, ‘Canadian (New)’, ‘Italian’]5057
Group-35[‘Bars’, ‘Canadian (New)’, ‘Pubs’]5280

References

  1. Fox, M.; Silver, D.; Adler, P. Towards a Model of Urban Evolution II: Formal Model. Urban Science. 2022. Available online: https://osf.io/preprints/socarxiv/9pvq2/ (accessed on 1 April 2022).
  2. Silver, D.; Adler, P.; Fox, M.S. Towards a Model of Urban Evolution I: Context. Urban Science. 2022. Available online: https://osf.io/preprints/socarxiv/yubkr/ (accessed on 1 April 2022).
  3. Silver, D.; Fox, M.; Adler, P. Towards a Model of Urban Evolution Part III: Variation, Selection, Retention. Urban Science. 2022. Available online: https://osf.io/preprints/socarxiv/gtpfw/ (accessed on 1 April 2022).
  4. Silver, D.; Silva, T.H. Complex Causal Structures of Neighbourhood Change: Evidence from a Functionalist Model and Yelp Data. SocArXiv 2021. Available online: https://osf.io/preprints/socarxiv/wprf8/ (accessed on 1 April 2022). [CrossRef]
  5. Olson, A.W.; Zhang, K.; Calderon-Figueroa, F.; Yakubov, R.; Sanner, S.; Silver, D.; Arribas-Bel, D. Classification and regression via integer optimization for neighborhood change. Geogr. Anal. 2021, 53, 192–212. [Google Scholar] [CrossRef]
  6. Silver, D.; Clark, T.N.; Navarro Yanez, C.J. Scenes: Social context in an age of contingency. Soc. Forces 2010, 88, 2293–2324. [Google Scholar] [CrossRef]
  7. Han, J.; Pei, J.; Yin, Y. Mining frequent patterns without candidate generation. ACM Sigmod Rec. 2000, 29, 1–12. [Google Scholar] [CrossRef]
  8. Dias, F.; Silver, D. Neighborhood dynamics with unharmonized longitudinal data. Geogr. Anal. 2021, 53, 170–191. [Google Scholar] [CrossRef]
  9. Keidar, N. The Making of Urban Knowledge: Ideas, Cities, Gurus. Ph.D. Thesis, Department of Sociology, University of Toronto, Toronto, ON, Canada, 2021. [Google Scholar]
  10. Silver, D.; Byrne, U.; Adler, P. Venues and segregation: A revised Schelling model. PLoS ONE 2021, 16, e0242611. [Google Scholar] [CrossRef] [PubMed]
  11. Silver, D.; Silva, T.H. A Markov model of urban evolution: Neighbourhood change as a complex process. PLoS ONE 2021, 16, e0245357. [Google Scholar] [CrossRef] [PubMed]
Figure 1. City of Toronto 144 Neighbourhoods.
Urbansci 06 00086 g001
Figure 2. Waterfront Communities-The Island (77).
Urbansci 06 00086 g002
Figure 3. Weighted intersection of forms against weighted intersection of groups.
Urbansci 06 00086 g003
Figure 4. Subset of weighted intersection of forms against weighted intersection of groups.
Urbansci 06 00086 g004
Figure 5. Review Counts and Proportions of the Most Active Group.
Urbansci 06 00086 g005
Figure 6. Number of Groups in a Subset of Neighbourhoods.
Urbansci 06 00086 g006
Table 1. Waterfront Longitudinal Distance-Unaggregated Data.
Yr 1Yr 2Yr 3Yr 4Yr 5Yr 6
Yr 1 0.5360.6490.7430.810.84
Yr 2 0.5820.6980.7810.816
Yr 3 0.5970.7130.76
Yr 4 0.5920.669
Yr 5 0.549
Yr 6
Table 2. Longitudinal Analysis of the Waterfront Neighbourhood.
Year (1096)Dist. from Prior YearDist. from Year 1Waterfront Communities-The Island (77)
Exp # 10.0
PGATotal
1 Number of non-unique elements in component40314031403112,093
Number of unique elements in component644172312368
20.5360.536Number of non-unique elements in component44624462446213,386
Number of unique elements in component709227512985
Intersection of elements with prior year5113991911
Union of elements with prior year842359914442
Intersection %60.711.1100.020.5
Cumulative intersection since year 15113991911
Cumulative union since year 1842359914442
Cumulative Intersection %60.711.1100.020.5
30.5820.649Number of non-unique elements in component57985798579817,394
Number of unique elements in component809319014000
Intersection of elements with prior year56950711077
Union of elements with prior year949495815908
Intersection %60.010.2100.018.2
Cumulative intersection since year 14301961627
Cumulative union since year 11013617017184
Cumulative Intersection %42.43.2100.08.7
40.5970.743Number of non-unique elements in component80548054805424,162
Number of unique elements in component838469215531
Intersection of elements with prior year63664011277
Union of elements with prior year1011724218254
Intersection %62.98.8100.015.5
Cumulative intersection since year 13731171491
Cumulative union since year 1115010,024111,175
Cumulative Intersection %32.41.2100.04.4
50.5920.81Number of non-unique elements in component11,46311,46311,46334,389
Number of unique elements in component938656717506
Intersection of elements with prior year68399911683
Union of elements with prior year109310,260111,354
Intersection %62.59.7100.014.8
Cumulative intersection since year 1332821415
Cumulative union since year 1130615,221116,528
Cumulative Intersection %25.40.5100.02.5
60.5490.84Number of non-unique elements in component12,69912,69912,69938,097
Number of unique elements in component989759618586
Intersection of elements with prior year757125412012
Union of elements with prior year117012,909114,080
Intersection %64.79.7100.014.3
Cumulative intersection since year 1300541355
Cumulative union since year 1143821,085122,524
Cumulative Intersection %20.90.3100.01.6
Table 3. Transversal Distance-Unaggregated Elements.
Annex (95)Bathurst Manor (34)Church-Yonge Corridor (75)Danforth (66)Junction Area (90)Palmerston-Little Italy (80)Waterfront Communities-The Island (77)Wychwood (94)
Annex (95) 0.9970.7360.960.9480.8240.810.936
Bathurst Manor (34) 0.9980.9750.9820.9930.9980.983
Church-Yonge Corridor (75) 0.9670.9580.8570.7710.952
Danforth (66) 0.8220.9260.980.834
Junction Area (90) 0.8990.9740.796
Palmerston-Little Italy (80) 0.9010.882
Waterfront Communities-The Island (77) 0.967
Wychwood (94)
Table 4. Transversal Metrics: Annex-Bathurst.
Exp # 10.0PGATotal
Annex (95)44796311411
Bathurst Manor (34)411116
Intersection of elements0516
Union of elements45196911421
Intersection %0.00.5100.00.4
Table 5. Transversal Metrics: Annex-Church.
Exp # 10.0PGATotal
Annex (95)44796311411
Church-Yonge Corridor (75)437117611614
Intersection of elements03731374
Union of elements884176612651
Intersection %0.021.1100.014.1
Table 6. Transversal Metrics: Annex-Waterfront.
Exp # 10.0PGATotal
Annex (95)44796311411
Waterfront Communities-The Island (77)644172312368
Intersection of elements04261427
Union of elements1091226013352
Intersection %0.018.8100.012.7
Table 7. Yelp Top Level Categories.
Active LifeFinancial ServicesLocal ServicesReal Estate
Arts & EntertainmentFoodMass MediaReligious Organizations
AutomotiveHealth & MedicalNightlifeRestaurants
Beauty & SpasHome ServicesPetsShopping
EducationHotels & TravelProfessional Services
Event Planning & ServicesLocal FlavorPublic Services & Government
Table 8. Longitudinal Distance for Waterfront Neighbourhood.
Yr 1Yr 2Yr 3Yr 4Yr 5Yr 6
Yr 1 0.4710.5910.7010.7780.803
Yr 2 0.530.6610.7540.782
Yr 3 0.5630.6840.722
Yr 4 0.5590.622
Yr 5 0.494
Yr 6
Table 9. Longitudinal Analysis of Components for Waterfront Neighbourhood.
Year (1096)Dist. from Prior YearDist. from Year 1Waterfront Communities-The Island (77)
Exp # 10.1
PGATotal
1 Number of non-unique elements in component11,89111,89111,89135,673
Number of unique elements in component313172012034
20.4710.471Number of non-unique elements in component12,92712,92712,92738,781
Number of unique elements in component334227112606
Intersection of elements with prior year2893991689
Union of elements with prior year358359213951
Intersection %80.711.1100.017.4
Cumulative intersection since year 12893991689
Cumulative union since year 1358359213951
Cumulative Intersection %80.711.1100.017.4
30.530.591Number of non-unique elements in component16,27816,27816,27848,834
Number of unique elements in component376318813565
Intersection of elements with prior year3165071824
Union of elements with prior year394495215347
Intersection %80.210.2100.015.4
Cumulative intersection since year 12771961474
Cumulative union since year 1400616116562
Cumulative Intersection %69.23.2100.07.2
40.5630.701Number of non-unique elements in component22,71522,71522,71568,145
Number of unique elements in component377468915067
Intersection of elements with prior year3516391991
Union of elements with prior year402723817641
Intersection %87.38.8100.013.0
Cumulative intersection since year 12721171390
Cumulative union since year 141510,013110,429
Cumulative Intersection %65.51.2100.03.7
50.5590.778Number of non-unique elements in component33,40433,40433,404100,212
Number of unique elements in component399656416964
Intersection of elements with prior year36099911360
Union of elements with prior year41610,254110,671
Intersection %86.59.7100.012.7
Cumulative intersection since year 1270821353
Cumulative union since year 143815,207115,646
Cumulative Intersection %61.60.5100.02.3
60.4940.803Number of non-unique elements in component37,21137,21137,211111,633
Number of unique elements in component422759218015
Intersection of elements with prior year373125311627
Union of elements with prior year44812,903113,352
Intersection %83.39.7100.012.2
Cumulative intersection since year 1264541319
Cumulative union since year 147021,068121,539
Cumulative Intersection %56.20.3100.01.5
Table 10. Longitudinal Distance for Annex Neighbourhood.
Yr 1Yr 2Yr 3Yr 4Yr 5Yr 6
Yr 1 0.470.5710.6630.7090.727
Yr 2 0.5310.6420.6950.715
Yr 3 0.5590.6310.658
Yr 4 0.5310.57
Yr 5 0.496
Yr 6
Table 11. Longitudinal Analysis of Components for Annex Neighbourhood.
Year (1096)Dist. from Prior YearDist. from Year 1Annex (95)
Exp # 10.1
PGATotal
1 Number of non-unique elements in component50605060506015,180
Number of unique elements in component24696211209
20.470.47Number of non-unique elements in component51885188518815,564
Number of unique elements in component250123111482
Intersection of elements with prior year2142301445
Union of elements with prior year282196312246
Intersection %75.911.7100.019.8
Cumulative intersection since year 12142301445
Cumulative union since year 1282196312246
Cumulative Intersection %75.911.7100.019.8
30.5310.571Number of non-unique elements in component66376637663719,911
Number of unique elements in component258157311832
Intersection of elements with prior year2262281455
Union of elements with prior year282257612859
Intersection %80.18.9100.015.9
Cumulative intersection since year 1206881295
Cumulative union since year 1308325113560
Cumulative Intersection %66.92.7100.08.3
40.5590.663Number of non-unique elements in component85968596859625,788
Number of unique elements in component279220112481
Intersection of elements with prior year2322771510
Union of elements with prior year305349713803
Intersection %76.17.9100.013.4
Cumulative intersection since year 1198441243
Cumulative union since year 1330507615407
Cumulative Intersection %60.00.9100.04.5
50.5310.709Number of non-unique elements in component99739973997329,919
Number of unique elements in component282272213005
Intersection of elements with prior year2413571599
Union of elements with prior year320456614887
Intersection %75.37.8100.012.3
Cumulative intersection since year 1188211210
Cumulative union since year 1354726717622
Cumulative Intersection %53.10.3100.02.8
60.4960.727Number of non-unique elements in component11,02711,02711,02733,081
Number of unique elements in component300305413355
Intersection of elements with prior year2544161671
Union of elements with prior year328536015689
Intersection %77.47.8100.011.8
Cumulative intersection since year 1184131198
Cumulative union since year 13679680110,048
Cumulative Intersection %50.10.1100.02.0
Table 12. Transversal Distance for Year 1.
Annex (95)Bathurst Manor (34)Church-Yonge Corridor (75)Danforth (66)Junction Area (90)Palmerston-Little Italy (80)Waterfront Communities-The Island (77)Wychwood (94)
Annex (95) 0.9950.530.9350.9080.70.6680.899
Bathurst Manor (34) 0.9960.9730.980.990.9980.976
Church-Yonge Corridor (75) 0.9470.9270.7570.5930.919
Danforth (66) 0.7060.8760.9660.759
Junction Area (90) 0.8350.9550.704
Palmerston-Little Italy (80) 0.840.814
Waterfront Communities-The Island (77) 0.948
Wychwood (94)
Table 13. Year 1 Transversal Metrics Annex-Church.
PGATotal
Annex (95)24696211209
Church-Yonge Corridor (75)249117611436
Intersection1733731547
Union332176512098
Intersection %52.1%21.1%100%26.1%
Table 14. Year 1 Transversal Metrics Annex-Bathurst.
PGATotal
Annex (95)24696211209
Bathurst Manor (34)1111123
Intersection65112
Union25196811220
Intersection %2.4%0.5%100%1%
Table 15. Year 1 Transversal Metrics Annex-Waterfront.
PGATotal
Annex (95)24696211209
Waterfront Communities-The Island (77)313172012034
Intersection1824261609
Union377225612634
Intersection %48.3%18.9%100%23.1%
Table 16. Longitudinal Distance for Waterfront Neighbourhood.
Yr 1Yr 2Yr 3Yr 4Yr 5Yr 6
Yr 1 0.2040.3640.5390.670.703
Yr 2 0.3080.4970.640.676
Yr 3 3550.5370.58
Yr 4 3660.433
Yr 5 0.238
Yr 6
Table 17. Longitudinal Analysis of Components for Waterfront Neighbourhood.
YearDistance from Prior YearDistance from Year 1Waterfront Communities-The Island (77)
Exp # 11
PGATotal
1 Number of non-unique elements in component2398239823987194
Number of unique elements in component3134181732
20.2040.204Number of non-unique elements in component3016301630169048
Number of unique elements in component3345791914
Intersection of elements with prior year289391329
Union of elements with prior year35895811317
Intersection %80.74.1100.025.0
Cumulative intersection since year 1289391329
Cumulative union since year 135895811317
Cumulative Intersection %80.74.1100.025.0
30.3080.364Number of non-unique elements in component39223922392211,766
Number of unique elements in component37680611183
Intersection of elements with prior year316451362
Union of elements with prior year394134011735
Intersection %80.23.4100.020.9
Cumulative intersection since year 1277331311
Cumulative union since year 1400171312114
Cumulative Intersection %69.21.9100.014.7
40.3550.539Number of non-unique elements in component53085308530815,924
Number of unique elements in component377126511643
Intersection of elements with prior year351481400
Union of elements with prior year402202312426
Intersection %87.32.4100.016.5
Cumulative intersection since year 1272331306
Cumulative union since year 1415292113337
Cumulative Intersection %65.51.1100.09.2
50.3660.67Number of non-unique elements in component71257125712521,375
Number of unique elements in component399170012100
Intersection of elements with prior year360611422
Union of elements with prior year416290413321
Intersection %86.52.1100.012.7
Cumulative intersection since year 1270331304
Cumulative union since year 1438454114980
Cumulative Intersection %61.60.7100.06.1
60.2380.703Number of non-unique elements in component87038703870326,109
Number of unique elements in component422209112514
Intersection of elements with prior year373671441
Union of elements with prior year448372414173
Intersection %83.31.8100.010.6
Cumulative intersection since year 1264331298
Cumulative union since year 1470652917000
Cumulative Intersection %56.20.5100.04.3
Table 18. Longitudinal Distance for Annex Neighbourhood.
Yr 1Yr 2Yr 3Yr 4Yr 5Yr 6
Yr 1 0.2070.3020.4560.5350.562
Yr 2 0.2860.4490.530.556
Yr 3 0.3340.4290.459
Yr 4 0.2840.342
Yr 5 0.243
Yr 6
Table 19. Longitudinal Analysis of Components for Annex Neighbourhood.
YearDistance from Prior YearDistance from Year 1Annex (95)
Exp # 11
PGATotal
1 Number of non-unique elements in component1369136913694107
Number of unique elements in component2462201467
20.2070.207Number of non-unique elements in component1629162916294887
Number of unique elements in component2502871538
Intersection of elements with prior year214361251
Union of elements with prior year2824711754
Intersection %75.97.6100.033.3
Cumulative intersection since year 1214361251
Cumulative union since year 12824711754
Cumulative Intersection %75.97.6100.033.3
30.2860.302Number of non-unique elements in component2072207220726216
Number of unique elements in component2583861645
Intersection of elements with prior year226391266
Union of elements with prior year2826341917
Intersection %80.16.2100.029.0
Cumulative intersection since year 1206301237
Cumulative union since year 130881611125
Cumulative Intersection %66.93.7100.021.1
40.3340.456Number of non-unique elements in component2758275827588274
Number of unique elements in component2796071887
Intersection of elements with prior year232411274
Union of elements with prior year30595211258
Intersection %76.14.3100.021.8
Cumulative intersection since year 1198301229
Cumulative union since year 1330137811709
Cumulative Intersection %60.02.2100.013.4
50.2840.535Number of non-unique elements in component3278327832789834
Number of unique elements in component2827091992
Intersection of elements with prior year241451287
Union of elements with prior year320127111592
Intersection %75.33.5100.018.0
Cumulative intersection since year 1188301219
Cumulative union since year 1354203012385
Cumulative Intersection %53.11.5100.09.2
60.2430.562Number of non-unique elements in component40224022402212,066
Number of unique elements in component30094311244
Intersection of elements with prior year254471302
Union of elements with prior year328160511934
Intersection %77.42.9100.015.6
Cumulative intersection since year 1184301215
Cumulative union since year 1367291313281
Cumulative Intersection %50.11.0100.06.6
Table 20. Transversal Distance for Year 1—Aggregated Forms and Groups.
nnex (95)Bathurst Manor (34)Bay Street Corridor (76)Church-Yonge Corridor (75)Danforth (66)Junction Area (90)Palmerston-Little Italy (80)Waterfront Communities-The Island (77)Wychwood
x (95) 0.9940.4430.370.9170.8830.6230.5850.874
nor (34) 0.9960.9950.9580.9690.9880.9970.968
Bay Street Corridor (76) 0.3380.9420.9210.7390.4250.914
Church-Yonge Corridor (75) 0.9330.9080.6970.4820.897
Danforth (66) 0.5050.8230.9580.602
Junction Area (90) 0.7740.9430.535
Palmerston-Little Italy (80) 0.8120.743
Waterfront Communities-The Island (77) 0.938
Wychwood (94)
Table 21. Year 1 Transversal Metrics Annex-Bathurst Manor.
Exp # 11PGATotal
Annex (95)2462201467
Bathurst Manor (34)114116
Intersection of elements6219
Union of elements2512221474
Intersection %2.40.9100.01.9
Table 22. Year 1 Transversal Metrics Annex-Waterfront.
Exp # 11-2PGATotal
Annex (95)2462201467
Waterfront Communities-The Island (77)3134181732
Intersection of elements182421225
Union of elements3775961974
Intersection %48.37.0100.023.1
Table 23. Year 1 Transversal Metrics Annex-Church-Yonge.
Exp # 11PGATotal
Annex (95)2462201467
Church-Yonge Corridor (75)2592571517
Intersection of elements173411215
Union of elements3324361769
Intersection %52.19.4100.028.0
Table 24. Transversal Distances between Neighborhoods in Toronto and Montreal for Year 1–Aggregated Forms and Groups.
Annex (95)Bathurst Manor (34)Bay Street Corridor (76)Lachine-OuestRené-LévesqueSainte-Marie
Annex (95) 0.9940.4881.00.5650.962
Bathurst Manor (34) 0.9960.9740.9940.931
Bay Street Corridor (76) 1.00.6270.973
Lachine-Ouest 0.9990.994
René-Lévesque 0.952
Sainte-Marie
Table 25. Year 1 Transversal Metrics Annex–René-Lévesque.
Exp # 12PGATotal
Annex (T)25876611025
René-Lévesque (M)27399311267
Intersection of elements1741551330
Union of elements357160411962
Intersection %48.79.7100.016.8
Intersection % in Annex (T)67.420.2100.032.2
Intersection % in René-Lévesque (M)63.715.6100.026.0
Table 26. Year 1 Transversal Metrics Bay Street Corridor–René-Lévesque.
Exp # 12PGATotal
Bay Street Corridor (76)327113311461
René-Lévesque27399311267
Intersection of elements2012181420
Union of elements399190812308
Intersection %50.411.4100.018.2
Intersection % in Annex (T)61.419.2100.028.7
Intersection % in René-Lévesque (M)73.622.0100.033.1
Table 27. Comparative Longitudinal Analysis.
YearForm (P)Group (G)
AnnexWaterfrontAnnexWaterfront
275.980.77.64.1
366.969.23.71.9
46065.52.20.7
553.161.61.50.7
650.156.21.00.5
Publisher’s Note: MDPI stays neutral with regard to jurisdictional claims in published maps and institutional affiliations.

