Article

Evaluating the Potential of Landsat Satellite Data to Monitor the Effectiveness of Measures to Mitigate Urban Heat Islands: A Case Study for Stuttgart (Germany)

Department of Geography, Ludwig-Maximilians-Universität München, Luisenstr. 37, 80333 Munich, Germany
*
Author to whom correspondence should be addressed.
Urban Sci. 2022, 6(4), 82; https://doi.org/10.3390/urbansci6040082
Submission received: 5 August 2022 / Revised: 21 October 2022 / Accepted: 3 November 2022 / Published: 9 November 2022

Abstract

:
The urban heat island (UHI) effect is a serious health risk for people living in cities and thus calls for effective mitigation strategies in urban areas. Satellite data enable monitoring of the surface urban heat island (SUHI) over large areas at high spatial resolution. Here we analysed SUHI in the city of Stuttgart (Germany) based on land surface temperature (LST) data from Landsat at 30 m resolution. The overall SUHI in Stuttgart decreased by 1.4 °C between the investigated time periods 2004–2008 and 2016–2020, while the absolute LST increased by 2.5 °C. We identified local hotspots of strong warming and cooling in Stuttgart through the change in SUHI and categorised them based on the predominant land cover change occurring at the hotspot using the Normalised Difference Vegetation Index (NDVI) from Landsat as well as visual information on land cover changes from Google Earth Pro. The establishment of green roofs, as well as albedo changes, are predominantly responsible for cooling spots, while warming spots are mostly associated with the sealing of surfaces. This highlights that vegetation has a dominant influence on SUHI development in Stuttgart. Combining satellite-based LST data with visual information thus provides an effective method to identify local warming and cooling hotspots, which allows monitoring of the success of city policies against heat stress and guides future policy.

1. Introduction

Climate change has severe consequences for natural and anthropogenic systems. These encompass an increase in weather and climate extremes with associated damages and losses to nature and people [1]. Urban areas are particularly vulnerable to the impacts of climate change due to their high population density. Additionally, temperatures in urban areas are often higher than in the surroundings due to the urban heat island (UHI) effect. UHI is caused by different factors, such as the high degree of sealed surfaces in cities (particularly due to construction materials used for roads and buildings), the anthropogenic heat produced by industry and traffic, and the high absorption fraction of solar radiation by dark construction materials due to their low albedo. As a result, the surface temperature in cities can reach over 60 °C on asphalt and concrete surfaces, especially during hot summer days [2].
In Germany, the frequency of heat waves is expected to triple by 2100 in comparison to the present climate, and their duration is projected to increase by 25% [2]. As a consequence, the number of heat-related deaths from ischaemic heart diseases is expected to increase by about 2.4 times in Germany [3]. High temperatures disproportionately affect vulnerable groups such as elderly people, children, and people suffering from diseases. Therefore, effective and adequate adaptation strategies to the impacts of climate change are essential to minimise the exposure of vulnerable people [1]. The adaptation in cities is particularly important due to their high exposure to the impacts of climate change caused, among others, by the UHI effect [4].
The effects of UHI span a wide range of spatial scales (i.e., from body heat to weather patterns), with different predominant forces at play [5]. Additionally, the spatial heterogeneity of UHI is often large, mostly as a consequence of the spatial heterogeneity of urban land cover. In order to account for the spatial variability of UHI in a reasonable way, observation-based UHI studies often use satellite data, which can deliver data at adequate spatial resolution. Satellite data measure UHI based on land surface temperature (LST) instead of near-surface air temperature, yielding the surface UHI (SUHI). Several studies correlated the spatial distribution and temporal changes in satellite-derived SUHI to the prevailing land cover and land use patterns and their temporal changes. Cover indices and supervised classifications are often utilised to distinguish between different types of urban land cover. Hereby, studies investigated several factors influencing SUHI, for example, vegetated area [6,7,8], built-up area [7,8,9], population [10,11], or city growth [12,13]. Chen et al. [14] found a decrease in the Normalised Difference Vegetation Index (NDVI) with a concomitant increase in LST for Beijing in areas with intense urbanisation. Mathew et al. [15] identified a connection between LST and vegetation indices for Jaipur (India), and additionally, they found a seasonal relation between LST and the normalised difference built-up index (NDBI) that can be used to identify built-up areas. An example of supervised classification is the usage of a supervised image classification technique by Pal and Ziaul [9] to detect land use and land cover classes in the Malda District (India) in order to subsequently compare them with LST. While some satellite-based studies assessed UHI at a single point in time [7,8], others analysed the interannual variability [12,15,16,17] and long-term dynamics of UHI [6,11,14,18].
The mentioned studies demonstrate the feasibility of satellite data to obtain information on SUHI changes and their potential drivers. Building on this, we used LST and NDVI data from satellites to identify and map hotspots of SUHI changes, which were then manually categorised into different classes of land cover changes based on aerial images from Google Earth Pro. This allowed us to quantify the impact of specific land cover changes on local SUHI. The analysis was performed for the city of Stuttgart (Germany) for the time periods 2004–2008 and 2016–2020, focusing on the areas with the largest SUHI changes between both time periods. A somewhat similar approach was applied by Sarahet al. [19], who used MODIS and Google Earth images to identify two examples of land cover change that influenced SUHI in Coventry (UK). Our approach substantially extended this approach by (1) identifying SUHI hotspots based on the LST distribution in the whole city, (2) providing spatially explicit SUHI data at these hotspots, and (3) categorising the SUHI changes based on the land cover change that occurred at each hotspot.
Our study city Stuttgart is located in the south-west of Germany. It has around 610,000 inhabitants [20]. Stuttgart’s centre is situated at an altitude of around 250 m above sea level. The city is characterised by a mild climate with mean annual precipitation of about 650 mm, an annual mean temperature of 10.8 °C, an average summer temperature of 19.3 °C, and monthly summer maximum temperatures between 27.0 °C and 38.8 °C (from 1991 to 2020) [21]. The city’s climate is influenced by its surrounding peripheral heights. Due to its topography and valley location, Stuttgart is exposed to a low exchange of air within the urban area, which leads to heat accumulation in the city [22]. The municipality of Stuttgart actively designs policies to mitigate the impacts of heat and climate change and has been awarded prizes for its strategies to preserve green spaces and fresh air corridors to reduce heat stress [23]. Heat stress in Stuttgart was analysed in several studies, for example, regarding potential adaptation measures to urban heat stress (such as urban trees) [24], quantifying the impact of UHI mitigation measures on air quality [25], or analysing the seasonal impacts of factors such as wind and elevation on LST [26]. Further, Stuttgart was used as an example for analysing frameworks and mitigation measures in place to develop a cool city [22]. Our study complemented these analyses by focusing on the effects that specific land cover changes have on SUHI and by examining whether the success of heat mitigation policies, such as those implemented by the municipality of Stuttgart, can be identified and monitored with satellite data.

2. Materials and Methods

2.1. Data

In order to study small-scale features of SUHI in Stuttgart, we employed LST data from Landsat Level 2 products (derived from the thermal bands of the Landsat satellites [27,28,29,30]), which have a spatial resolution of 30 m. As summarised by Deilami et al. [13], Landsat data were used in several other studies to examine SUHI. The Landsat archive provides LST data records from 1982 to the present [31]. Landsat’s revisit time in the Stuttgart area is around 8–9 days, which yields an advantage over data from other sensors, such as ASTER, with much longer revisit times, as Landsat can deliver higher amounts of cloud-free data. For the study periods (2004–2008 and 2016–2020), data from Landsat 5 (L5) and Landsat 8 (L8) were used. Data from Landsat 7 were not included due to the Scan Line Corrector Failure of its sensor [32]. L5 and L8 data were taken from Landsat Collection 2, which contains calculated LST derived from the thermal sensors of the Landsat satellites and further datasets [27,28,29,30,33,34,35]. The underlying spatial resolution of the thermal data from L5 is 120 m and 100 m for L8. In the final Level 2 product, the data were interpolated to a 30 m grid [36]. The average accuracy of the resulting data from L5 was estimated at 1 °C over non-sealed, mostly vegetated land, with a total uncertainty of 2.5 °C [37]. However, this uncertainty could also be connected to differences in the in situ data resolution and pixel size and might thus also be lower. The performance of the LST retrieval is consistent for L5 and L8 [38]. The LST product lacks data on some areas of the study region [31]. These missing areas are marked in all figures. Further, we used the atmospherically corrected near-infrared (NIR) and red (L5: 3 and 4; L8 4 and 5) bands from the Landsat Collection 2 to calculate NDVI. Although studies confirm the consistency of NDVI derived from L5 and L7, slight discrepancies of up to 5% were found between L8 and its predecessor, L7, due to differences in sensor settings [39,40,41]. The comparison of the resulting NDVI data from L5 and L8 may thus have to be treated with caution. All used Landsat images were taken from the platform EarthExplorer as 200 km x 200 km tiles. All satellite images over Stuttgart are recorded at around 9 a.m. local time.
We masked areas with strongly deviating heights (±100 m) based on data from the TanDEM-X digital elevation model (retrieved over the period 2010–2015) [42,43] at 90 m spatial resolution. Further, we identified and distinguished urban and rural areas based on the CORINE Land Cover dataset [44], which contains satellite-derived land cover data for Europe in 2018. The administrative boundaries of Stuttgart were taken from the Geoportal Stuttgart [45]. Lastly, multitemporal high-resolution satellite and aerial images from Google Earth Pro were used to examine the type of land cover change. We used images from 2000 to 2021 as they exhibited the best image quality.
Additionally, to compare the results from LST data to near-surface air temperature measurements, hourly temperature data measured at 2 m height from meteorological stations of the German Weather Service (DWD) located in and around Stuttgart were used (see Table A2) [46].

2.2. Methods

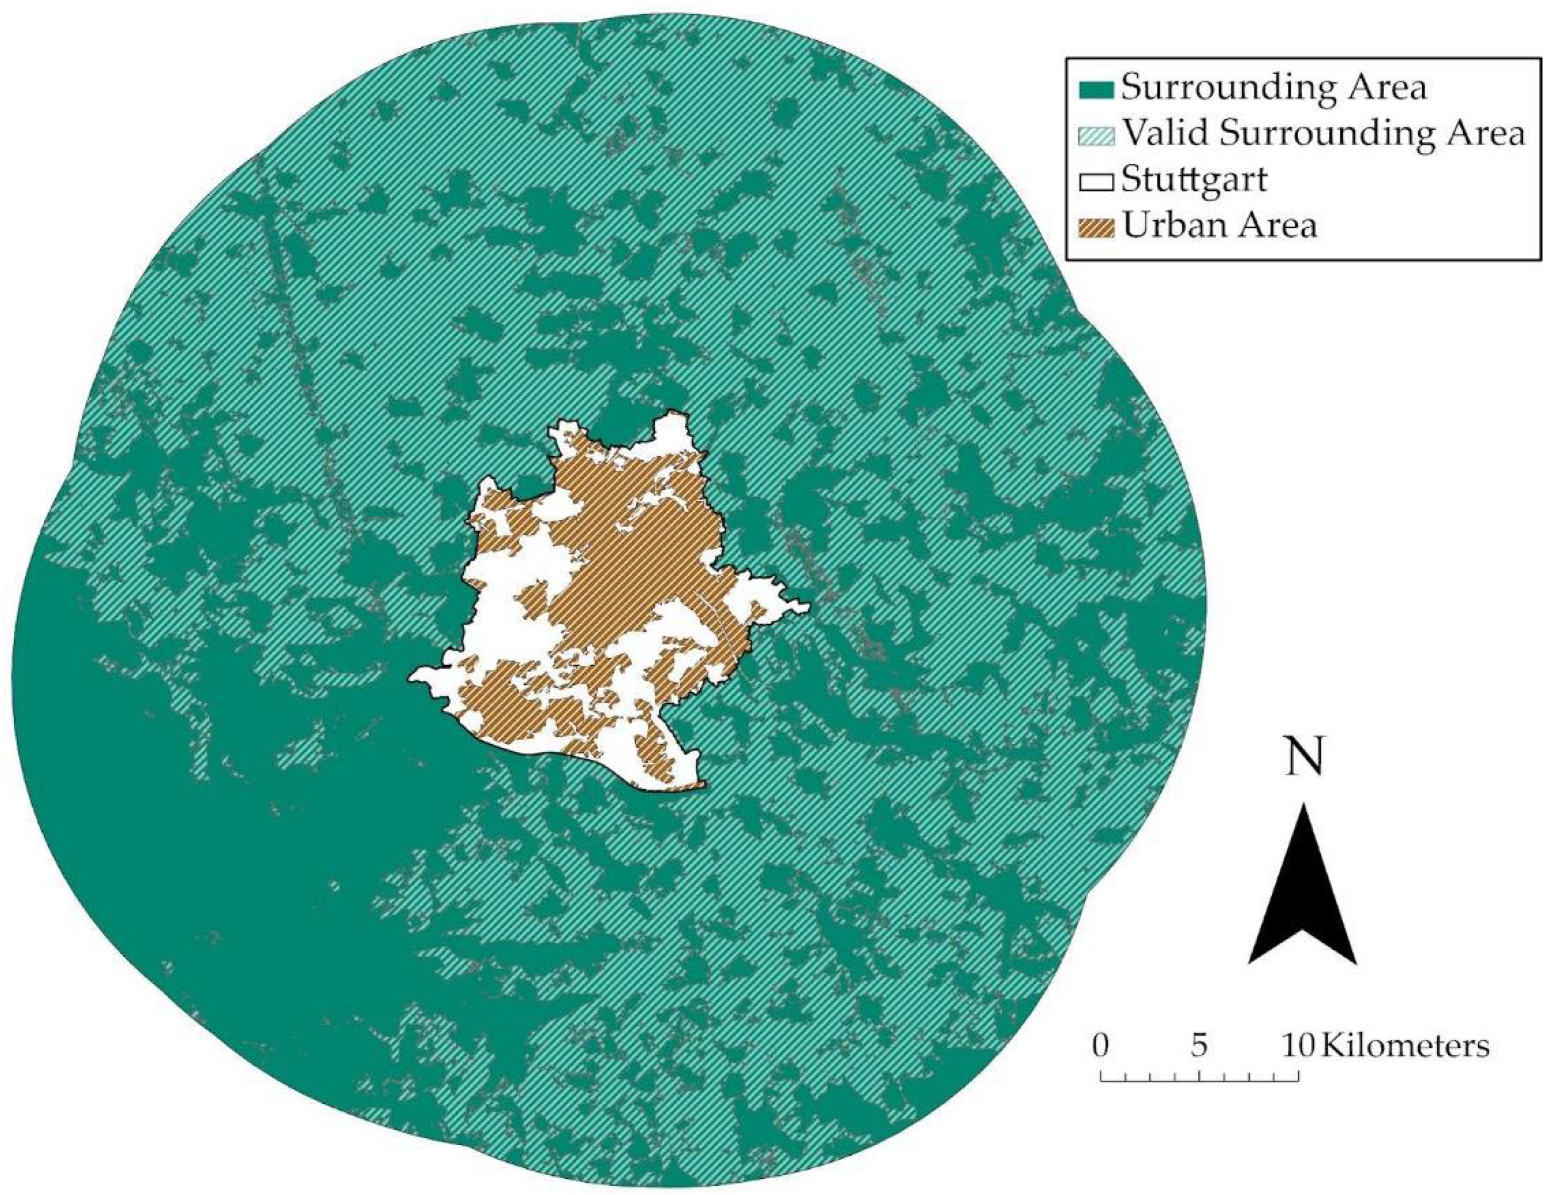
We calculated SUHI in Stuttgart as the LST difference between the urban area and the surrounding rural areas. Under the assumption that the larger-scale climate variability in Stuttgart and its surrounding areas are similar, this approach also eliminates any influence due to climate variability. Landsat LST data were used to calculate the mean SUHI in two five-year periods (2004–2008 and 2016–2020) for examining the change in SUHI over time, i.e., between the two periods. We selected five-year periods to further reduce the influence of climate variability and to obtain a representative picture of the spatial SUHI patterns in both analysed time periods. Further, using five-year time periods allows for gathering enough cloud-free data to enable a robust estimate of the average LST in Stuttgart. In order to observe changes in the urban landscape in Stuttgart, we used two periods with a sufficient temporal gap. Further, we tried to avoid extreme climatic summers (e.g., 2003) as best as possible. In order to focus on the warmest time of the year (during which negative impacts on human health due to extreme heat are strongest [47]), we used data from June, July, and August, which are the hottest months in Stuttgart. The Landsat tiles were presorted, and only tiles with low cloud coverage were further processed: within the administrative boundaries of Stuttgart, a maximum cloud and cloud shadow coverage of 0.5% was permitted, while in the surrounding areas, the maximum cloud cover threshold was set to 10%. All tiles that do not meet these criteria were excluded to avoid biases from varying cloud cover. After this processing, seven tiles remained for the period 2004–2008 and seven tiles for the period 2016–2020 (see Table A1). The recording dates of the tiles are equally distributed over the summer months. In order to further exclude influences from the clouds remaining in the tiles, cloud masks were implemented based on the cloud detection layer contained in the Landsat level 2 data. For the surrounding area, the mask includes every cloud from every tile from both time periods to avoid biases that would be introduced by including areas in one period but not the other. The resulting area for the calculation of the mean LST for the surrounding area is shown in Figure A1. A cloud mask was also applied to the urban area of Stuttgart, yet only for single tiles, as cloud coverage in the selected tiles was very low within the city boundaries due to the low maximum cloud threshold allowed within the city boundaries.
The basic method of using a buffer around the city to subtract LST in the rural area from LST in the urban area to quantify SUHI was adopted from Debbage and Shepherd [48]. However, we subtracted the mean LST of the surrounding area from every pixel in the administrative boundaries, not from the mean LST over the entire area of the city. This allows for the analysis of the temporal and spatial dynamics of SUHI. Further, the confounding factors that we controlled for when defining the surrounding area to calculate the mean rural LST were adjusted to the local circumstances. The buffer size of 50 km was reduced to 20 km, as Stuttgart has a smaller area than the cities in Debbage and Shepherd [48]. Additionally, the maximum height deviation from the mean elevation of Stuttgart was increased from ±50 m to ±100 m due to Stuttgart’s strong surrounding orography based on data from TanDEM-X DEM. Only non-urban areas were included in the calculation of the mean LST of the surrounding area, as identified by the CORINE Land cover dataset.
Eventually, we obtained the spatially explicit SUHI for Stuttgart by subtracting the five-year LST mean averaged over the entire surrounding area (after masking it based on the mentioned criteria) from the five-year LST mean on every pixel in the administrative area of Stuttgart, referred to as SUHI2004–2008 and SUHI2016–2020. The change in SUHI between both time periods (ΔSUHI) is then calculated for each pixel as follows:
Δ SUHI = LST city , t 1 LST rural , t 1 SUHI 2016 2020 LST city , t 2 LST rural , t 2 SUHI 2004 2008
For calculating the change in NDVI within the administrative boundaries of Stuttgart, a similar approach as for calculating ΔLST was applied. First, the same cloud mask used for LST was applied within the city boundaries. Then, similarly to SUHI, a five-year mean was calculated for every pixel, yielding NDVI2004–2008 and NDVI2016–2020. Eventually, the difference between these means was calculated, resulting in the NDVI change between both time periods (ΔNDVI).
In order to specifically focus on pixels with the most extreme SUHI changes between 2004–2008 and 2016–2020, the 2nd and 98th percentiles of the ΔSUHI values were calculated. Pixels with lower (higher) ΔSUHI than the 2nd (98th) percentile are referred to as cooling (warming) spots. Extreme spots consisting of three or fewer pixels were disregarded. We only focused on urban areas and excluded extreme spots that occurred in any other areas within Stuttgart (e.g., agricultural land) from the analysis. In order to examine the type of land cover change that took place at the extreme spots, multitemporal images from Google Earth Pro were used. Consequently, only land cover changes that were identifiable by the visible inspection were analysed.
Near-surface air temperature measured at DWD stations was used for the comparison with LST data. The mean temperature on all summer days (June, July, and August) within each five-year period was separately calculated for urban and rural areas using all urban and rural stations, respectively. UHI was then calculated for every summer day by the difference between urban and rural temperatures. These daily values were then used to calculate the overall mean temperature in urban and rural areas and UHI in each five-year period.
The code used for the analysis is published on Github under: https://github.com/g-seeberg/UHIPY (accessed on 6 September 2022).

2.3. Categorisation of Land Cover Changes

In order to investigate the influence of different land cover changes on LST in Stuttgart, we categorised them by different types (Table 1). The categories were chosen based on the prevalent land cover changes observable at the warming and cooling spots in Stuttgart. In case multiple land cover changes are identified in a connected area, the area was manually subdivided according to the individual land cover changes. We identified the following categories:
The sealing of surfaces often causes warming due to the usage of materials that retain less water than vegetation and soil and thus reduce evapotranspirative cooling. As the heat capacity also often increases, sealed surfaces raise both daytime and nighttime temperatures [13,49]. Conversely, unsealing of surfaces usually leads to cooling. Both categories were further subdivided depending on whether fallow land (sealing of fallow land/unsealing to fallow land) or vegetation (sealing of vegetated area /unsealing to vegetated area) was present before or after the change.
Albedo increase and albedo decrease lead to cooling or warming effects, respectively. Albedo influences the reflective, absorptive, radiative, and convective transfer properties of the surface [50]. As most land cover changes go along with a change in albedo, LST changes were only attributed to albedo change if albedo change appeared to be the dominant cause.
The installation of solar panels can lead to both cooling and warming. Solar panels extrude energy, as a share of solar radiation is absorbed and transferred into electricity, while, on the other hand, the heat produced by electric losses may counteract this cooling effect [51].
The category vegetation/vegetation change can also induce cooling or warming. The greening of vegetation as well as a denser and healthier vegetation cover, can lead to evapotranspirative cooling, while a decrease in vegetation cover or vegetation health may cause higher temperatures due to decreased evapotranspirative cooling. Additionally, changes in vegetation management can also influence LST [52].
Areas with newly installed green roofs and other areas with added vegetation exhibit a cooling effect through increased evapotranspiration and decreased shortwave radiation if trees are present [53]. We separately investigated green roof retrofits (installed on existing buildings and new buildings replacing old ones), the installation of green roofs on new buildings where fallow land was present before (green roof after fallow land), and the installation of green roofs on formally vegetated areas (green roof after vegetated area).
The removal of vegetation decreases evapotranspiration and, thus, increases LST. This category includes areas where vegetation is removed without adding additional sealed surfaces.
Modification of sports grounds refers to sports grounds whose surface material has been changed. This category mostly includes natural turf and tennis courts that were replaced by artificial surfaces such as artificial turf, which often leads to warming due to increased heat capacity, albedo, and surface roughness, as well as decreased evaporative cooling [54].
Temporary construction site is a category for areas under construction during the second study period (2016–2020). Here, multiple factors such as albedo changes, (un-)sealing, material changes, and anthropogenic heat may alter LST.
Structural change is a category for spots changed by construction work without any noticeable change in albedo or vegetation. In this case, non-visible changes in materials or building interiors may lead to changes in LST.
Dynamic changes include all temporary changes in the land surface, for instance, changes in parking lot occupancy and temporal buildings at event locations, that alter the thermal properties of the area at the time of data acquisition.
Uncategorised spots refer to all spots where no land cover change can be identified and where no other visible explanation causing a change in LST could be found.

3. Results

3.1. SUHI in Stuttgart and Its Temporal Change between 2004–2008 and 2016–2020

Stuttgart reveals a pronounced SUHI in both analysed time periods (Figure 1a,b). Urban areas within the administrative borders show an average SUHI of about 5.3 °C in 2004–2008 and 3.9 °C in 2016–2020, with individual areas exhibiting a SUHI of up to 23 °C. The non-urban areas of Stuttgart mostly have a negative SUHI, which is particularly pronounced in forests. SUHI generally decreased in Stuttgart between 2004–2008 and 2016–2020 (Figure 1c), particularly in the urban area, where ΔSUHI changed by −1.4 °C despite a mean LST increase of 2.5 °C (not shown). The SUHI change is statistically significant (paired t-test, p < 0.01). Contrary to the overall trend, some confined areas in Stuttgart reveal a positive ΔSUHI. These hotspots of ΔSUHI are analysed in more detail below. The non-urban areas reveal a smaller change in ΔSUHI compared to the urban areas, although some rural areas, such as fallow agricultural lands, show an increase in SUHI of up to 5 °C.
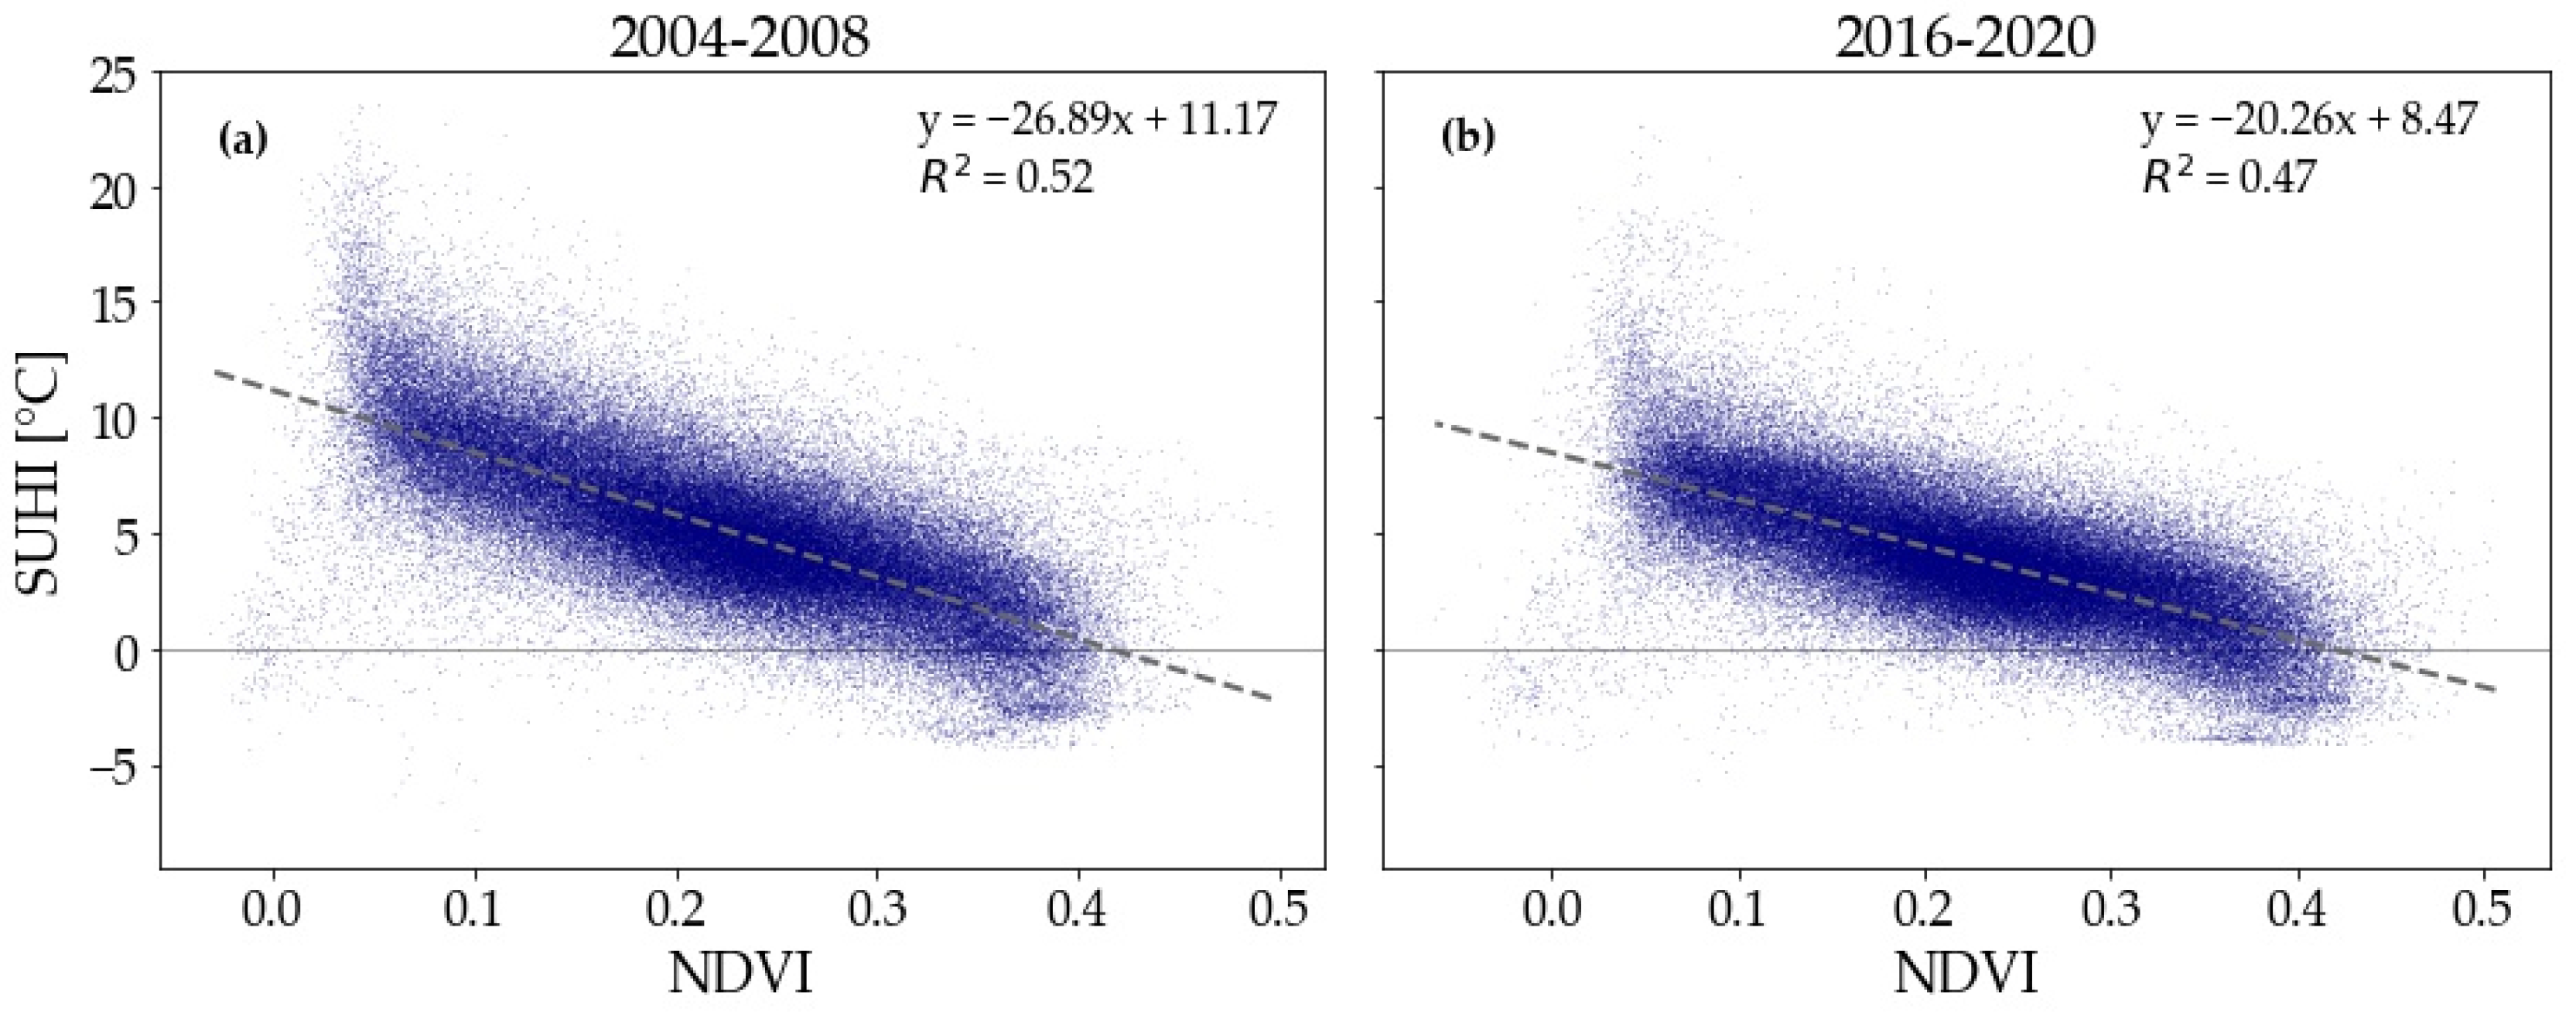
In order to investigate the influence of vegetation on LST in Stuttgart, we examined the correlation between SUHI and NDVI (Figure 2). Higher NDVI values correlate with lower SUHI values in Stuttgart´s urban area in both time periods. Pixels with high SUHI and low NDVI are predominantly found in industrial and commercial areas, while pixels with low SUHI and high NDVI are found in green urban areas (e.g., parks and sports facilities). A small cluster of values with low SUHI and low NDVI falls outside the overall linear dependence. For these pixels, no single type of urban land cover was found to be the most prevalent. Generally, there is a higher variance of SUHI at pixels with low NDVI, which implies that vegetation is not the only important factor in determining SUHI, as factors such as albedo or other properties of the material may also have a strong influence, especially in areas with low vegetation coverage.
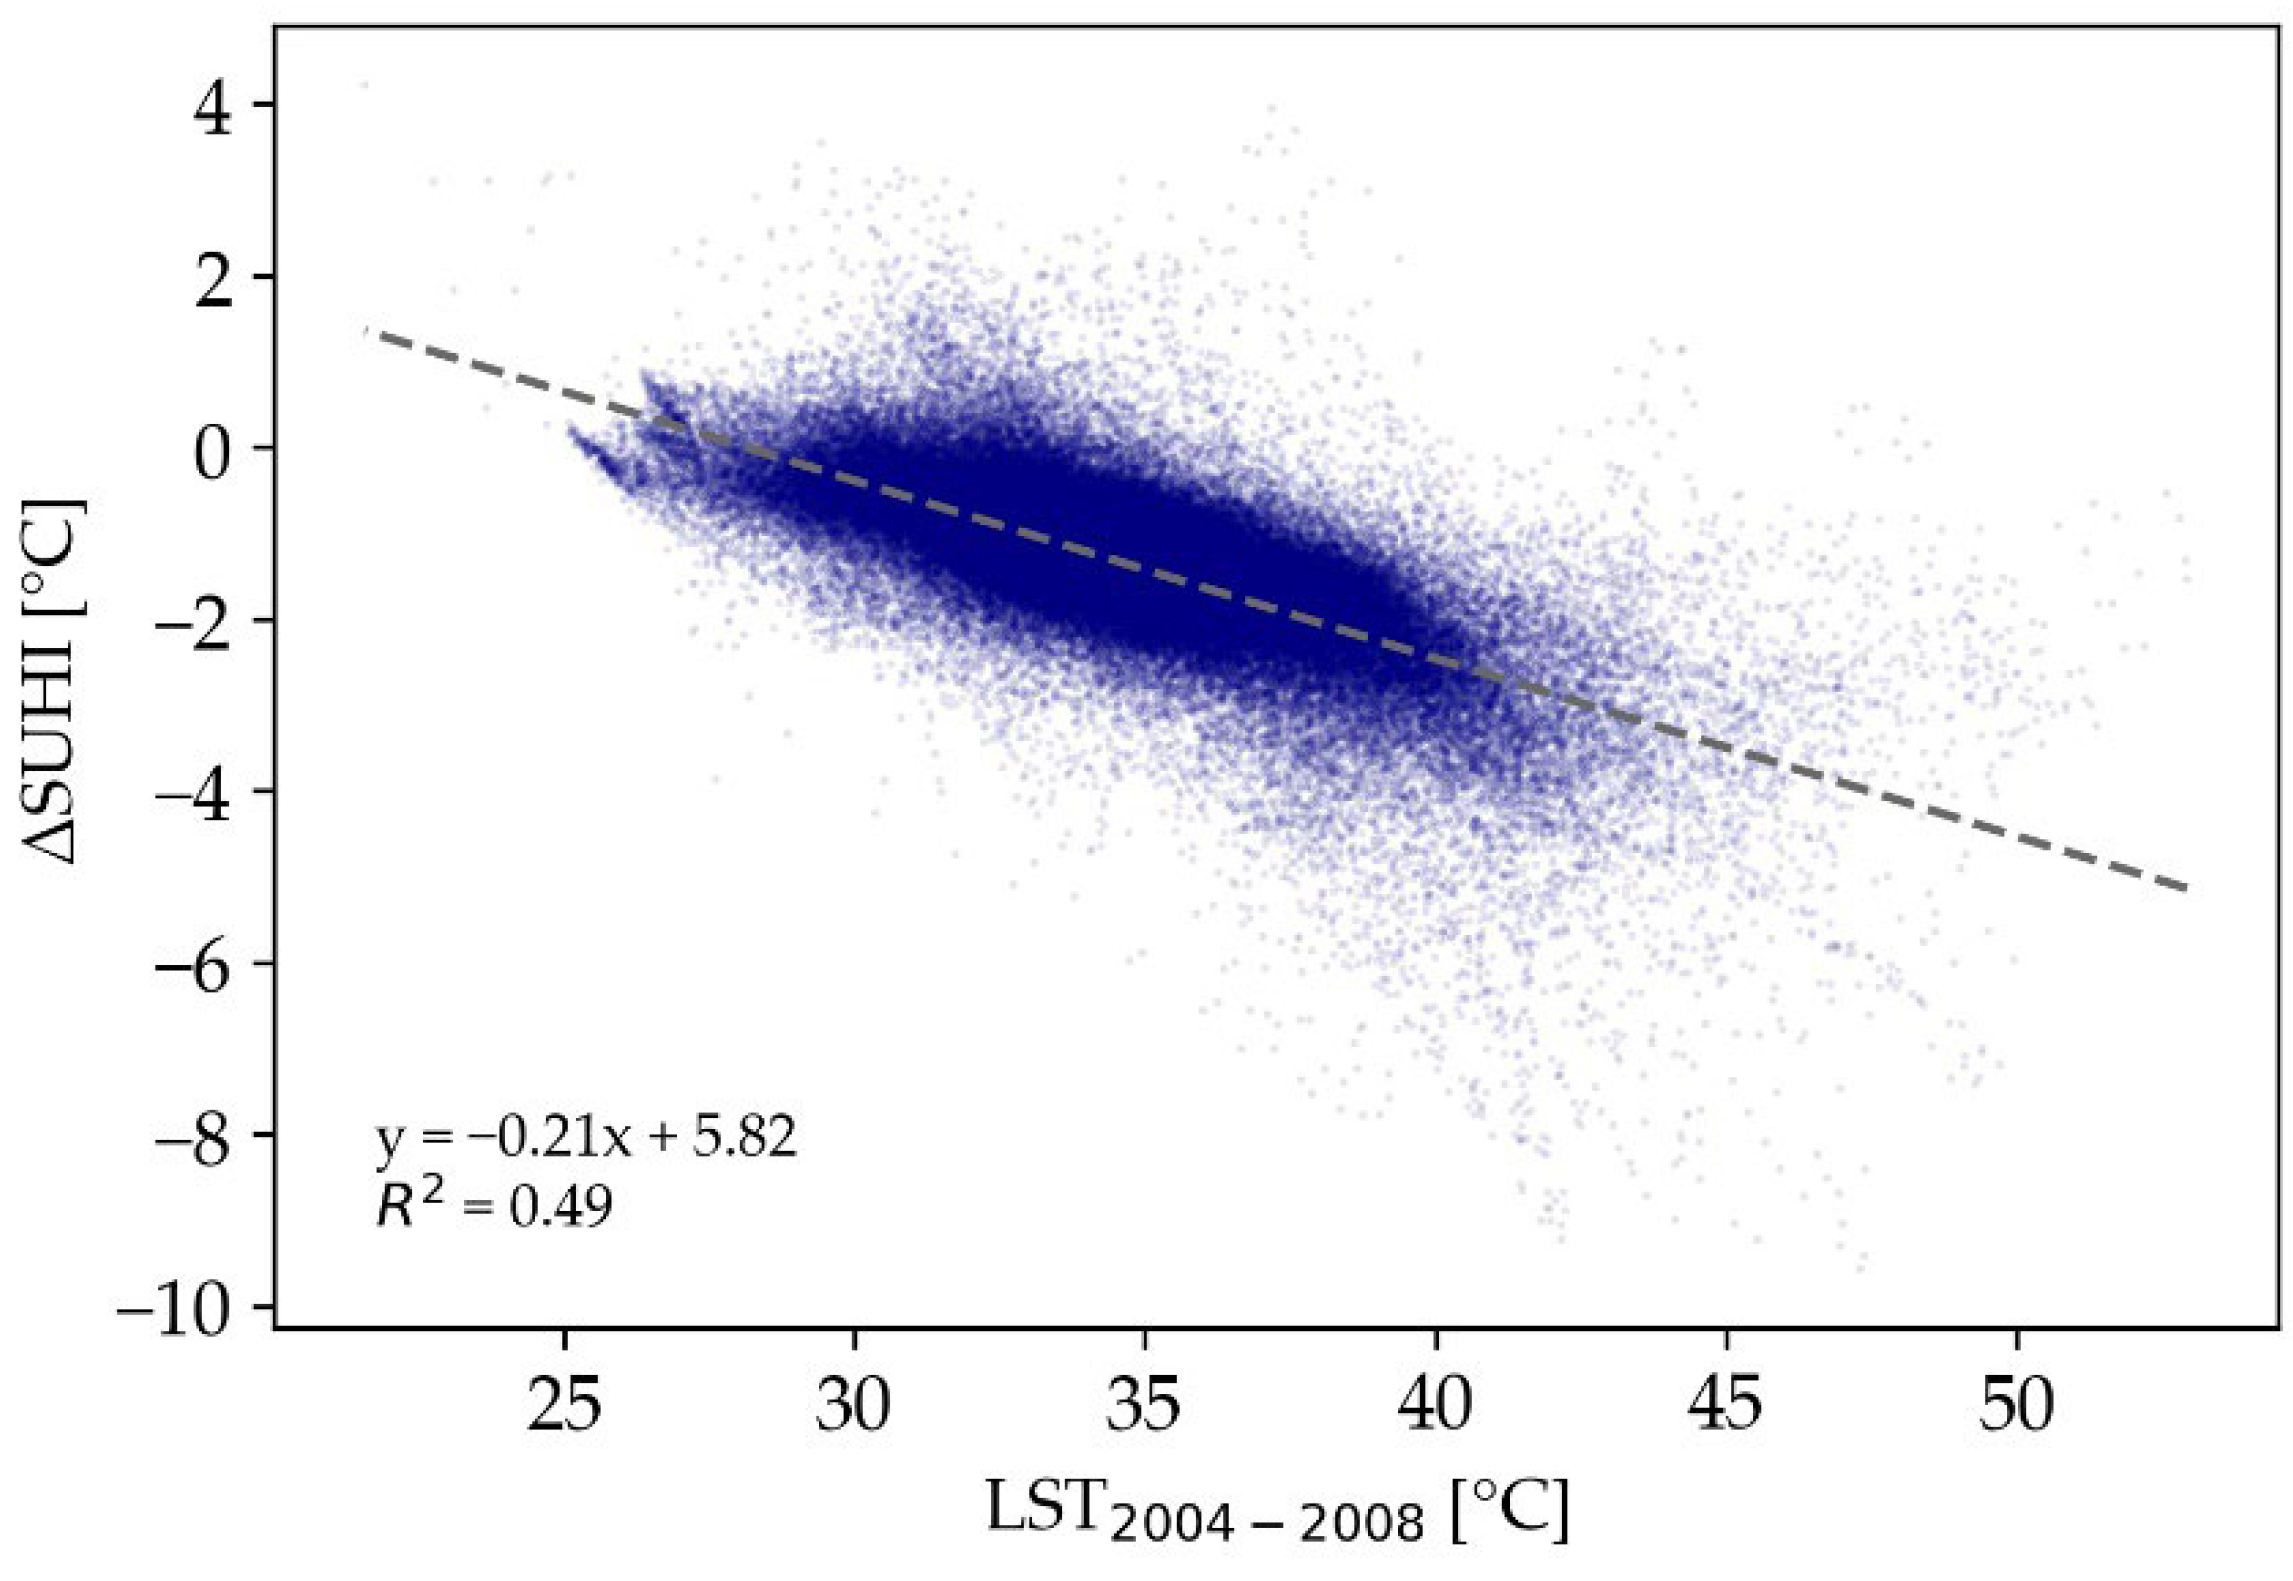
ΔSUHI clearly correlates with the initial LST in 2004–2008 (Figure 3). Areas with high LST in 2004–2008 exhibit a disproportionately stronger decrease in SUHI than areas with lower LST. As a result, the SUHI variance within the urban area decreased in 2016–2020 compared to 2004–2008.

3.2. Extreme Warming and Cooling Spots of SUHI

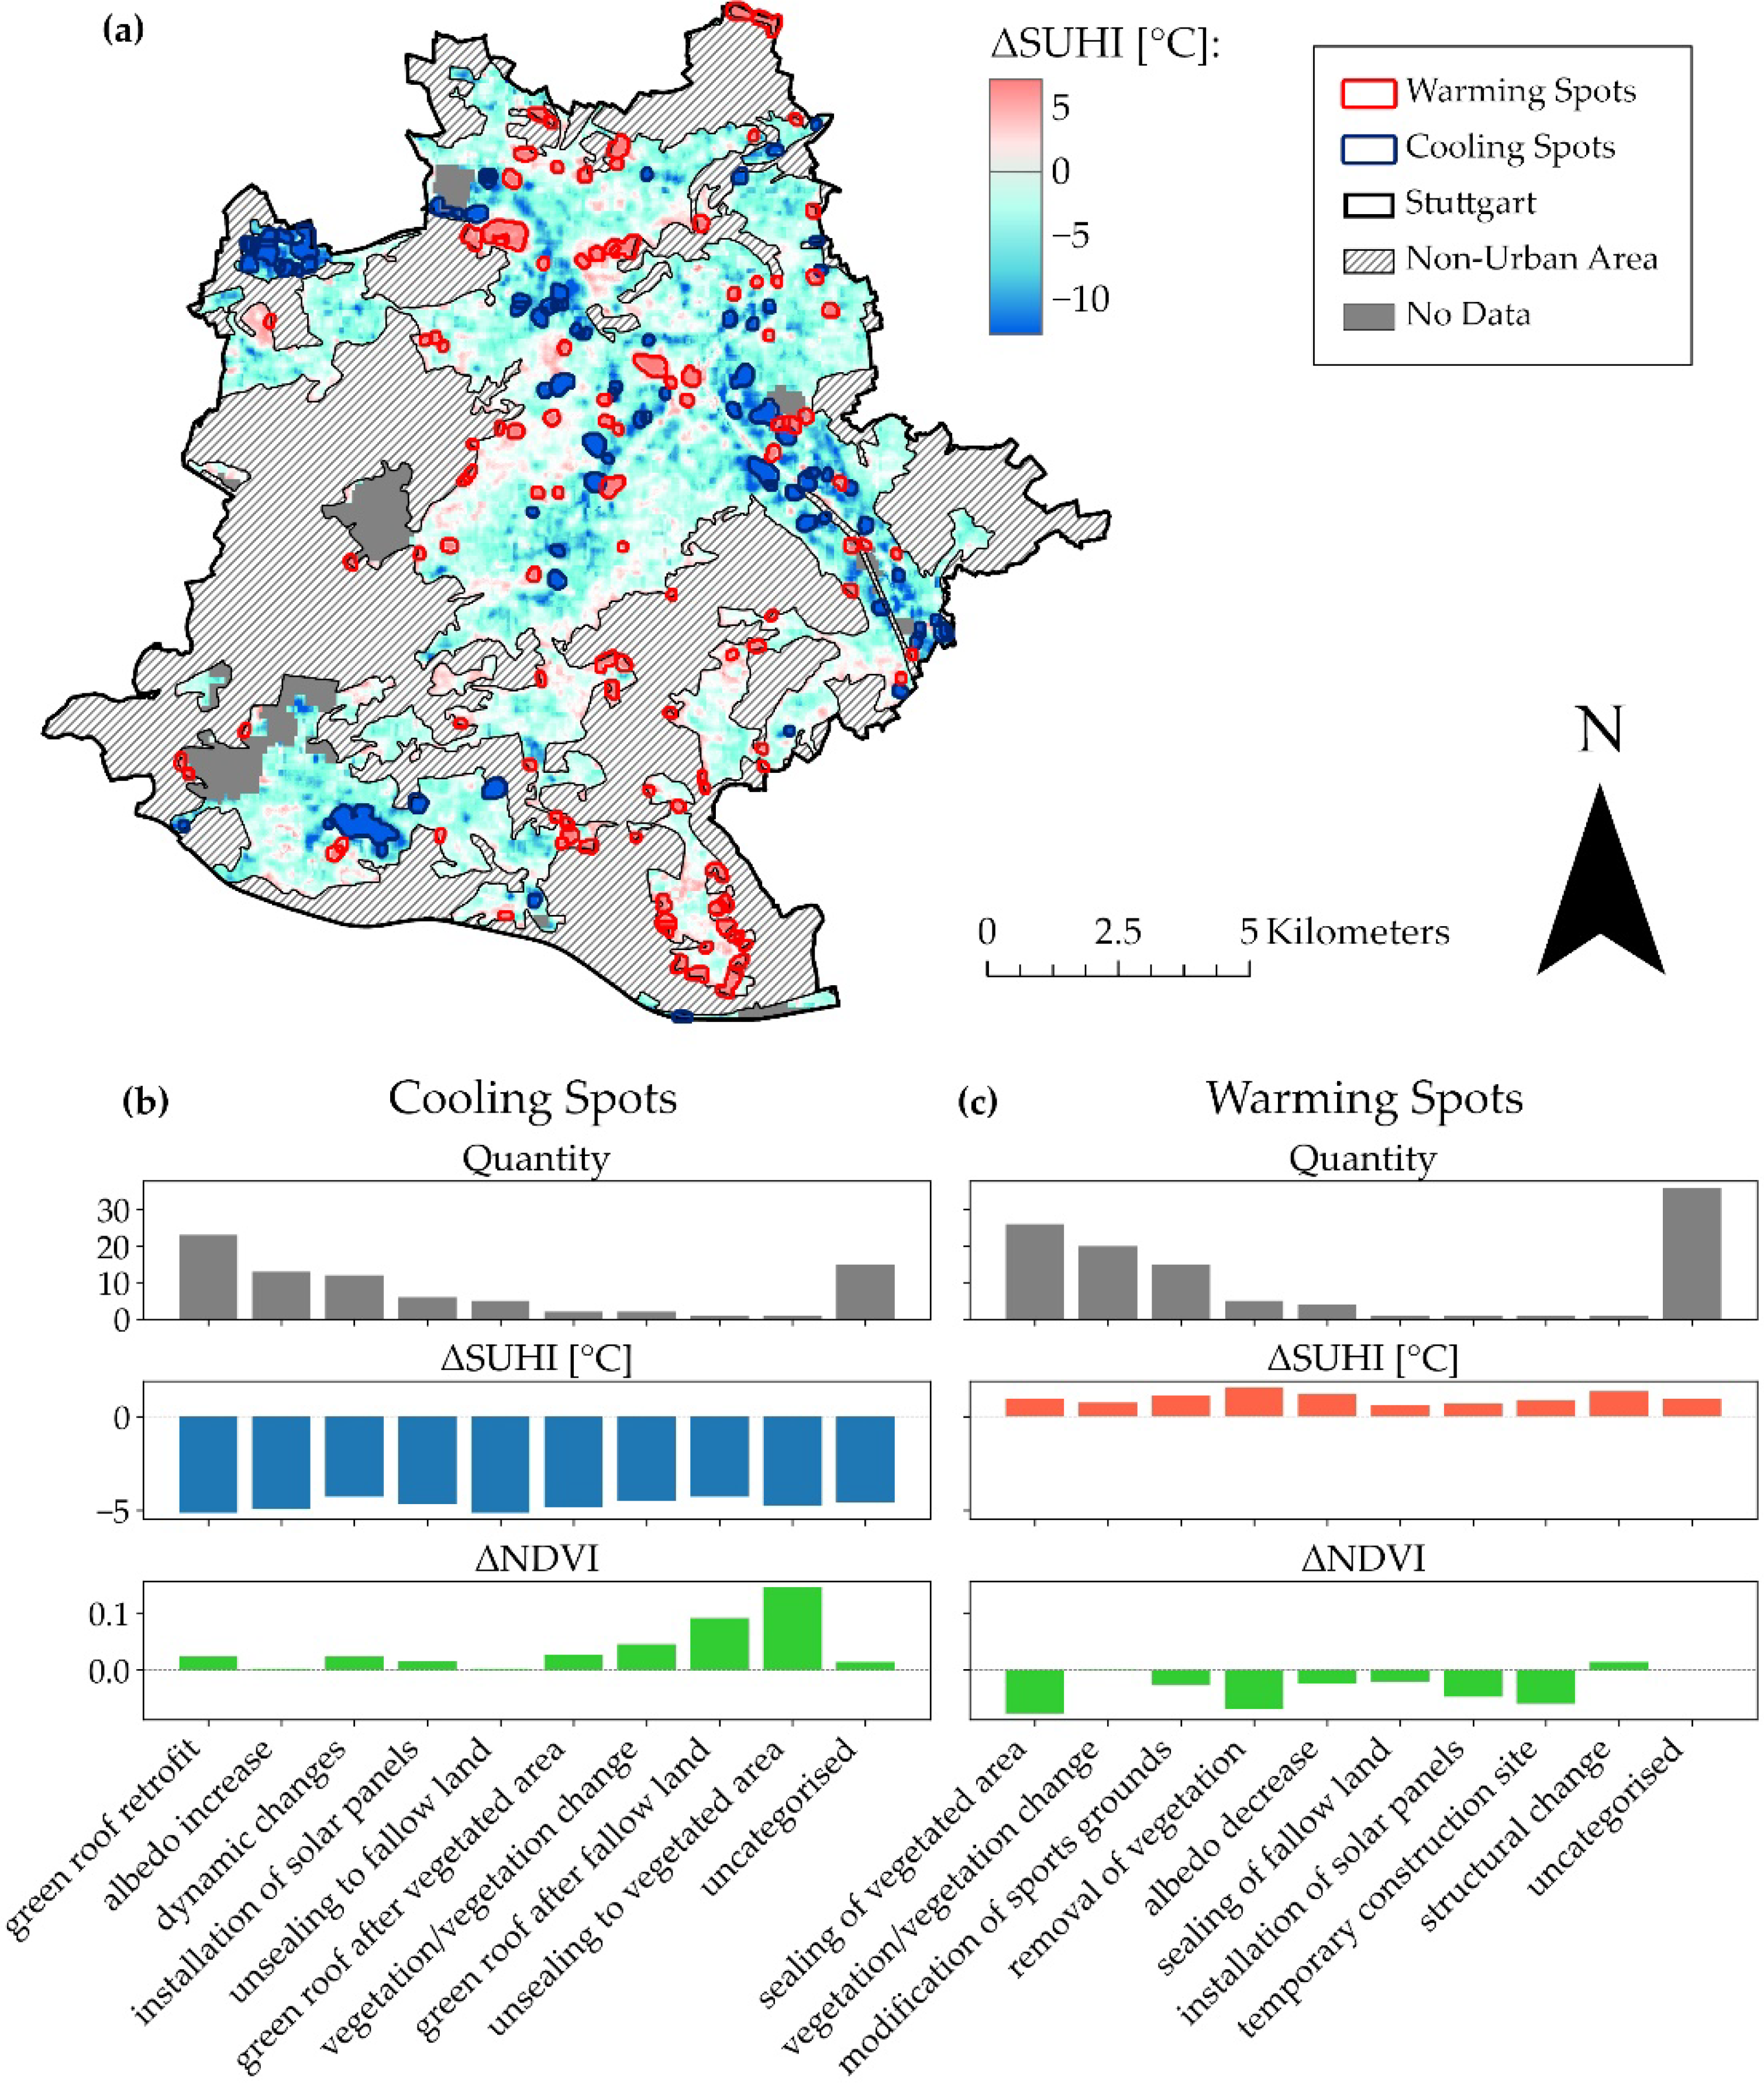
In order to analyse the drivers of the largest changes in SUHI between 2004–2008 and 2016–2020, we isolated the extreme warming and cooling spots based on the spatial distribution of ΔSUHI in Stuttgart (Figure 4). Overall, 80 cooling spots and 110 warming spots were identified. Cooling spots were predominantly found in central urban areas, while warming spots were especially present at the edges of urban areas. In the following, we analysed how different types of land cover changes influence ΔSUHI.
As shown in Figure 4b, most of the cooling spots belong to the categories green roof retrofit (29%), albedo increase (16%), and dynamic changes (15%). Installation of solar panels (8%) and unsealing to fallow land (6%) are also found frequently, while the other categories only play a minor role. 19% of the cooling spots remain uncategorised.
All cooling spots are very effective in decreasing SUHI, with the categories unsealing to fallow land and green roof retrofit exhibiting the highest decrease (−5.1 °C) and dynamic changes the smallest decrease (−4.3 °C). At all cooling spots, the absolute LST decreases despite an increase in the mean urban LST (not shown). The maximum decrease in LST is −1.3 °C (unsealing to fallow land), and the minimum decrease is −0.5 °C (dynamic changes). The NDVI of cooling spots either increases or stays constant, i.e., no decrease in NDVI is observable. Unsealing to vegetated area (+0.15), green roof after fallow land (+0.09) and vegetation/vegetation change (+0.05) leads to the highest increases in NDVI. Green roofs after vegetated area (+0.03) and green roof retrofit (+0.02), both categories that add vegetation to the site, also exhibit a positive change in NDVI.
Regarding warming spots, the categories sealing of vegetated area (24%), vegetation/vegetation change (18%), and modification of sports grounds (14%) are most prevalent (Figure 4c), with other types of changes only occurring rarely (fewer than five spots per category). A large share of warming spots remains uncategorised (33%).
Out of these categories, the removal of vegetation causes the strongest increase in SUHI (+1.6 °C), followed by structural change (+1.4 °C), albedo decrease (+1.2 °C), and modification of sports grounds (+1.1 °C). Sealing of fallow land has the lowest effect on SUHI increase (+0.6 °C). Although the SUHI increases at warming spots are relatively small compared to the SUHI decreases at cooling spots, the absolute LST increases strongly at all warming spots (by 4.4 °C to 5.4 °C). Most warming spots exhibit a negative change in NDVI, even though the change is not as pronounced as at the cooling spots. Warming spots with removed vegetation (sealing of vegetated area, removal of vegetation) exhibit the highest decrease in NDVI (−0.08, −0.07), while a smaller decrease in NDVI was found for sealing of fallow land (−0.02), albedo decrease (−0.02), and modification of sports ground (−0.03). The vegetation/vegetation change and uncategorised categories have no NDVI change, while areas with structural change show a slightly positive NDVI change (+0.01).
Overall, the increase in SUHI at warming spots (+1 °C on average) is relatively low compared to the strong SUHI decrease in cooling spots (−4.7 °C on average). This is in line with the general decrease in SUHI in Stuttgart between 2004–2008 and 2016–2020 (Figure 1c). SUHI decreases do not only occur at spots with a change in land cover but also in areas that remain unchanged. Thus, the change in SUHI at extreme spots is affected by both the local change in land cover as well as the general UHI decrease in Stuttgart. When accounting for this (by subtracting the average SUHI decrease of 1.4 °C), the average ΔSUHI of all cooling spots amounts to −3.3 °C and the average SUHI change in warming spots to +2.4 °C.
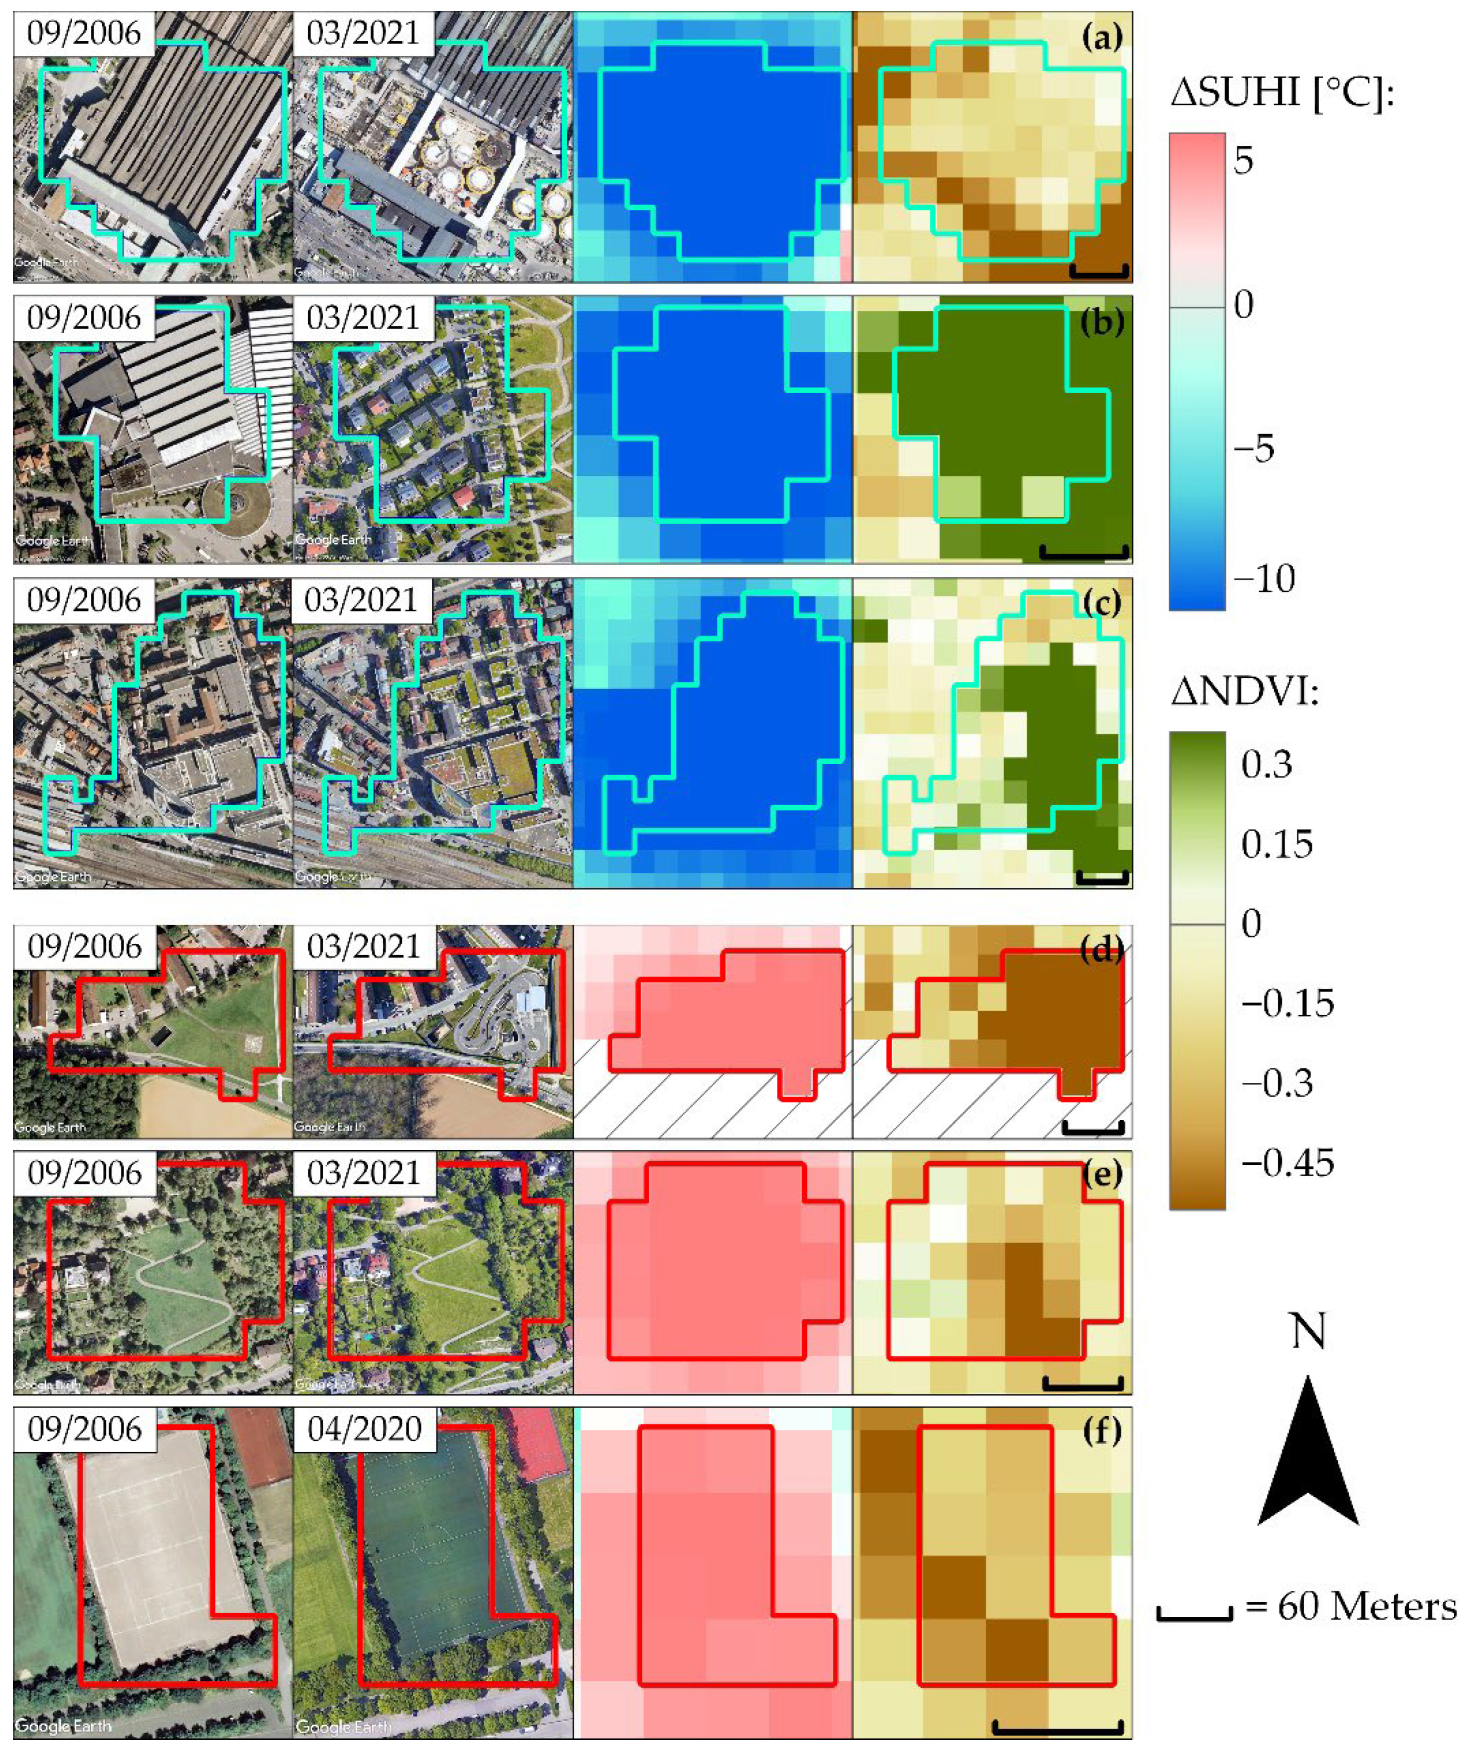
Figure 5 shows several examples of the influence of land cover changes on ΔSUHI. At the construction site of Stuttgart´s new central station (Stuttgart 21), albedo increased compared to the previous state (Figure 5a), while NDVI only changed slightly. The replacement of a large industrial hall with less dense housing and vegetation led to cooling (Figure 5b), as did the installation of green roofs on new houses and green roof retrofits (Figure 5c). In both cases, the additional vegetation led to an increase in NDVI. Figure 5d shows an example of warming caused by the removal of vegetation and surface sealing, which is reflected by the decrease in NDVI. An example of a vegetated surface with positive ΔSUHI but no land cover change is shown in Figure 5e. The decrease in NDVI indicates a decline in vegetation health, which may point to less evapotranspirative cooling and, thus, higher SUHI. Similar effects of increased SUHI at grassland sites can be seen all over the city. Figure 5f gives an example of a modified sports ground, where a concrete tennis court was converted into a pitch with artificial turf at the beginning of 2017 [55]. Such conversions of concrete surfaces to artificial turf, as well as conversions of natural turf to artificial turf or other artificial surfaces, were found at the same facility and all over the city.

4. Discussion

Combining satellite-based LST data with visual images to quantify SUHI in Stuttgart and its change between 2004–2008 and 2016–2020 allows us to quantify the spatiotemporal effect of specific land cover changes on SUHI. Our results show that this method can successfully be used to evaluate which changes in land cover affect SUHI in urban areas the most. This makes it possible to monitor, quantify, and assess the success of urban mitigation strategies at spatial scales down to 30 m (limited by the spatial resolution of the Landsat LST product). Additionally, the data are readily available and require no further processing to convert the measured thermal radiation into a usable surface temperature. We demonstrated the applicability for the city of Stuttgart, but the methodology can be applied analogously to other cities. Municipalities and city planners can benefit from this approach by learning which measures to reduce SUHI are most suitable and successful in their specific local context, which facilitates the planning of future SUHI mitigation actions.

4.1. Robustness of LST and SUHI Trends

LST values in the Stuttgart area were derived using seven Landsat tiles for each of the analysed periods 2004–2008 and 2016–2020. The relatively small number of utilisable tiles is determined by several factors: Landsat’s limited revisit time of the Stuttgart area (about 8–9 days), the presence of clouds at the time of recording, and our focus on summer months (June, July, August). Our estimates of LST and LST changes in Stuttgart may be influenced by the low number of utilisable tiles. In order to assess the robustness of our Landsat-based results, we compared them with data from meteorological stations of the DWD, using daily near-surface air temperature data recorded at 9 a.m. of stations lying in the Stuttgart area (see Table A2 for the list of stations) [46]. The average LST increase in Stuttgart (2.5 °C between 2004–2008 and 2016–2020) is in line with the trends of summer mean temperatures measured by DWD stations, which indicate an increase by 0.9 °C (from 20.3 °C to 21.2 °C) for the urban area and by 1.7 °C (from 19.5 °C to 21.2 °C) for the rural surroundings between 2004–2008 and 2016–2020.
In contrast to the LST increase, SUHI in Stuttgart decreased by 1.4 °C between 2004–2008 and 2016–2020. This decrease is consistent with results by Streutker [56] and Scott et al. [57], who found a negative relationship between increasing rural LSTs and SUHI intensity. Moreover, we found a similar result when using near-surface air temperature measurements from the DWD stations, yielding a UHI decrease of −0.77 °C [46]. An explanation for the decrease in SUHI and UHI might be the warming of some agricultural areas, especially fallow fields, in the surroundings of Stuttgart, which may have led to a disproportionate increase in the mean LST in these areas. Such a warming effect can also be observed in some non-urban areas of Stuttgart (Figure 1c). Further, ΔSUHI negatively correlates with the initial LST in 2004–2008 (Figure 3), with larger SUHI decreases for pixels that had higher initial LST, leading to a more homogeneous spatial LST distribution. In agreement with Alavipanah et al. [58], we found a negative correlation between vegetation cover and SUHI when analysing the urban area pixelwise (Figure 2). Albedo and surface material constitute further factors for LST changes, which may cause the larger LST variance in areas with low NDVI.

4.2. Drivers of Warming and Cooling Spots

All land cover changes made at cooling spots locally decrease SUHI and LST during a period of generally increasing summer LSTs in Stuttgart. Efforts to reduce LST through land cover changes may thus represent a valuable and powerful tool to mitigate both the SUHI effect and rising urban LSTs. Hereby, vegetation plays an important role, as enhancing NDVI clearly correlates with lower urban LST (Figure 2 and Figure 4b). However, the results of NDVI change may have to be treated with some caution due to slight discrepancies in NDVI retrievals between the satellites [39,40,41].
The impacts on LST may both extend beyond the pixels affected by land cover changes or be smaller. This suggests that the effect of land cover changes may also influence temperatures in neighbouring areas. Additionally, part of this effect might be explained by the percentiles set to identify warming and cooling spots (2% and 98% percentiles of the ΔSUHI distribution), as they limit the extent of the identified spots, while in some cases, an effect outside of the identified spot is clearly visible (e.g., Figure 5c).
An important measure for increasing urban vegetation coverage is the installation of green roofs (Figure 5c), as they exhibit a high cooling effect (Figure 4b). Their installation lowers air temperatures not only on the roofs but also on the pedestrian level [59]. Installing green roofs can be a very effective UHI mitigation effort, as existing buildings can be retrofitted without allocating valuable urban real estate space for additional vegetation. An additional benefit of green roofs is the decreased energy consumption for cooling in summer and heating in winter [60]. For Stuttgart, the extension of green roofs might be an appropriate option to mitigate UHI, as another 25% of Stuttgart´s existing roof area is suitable for installing green roofs [61]. Similarly, retrofitting high-albedo materials and paints on buildings or in public spaces could also effectively decrease SUHI in Stuttgart (Figure 4b). Increased albedo mitigates heat, especially during times of direct solar radiation, i.e., during the daytime [60]. The installation of solar panels can lead both to SUHI increases and decreases, potentially due to a combined effect of albedo change and heating from electricity losses, making the cooling or heating effect dependent on the properties of the previously used surface material. Different technical approaches have also been found to be successful in combining solar panels with green roofs [62,63]. We found dynamic changes to frequently have an impact on LST. Areas with strong surface dynamics, such as parking lots, can exhibit large LST changes depending on their occupancy at the time of data capture. Such temporary land cover changes, which may only be present within a few days of data capture, can impact the five-year LST mean. Although they have no permanent impact on SUHI, they may still be relevant in enhancing or mitigating the local SUHI effect when present. The method used here is not suitable for assessing such temporary land cover changes, as it rather focuses on LSTs averaged over longer time periods.
Vegetation also plays a core role in increasing SUHI, as most warming spots are characterised by the removal of vegetation and sealing of surfaces (Figure 5d), which is the most common land cover change causing extreme warming in Stuttgart. Other land cover changes with strong warming impacts are the decrease in albedo and the installation of artificial turf on old tennis courts or grass turf (Figure 5f). Substantial SUHI increases are also observed for spots with continuous vegetation (in contrast to areas with increasing vegetation, which generally result in a SUHI decrease, see above). Although no change in NDVI is observed for the average overall vegetation spots with increased SUHI, individual spots exhibit NDVI increases (max: +0.44) and decreases (min: −0.56). Warming of vegetated spots with a decrease in average ΔNDVI may be caused by a reduction in evapotranspirative cooling due to deterioration of vegetation health or a decrease in vegetation cover. Isolated areas of strong NDVI decrease can be identified even at most spots with increasing or constant NDVI. These are, however, surrounded by pixels with increasing NDVI, which raise the average ΔNDVI of the spot by their quantity (similar to Figure 5e, although there the average ΔNDVI is negative). Nevertheless, in such configurations, pixels with ΔNDVI > = 0 also exhibit an increase in SUHI, suggesting that the warming effect extends beyond the pixels experiencing a decrease in NDVI. In such cases, it is difficult to identify the exact cause for the observed warming with the data available, as factors such as changes in vegetation management, soil moisture limitations, or other changes not observable by satellites may have led to the increase in SUHI. Further, discrepancies in NDVI derived from different Landsat satellites (as discussed above) or ΔLST (see below) could have an influence on the estimated values.
The SUHI increase at warming spots is much lower compared to the decrease seen at cooling spots. This is likely caused by the overall decrease in SUHI in Stuttgart, which can be observed even in areas with no land cover change due to the negative relationship between rural LST and SUHI, as discussed above. However, even when correcting for the average SUHI change, the SUHI decrease in cooling spots is still larger than the SUHI increase in warming spots. Simultaneously, the absolute urban LST increased strongly in most areas, especially at warming spots. This trend is alarming, for example, at sports grounds (ΔLST = +4.9 °C), where children are especially exposed to high temperatures, as the resulting increase in heat stress can cause serious health threats [53,64,65].
A relatively large fraction of SUHI increases (33%) and SUHI decreases (19%) could not be categorised, which might be due to several reasons. Changes in the surface cover may remain undetected if they are not visible on the images from Google Earth Pro. These may be non-visible material changes, changes in the cultivation of vegetation, changes in building upkeep, and the internals of buildings emitting more or less heat. This could be a major reason for the lack of visible changes at extreme warming and cooling spots at industrial buildings. Further, these uncategorisable extreme spots could be caused by issues with Landsat data retrieval, such as artefacts of the blockiness described for the LST product due to the interpolation of coarser raster data onto the 30 m grid, the change in spatial resolution between L5 and L8, as well as artefacts from surrounding warm surfaces [36,37]. The latter is supported by the fact that, at some spots, relevant land cover changes were found close to the areas of extreme LST change. Moreover, uncategorisable spots could also be caused by greater LST biases in areas with high spatial variability or high water vapour content, as these may decrease the LST accuracy and lead to errors in the identification of extreme warming and cooling spots [37].

4.3. Limitations of the Study

The method used in this study enables detailed insights into the temporal and spatial dynamics of the SUHI effect in urban areas. However, some limitations have to be taken into account. The pixel resolution of 30 m does not allow for the detection of small-scale changes, such as the planting of individual urban trees or greening tramway tracks, which are both parts of the UHI mitigation strategy of Stuttgart [66]. With satellite products that deliver higher spatial resolution, the identification of such measures and the analysis of their impacts might become possible, which would greatly improve the ability to detect and quantify how small-scale heat mitigation measures impact UHI.
The Landsat images of Stuttgart used in this study are all recorded at around 9 a.m. local time. While this guarantees temporal consistency between the satellite images from different scenes, the highest LSTs, which are usually reached in the afternoon, are missed. Likewise, nighttime UHI cannot be assessed. In fact, nighttime UHI is often stronger than daytime UHI, as was, for example, found for Birmingham [67] and Paris [68], the latter of which showing differences between nighttime and daytime UHI of up to 7 °C. In Stuttgart, the flow of cold air from the surrounding hills plays a key role in nighttime temperatures [69]. However, an assessment of the nighttime UHI in Stuttgart yielded inconclusive results regarding its strength relative to the daytime UHI [24].
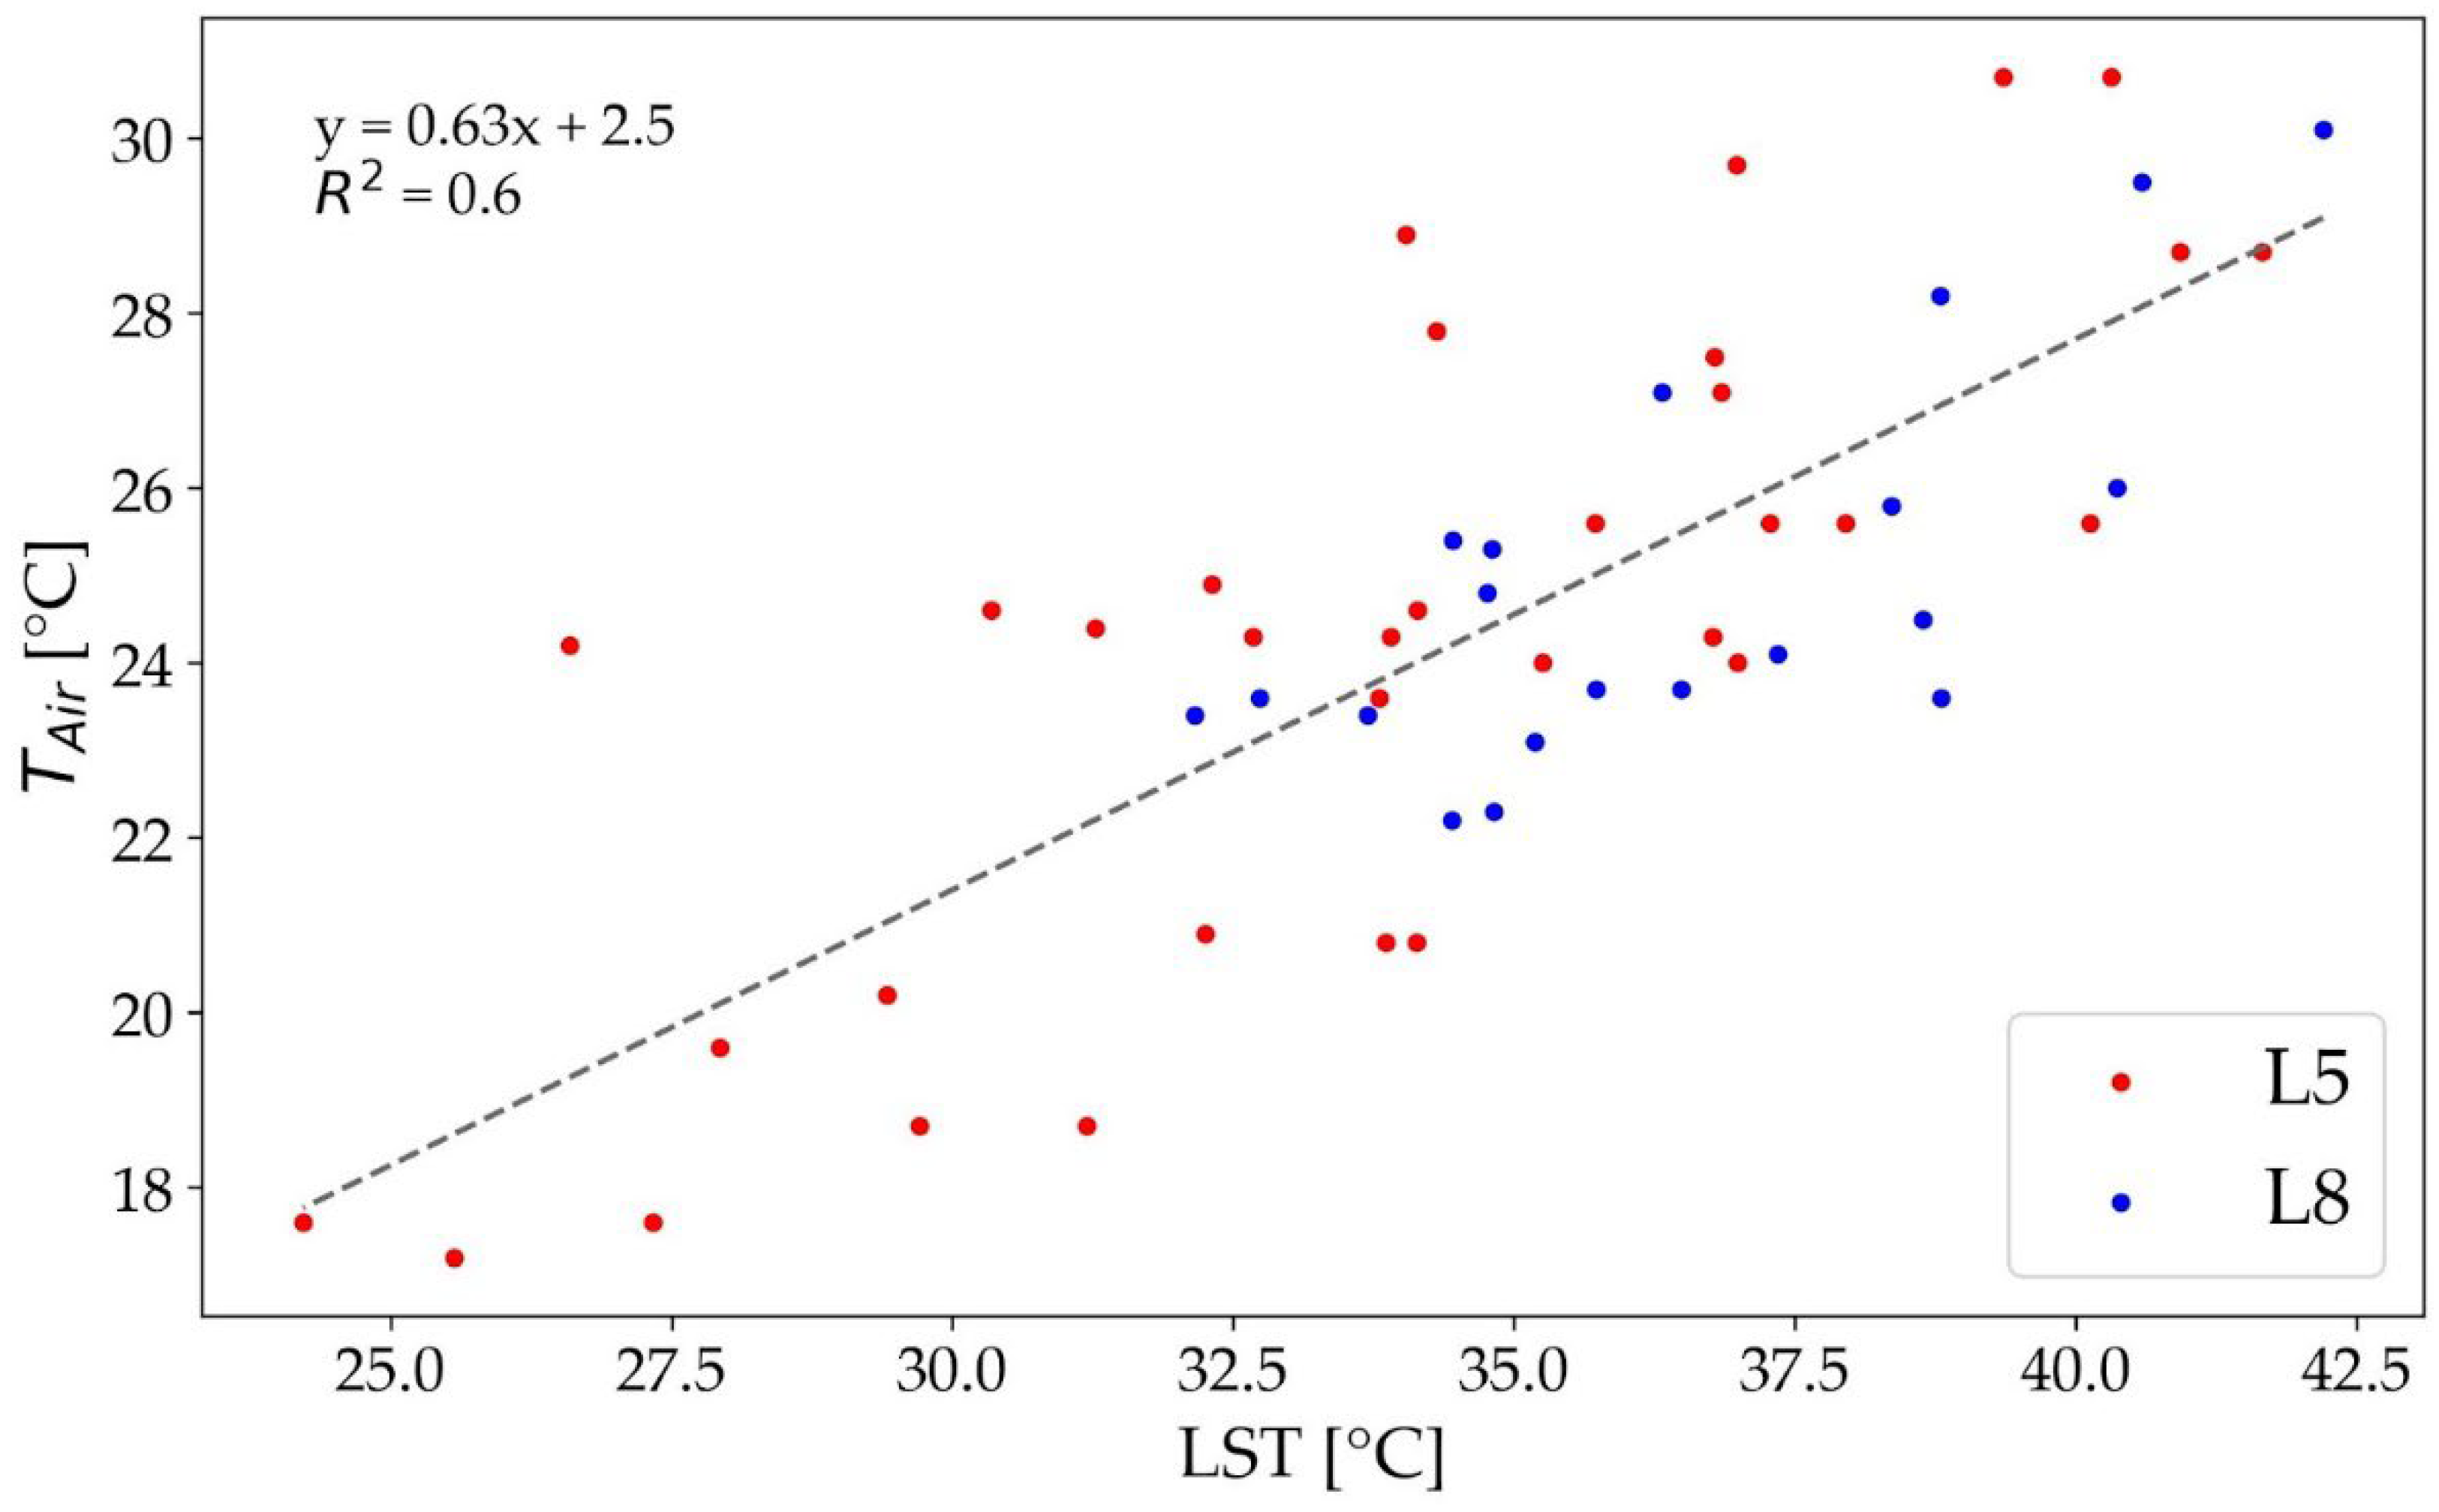
Furthermore, it should be kept in mind that only the LST-based UHI effect (i.e., SUHI) was analysed in this study. Although a correlation between LST and near-surface air temperature can be identified in Stuttgart (with a correlation of R² = 0.6; see Figure A2), LST measurements cannot be directly translated into near-surface air temperature due to the complex heat transfer between the land surface and the air. LST and near-surface air temperature are thus not perfectly comparable [70,71]. Establishing a relationship between LST and near-surface air temperature is even more complicated in urban environments, where warming and cooling sources that are not detectable by satellites (e.g., anthropogenic heat sources, facade greening), and wind can strongly influence near-surface air temperature [72,73,74]. Similarly, the effects of changing material properties, such as heat capacity and heat conductivity, that strongly affect surface properties cannot be quantified, as material changes can only be estimated properly by in situ measurements.

5. Conclusions

In this study, we analysed the surface urban heat island (SUHI) effect in Stuttgart using LST and NDVI data from Landsat and high-resolution visual images from Google Earth Pro. We assessed the SUHI change between the time periods 2004–2008 and 2016–2020 (ΔSUHI). Cooling and warming spots were identified based on the 2nd and 98th percentiles of the spatial distribution of ΔSUHI in Stuttgart and manually categorised based on the prevalent land cover changes occurring at each cooling and warming spot.
The average SUHI in the urban areas of Stuttgart decreased by 1.4 °C between 2004–2008 and 2016–2020, while LST increased by 2.5 °C. When examining warming and cooling spots, the results show a strong influence of vegetation on SUHI in Stuttgart (Figure 2). Regarding cooling spots, newly installed green roofs and increased albedo (33% and 16% of cooling spots) are among the most prominent and effective land cover changes to decrease SUHI (Figure 4b), making them a valuable measure in mitigating UHI in Stuttgart. On average, land cover changes at cooling spots decreased SUHI by 4.3 °C to 5.1 °C between 2004–2008 and 2016–2020. Warming spots are mostly connected to a decrease in vegetation (Figure 4c), either through the sealing of surfaces or the removal of vegetation (25% and 5% of warming spots, respectively). Additionally, sports grounds with newly installed artificial turf (14% of warming spots) show an increase in SUHI. Although SUHI at warming spots only increased by about 0.6 °C to 1.6 °C, the corresponding increase in LST is much larger, ranging from 4.4 °C to 5.4 °C.
As data resolution is a limiting factor in identifying cooling and warming spots, data with better spatial and temporal resolution would be preferable for further studies, as these would allow for analysing changes at even smaller scales (e.g., the plantation of single trees). Such data could be provided by novel techniques, such as machine learning data fusion from Sentinel 2 and 3, producing LST data with 20 m resolution [75].
The method presented here constitutes a flexible approach that can easily be applied to other cities and could, for example, allow for evaluating the success of similar UHI mitigation measures in cities with different climates and urban structures. It can further provide a valuable contribution to assess the potential of specific land cover changes aiming at mitigating UHI, validating their success, and possibly guiding future policy in urban areas, including mandatory green roofs, usage of high albedo materials, planning of green spaces, and unsealing of surfaces. Such measures can help improve the quality of life for urban citizens in the midst of global warming.

Author Contributions

Conceptualisation G.S., A.H., J.H., J.K., L.L. and C.S.; methodology, G.S. and C.S.; software, G.S.; formal analysis, G.S., A.H. and J.K.; investigation, G.S., A.H., L.L. and J.H.; data curation, G.S., A.H., L.L. and J.H.; writing—original draft preparation, G.S., L.L. and J.H.; writing—review and editing, G.S., A.H., L.L., J.H., J.K. and C.S.; visualisation, G.S. and A.H.; supervision, C.S.; funding acquisition, G.S., A.H., J.H., J.K., L.L. and C.S. All authors have read and agreed to the published version of the manuscript.

Funding

This research was funded by the StudForschung@GEO program from LMU Munich, grant number W21_F10.

Institutional Review Board Statement

Not applicable.

Informed Consent Statement

Not applicable.

Data Availability Statement

Landsat Collection 2 Level-2 data from L5 (doi:/10.5066/P9IAXOVV) and L8 (doi:10.5066/P9OGBGM6) can be found on the EarthExplorer portal: https://earthexplorer.usgs.gov/ (accessed on 6 September 2022). DWD weather station data can be found in the Climate Data Center (CDC): https://cdc.dwd.de/portal/ (accessed on 6 September 2022). Corine Land Cover (CLC) 2018 data can be found here: https://land.copernicus.eu/pan-european/corine-land-cover (accessed on 6 September 2022). TanDEM-X Data can be accessed here: https://download.geoservice.dlr.de/TDM90/ (accessed on 6 September 2022). High-resolution satellite and aerial images were sourced from Google Earth Pro (Download from: https://www.google.com/earth/about/versions/ (accessed on 6 September 2022)). Data supporting the results of this study are publicly available on Open Data LMU (https://doi.org/10.5282/ubm/data.325 (accessed on 6 September 2022)).

Acknowledgments

Landsat Collection 2 Level 2 Science Products courtesy of the U.S. Geological Survey Earth Resources Observation and Science Center.

Conflicts of Interest

The authors declare no conflict of interest.

Appendix A

Table A1. Overview of the Landsat tiles used in this study for the calculation of the land surface temperature (LST), surface urban heat island (SUHI), and Normalised Difference Vegetation Index (NDVI). The satellites used are Landsat 5 (L5) and Landsat 8 (L8).
TileDateSatellite
LT05_L2SP_195026_20040730_20200903_02_T130 July 2004L5
LT05_L2SP_195026_20050717_20200902_02_T117 July 2005L5
LT05_L2SP_194026_20060611_20200901_02_T111 June 2006L5
LT05_L2SP_195026_20060618_20200901_02_T118 June 2006L5
LT05_L2SP_194026_20070716_20200830_02_T116 July 2007L5
LT05_L2SP_194026_20070801_20200830_02_T11 August 2007L5
LT05_L2SP_194026_20080702_20200829_02_T12 July 2008L5
LC08_L2SP_194026_20160825_20200906_02_T125 August 2016L8
LC08_L2SP_195026_20170718_20200903_02_T118 July 2017L8
LC08_L2SP_194026_20180714_20200831_02_T114 July 2018L8
LC08_L2SP_194026_20190818_20200827_02_T118 August 2019L8
LC08_L2SP_195026_20190724_20200827_02_T124 July 2019L8
LC08_L2SP_194026_20200820_20200905_02_T120 August 2020L8
LC08_L2SP_195026_20200624_20200823_02_T124 June 2020L8
Table A2. Overview of all stations of the german weather service (DWD) used in this study with their names, ID numbers, and location.
IDNameLongitudeLatitudeElevation [m]Location
4926Stuttgart (Neckartal)9.21673948.789592224urban
4928Stuttgart (Schnarrenberg)9.20002848.828085314urban
3278Metzingen9.27336648.537658354rural
4160Renningen-Ihinger Hof8.92396948.742509478rural
4349Sachsenheim9.07102848.95689248rural
4931Stuttgart-Echterdingen9.22353548.688307371rural
6275Notzingen9.46266248.670482325rural
Figure A1. Stuttgart and its surrounding area. Green hatching indicates the valid surrounding area in the 20 km buffer around Stuttgart used to calculate the average rural land surface temperature (LST). Urban areas, areas covered with clouds, and areas with elevation deviating more than ±100 m from the mean elevation of Stuttgart were excluded.
Urbansci 06 00082 g0a1
Figure A2. Correlation between the 2 metre air temperature (TAir) from stations of the German weather service (DWD) in the administrative boundaries of Stuttgart [46] and land surface temperature (LST) from L5 and L8 averaged within a 60 m radius around each station. The dots show the LST data for every weather station in every Landsat tile used in this study and the corresponding 2 metre air temperature recorded the same day at 9 a.m. from the weather stations.
Urbansci 06 00082 g0a2

References

  1. IPCC. Summary for Policymakers. In Climate Change 2022: Impacts, Adaptation, and Vulnerability. Contribution of Working Group II to the Sixth Assessment Report of the Intergovernmental Panel on Climate Change; Pörtner, H.-O., Roberts, D.C., Tignor, M., Poloczanska, E.S., Mintenbeck, K., Alegría, A., Craig, M., Langsdorf, S., Löschke, S., Möller, V., et al., Eds.; Cambridge University Press: Cambridge, UK, 2022; in press. [Google Scholar]
  2. Mohajerani, A.; Bakaric, J.; Jeffrey-Bailey, T. The urban heat island effect, its causes, and mitigation, with reference to the thermal properties of asphalt concrete. J. Environ. Manag. 2017, 197, 522–538. [Google Scholar] [CrossRef] [PubMed]
  3. Zacharias, S.; Koppe, C.; Mücke, H. Climate Change Effects on Heat Waves and Future Heat Wave-Associated IHD Mortality in Germany. Climate 2014, 3, 100–117. [Google Scholar] [CrossRef] [Green Version]
  4. Otto, A.; Göpfert, C.; Thieken, A.H. Are cities prepared for climate change? An analysis of adaptation readiness in 104 German cities. Mitig. Adapt. Strateg. Glob. Chang. 2021, 26, 35. [Google Scholar] [CrossRef]
  5. Mirzaei, P.A.; Haghighat, F. Approaches to study Urban Heat Island—Abilities and limitations. Build. Environ. 2010, 45, 2192–2201. [Google Scholar] [CrossRef]
  6. Rani, M.; Kumar, P.; Pandey, P.C.; Srivastava, P.K.; Chaudhary, B.S.; Tomar, V.; Mandal, V.P. Multi-temporal NDVI and surface temperature analysis for Urban Heat Island inbuilt surrounding of sub-humid region: A case study of two geographical regions. Remote Sens. Appl. Soc. Environ. 2018, 10, 163–172. [Google Scholar] [CrossRef]
  7. Arifin, S.S.; Hamzah, B.; Mulyadi, R.; Rasyid, A.R. Effects of Vegetation on Urban Heat Island Using Landsat 8 OLI/TIRS Imagery in Tropical Urban Climate. Civ. Eng. Archit. 2022, 10, 395–405. [Google Scholar] [CrossRef]
  8. Naserikia, M.; Asadi Shamsabadi, E.; Rafieian, M.; Leal Filho, W. The Urban Heat Island in an Urban Context: A Case Study of Mashhad, Iran. Int. J. Environ. Res. Public. Health 2019, 16, 313. [Google Scholar] [CrossRef] [Green Version]
  9. Pal, S.; Ziaul, S. Detection of land use and land cover change and land surface temperature in English Bazar urban centre. Egypt. J. Remote Sens. Space Sci. 2017, 20, 125–145. [Google Scholar] [CrossRef] [Green Version]
  10. Hsu, A.; Sheriff, G.; Chakraborty, T.; Manya, D. Disproportionate exposure to urban heat island intensity across major US cities. Nat. Commun. 2021, 12, 2721. [Google Scholar] [CrossRef]
  11. Chen, L.; Jiang, R.; Xiang, W.-N. Surface Heat Island in Shanghai and Its Relationship with Urban Development from 1989 to 2013. Adv. Meteorol. 2016, 2016, 9782686. [Google Scholar] [CrossRef]
  12. Sejati, A.W.; Buchori, I.; Rudiarto, I. The spatio-temporal trends of urban growth and surface urban heat islands over two decades in the Semarang Metropolitan Region. Sustain. Cities Soc. 2019, 46, 101432. [Google Scholar] [CrossRef]
  13. Deilami, K.; Kamruzzaman, M.; Liu, Y. Urban heat island effect: A systematic review of spatio-temporal factors, data, methods, and mitigation measures. Int. J. Appl. Earth Obs. Geoinf. 2018, 67, 30–42. [Google Scholar] [CrossRef]
  14. Chen, W.; Zhang, Y.; Pengwang, C.; Gao, W. Evaluation of Urbanization Dynamics and its Impacts on Surface Heat Islands: A Case Study of Beijing, China. Remote Sens. 2017, 9, 453. [Google Scholar] [CrossRef] [Green Version]
  15. Mathew, A.; Khandelwal, S.; Kaul, N. Investigating spatial and seasonal variations of urban heat island effect over Jaipur city and its relationship with vegetation, urbanization and elevation parameters. Sustain. Cities Soc. 2017, 35, 157–177. [Google Scholar] [CrossRef]
  16. Jiahua, Z.; Yingyu, H.; Guicai, L.; Hao, Y.; Limin, Y.; Fengmei, Y. The diurnal and seasonal characteristics of urban heat island variation in Beijing city and surrounding areas and impact factors based on remote sensing satellite data. Sci. China Ser. D Earth Sci. 2005, 48, 220. [Google Scholar] [CrossRef]
  17. Miles, V.; Esau, I. Seasonal and Spatial Characteristics of Urban Heat Islands (UHIs) in Northern West Siberian Cities. Remote Sens. 2017, 9, 989. [Google Scholar] [CrossRef] [Green Version]
  18. Sahoo, S.; Majumder, A.; Swain, S.; Gareema; Pateriya, B.; Al-Ansari, N. Analysis of Decadal Land Use Changes and Its Impacts on Urban Heat Island (UHI) Using Remote Sensing-Based Approach: A Smart City Perspective. Sustainability 2022, 14, 11892. [Google Scholar] [CrossRef]
  19. Sarah, J.; Louis, M.; Esae, O.E. An Eleven Years Analysis of the Seasonal Dynamics of Urban Heat Island (UHI) Intensity (2004–2014). Int. J. Geogr. Geol. 2020, 9, 55–70. [Google Scholar] [CrossRef] [Green Version]
  20. Mäding, A. Informationen zur Einwohnerentwicklung. Available online: https://www.domino1.stuttgart.de/web/komunis/komunissde.nsf/fc223e09e4cb691ac125723c003bfb31/4e6620005e228f76c12584d300483532/$FILE/bs701_.PDF (accessed on 28 July 2022).
  21. Historische Monatliche Stationsbeobachtungen (Temperatur, Druck, Niederschlag, Sonnenscheindauer, etc.) für Deutschland; Version v21.3; DWD Climate Data Center (CDC): Offenbach, Germany, 2021.
  22. Rehan, R.M. Cool city as a sustainable example of heat island management case study of the coolest city in the world. HBRC J. 2016, 12, 191–204. [Google Scholar] [CrossRef] [Green Version]
  23. Stadtklima Stuttgart|Klima in Stuttgart|Das Klima von Stuttgart. Available online: https://www.stadtklima-stuttgart.de/index.php?klima_klimainstuttgart (accessed on 19 May 2022).
  24. Ketterer, C.; Matzarakis, A. Comparison of different methods for the assessment of the urban heat island in Stuttgart, Germany. Int. J. Biometeorol. 2015, 59, 1299–1309. [Google Scholar] [CrossRef]
  25. Fallmann, J.; Forkel, R.; Emeis, S. Secondary effects of urban heat island mitigation measures on air quality. Atmos. Environ. 2016, 125, 199–211. [Google Scholar] [CrossRef] [Green Version]
  26. Zafrir, R.; Ojeda, S.; Singh, H.; Hahn, M. Seasons in Stuttgart: Developing a Google Earth Engine Tool for Heat Island Mapping. Int. Arch. Photogramm. Remote Sens. Spatial Inf. Sci. 2019, XLII-4/W18, 1123–1130. [Google Scholar] [CrossRef] [Green Version]
  27. Masek, J.G.; Vermote, E.F.; Saleous, N.E.; Wolfe, R.; Hall, F.G.; Huemmrich, K.F.; Gao, F.; Kutler, J.; Lim, T.-K. A Landsat Surface Reflectance Dataset for North America, 1990–2000. IEEE Geosci. Remote Sens. Lett. 2006, 3, 68–72. [Google Scholar] [CrossRef]
  28. Cook, M. Atmospheric Compensation for a Landsat Land Surface Temperature Product. Ph.D. Thesis, Rochester Institute of Technology, Rochester, NY, USA, 22 October 2014. [Google Scholar]
  29. Cook, M.; Schott, J.; Mandel, J.; Raqueno, N. Development of an Operational Calibration Methodology for the Landsat Thermal Data Archive and Initial Testing of the Atmospheric Compensation Component of a Land Surface Temperature (LST) Product from the Archive. Remote Sens. 2014, 6, 11244–11266. [Google Scholar] [CrossRef] [Green Version]
  30. Vermote, E.; Justice, C.; Claverie, M.; Franch, B. Preliminary analysis of the performance of the Landsat 8/OLI land surface reflectance product. Remote Sens. Environ. 2016, 185, 46–56. [Google Scholar] [CrossRef] [PubMed]
  31. Landsat Collection 2 Surface Temperature|U.S. Geological Survey. Available online: https://www.usgs.gov/landsat-missions/landsat-collection-2-surface-temperature (accessed on 24 June 2022).
  32. Landsat 7|U.S. Geological Survey. Available online: https://www.usgs.gov/landsat-missions/landsat-7 (accessed on 27 May 2022).
  33. USGS. Landsat 4-7 Collection 2 (C2) Level 2 Science Product (L2SP) Guide 2021. Available online: https://d9-wret.s3.us-west-2.amazonaws.com/assets/palladium/production/s3fs-public/media/files/LSDS-1618_Landsat-4-7_C2-L2-ScienceProductGuide-v4.pdf (accessed on 8 June 2022).
  34. USGS. Landsat 8-9 Collection 2 (C2) Level 2 Science Product (L2SP) Guide 2022. Available online: https://d9-wret.s3.us-west-2.amazonaws.com/assets/palladium/production/s3fs-public/media/files/LSDS-1619_Landsat-8-9-C2-L2-ScienceProductGuide-v4.pdf (accessed on 8 June 2022).
  35. Fact Sheet. In USGS Landsat—Earth Observation Satellites; U.S. Geological Survey: Reston, VA, USA, 2016; Volume 2015–3081, p. 4. [CrossRef] [Green Version]
  36. Blockiness Artifact in Landsat Collection 2 Surface Temperature Products|U.S. Geological Survey. Available online: https://www.usgs.gov/landsat-missions/blockiness-artifact-landsat-collection-2-surface-temperature-products (accessed on 18 May 2022).
  37. Malakar, N.K.; Hulley, G.C.; Hook, S.J.; Laraby, K.; Cook, M.; Schott, J.R. An Operational Land Surface Temperature Product for Landsat Thermal Data: Methodology and Validation. IEEE Trans. Geosci. Remote Sens. 2018, 56, 5717–5735. [Google Scholar] [CrossRef]
  38. Duan, S.-B.; Li, Z.-L.; Zhao, W.; Wu, P.; Huang, C.; Han, X.-J.; Gao, M.; Leng, P.; Shang, G. Validation of Landsat land surface temperature product in the conterminous United States using in situ measurements from SURFRAD, ARM, and NDBC sites. Int. J. Digit. Earth 2021, 14, 640–660. [Google Scholar] [CrossRef]
  39. Chen, F.; Yang, S.; Yin, K.; Chan, P. Challenges to quantitative applications of Landsat observations for the urban thermal environment. J. Environ. Sci. 2017, 59, 80–88. [Google Scholar] [CrossRef] [PubMed]
  40. Zhu, Z.; Fu, Y.; Woodcock, C.E.; Olofsson, P.; Vogelmann, J.E.; Holden, C.; Wang, M.; Dai, S.; Yu, Y. Including land cover change in analysis of greenness trends using all available Landsat 5, 7, and 8 images: A case study from Guangzhou, China (2000–2014). Remote Sens. Environ. 2016, 185, 243–257. [Google Scholar] [CrossRef]
  41. Li, P.; Jiang, L.; Feng, Z. Cross-Comparison of Vegetation Indices Derived from Landsat-7 Enhanced Thematic Mapper Plus (ETM+) and Landsat-8 Operational Land Imager (OLI) Sensors. Remote Sens. 2014, 6, 310–329. [Google Scholar] [CrossRef] [Green Version]
  42. Wessel, B.; Huber, M.; Wohlfart, C.; Marschalk, U.; Kosmann, D.; Roth, A. Accuracy assessment of the global TanDEM-X Digital Elevation Model with GPS data. ISPRS J. Photogramm. Remote Sens. 2018, 139, 171–182. [Google Scholar] [CrossRef]
  43. Rizzoli, P.; Martone, M.; Gonzalez, C.; Wecklich, C.; Borla Tridon, D.; Bräutigam, B.; Bachmann, M.; Schulze, D.; Fritz, T.; Huber, M.; et al. Generation and performance assessment of the global TanDEM-X digital elevation model. ISPRS J. Photogramm. Remote Sens. 2017, 132, 119–139. [Google Scholar] [CrossRef] [Green Version]
  44. Büttner, G.; Kosztra, B.; Soukup, T.; Sousa, A.; Langanke, T. CLC2018 Technical Guidelines 61; EEA: Vienna, Austria, 2017. [Google Scholar]
  45. Open Data und Testdaten. Available online: https://www.stuttgart.de/leben/bauen/geoportal/open-data-und-testdaten.php (accessed on 19 May 2022).
  46. DWD Climate Data Center (CDC): Hourly station observations of air temperature at 2 m above ground in °C for Germany, version v19.3. Available online: https://cdc.dwd.de/portal/ (accessed on 6 September 2021).
  47. Macintyre, H.L.; Heaviside, C.; Cai, X.; Phalkey, R. The winter urban heat island: Impacts on cold-related mortality in a highly urbanized European region for present and future climate. Environ. Int. 2021, 154, 106530. [Google Scholar] [CrossRef] [PubMed]
  48. Debbage, N.; Shepherd, J.M. The urban heat island effect and city contiguity. Comput. Environ. Urban Syst. 2015, 54, 181–194. [Google Scholar] [CrossRef]
  49. Oke, T.R. The energetic basis of the urban heat island. Q. J. R. Meteorol. Soc. 1982, 108, 1–24. [Google Scholar] [CrossRef]
  50. Morini, E.; Touchaei, A.; Castellani, B.; Rossi, F.; Cotana, F. The Impact of Albedo Increase to Mitigate the Urban Heat Island in Terni (Italy) Using the WRF Model. Sustainability 2016, 8, 999. [Google Scholar] [CrossRef] [Green Version]
  51. Hu, A.; Levis, S.; Meehl, G.A.; Han, W.; Washington, W.M.; Oleson, K.W.; van Ruijven, B.J.; He, M.; Strand, W.G. Impact of solar panels on global climate. Nat. Clim. Chang. 2016, 6, 290–294. [Google Scholar] [CrossRef]
  52. Luyssaert, S.; Jammet, M.; Stoy, P.C.; Estel, S.; Pongratz, J.; Ceschia, E.; Churkina, G.; Don, A.; Erb, K.; Ferlicoq, M.; et al. Land management and land-cover change have impacts of similar magnitude on surface temperature. Nat. Clim. Chang. 2014, 4, 389–393. [Google Scholar] [CrossRef] [Green Version]
  53. Kim, J.-P.; Guldmann, J.-M. Land-Use Planning and the Urban Heat Island. Environ. Plan. B Plan. Des. 2014, 41, 1077–1099. [Google Scholar] [CrossRef]
  54. Yaghoobian, N.; Kleissl, J.; Krayenhoff, E.S. Modeling the Thermal Effects of Artificial Turf on the Urban Environment. J. Appl. Meteorol. Climatol. 2010, 49, 332–345. [Google Scholar] [CrossRef]
  55. feuerbach.de—Die besten Seiten von Feuerbach—Neuer Kunstrasenplatz. Available online: https://www.feuerbach.de/aktuelles/news/2017/02/10/neuer-kunstrasenplatz (accessed on 21 May 2022).
  56. Streutker, D.R. A remote sensing study of the urban heat island of Houston, Texas. Int. J. Remote Sens. 2002, 23, 2595–2608. [Google Scholar] [CrossRef]
  57. Scott, A.A.; Waugh, D.W.; Zaitchik, B.F. Reduced Urban Heat Island intensity under warmer conditions. Environ. Res. Lett. 2018, 13, 064003. [Google Scholar] [CrossRef] [PubMed]
  58. Alavipanah, S.; Wegmann, M.; Qureshi, S.; Weng, Q.; Koellner, T. The Role of Vegetation in Mitigating Urban Land Surface Temperatures: A Case Study of Munich, Germany during the Warm Season. Sustainability 2015, 7, 4689–4706. [Google Scholar] [CrossRef] [Green Version]
  59. Lalošević, M.D.; Komatina, M.S.; Miloš, M.V.; Rudonja, N. Green roofs and cool materials as retrofitting strategies for urban heat island mitigation: Case study in Belgrade, Serbia. Therm. Sci. 2018, 22, 2309–2324. [Google Scholar] [CrossRef]
  60. Suszanowicz, D.; Kolasa Więcek, A. The Impact of Green Roofs on the Parameters of the Environment in Urban Areas—Review. Atmosphere 2019, 10, 792. [Google Scholar] [CrossRef] [Green Version]
  61. Büscher, O. Zusammenfassender Ergebnisbericht Gründacherfassung Stuttgart 2019; EFTAS: Münster, Germany, 2019. [Google Scholar]
  62. Baumann, T.; Nussbaumer, H.; Klenk, M.; Dreisiebner, A.; Carigiet, F.; Baumgartner, F. Photovoltaic systems with vertically mounted bifacial PV modules in combination with green roofs. Sol. Energy 2019, 190, 139–146. [Google Scholar] [CrossRef]
  63. Sattler, S.; Zluwa, I.; Österreicher, D. The “PV Rooftop Garden”: Providing Recreational Green Roofs and Renewable Energy as a Multifunctional System within One Surface Area. Appl. Sci. 2020, 10, 1791. [Google Scholar] [CrossRef] [Green Version]
  64. Jim, C.Y. Intense summer heat fluxes in artificial turf harm people and environment. Landsc. Urban Plan. 2017, 157, 561–576. [Google Scholar] [CrossRef]
  65. Liu, Z.; Jim, C.Y. Playing on natural or artificial turf sports field? Assessing heat stress of children, young athletes, and adults in Hong Kong. Sustain. Cities Soc. 2021, 75, 103271. [Google Scholar] [CrossRef]
  66. Landeshauptstadt Stuttgart, Amt für Umweltschutz, Abteilung Stadtklimatologie Klimaanpassungskonzept Stuttgart KLIMAKS 2012. Available online: https://www.stadtklima-stuttgart.de/stadtklima_filestorage/download/kliks/KLIMAKS-2012.pdf (accessed on 28 July 2022).
  67. Azevedo, J.A.; Chapman, L.; Muller, C.L. Quantifying the Daytime and Night-Time Urban Heat Island in Birmingham, UK: A Comparison of Satellite Derived Land Surface Temperature and High Resolution Air Temperature Observations. Remote Sens. 2016, 8, 153. [Google Scholar] [CrossRef] [Green Version]
  68. Lac, C.; Donnelly, R.P.; Masson, V.; Pal, S.; Riette, S.; Donier, S.; Queguiner, S.; Tanguy, G.; Ammoura, L.; Xueref-Remy, I. CO2 dispersion modelling over Paris region within the CO2-MEGAPARIS project. Atmos. Chem. Phys. 2013, 13, 4941–4961. [Google Scholar] [CrossRef] [Green Version]
  69. Rinke, R.; Kapp, R.; Reuter, U.; Ketterer, C.; Fallmann, J.; Matzarakis, A.; Emeis, S. Pilot Actions in European Cities—Stuttgart. In Counteracting Urban Heat Island Effects in a Global Climate Change Scenario; Musco, F., Ed.; Springer International Publishing: Cham, Switzerland, 2016; pp. 281–303. ISBN 978-3-319-10425-6. [Google Scholar] [CrossRef] [Green Version]
  70. Hereher, M.E. Estimation of monthly surface air temperatures from MODIS LST time series data: Application to the deserts in the Sultanate of Oman. Environ. Monit. Assess. 2019, 191, 592. [Google Scholar] [CrossRef] [PubMed]
  71. Sun, T.; Sun, R.; Chen, L. The Trend Inconsistency between Land Surface Temperature and Near Surface Air Temperature in Assessing Urban Heat Island Effects. Remote Sens. 2020, 12, 1271. [Google Scholar] [CrossRef] [Green Version]
  72. Molnár, G.; Kovács, A.; Gál, T. How does anthropogenic heating affect the thermal environment in a medium-sized Central European city? A case study in Szeged, Hungary. Urban Clim. 2020, 34, 100673. [Google Scholar] [CrossRef]
  73. Widiastuti, R.; Bramiana, C.N.; Bangun, I.R.H.; Prabowo, B.N.; Ramandhika, M. Vertical Greenery System as the Passive Design Strategy for Mitigating Urban Heat Island in Tropical Area: A Comparative Field Measurement Between Green Facade and Green Wall. IOP Conf. Ser. Earth Environ. Sci. 2018, 213, 012037. [Google Scholar] [CrossRef]
  74. He, B.-J. Potentials of meteorological characteristics and synoptic conditions to mitigate urban heat island effects. Urban Clim. 2018, 24, 26–33. [Google Scholar] [CrossRef]
  75. High-Resolution Land-Surface Temperature. Available online: https://www.esa.int/ESA_Multimedia/Images/2020/04/High-resolution_land-surface_temperature (accessed on 7 June 2022).
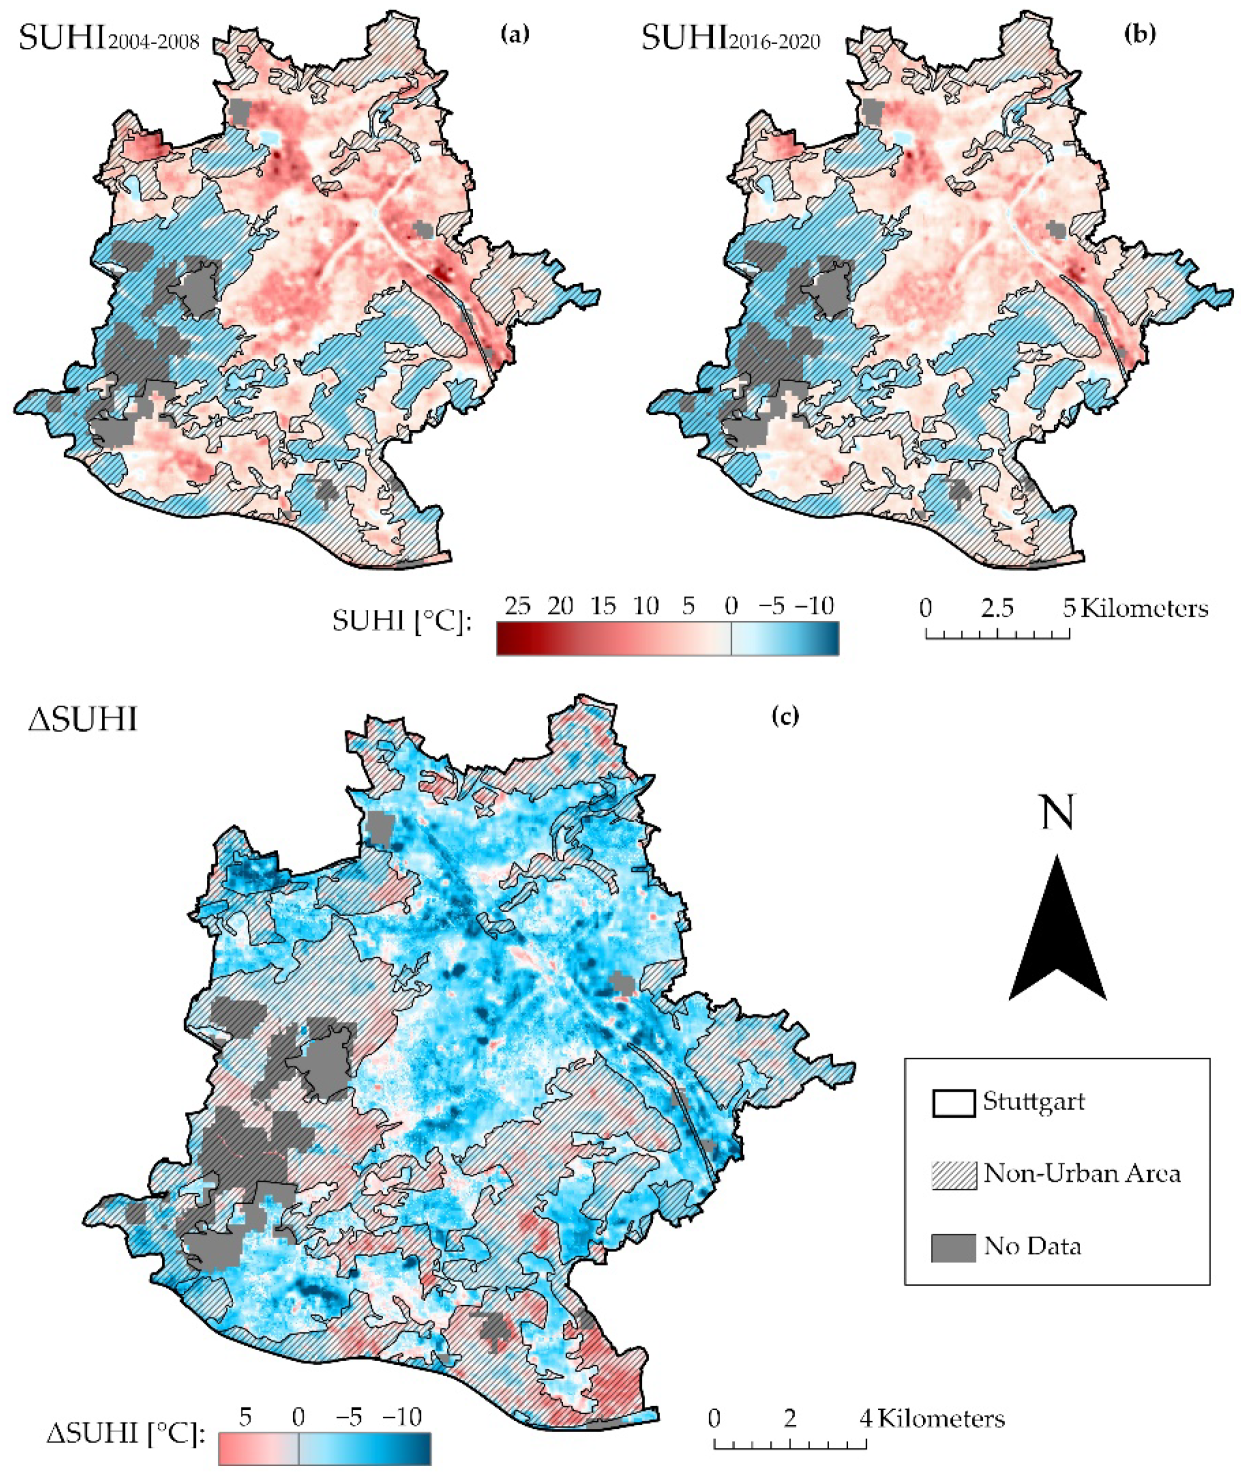
Figure 1. The surface urban heat island (SUHI) in Stuttgart in (a) 2004–2008 and (b) 2016–2020, and (c) the difference in SUHI (ΔSUHI) between both time periods. Non-urban areas are hatched, and areas with no data are depicted in grey. Note that colourmap limits in (c) differ from (a,b).
Urbansci 06 00082 g001
Figure 2. Scatterplots of the correlation between Normalised Difference Vegetation Index (NDVI) and surface urban heat island (SUHI) in the urban area of Stuttgart averaged over (a) 2004–2008 and (b) 2016–2020. Each dot represents a Landsat pixel within the administrative boundaries of Stuttgart.
Urbansci 06 00082 g002
Figure 3. As in Figure 2, but for the correlation between the 2004–2008 average of land surface temperature (LST) and the change in surface urban heat island (ΔSUHI).
Urbansci 06 00082 g003
Figure 4. (a) Change in the surface urban heat island (ΔSUHI) in the urban area of Stuttgart between the five-year averages of 2004–2008 and 2016–2020, with highlighted extreme spots of ΔSUHI. Extreme warming (cooling) spots are defined as pixels above the 98th (below the 2nd) percentile of the spatial ΔSUHI distribution. Categorisation of the (b) cooling spots and (c) warming spots according to the predominant land cover changes and the respective changes in SUHI and Normalised Difference Vegetation Index (NDVI).
Urbansci 06 00082 g004
Figure 5. Six examples for cooling (blue) and warming spots (red) identified in Stuttgart with the respective changes in surface urban heat island (ΔSUHI) and Normalised Difference Vegetation Index (ΔNDVI). Examples are: (a) material changes at the construction site of Stuttgart’s new central station (Stuttgart 21), (b) replacement of a large industrial hall by houses with vegetation, (c) green roof retrofit on existing and new buildings (note the presence of artefacts in the bottom left corner), (d) removal of trees and sealing of grassland with asphalt, (e) potential impacts of decreased evapotranspirative cooling on grassland due to a decrease in vegetation health, and (f) replacement of a tennis court surface by artificial turf. Note that images are recorded in different seasons, which might influence the vegetation coverage displayed. Missing data for ΔSUHI and ΔNDVI is marked as hatched.
Urbansci 06 00082 g005
Table 1. Overview of the categories used to classify and label land cover changes that occurred at the spots with extreme surface urban heat island (SUHI) change between 2004–2008 and 2016–2020 in Stuttgart.
Warming SpotsCooling Spots
sealing of fallow landunsealing to fallow land
sealing of vegetated areaunsealing to vegetated area
albedo decreasealbedo increase
installation of solar panelsinstallation of solar panels
vegetation/vegetation changevegetation/vegetation change
removal of vegetationgreen roof retrofit
modification of sports groundsgreen roof after fallow land
temporary construction sitegreen roof after vegetated area
structural changedynamic changes
uncategoriseduncategorised
Publisher’s Note: MDPI stays neutral with regard to jurisdictional claims in published maps and institutional affiliations.