Article

Relations of Public Transport Use and Car Ownership with Neighbourhood and City-Level Travel Purposes in Kerman, Iran

by
Houshmand Masoumi
1,2,*,
Chengete Chakamera
3,
Liberty Mapamba
3,
Noleen Pisa
2 and
Hamid Soltanzadeh
4
1
Center for Technology and Society, Technische Universität Berlin, Kaiserin-Augusta-Allee 104, 10553 Berlin, Germany
2
Department of Transport and Supply Chain Management, College of Business and Economics, University of Johannesburg, Kingsway Campus, Cnr Kingsway and University Road Auckland Park, Johannesburg 2006, South Africa
3
Institute of Transport and Logistics Studies (Africa), University of Johannesburg, Johannesburg 2006, South Africa
4
Independent Researcher, 10553 Berlin, Germany
*
Author to whom correspondence should be addressed.
Urban Sci. 2022, 6(3), 48; https://doi.org/10.3390/urbansci6030048
Submission received: 27 May 2022 / Revised: 28 June 2022 / Accepted: 9 July 2022 / Published: 13 July 2022

Abstract

:
There are significant deviations in travel mode choice drivers between developed and developing countries. This study investigates the determinants of car ownership and public transit ridership in Iran. Using survey data from 800 respondents, the determinants of travel behaviour of Kerman residents were investigated, based on gender, age, household size, car ownership, frequency of public transport ridership, number of working days per week, number of shopping activities in the neighbourhood per week, number of entertainment activities in the neighbourhood per week, and number of shopping activities in the city. Two multivariate models were estimated using the OLS and WLS methods. Our findings suggested that owning a car tends to increase as age, household size, number of working days and number of shopping days in the city decreases. An increase in the number of entertainment days in the neighbourhood raised the probability of car ownership while shopping in the neighbourhood did not influence car ownership. Public transport use was negatively influenced by gender, increased age and number of working days, but positively influenced by shopping in the city. Our research results have significant implications for transport planning. Firstly, changes in household size may not be a good basis to inform planning as our findings show that in Kerman as household size increases, car ownership decreases, and it does not influence public transport. Secondly, when planning road network connectivity (land use) higher working days are expected to increase both car ownership and public transport use.

1. Introduction

Urban transportation influences mobility, accessibility and economic productivity by facilitating the efficient movement of labour and goods and between various origins and destinations [1]. Effective planning and execution of urban transport provision and infrastructure are critical to minimise the negative effects of transport on economic activity and the environment. In addition, an understanding of travel behaviour, in particular mode choices, is critical in urban transportation provision planning, the provision of infrastructure and in designing urban transport management strategies [2].
Travel behaviour is the interaction between actors and transport system components in the pursuit of accomplishing mobility objectives [3]. Travel behaviour relates to mode choice preferences of users given trip attributes such as fare of travel/cost of travel, and quality of service attributes [4]. The trip purpose is one of the primary determinants of mobility objectives [5] and can be classified as work, school and shopping or leisure trips [6]. Observed travel behaviour is influenced by the socioeconomic characteristics of users such as income, household composition and employment status [2,3,7,8]. Secondly, the attributes of the transport system, namely private car ownership, relative costs of transit use vis a vis car usage, and access to public transit, impact the desired and required levels of travel [9]. Furthermore, the attributes of location, i.e., population density, local access to amenities, among others [10,11], can play a role. Additional frameworks for understanding the motivational aspects of observed behaviour make the study of travel behaviour completer and more meaningful for planning purposes. As such, travel behaviour should not be restricted to utility functions but should also include the psychological factors that drive behaviour [12]. Hence, in the review of literature on the impact of car ownership on public transport usage, both utility functions and attitudinal frameworks, such as the theory of reasoned action [13], theory of planned behaviour [14] and material possession attachment [15], were used to explain observations and clarify the existing opportunity.
A major limitation in the exploration of generalisability of current travel behaviour research in the Middle East and North Africa (MENA) region is the unavailability of data that is comparable to Western research [16]. Nevertheless, a transferability analysis on studies on Tehran, Istanbul and Cairo shows that the results of studies or applied practices on these three metropolitan studies are possible to be generalized to 27 cities of more than one million inhabitants located in the MENA region [17]. The city of Kerman in the southwest of Iran is considered to have a hot-arid climate, but its temperatures and climate can be similar to many cities in the MENA region. Likewise, the cultural and economic issues can have similarities to several large and small-large cities of the region. Therefore, the city can be a good example of several cities in terms of mobility choices. The city of Kerman had a population of 544,000 in 2021 [18]). The problem is that we do not know what determines car ownership and public transit ridership in Iran and similar countries, and whether such determinants differ from those of the high-income countries. This paper aims to narrow these research gaps. Two main research questions of this study were (1) how much is car ownership associated with the level and purpose of urban travels and family and social characteristics of passengers in large-medium sized and large cities of Iran? and (2) what are the relationships between public transport ridership of passengers and the above traits in such cities? The rest of this paper is organised as follows: Section 2 presents the literature review on car ownership, the dynamics of public transport usage, the relationship between car ownership and public transport usage as well as an overview of the methods for quantifying the effects of car ownership on public transport usage. Section 3 presents the research method while Section 4 presents the results. The discussion is provided in Section 5 while conclusions are presented in Section 6.

2. Literature Review

2.1. Car Ownership

Car ownership tends to be higher among higher income groups and car use increases with ownership levels [4,19]. Other important factors resulting in higher car ownership include an increase in GDP, which is often accompanied by an increase in disposable income and presence of school going children in the family, characteristics of residential areas and features of transport system [18]. In residential areas where there is no access to public transport systems, car ownership enables longer distance travel, flexible routing and higher speed travel, which tend to be preferred by higher income groups [20]. As trip length increases, as is the case when residence is removed from work and leisure locations, private car usage tends to be higher [20,21]. Thus, residential choice has a strong influence on car ownership and the reverse is also true. Furthermore, the built environment influences the adoption of car/public transit usage [21]. Areas with high car ownership tend to be high income areas that prefer and can afford lower density housing. On the other hand, higher densities are an enabler for efficient mixed land use strategies in spatial planning. Mixed land use reduces trip densities by provision of localised services [22], thus reducing trip length and the attractiveness of car ownership [21]. Furthermore, in high density areas, private car usage tends to be suppressed by decongesting policies such as parking lot restrictions, traffic calming [23,24].
Other factors that may drive car ownership include levels of education, as highly educated professionals, who generally have a high perceived value of time, tend to prefer driving [25]. More so, sociological characteristics may influence car ownership [26,27]. Younger generations in the developed countries are staying in school longer, joining the workforce later, being in predominantly short-term contract work and settling in relationships late and this reduces prospects of car ownership [28]. This trend could see convergence in developed and developing country car ownership trends. Additional pressures of social networks and digital reputation car ownership as a status symbol is decreasing in developed countries but still prominent in developing countries [29].
Stand-alone numerical studies on the determinants of car ownership in the MENA region have not been sufficiently undertaken and the results of existing studies are not consistent. An example of such studies has been published on Cairo, Tehran and Istanbul, whereas the results show that car ownership is a determinant of commute trip generation in the region. The variable is significant for Cairo and Istanbul, and marginally significant in Tehran [30]. In another study, it has been shown that household car ownership is a highly significant predictor of commuting distance in a cumulative sample of Istanbul, Tehran and Cairo [31]. Nevertheless, as said above, no consistent and comprehensive results about car ownership predictors in the region are available. Car ownership studies of the MENA region has the overall deficiencies of such studies in other developing regions of the world, such as in Latin America, which can be characterized by unavailability or lack of access to trustable public data of cars as well as other disaggregate sources of data [32].

2.2. The Dynamics of Public Transport Usage

Public transport is generally used by users who have access to it and may not have access to other alternatives or those who perceive it as more convenient. Hence, it will be affected by mode choice and indirectly influenced by residential location, household income and household composition [20] and attitudinal factors [33]. Additionally, perceived safety, travel time and quality of travel are major determinants in choice between public transport and private car use among users of convenience. Like car ownership and usage, culture and attitudinal factors influence the perceived convenience, thus it varies geographically.
Residential choice impacts mobility in that the features of residential neighbourhoods can influence accessibility of transport amenities, e.g., parking, public transit ways, etc. [34]. In Kerman, Iran, improving accessibility to public transportation and the convenience of using it can increase the likelihood of shifting from car driving to public transit use [35]. Moreover, spatial planning strategies also affect public transport uptake. Developed countries tend to have strict formalised rules around settlement development, whereas developing economies, especially in Africa, display a lack of formalised systems [36]. High population densities where there is high income is ideal as it makes it easier to develop viable transport systems [37]. Cases of relatively high density have been provided in New York, Adelaide and Brisbane, where car and transit usages are not mutually exclusive but driven by the attitudinal and utility functions of users. In such a case, factors such as the quality of service and the relative costs of car usage versus public transit travel time and route flexibility become determinants of choice of mode [4]. However, in most parts of the world, high densities tend to correspond with lower income and the higher uptake of public transport correlates to users of need where there are no viable alternatives [38].
Apart from usage of need and convenience, public transport uptake is positively influenced by affective users and this tends to vary by context [39]. In these contexts, psychological factors tend to have a strong influence that sometimes overrides the functional influences [39]. Changes to socialisation and how people work has seen alterations in consumption of public transport as well [29]. Several researchers have observed these changes, e.g., [40,41,42]. In spite of all these changes in car ownership and public transport usage, it is difficult to question that there is an interdependence between car usage and public transport uptake [43,44].
Like car ownership, public transport use has attracted limited number of statistical analyses using disaggregate data of users. One of the rare studies on the attitudes of people regarding public transit use in Tehran, Istanbul and Cairo shows that preferring personal car and lack of comfort are the main barriers of public transport use in these cities [16]. Frequency of public transit use is a significant determinant of commuting distances in in these three cities. However, such studies are actually rare, and there is a significant need to undertaking numerical analysis on the determinants of public transport use in the MENA region.

2.3. Relationship between Car Ownership and Public Transport Usage

In the context of the effect of car ownership on usage of public transport, many researchers claim that bus ridership falls as car ownership increases [40]. In reality, reduced car usage does not always translate to gains in public transport or active mode usage [41]. This is due to travel reducing factors such as high population density leading to localised provision of services and connectivity between points promoting use of active modes [45]. Other factors that have not been factored into many models could explain observed changes, e.g., the emergence of shared or leased asset models, the strong emergence of strong digital offices and social networks reducing need for travel [46,47]. These changes have been accompanied by changes in culture such as weakening symbolic value of car ownership [29] that is normally not accounted for in causal models. This may suggest that it is questionable to assume qualitative or quantitative causality alone could be used to explain observations. On the other hand, when coupled with attitudinal theories such theory of choice for instrumental, symbolic and affective functions [38] it becomes easier to explain observations in the context they were made. As an example, developing countries tend to be more biased towards making instrumental choices rather than symbolic or affective, due to limited options [25]. Thus, contextual variations in observed behaviour could be easier explained by studying the impact of context on psychological drivers and relating it to observed behaviours.

2.4. Methods for Quantifying the Effects of Car Ownership on Public Transport Usage

While numerical data have been generated of late, resource constraints tend to limit it to cross sectional and aggregate data. In a number of areas in the region, transport studies remain largely qualitative [48,49]. In the developed Western regions and increasingly in the south east Asian regions, car ownership and public transport usage data tend to be available in disaggregate form at household level [50]. Disaggregate data are deemed to be better at reducing bias and depicting the influences of human behaviour in studying the interaction between car ownership and public transport usage [51].
Discrete choice analysis is the most prominent approach that has been used in this subject area, considering that car ownership is a categorical variable [52]. Multinomial Logit (MNL) models have been used the most by researchers in the analysis of car ownership in the Western context [51,53,54]. Nested MNL uses multiple dimensions of choices to be evaluated [55]. Multinomial probit (MNP) model is less used but has been used in rare occasions due to computational demands that make parameter estimation difficult [56]. As an alternative to MNL, dynamic programming with embedded continuous discrete choice models can be used [57]. However, mixed MNL has been found to provide satisfactory results in many cases [58].

3. Materials and Methods

This empirical work is based on a survey undertaken in Kerman, Iran. The survey was undertaken in the daytime by interviewing a sample of 800 individuals on the streets of the city. A standard questionnaire of 38 questions including six sections about socioeconomics, commuting, perceptions about the neighbourhood, public transport use, active transport, and general idea of the living neighbourhood was applied. Data were collected from inhabitants of four neighbourhoods in western regions of the city: Bahonar, Amir Kabir, Motahari and Pars accommodating 2722, 1845, 2663 and 3028 residents, respectively. More detailed information about the survey including the location of the city and neighbourhoods, technical information and descriptive statistics have been described elsewhere [35].
This study takes a limited piece of data of the collected data explained above. Nine questions were selected that represented the choices about socioeconomics and family, car ownership and public transit use, and urban travel purposes. These included gender (categorical: male/female), age (continuous: respondents from 15 to 73 years), household size (continuous: from 1 to 9), car ownership (continuous: from 0 to 9), usual frequency of public transport ridership (categorical: never, seldom, monthly, weekly, and every day), number of working days per week (continuous: from 0 to 7), number of shopping activities in the neighbourhood per week (continuous: from 0 to 7), number of entertainment activities in the neighbourhood per week (continuous: from 0 to 7) and, finally, number of shopping activities in the city centre (continuous: from 0 to 7). Table 1 summarizes the frequencies and categories of the explanatory factors of this study. In the appendices, the means of the categories and their standard errors are presented (Table 1).
To answer the first question of this study, two least squares models were developed: an Ordinary Least Squares (OLS) and a Weighted Least Squares (WLS). Household car ownership (N = 800) was used as dependent variable, while age (N = 800), gender (N = 800), household size (N = 800), number of working day per week (N = 800), number of shopping activities in the neighbourhood per week (N = 798), number of entertainment activities in the neighbourhood per week (N = 794) and number of shopping activities in the city centre per week (N = 799) were the predictors. Equation (1) shows the estimated model, using both the OLS and WLS. The estimated empirical model is of the form:
c o i = α i + a g e i + g e n i + h s e i + n w d i + n i a i + n s a i + ε i i = 1 , ,   800
where:
co—car ownership
age—age
gen—gender
hse—household size
nwd—number of working days per week
nia—number of entertainment activities in the neighbourhood per week
nsa—number of shopping activities in the neighbourhood per week
All the dependent and independent variables were continuous except gender, which was written in numerical form but in fact had a categorical meaning (0 = female and 1 = male). The confidence intervals were set to 95% and p-values of less than 0.01 were considered to be highly significant, those between 0.01 and 0.05 were significant, and those that fall between 0.05 and 0.1 were marginally significant. To test the significance of the model, F-test, Breusch-Pagan, Modified Breusch-Pagan, and White heteroscedasticity tests were applied. Based on the OLS model, except for White test, the results of other tests rejected the null hypothesis of no heteroscedasticity with p-values of less than 0.001. The p-value of F for the White test was 0.098, so the OLS model was assumed to be homoscedastic. To yield more reliable models, a WLS model was developed which showed homoscedastic results with p-values of 1 for all of the above four tests, confirming that the model is homoscedastic (Table 2). The weights of the WLS were calculated by dividing 1 by the square of unstandardized predicted values of car ownership for each individual. IBM SPSS Statistics version 25 (Armonk, NY, USA) was applied for analysis.
In order to model public transit use, binary logit model was developed for public transportation ridership by transforming the basic categories (never, seldom, monthly, weekly, and every day) to two categories of infrequent users (never, seldom, and monthly) and frequent users (weekly and every day). Equation (2) shows the model for public transport ridership.
p t r i = α i + a g e i + g e n i + h s e i + n w d i + n i a i + n s a i + ε i i = 1 , ,   800
where:
ptr—public transport ridership.
The independent variables were appropriate for application to the model as they were, so they were not recoded into new categories. They only change that was made concerned age: they were recoded into five categories, as seen in Table 1, and the logit model was run, but the R2 value was found to be smaller than that of the model with 59 age classes representing ages between 15 and 73 years. Thus, the age categories were dropped to have a higher R2 (unsatisfying effects of some predictors in models usually happen in such models. Elimination of some of the independent variables that have bad effects on the model can be continued until the best model including the highest R2 is produced). SPSS software was stopped at four iterations because the parameter estimate changes became less than 0.001.

4. Results

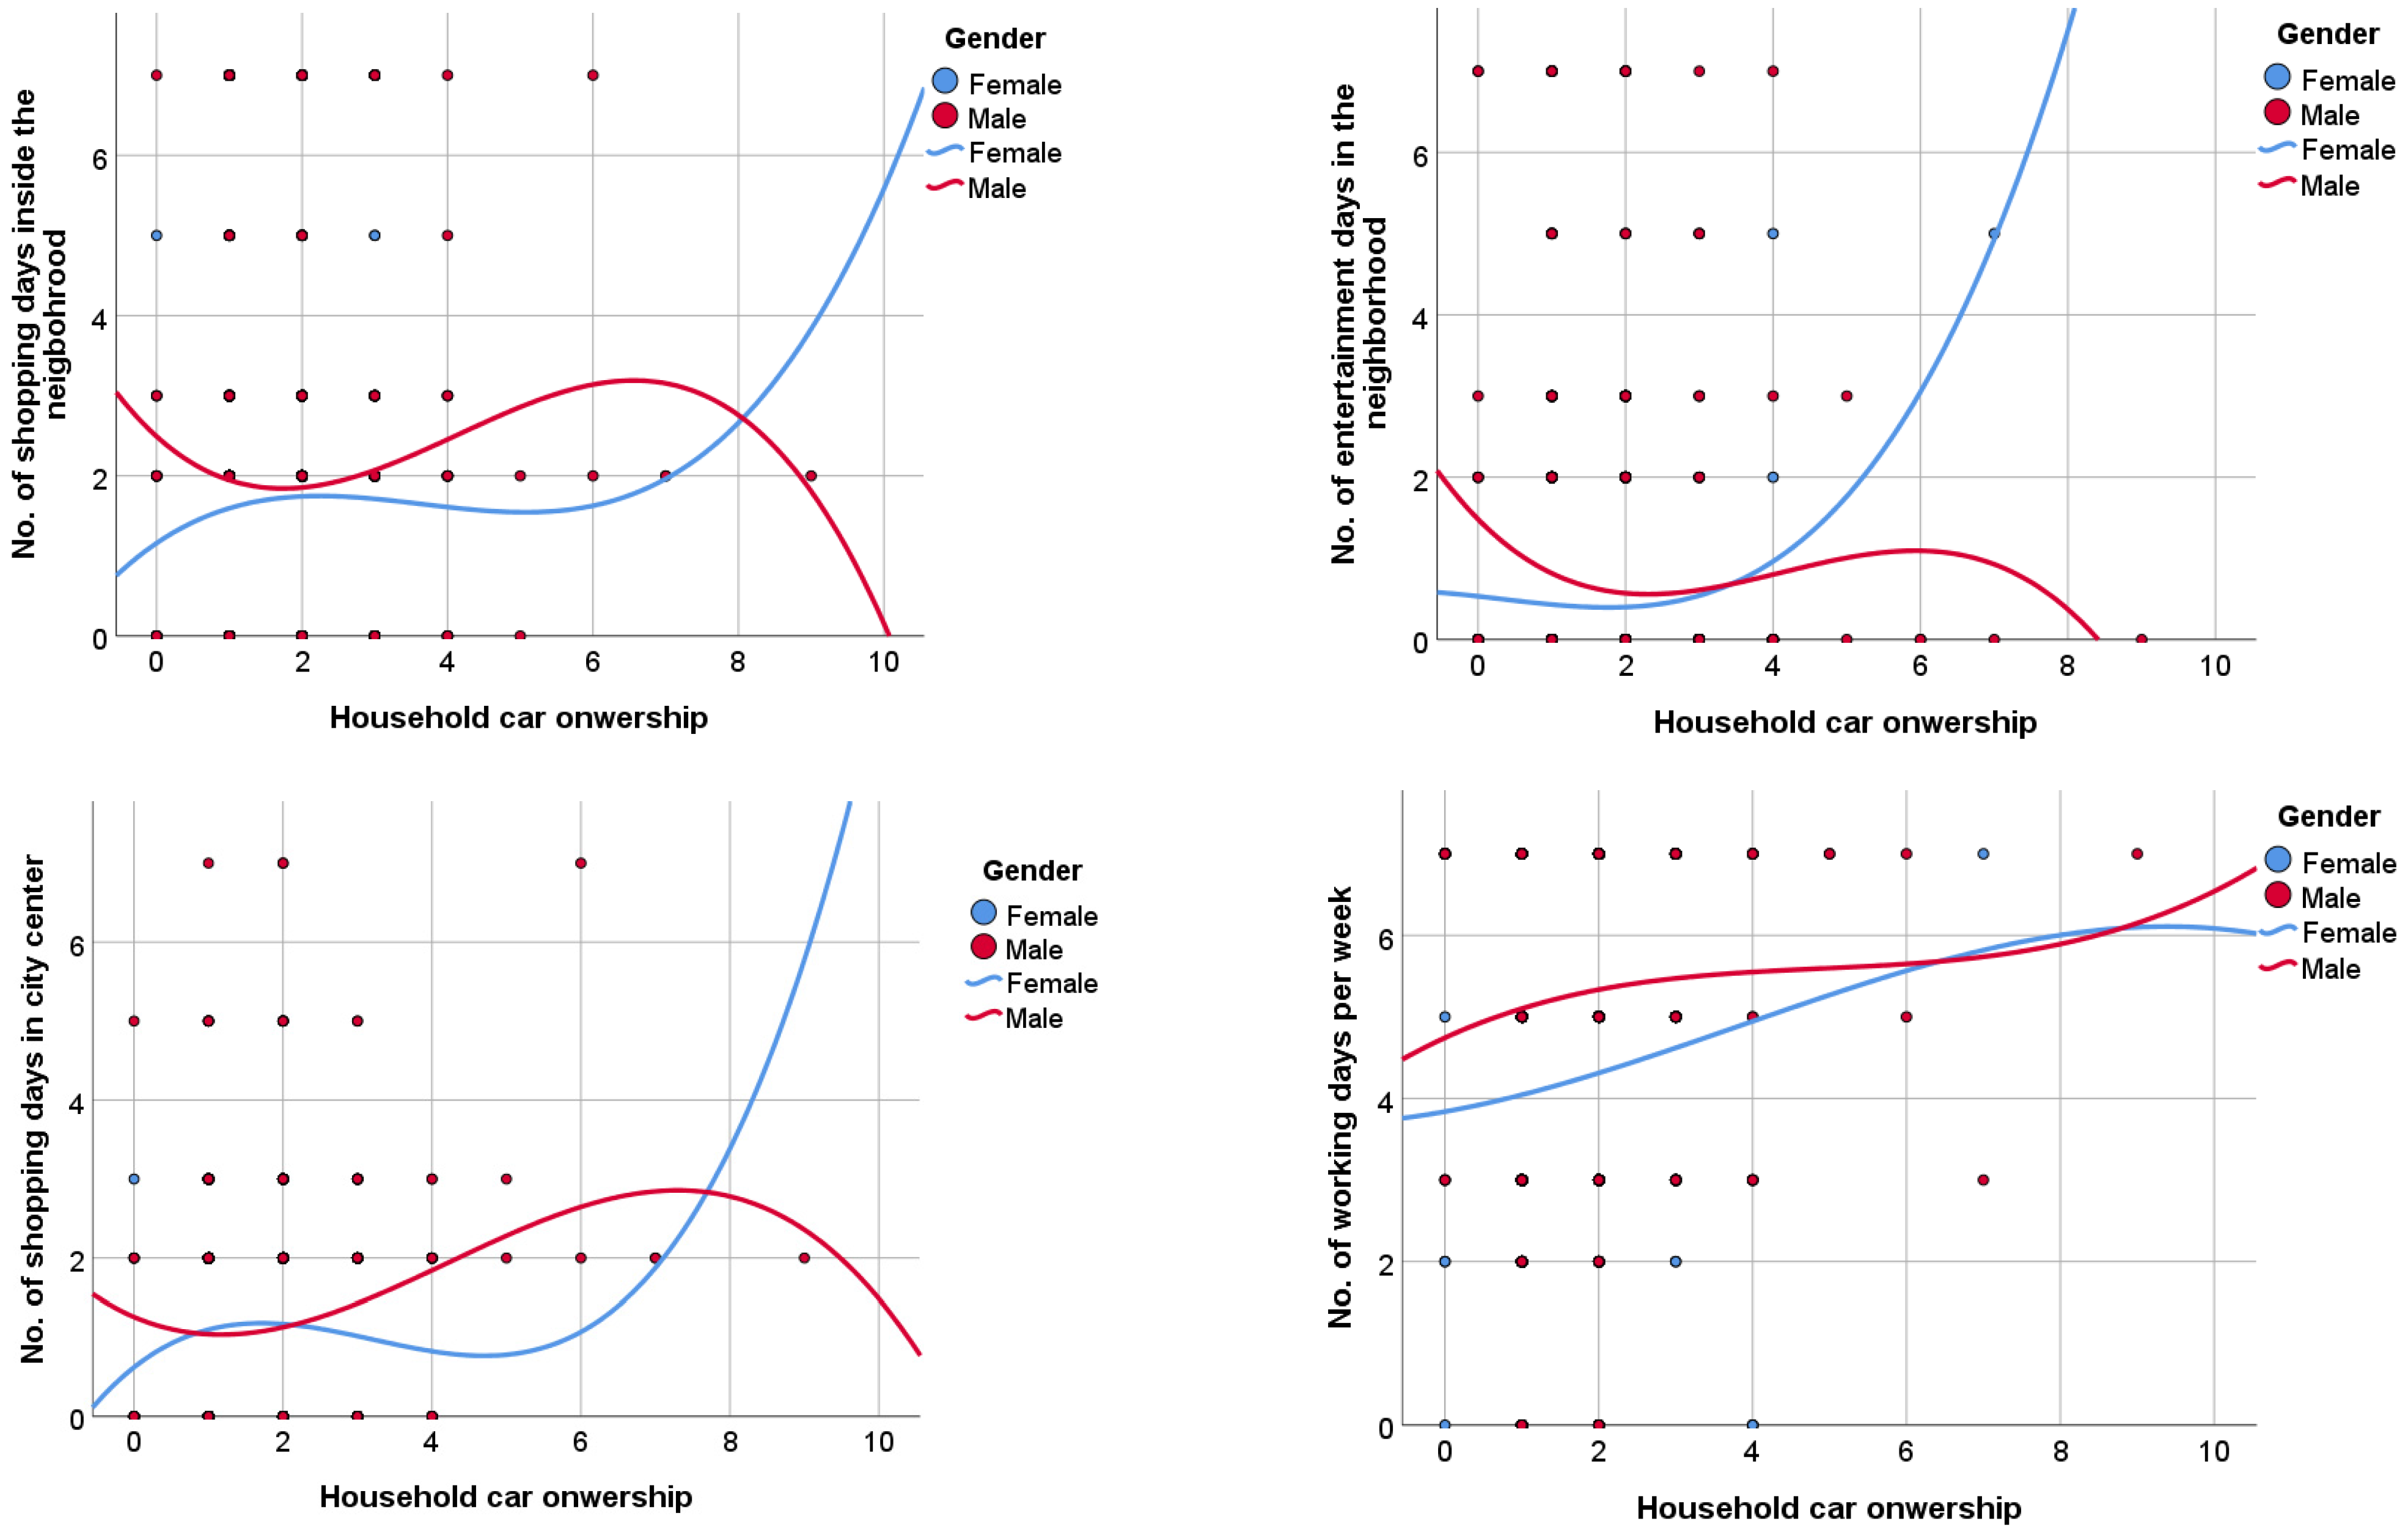
4.1. Household Car Ownership

The results of OLS and WLS models show that four (household size, number of working days, entertainment days within the neighbourhood and the number shopping days in the city centre) out of seven tested variables are significantly correlated with the household car ownership. Table 3 reflects significance of the findings of the two models, indicating that the estimates of these four variables are stable. This general result is similar in the OLS and WLS models. The difference between the two models is that the WLS model is homoscedastic, in other words, the error has the same variance with any car ownership value, i.e., for any give household size, the errors from the car ownership trend line have almost equal variance. In addition, the WLS model has a higher R2 value (0.425), so it has a better fit and is more reliable. The results of age and gender are not significant. This may refer to less importance of individual characteristics regarding car ownership. The third insignificant variable is shopping in neighbourhood, which seems not related to car ownership. Another family-related variable is household size, which has been highly significant (p < 0.001) in both models. These two household variables show how much car ownership is under the influence of collected needs in Kerman. The other neighbourhood variable, entertainment in the neighbourhood has developed significant results. Finally, longer-distance shopping activities, i.e., in the city centre or Central Business District (CBD), are highly significant in the OLS model and significant in WLS models.
In order to study the significant correlations of car ownership with different factors in more detail, Table 4 provides more information including coefficients, standard errors, and T statistics. This table reflects levels of significance of categories of variables that were not visible in Table 3, i.e., the WLS models shows there are marginally significant negative correlations between car ownership and some of the ages such as 17 (B = −1.375, p = 0.062), 20 (B = −0.881, p = 0.093), 21 (B = −0.966, p = 0.066), 27 (B = −0.920, p = 0.085), 29 (B = −0.964, p = 0.068), 30 (B = −0.971, p = 0.062), 37 (B = −0.901, p = 0.096), 42 (B = −0.901, p = 0.093), 43 (B = −0.999, p = 0.079), 44 (B = −1.188, p = 0.088), 57 (B = −1.611, p = 0.072), 68 (B = −1.220, p = 0.081), 73 (B = −1.309, p = 0.084). Moreover, a significant negative relationship was found for the ages of 36 (B = −1.177, p = 0.034) and 45 (B = −1.083, p = 0.042). These significant correlations generally show that with increase of age, car ownership decreases.
The significant negative association of car ownership and household size is very clear in both models, particularly the OLS model. The same is true for number of working days per week; those who work more days per week have less household car ownership. Like, the results of Table 3, the results of Table 4 show no significant relationship between car ownership and shopping in neighbourhood. That is perhaps because of possibility of using other modes for micro-scale non-work trips such as shopping. However, Table 4 does not show much significant correlations for entertainment in local level. Significant categories are those that concern people with 5 or more days of local leisure activities. By increasing the days of entertainment in the neighbourhood, car ownership increases. Finally, shopping in the city centre has a significant, or in the WLS model marginally significant, correlation with auto ownership.
As Figure 1 illustrates, interestingly, the pattern of the relationship between household car ownership and four different purposes including the number of days of shopping inside the neighbourhood (in the vicinity of the living place), shopping in the city centre, leisure and entertainment activities, and working days have opposite patterns for the males and females of the sample. These four variables together with gender are all listed in the final OLS and WLS models.

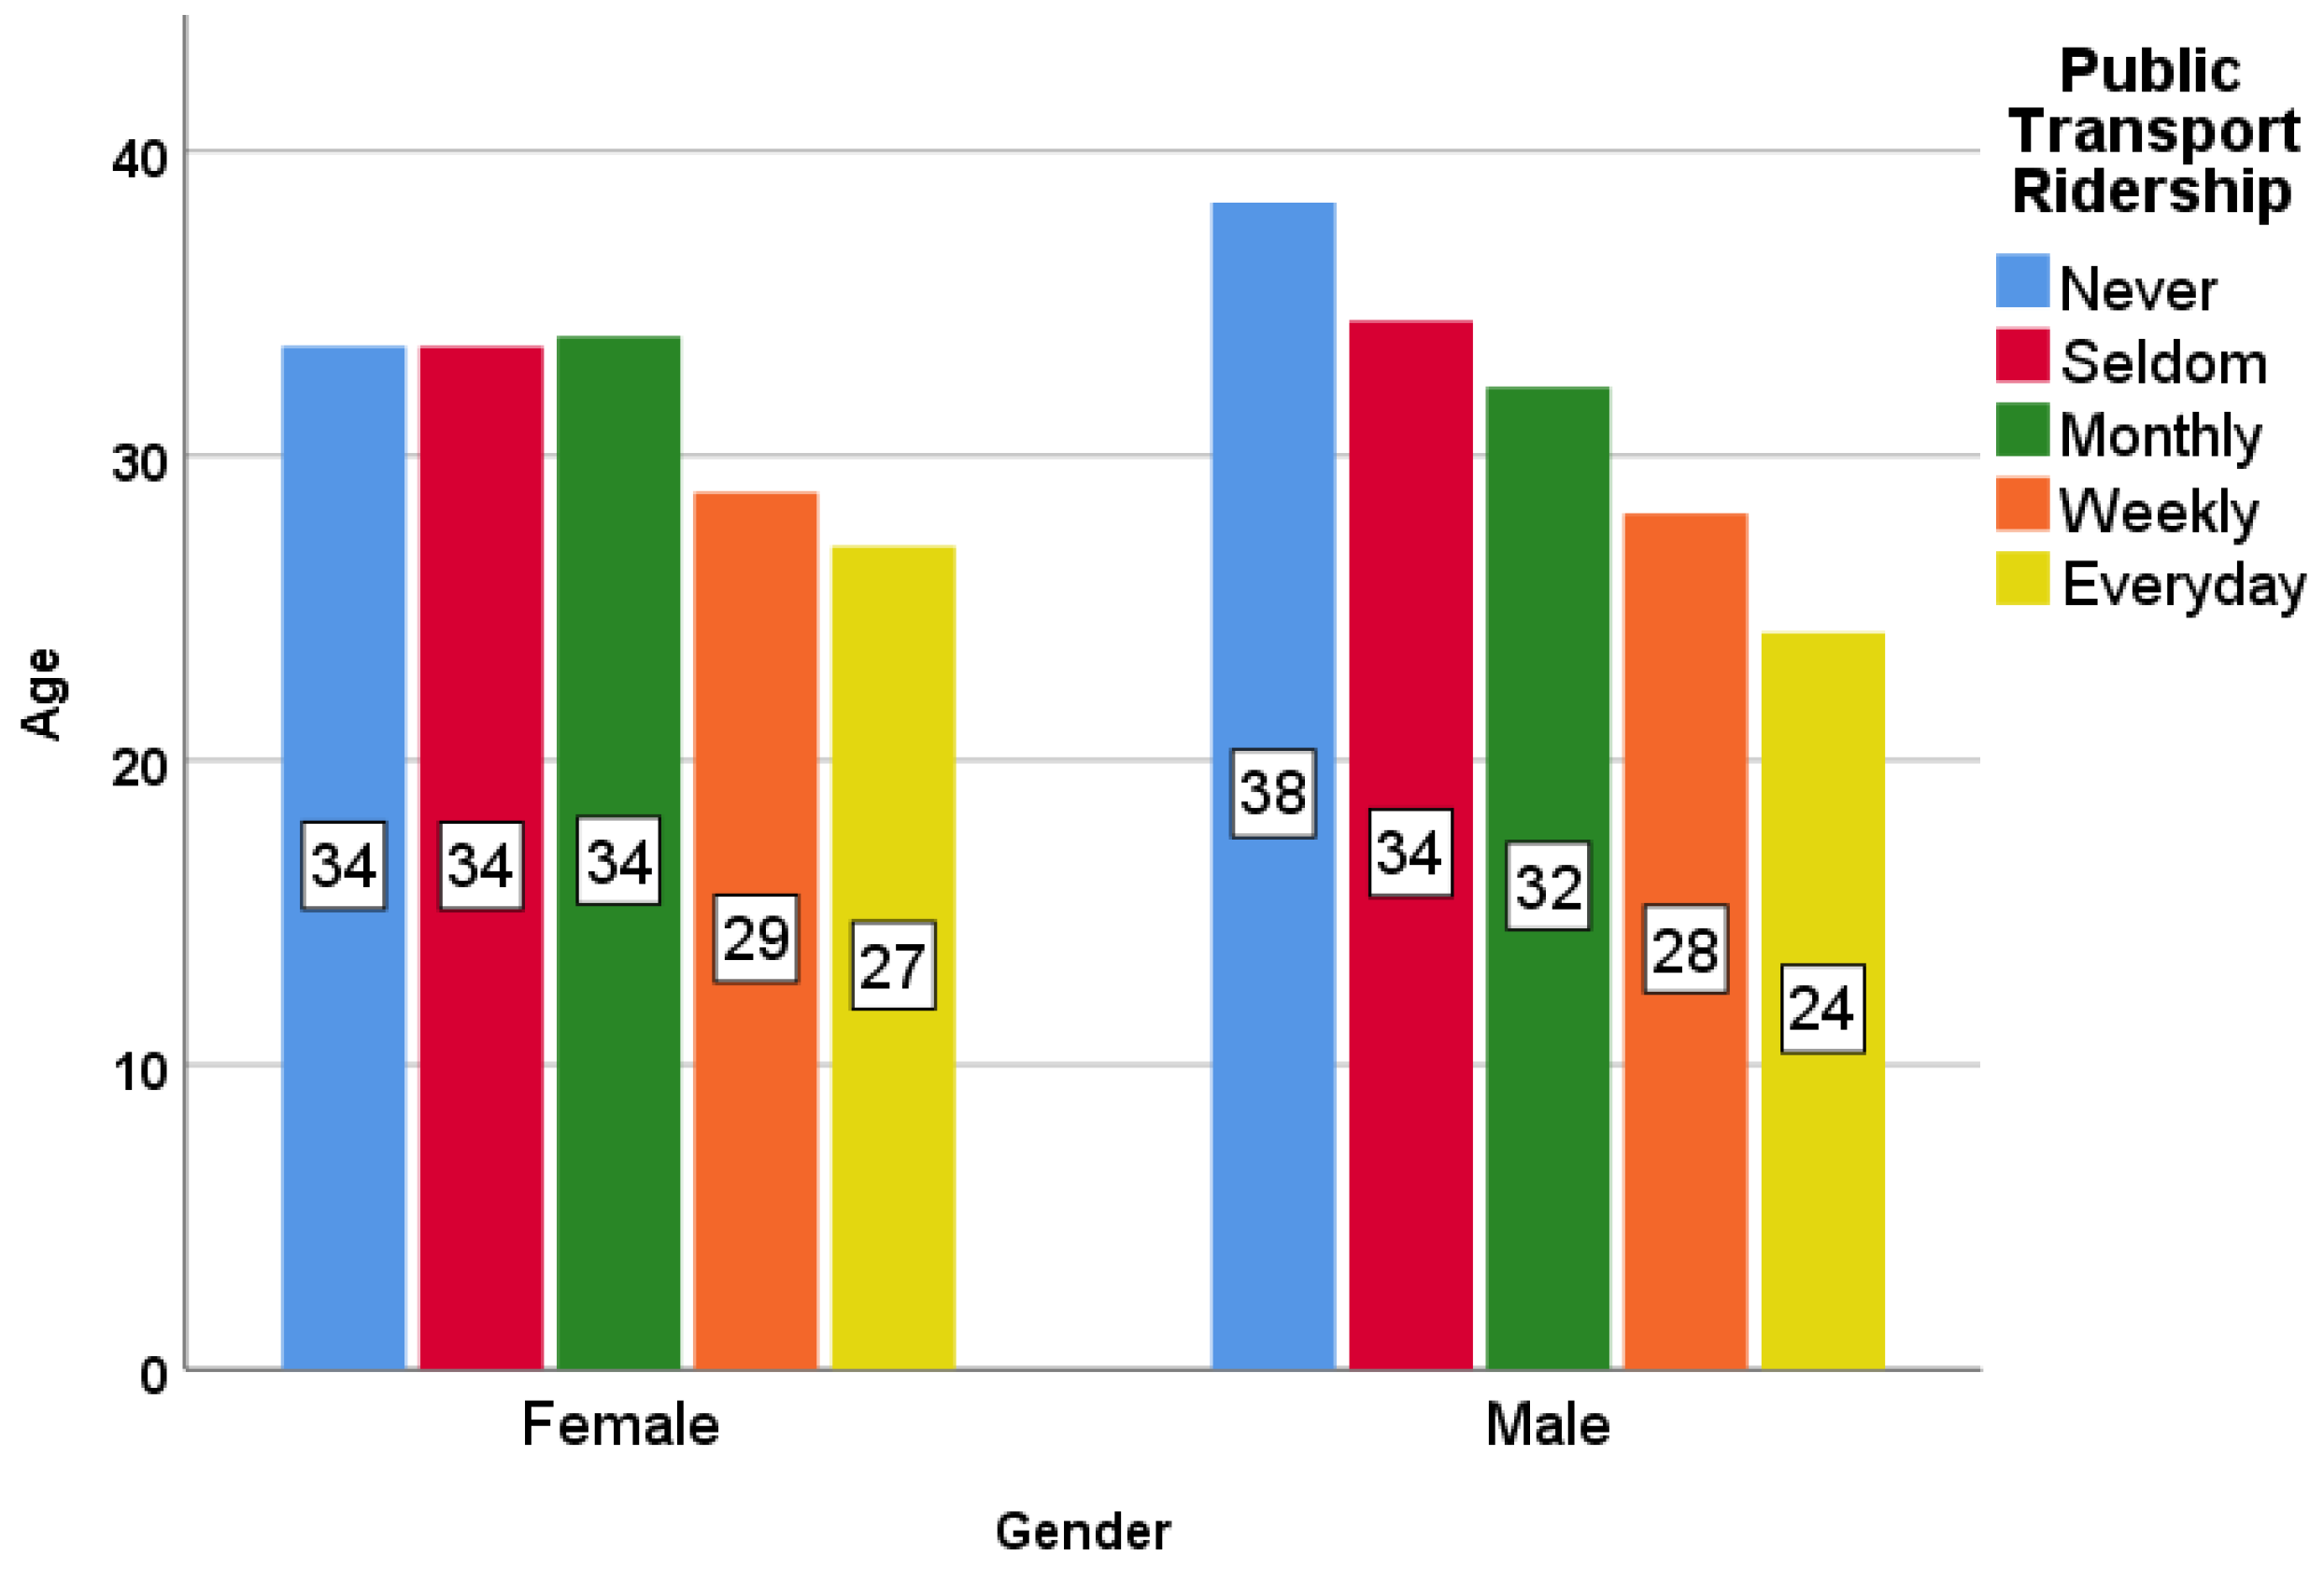
4.2. Public Transport Ridership

The binary categories of the initiated logit model take 0 for infrequent users and 1 for frequent users, hence positive sign of coefficients (B) indicate positive correlation of the explanatory variables with public transit use. The results of the binary logistic model with the dependent variable of public transport ridership have been summarized in Table 5. Age has a relatively week but negative but highly significant correlation with public transit use (p < 0.001). If the age of transit users decreases by about eight percent, the state of transit use will change from infrequent (never, seldom, and monthly) to frequent (weekly and every day). The gender-related correlations are negative but marginally significant (p = 0.085). Figure 2 clarifies the univariate relation between public transport ridership, gender, and age better. As seen in the figure, there is no difference between the levels of public transport use among females of different ages, while this is not the case for males. From a descriptive point of view, when the age of men increases, they tend to use less public transit.
Unlike car ownership, public transit use does not show any significant association with household size. Working is marginally significant and has negative correlation. A decrease of about eight percent in the number of working days is associated with a change from frequent to infrequent transit use or vice versa (p = 0.054). The variables related to neighbourhood, namely entertainment and shopping days, are not significant. However, the number of shopping days in the city centre is significant and seems more effective. A 17-percent of a day increase in shopping days in the city centre is associated with a change from infrequent to frequent public transport ridership (p = 0.005). These findings can provide a good basis for planning change in the mode choices of passengers in the city and country.

5. Discussion

5.1. Contextuality of Car Ownership and Public Transport Ridership

Lack of studies regarding car ownership and public transport ridership in the Middle East as well as developmental progress in Iran’s cities necessitate an extensive analysis and comparison against evidence from high-income countries where most similar work exists [59,60,61,62,63,64,65,66]. A decrease in car ownership in Kerman as age increases is comparable to some evidence in the high-income countries. For example, Dargay et al. (2008) noted that the chances of car ownership diminish for household members aged 65+ in France, Portugal, and Greece [66]. However, van Eggermond and colleagues confirmed that those aged 65+ in Switzerland have a higher probability of owning a car, but with decreased usage [65]. Dargay et al. also established this in the UK [66] and Eakins in Ireland [64]. Interestingly, for Eakins (2013), older people were more likely to possess ‘2’ or ‘3+’ cars and less likely to possess ‘zero’ or ‘1’ cars. Close to our findings and evidence from high-income countries, the effect of age on car ownership is more likely to be non-linear [64]. Our estimates indicate that the 20- and 60+ are more likely to not own a car compared to those in between, supporting findings in Switzerland [63]. Our results do not reveal differences in the effect of age on both car ownership and public transport ridership, as older people tend to have less of both. This is tied to Buehler, who discovered that retired people in the US are less likely to ride public transport, but the young ones do. Yet, for Germany, the retired were more likely to use public transport, while young people were less likely [62]. Kowald et al. disclosed that young and old people are more likely to use public transport in Switzerland, while those in between are strongly likely to own cars [63].
The negative effect of household size on car ownership in Kerman is against the general positive effect documented by several authors [59,60,61,63,64,65,66] in high-income countries. In Belgium, Denmark, France, Greece, Ireland, Italy, Portugal, Spain, the Netherlands and the UK, car ownership was found to be lower for single adults than for households with two adults or more [66] and that having a partner or having children raised the probability of owning a car in the UK [61]. Thus, when household size increases, people in developed countries are likely to buy a car, which is not the case in Kerman. It is possible that in Kerman, many people may find it difficult to own a car when their household sizes increase, especially when income earners within a household are few. Yet in high-income countries, households may have a high number of income earners. Our findings suggest that an increase in household size does not influence public transport use. Similar findings were reported by [62] whereby households with children but without a job in Germany, and households with children and no job in the U.S., were more likely to use public transport. In Switzerland, Kowald et al. disclosed that couples with children are less likely to use public transport [63].
While traditionally the travel patterns are believed to vary between men and women, which may explain car ownership and public transport ridership, our findings suggest no differences between male and female in terms of car ownership, but males are less likely to ride public transport. This differs from [63], for example, who showed that men had a higher probability of owning a car and hold GA travel ticket (public transport ticket type) in Switzerland (a GA travel ticket is also called GA Travel card, which permits Swiss citizens unlimited traveling throughout Switzerland by public transport (rail, bus, boat) for a year). Interestingly, they reported that the gender gap between men and women was declining over time. Our findings support Thakuriah et al. (2010), who showed that the odds for car ownership was equally likely among women and men in the U.S. [60]. The negative coefficient of gender on public transport in this study is similar to the results of Buehler in the U.S [62].
The negative effects of the number of working days on both car ownership and public transport ridership were less expected. Increased working days was expected to increase public transport use or car ownership, ceteris paribus. The number of working days is connected to employment and expected income, which should improve car ownership. In high-income countries, unemployment was largely linked to less vehicle ownership [60,63,66] and employment to a high possibility of owning a car. Other studies made a vital observation of a positive effect of work trips on public transport use in Germany and the U.S. People in Kerman may use other means of transport to visit workplaces, such as bicycles and walking, especially if they stay close to where they work [59,62,64]. As a result, an increase in working days could not show a significant effect on either car ownership or public transport use.
As the number of shopping days in the city increases, the probability of owning a car decreases but public transport use increases in Kerman. This suggests the substitution of public transport for private cars when going shopping in the city. A similar result is shown by Buehler’s (2011) estimates which showed an increase in using public transport, bike and walking for shopping trips in the U.S. [62]. However, their results were reversed for Germany whereby shopping trips were less likely to be made using public transport, bikes and foot. Our results for shopping in the neighbourhood are not in line with the findings of van Eggermond et al., who investigated Switzerland and mentioned that “a higher diversity of destinations within walking distance decreases the likelihood of owning one vehicle or more vehicles” and that this led to insignificant parameter estimates [65]. We believe that in Kerman, people do their shopping in the neighbourhood via walking and biking, hence the insignificance of the coefficients. Minor evidence was found in this study that the number of entertainment activities in the neighbourhood may increase the chances of car ownership, which occurs when the activities are increased. Therefore, in Kerman, high utility for leisure is also linked to owning a car. Overall, the findings of this research strongly agree with evidence from high-income economies that underscore the importance of demographics and socio-economic characteristics as determinants of car ownership and public transport ridership. However, the nature of the effects (positive or negative) varies, especially for household size and number of working hours (negative in Kerman and largely positive in high-income countries). For the other determinants, the signs largely vary even amongst the high-income countries.

5.2. Feedback to Theories

Except for shopping in the city, which increases the public transport ridership, the investigated factors are negatively related to car ownership and public transport use. Based on the theory of planned behaviour (TPB), there should be latent factors such as beliefs, attitudes, and perceptions that shape the travelling behaviour of the Kerman residents. While these underlying beliefs were not directly investigated in this study, the results of the survey of travellers’ opinions in Kerman revealed information that can be used to interrogate our findings [35]. First, personal cars were perceived to be more convenient and easier to use than public transport. Second, owning a car did not necessarily discourage people from using public transport. Third, males ride public transport because of its low cost or expensive car fuel, yet women do it for personal interest, speed, safety/security and not possessing a car. Those aged 29 years and below use public transport far more than other age groups due to lower price and higher safety and security, personal interest, promotion of public transport culture and not owning a car. We believe that these reasons for using cars and public transport could represent the presence of motivational factors that influence a particular behaviour (behavioural intention). This may apply to our results whereby males are less likely to ride public transport while young people and female are more likely to ride public transport. Shafiei and Ngendra (2017) also indicate that 64% (36%) of public transport riders in Kerman were female (male) [67].
Although the Kerman residence may perceive cars to be convenient, our results show that this does not translate into car ownership. The psychological model of mode choice behaviour indicates that there are many supply-oriented factors (mode availability, mode design, mode operations and mode marketing) and demand-oriented factors (personal demographics, personal lifestyle, familiarity and satisfaction with the mode and purpose of the trip) that determine the psychological utility of a particular mode, for a specific trip purpose in the mind of the traveller. While we cover some of the demand-oriented factors, there are possible supply-oriented factors that inhibit car ownership and public transport use in Kerman. Despite the residence being aware of public transport benefits, inadequate information concerning public transport schedules, lack of attractive facilities and suitable waiting stations and unreliability discourage people from using public transport [67].

5.3. Urban Planning Implications for Controlling Car Ownership and Increasing the Modal Share of Public Transportation

The intricacy of relationships among car ownership, public transport ridership and travel behaviour have important policy implications for transportation planning and land use. First, while planners could use large household sizes to anticipate increased car ownership and public transport use, our findings imply that this may not be the best approach in Kerman as increased household size decreases car ownership and does not influence public transport. Kerman has a higher proportion of family households, 80% compared to 73% of the country, which policymakers must take as an opportunity to encourage car ownership and public transport ridership by addressing other possible hindrances (e.g., unattractive public transport facilities, long waiting time and unreliability).
Second, when planning road network connectivity (land use) in Kerman, our findings suggest that policymakers may not rely on the number of working days to expect increased car ownership and public transport use. Workers may work more hours but earn low income to sustain them. According to the City of Kerman (2019), the median household income in Kerman was at $42,046, which is 33% below the state average, and Kerman had a higher proportion of households earning less than $20,000. Thus, increasing income and addressing the supply-oriented problem raised earlier should improve car ownership, public transport ridership, utilisation of parking areas and roads.
Third, the observation that people in Karman are more likely to use public transport and less likely to use cars when shopping in the city implies that policymakers should prioritise enhancing the state of public stations/terminus and reliability of public transport and reducing the waiting time. Parking spaces for cars near shopping areas in the city will not be a major challenge as long as the majority use public transport. This can also address the problem of congestion and pollution.
Fourth, it is imperative for transportation and land use planning to consider the observation that car ownership and public transport increases as age decreases from 73 to 17. Kerman had a median age of 34.2 years in the time of the survey of this study, reflecting a younger population than the entire country. This young-middle age population is more likely to possess a car than the young and the old. Kerman has a unique opportunity to maximise the benefits of transportation by meeting the travelling needs of this young population. For real estate developers, it means the land with car parks and buildings with carports are more likely to attract young persons. Car manufacturers may target the young population as well. Fifth, since males are less likely to use public transport than females, public transport providers should expect security and safety to become the prime factor for women as shown in Soltanzadeh and Masoumi’s survey (2014) [35]. Finally, places of entertainments in Kerman require parking spaces as the residents mostly use cars and not public transport for this travel purpose.

5.4. Limitations of the Study

It is crucial to mention some limitations of this study. First, this empirical work is based on a survey undertaken in the city of Kerman, Iran. Data from the other cities of Iran would help to validate our findings. Second, this study only investigated car ownership and public transport. However, the investigated socio-economic factors of individuals influence other travel choices, such as biking and walking, which all provide a comprehensive picture of travel behaviour in a city. Third, this study did not ask respondents the reasons for owning or not owning a car, riding or not riding public transport. This would have provided more insight into the significance or non-significance of specific variables and the direction of effect (positive or negative).

6. Conclusions

This article presents evidence of the socio-demographics that determine car ownership and public transport ridership in Kerman, Iran. While similar studies were mostly undertaken in high-income countries, this was lacking in developing countries such as Iran. About 800 individuals were surveyed to extract information about their gender, age, household size, car ownership, frequency of public transport ridership, number of working days per week, number of shopping activities in the neighbourhood per week, number of entertainment activities in the neighbourhood per week and number of shopping activities in the city. Two multivariate models were estimated using the OLS and WLS methods. The first (second) model specified car ownership (public transport use) as the dependent variable. Our findings suggested that owning a car tends to increase as age, household size, number of working days and number of shopping days in the city decrease. An increase in the number of entertainment days in the neighbourhood raised the probability of car ownership while shopping in the neighbourhood did not influence car ownership. Public transport use was negatively influenced by gender, increased age and number of working days, but positively influenced by shopping in the city. The implications of the findings were discussed.
Future studies may improve the findings of this paper by surveying more than one city in Iran to intensify the knowledge concerning the travel behaviour of people in the country. Other travel choices such as cycling and walking can be included in the analysis to enhance our knowledge of model choices and use across various travel purposes. Furthermore, the reasons for various model choices can be sought from the respondents as well as their income categories. Moreover, it will be interesting for future research to investigate the effects of supply-oriented factors alongside the demand-oriented factors that influence the travel behaviour of people. It allows for a comprehensive picture of whether car ownership and public transport use are mostly driven by supply-side (transport provides) or demand-side (travellers) factors.

Author Contributions

Conceptualization, methodology, resources and data, formal analysis, writing—original draft preparation, and writing—reviewing and editing: H.M.; writing—original draft preparation and writing—reviewing and editing: C.C., L.M. and N.P.; data collection: H.S. All authors have read and agreed to the published version of the manuscript.

Funding

This study did not receive any funding.

Institutional Review Board Statement

Ethical review and approval were not obtained for this study because no intervention was applied to the participants.

Informed Consent Statement

Written informed consent has not been obtained from the respondents of the interviews of this study due to the cultural and socio-political conditions of the country in which data were collected.

Data Availability Statement

At the time of the publication of this paper, the data have not been shared in a repository.

Acknowledgments

We acknowledge support by the German Research Foundation and the Open Access Publication Fund of Technische Universität Berlin.

Conflicts of Interest

The authors declare no conflict of interest.

References

  1. Banister, D. Transport and Economic Development: Reviewing the Evidence. Transp. Rev. 2012, 32, 1–2. [Google Scholar] [CrossRef]
  2. Noblet, C.L.; Thøgersen, J.; Teisl, M.F. Who Attempts to Drive Less in New England? Transp. Res. Part F Traffic Psychol. Behav. 2014, 23, 69–80. [Google Scholar] [CrossRef]
  3. Bohte, W.; Maat, K.; Van Wee, B. Measuring Attitudes in Research on Residential Self-Selection and Travel Behaviour: A Review of Theories and Empirical Research. Transp. Rev. 2009, 29, 325–357. [Google Scholar] [CrossRef]
  4. Paulley, N.; Balcombe, R.; Mackett, R.; Titheridge, H.; Preston, J.; Wardman, M.; Shires, J.; White, P. The Demand for Public Transport: The Effects of Fares, Quality of Service, Income and Car Ownership. Transp. Policy 2006, 12, 295–306. [Google Scholar] [CrossRef] [Green Version]
  5. Sun, D.J.; Zhang, C.; Zhang, L.; Chen, F.; Peng, Z. Urban Travel Behavior Analysis and Travel Time Predicting Based on Floating Car Data. Transp. Lett. Int. J. Transp. Res. 2014, 6, 118–125. [Google Scholar] [CrossRef]
  6. Hyodo, T.; Montalbo, C.; Fujiwara, A.; Soehodho, S. Urban Travel Behavior Characteristics of 13 Cities Based on Household Interview Survey Data. J. East. Asia Soc. Transp. Stud. 2005, 6, 23–38. [Google Scholar]
  7. Klein, N.J.; Smart, M.J. Millennials and Car Ownership: Less Money, Fewer Cars. Transp. Policy 2017, 53, 20–29. [Google Scholar] [CrossRef] [Green Version]
  8. Jain, D.; Tiwari, G. Explaining Travel Behaviour with Limited Socio-Economic Data: Case Study of Vishakhapatnam, India. Travel Behav. Soc. 2019, 15, 44–53. [Google Scholar] [CrossRef]
  9. Tyrinopoulos, Y.; Antoniou, C. Factors Affecting Modal Choice in Urban Mobility. Eur. Transp. Res. Rev. 2012, 5, 27–39. [Google Scholar] [CrossRef] [Green Version]
  10. Licaj, I.; Haddak, M.; Pochet, P.; Chiron, M. Individual and Contextual Socioeconomic Disadvantages and Car Driving between 16 and 24 Years of Age: A Multilevel Study in the Rhône Département (France). J. Transp. Geogr. 2012, 22, 19–27. [Google Scholar] [CrossRef] [Green Version]
  11. Alemi, F.; Circella, G.; Handy, S.L.; Mokhtaria, P.L. What Influences Travelers to Use Uber? Exploring the Factors Affecting the Adoption of on-demand Ride Services. In Proceedings of the Transportation Research Board 96th Annual Meeting, Washington, DC, USA, 8–12 January 2017. [Google Scholar]
  12. De Moraes Ramos, G.; Daamen, W.; Hoogendoorn, D.S. Expected Utility Theory, Prospect Theory, and Regret Theory Compared for Prediction of Route Choice Behavior. Transp. Res. Rec. J. Transp. Res. Board 2011, 2230, 19–28. [Google Scholar] [CrossRef]
  13. Fishbein, M.; Ajzen, I. Belief, Attitude, Intention and Behavior: An Introduction to Theory and Research; Addison-Wesley: Reading, MA, USA, 1975; Volume 10, ISBN 0201020890. [Google Scholar]
  14. Madden, T.J.; Ellen, P.S.; Ajzen, I. A Comparison of the Theory of Planned Behavior and the Theory of Reasoned Action. Personal. Soc. Psychol. Bull. 1992, 18, 3–9. [Google Scholar] [CrossRef]
  15. Kleine, S.S.; Baker, S.M. An Integrative Review of Material Possession Attachment. Acad. Mark. Sci. Rev. 2004, 1, 1–39. [Google Scholar]
  16. Masoumi, H.E. A Discrete Choice Analysis of Transport Mode Choice Causality and Perceived Barriers of Sustainable Mobility in the Mena Region. Transp. Policy 2019, 79, 37–53. [Google Scholar] [CrossRef]
  17. Masoumi, H.; Fruth, E. Transferring Urban Mobility Studies in Tehran, Istanbul, and Cairo to Other Large Mena Cities: Steps toward Sustainable Transport. Urban Dev. Issues 2020, 65, 27–44. [Google Scholar] [CrossRef]
  18. Macrotrends. Kerman, Iran Metro Area Population 1950–2022. Available online: https://www.macrotrends.net/cities/21501/kerman/population (accessed on 8 July 2022).
  19. Giuliano, G.; Dargay, J. Car Ownership, Travel and Land Use: A Comparison of the US and Great Britain. Transp. Res. Part A Policy Pract. 2006, 40, 106–124. [Google Scholar] [CrossRef]
  20. Van Acker, V.; Witlox, F. Commuting Trips within Tours: How Is Commuting Related to Land Use? Transportation 2011, 38, 465–486. [Google Scholar] [CrossRef]
  21. Ding, C.; Mishra, S.; Lu, G.; Jang, J.; Liu, C. Influences of Built Environment Characteristics and Individual Factors on Commuting Distance: A Multilevel Mixture Hazard Modeling Approach. Transp. Res. Part D Transp. Environ. 2017, 51, 314–325. [Google Scholar] [CrossRef]
  22. Chen, C.; Gong, H.; Paaswell, R. Role of the Built Environment on Mode Choice Decisions: Additional Evidence on the Impact of Density. Transportation 2008, 35, 285–299. [Google Scholar] [CrossRef]
  23. Albalate, D.; Gragera, A. The Impact of Curbside Parking Regulations on Car Ownership. Reg. Sci. Urban Econ. 2020, 81, 103518. [Google Scholar] [CrossRef] [Green Version]
  24. Ewing, R.; Dumbaugh, E. The Built Environment and Traffic Safety a Review of Empirical Evidence. J. Plan. Lit. 2009, 23, 347–367. [Google Scholar] [CrossRef]
  25. Jensen, M. Passion and Heart in Transport—A Sociological Analysis on Transport Behaviour. Transp. Policy 1999, 6, 19–33. [Google Scholar] [CrossRef]
  26. Gössling, S. The Psychology of the Car: Automobile Admiration, Attachment, and Addiction; Elsevier: Amsterdam, The Netherlands, 2017; ISBN 9780128110096. [Google Scholar]
  27. Sheller, M. Automotive Emotions: Feeling the Car. Theory Cult. Soc. 2004, 21, 221–242. [Google Scholar] [CrossRef]
  28. Billari, F.C.; Liefbroer, A.C. Towards a New Pattern of Transition to Adulthood? Adv. Life Course Res. 2010, 15, 59–75. [Google Scholar] [CrossRef]
  29. Cisco. The Future of Work: Information Access Expectations, Demands, and Behavior of the World’s Next-Generation Workforce; Cisco: San Jose, CA, USA, 2011. [Google Scholar]
  30. Masoumi, H. Home-Based Urban Commute and Non-Commute Trip Generation in Less-Studied Contexts: Evidence from Cairo, Istanbul, and Tehran. Case Stud. Transp. Policy 2021, 10, 130–144. [Google Scholar] [CrossRef]
  31. Masoumi, H. Urban Commute Travel Distances in Tehran, Istanbul, and Cairo: Weighted Least Square Models. Urban Sci. 2020, 4, 39. [Google Scholar] [CrossRef]
  32. Roque, D.; Masoumi, H.E. An Analysis of Car Ownership in Latin American Cities: A Perspective for Future Research. Period. Polytech. Transp. Eng. 2016, 44, 5–12. [Google Scholar] [CrossRef] [Green Version]
  33. He, S.Y.; Thøgersen, J. The Impact of Attitudes and Perceptions on Travel Mode Choice and Car Ownership in a Chinese Megacity: The Case of Guangzhou. Res. Transp. Econ. 2017, 62, 57–67. [Google Scholar] [CrossRef]
  34. Haque, M.B.; Choudhury, C.; Hess, S.; Sourd, R.C.D. Modelling Residential Mobility Decision and Its Impact on Car Ownership and Travel Mode. Travel Behav. Soc. 2019, 17, 104–119. [Google Scholar] [CrossRef]
  35. Soltanzadeh, H.; Masoumi, H.E. The Determinants of Transportation Mode Choice in the Middle Eastern Cities: The Kerman Case, Iran. TeMA J. Land Use Mobil. Environ. 2014, 7, 199–222. [Google Scholar]
  36. Walters, J. Overview of Public Transport Policy Developments in South Africa. Res. Transp. Econ. 2013, 39, 34–45. [Google Scholar] [CrossRef] [Green Version]
  37. De Jong, G.; Kouwenhoven, M.; Geurs, K.; Bucci, P.; Tuinenga, J.G. The Impact of Fixed and Variable Costs on Household Car Ownership. J. Choice Model. 2009, 2, 173–199. [Google Scholar] [CrossRef] [Green Version]
  38. Loo, L.Y.L.; Corcoran, J.; Mateo-Babiano, D.; Zahnow, R. Transport Mode Choice in South East Asia: Investigating the Relationship between Transport Users’ Perception and Travel Behaviour in Johor Bahru, Malaysia. J. Transp. Geogr. 2015, 4, 99–111. [Google Scholar] [CrossRef]
  39. Redman, L.; Friman, M.; Gärling, T.; Hartig, T. Quality Attributes of Public Transport That Attract Car Users: A Research Review. Transp. Policy 2013, 25, 119–127. [Google Scholar] [CrossRef]
  40. Kuhnimhof, T.; Armoogum, J.; Buehler, R.; Dargay, J.; Denstadli, J.M.; Yamamoto, T. Men Shape a Downward Trend in Car Use among Young Adults—Evidence from Six Industrialized Countries. Transp. Rev. 2012, 32, 761–779. [Google Scholar] [CrossRef]
  41. Davis, B.; Dutzik, T.; Baxandall, P. Transportation and the New Generation: Why Young People Are Driving Less and What It Means for Transportation Policy; Transportation Research Board: Washington, DC, USA, 2012. [Google Scholar]
  42. Van Der Waard, J.; Jorritsma, P.; Immers, B. New Drivers in Mobility; What Moves the Dutch in 2012? Transp. Rev. 2012, 33, 343–359. [Google Scholar] [CrossRef]
  43. Schwanen, T.; Dieleman, F.M.; Dijst, M. The Impact of Metropolitan Structure on Commute Behavior in The Netherlands: A Multilevel Approach. Growth Change 2004, 35, 304–333. [Google Scholar] [CrossRef]
  44. Waddell, P.; Bhat, C.; Eluru, N.; Wang, L.; Pendyala, R.M. Modeling Interdependence in Household Residence and Workplace Choices. Transp. Res. Rec. 2007, 2003, 84–92. [Google Scholar] [CrossRef] [Green Version]
  45. Delbosc, A.; Currie, G. Causes of Youth Licensing Decline: A Synthesis of Evidence. Transp. Rev. 2013, 33, 271–290. [Google Scholar] [CrossRef]
  46. Sivak, M.; Schoettle, B. Recent Changes in the Age Composition of Drivers in 15 Countries. Traffic Inj. Prev. 2021, 13, 126–132. [Google Scholar] [CrossRef]
  47. Choo, S.; Mokhtarian, P.L. Telecommunications and Travel Demand and Supply: Aggregate Structural Equation Models for the US. Transp. Res. Part A Policy Pract. 2007, 41, 4–18. [Google Scholar] [CrossRef] [Green Version]
  48. Limbumba, T.M. Exploring Social-Cultural Explanations for Residential Location Choices: The Case of an African City-Dar Es Salaam. Ph.D. Thesis, KTH, Stockholm, Sweden, 2010. [Google Scholar]
  49. Kumarage, A. Impacts of Transportation Infrastructure and Services on Urban Poverty and Land Development in Colombo, Sri Lanka. Glob. Urban Dev. Mag. 2007, 3, 1–15. [Google Scholar]
  50. Bhat, C.R.; Pulugurta, V. A Comparison of Two Alternative Behavioral Choice Mechanisms for Household Auto Ownership Decisions. Transp. Res. Part B Methodol. 1998, 32, 61–75. [Google Scholar] [CrossRef]
  51. Potoglou, D.; Kanaroglou, P.S. Modelling Car Ownership in Urban Areas: A Case Study of Hamilton, Canada. J. Transp. Geogr. 2008, 16, 42–54. [Google Scholar] [CrossRef]
  52. Li, J.; Walker, J.L.; Srinivasan, S.; Anderson, W.P. Modeling Private Car Ownership in China: Investigation of Urban Form Impact Across Megacities. Transp. Res. Rec. 2010, 2193, 76–84. [Google Scholar] [CrossRef]
  53. Lerman, S.R. Location, Housing, Automobile Ownership, and Mode to Work: A Joint Choice Model. Transp. Res. Rec. 1976, 610, 6–11. [Google Scholar]
  54. Ryan, J.M.; Han, G. Vehicle-Ownership Model Using Family Structure and Accessibility Application to Honolulu, Hawaii. Transp. Res. Rec. 1999, 1676, 1–10. [Google Scholar] [CrossRef]
  55. Train, K. A Structured Logit Model of Auto Ownership and Mode Choice. Rev. Econ. Stud. 1980, 47, 357–370. [Google Scholar] [CrossRef]
  56. Yao, M.; Wang, D.; Yang, H. A Game-Theoretic Model of Car Ownership and Household Time Allocation. Transp. Res. Part B Methodol. 2017, 104, 667–685. [Google Scholar] [CrossRef]
  57. Hess, S.; Daly, A. (Eds.) Choice Modelling: The State of the Art and the State of Practice; Edward Elgar: Cheltenham, UK; Northampton, MA, USA, 2013; ISBN 9781781007273. [Google Scholar]
  58. Cirillo, C.; Xu, R.; Bastin, F. A Dynamic Formulation for Car Ownership Modeling. Transp. Sci. 2011, 50, 322–335. [Google Scholar] [CrossRef] [Green Version]
  59. Johnstone, N.; Serret, Y.; Bureau, C. The Determinants of Car Ownership and Use. In Proceedings of the OECD Conference on Household Behaviour and Environmental Policy, OECD, Paris, France, 3–4 June 2009; pp. 1–24. [Google Scholar]
  60. Thakuriah, P.; Menchu, S.; Tang, L. Car Ownership among Young Adults. Transportation Research Record. J. Transp. Res. Board 2010, 2156, 1–8. [Google Scholar] [CrossRef]
  61. Clark, B.; Chatterjee, K.; Melia, S. Changes in Level of Household Car Ownership: The Role of Life Events and Spatial Context. Transportation 2016, 43, 565–599. [Google Scholar] [CrossRef] [Green Version]
  62. Buehler, R. Determinants of Transport Mode Choice: A Comparison of Germany and the USA. J. Transp. Geogr. 2011, 19, 644–657. [Google Scholar] [CrossRef]
  63. Kowald, M.; Kieser, B.; Mathys, N.; Justen, A. Determinants of Mobility Resource Ownership in Switzerland: Changes between 2000 and 2010. Transportation 2000, 44, 1043–1065. [Google Scholar] [CrossRef]
  64. Eakins, J. The Determinants of Household Car Ownership: Empirical Evidence from the Irish Household Budget Survey; Surrey Energy Economics Centre (SEEC) School of Economics University of Surrey: Guildford, UK, 2013. [Google Scholar]
  65. Van Eggermond, M.A.; Erath, A.; Axhausen, K.W. Vehicle Ownership and Usage in Switzerland: Role of Micro- and Macro-Accessibility. In Proceedings of the TRB 95th Annual Meeting Compendium of Papers, Washington, DC, USA, 10–14 January 2016; p. 16-4761. [Google Scholar]
  66. Dargay, J.; Hivert, L.; Legros, D. The Dynamics of Car Availability in EU Countries—A Comparison Based on the European Household Panel Survey. IATSS Res. 2008, 32, 44–55. [Google Scholar] [CrossRef] [Green Version]
  67. Shafiei, S.; Nagendra, H.N. Integrated Transport System for Kerman City in Iran—Key Success Factors. Sch. J. Arts Humanit. Soc. Sci. 2017, 5, 1029–1032. [Google Scholar]
Figure 1. Visualization of the descriptive relationship between the number days of traveling for different purposes and household car ownership for male and female respondents.
Urbansci 06 00048 g001
Figure 2. Distribution of public transport ridership levels among different ages and genders.
Urbansci 06 00048 g002
Table 1. The frequencies and categories of the independent variables in the sample.
VariableCategory Types for AnalysisFrequency
Age≤20103
21–35496
36–50145
51–6541
>656
Household size14
265
3148
4282
5190
671
723
85
92
No. of working days per week052
252
3170
5239
7278
No. of shopping days inside the neighbourhood0330
2241
3138
521
761
No. of entertainment days in the neighbourhood0640
284
335
514
718
No. of shopping days in city centre0412
2288
372
515
74
Table 2. Tests of Heteroscedasticity for OLS and WLS models of car ownership in Kerman.
OLS ModelWLS Model
Test for HeteroscedasticityFdf1df2PFdf1df2P
F-test48.31789<0.001−108.7417891.00
Test for HeteroscedasticityChi-SquaredfPChi-SquaredfP
Breusch-Pagan107.161<0.001−234.0511.00
Modified Breusch-Pagan45.621<0.001−126.4511.00
White Test655.66100.098184.16101.00
Table 3. Tests of between-subjects for OLS (R2 = 0.31) and WLS (R2 = 0.425) models of car ownership in Kerman (N = 791).
SourceType III Sum of SquaresDf 1Mean SquareF 2p3Type III Sum of SquaresDf 1Mean SquareF 2p3
Corrected Model203.5792.584.05<0.001753.7799.546.66<0.001
Intercept144.11144.1226.7<0.001286.51286.5199.9<0.001
Age40.6530.771.20.15986.7531.641.140.233
Household size112.5912.519.65<0.001488.8954.3137.89<0.001
No. of working days per week8.9242.233.510.00824.0546.014.20.002
No. of shopping days inside the neighbourhood3.1440.791.230.2952.6840.670.470.759
No. of entertainment days in the neighbourhood8.2242.063.230.01213.9843.52.430.046
No. of shopping days in city centre12.6843.174.990.00114.3843.582.510.041
Gender-1-0.0010.9820.1110.110.080.782
Error452.17110.63 1019.17111.43
Total2766791 6909.8791
Corrected Total655.7790 1772.9790
1 Degrees of freedom; 2 F-statistic; 3 p-value (significance levels: p < 0.05: significant; 0.05 < p < 0.1: marginally significant).
Table 4. Parameter estimates for the OLS and WLS models of car ownership in Kerman.
ParameterOLS ModelWLS Model
B 1St. Err. 2t 3p4B 1St. Err. 2t 3p4
[Gender = Female]0.0010.0650.0230.982−0.0170.060−0.2760.782
[Gender = Male]ReferenceReference
[Age = 15]−0.9611.007−0.9540.340−0.9510.762−1.2490.212
[Age = 16]−0.2530.952−0.2660.790−0.2610.709−0.3680.713
[Age = 17]−1.4210.956−1.4870.137−1.3750.735−1.8720.062
[Age = 18]−0.0060.856−0.0070.995−0.0920.555−0.1660.868
[Age = 19]−0.5620.849−0.6620.508−0.4780.546−0.8740.382
[Age = 20]−0.9330.835−1.1170.264−0.8810.523−1.6840.093
[Age = 21]−0.9690.836−1.1590.247−0.9660.525−1.8410.066
[Age = 22]−0.7920.833−0.9510.342−0.7810.519−1.5040.133
[Age = 23]−0.8160.838−0.9740.330−0.8430.529−1.5930.112
[Age = 24]−0.5930.839−0.7060.481−0.7120.528−1.3480.178
[Age = 25]−0.7900.840−0.9400.348−0.8490.529−1.6060.109
[Age = 26]−0.9150.847−1.0800.280−0.8200.531−1.5450.123
[Age = 27]−0.9270.842−1.1000.272−0.920.533−1.7260.085
[Age = 28]−0.7200.834−0.8630.388−0.7700.518−1.4860.138
[Age = 29]−0.9810.843−1.1640.245−0.9640.527−1.8290.068
[Age = 30]−1.0010.835−1.1990.231−0.9710.520−1.8680.062
[Age = 31]−0.8270.839−0.9850.325−0.8010.523−1.5310.126
[Age = 32]−0.4980.837−0.5950.552−0.5520.523−1.0550.292
[Age = 33]−0.4810.848−0.5680.571−0.5110.537−0.9520.342
[Age = 34]−0.6210.849−0.7320.465−0.6680.531−1.2590.209
[Age = 35]−0.9360.838−1.1160.265−0.8240.523−1.5750.116
[Age = 36]−1.2270.859−1.4280.154−1.1770.553−2.1270.034
[Age = 37]−1.0130.851−1.1900.235−0.9010.541−1.6660.096
[Age = 38]−0.6230.856−0.7280.467−0.6730.541−1.2430.214
[Age = 39]−0.9340.918−1.0170.309−0.9080.621−1.4630.144
[Age = 40]−0.9430.843−1.1180.264−0.7990.532−1.5010.134
[Age = 41]−1.0631.006−1.0560.291−1.1100.709−1.5650.118
[Age = 42]−0.9430.845−1.1150.265−0.9010.535−1.6840.093
[Age = 43]−1.2250.888−1.3790.168−0.9990.569−1.7580.079
[Age = 44]−1.2160.95−1.2800.201−1.1480.673−1.7060.088
[Age = 45]−1.1560.845−1.3680.172−1.0830.531−2.0410.042
[Age = 46]−0.9080.877−1.0350.301−0.8590.552−1.5570.12
[Age = 47]−0.8170.856−0.9540.340−0.7730.552−1.4010.162
[Age = 48]−0.8910.916−0.9730.331−0.8870.59−1.5030.133
[Age = 49]−0.4451.011−0.440.66−0.5060.788−0.6430.521
[Age = 50]−0.6640.857−0.7750.439−0.8370.538−1.5550.12
[Age = 51]0.4311.1530.3730.7090.4150.9540.4350.664
[Age = 52]−1.0730.874−1.2280.220−0.9230.562−1.6430.101
[Age = 53]−0.3250.919−0.3530.724−0.2310.588−0.3940.694
[Age = 54]−0.2070.937−0.2210.825−0.2360.603−0.3910.696
[Age = 55]−0.6380.895−0.7130.476−0.6850.555−1.2350.217
[Age = 56]−0.5500.882−0.6240.533−0.6060.544−1.1150.265
[Age = 57]−1.6661.154−1.4440.149−1.6110.895−1.8000.072
[Age = 58]−0.6110.935−0.6530.514−0.8970.589−1.5230.128
[Age = 60]−0.4260.915−0.4650.642−0.4440.585−0.7580.448
[Age = 61]−0.8180.964−0.8490.396−0.8590.711−1.2070.228
[Age = 62]−0.9401.136−0.8270.408−0.9230.659−1.4010.162
[Age = 63]−1.0591.155−0.9170.359−1.0530.734−1.4350.152
[Age = 64]−0.3251.152−0.2820.778−0.3510.747−0.4700.639
[Age = 66]−0.6721.154−0.5820.560−0.7570.725−1.0440.297
[Age = 68]−1.2721.146−1.1100.267−1.2200.698−1.7480.081
[Age = 70]−0.7431.011−0.7350.463−0.9780.654−1.4940.136
[Age = 72]−1.3351.145−1.1660.244−1.3090.756−1.7310.084
[Age = 73]ReferenceReference
[Household_Size = 0]5.2951.0175.205<0.0015.2551.0734.9<0.001
[Household_Size = 1]−3.1340.728−4.306<0.001−3.0961.006−3.0790.002
[Household_Size = 2]−2.4200.605−3.998<0.001−2.4410.961−2.540.011
[Household_Size = 3]−2.1980.598−3.675<0.001−2.2660.959−2.3640.018
[Household_Size = 4]−1.8130.595−3.0480.002−1.8830.957−1.9670.050
[Household_Size = 5]−1.7480.595−2.9390.003−1.8110.958−1.8910.059
[Household_Size = 6]−1.3960.599−2.3320.02−1.4820.962−1.5410.124
[Household_Size = 7]−1.2940.617−2.0970.036−1.4030.981−1.4300.153
[Household_Size = 8]−2.5120.698−3.598<0.001−2.5111.092−2.2990.022
[Household_Size = 9]ReferenceReference
[Working_Days = 0]−0.3960.143−2.7780.006−0.3740.108−3.4770.001
[Working_Days = 2]−0.3710.132−2.8040.005−0.3270.108−3.0230.003
[Working_Days = 3]−0.1790.085−2.1220.034−0.1620.078−2.0720.039
[Working_Days = 5]−0.1520.079−1.9280.054−0.1040.076−1.3550.176
[Working_Days = 7]ReferenceReference
[Shopping_in_Neighbourhood = 0]−0.1120.120−0.9350.35−0.0910.119−0.7690.442
[Shopping_in_Neighbourhood = 2]0.0280.1230.2310.817−0.0200.121−0.1660.868
[Shopping_in_Neighbourhood = 3]−0.1300.130−1.0030.316−0.1050.128−0.8190.413
[Shopping_in_Neighbourhood = 5]−0.0750.214−0.3520.725−0.0700.208−0.3350.738
[Shopping_in_Neighbourhood = 7]ReferenceReference
[Leisure_in_Neighbourhood = 0]0.0990.2030.4890.6250.0060.2520.0230.982
[Leisure_in_Neighbourhood = 2]−0.1170.219−0.5350.593−0.1120.266−0.4210.674
[Leisure_in_Neighbourhood = 3]0.2360.2480.9540.3400.1790.2960.6040.546
[Leisure_in_Neighbourhood = 5]0.7010.3112.2570.0240.6840.3422.0030.046
[Leisure_in_Neighbourhood = 7]ReferenceReference
[Shopping_in_CBD = 0]−1.1590.417−2.7770.006−0.9390.501−1.8740.061
[Shopping_in_CBD = 2]−0.9970.420−2.3720.018−0.8410.503−1.6710.095
[Shopping_in_CBD = 3]−0.8640.427−2.0250.043−0.7250.508−1.4260.154
[Shopping_in_CBD = 5]−1.4150.468−3.0230.003−1.1240.553−2.0320.043
[Shopping_in_CBD = 7]ReferenceReference
1 Coefficient; 2 Standard Error; 3 t-value; 4 p-value (significance levels: p < 0.05: significant; 0.05 < p < 0.1: marginally significant).
Table 5. Binomial logistic regression model of public transportation ridership in Kerman (N = 791).
FactorBSt. Err.WalddfpExp (B)
Constant2.3020.47723.2561<0.0019.991
Gender−0.2780.1612.96210.0850.757
Age−0.0760.00973.6521<0.0010.927
Household size0.0880.0641.89510.1691.092
No. of working days per week−0.0750.0393.72810.0540.928
No. of shopping days inside the neighbourhood0.0370.0400.88510.3471.038
No. of entertainment days in the neighbourhood0.0330.0570.3410.5601.034
No. of shopping days in city centre0.1700.0607.96610.0051.185
Publisher’s Note: MDPI stays neutral with regard to jurisdictional claims in published maps and institutional affiliations.

