
Designing Urban Green Infrastructures Using Open-Source Data—An Example in Çiğli, Izmir (Turkey)


Abstract
:1. Introduction
2. Materials and Methods
2.1. Study Area and Context
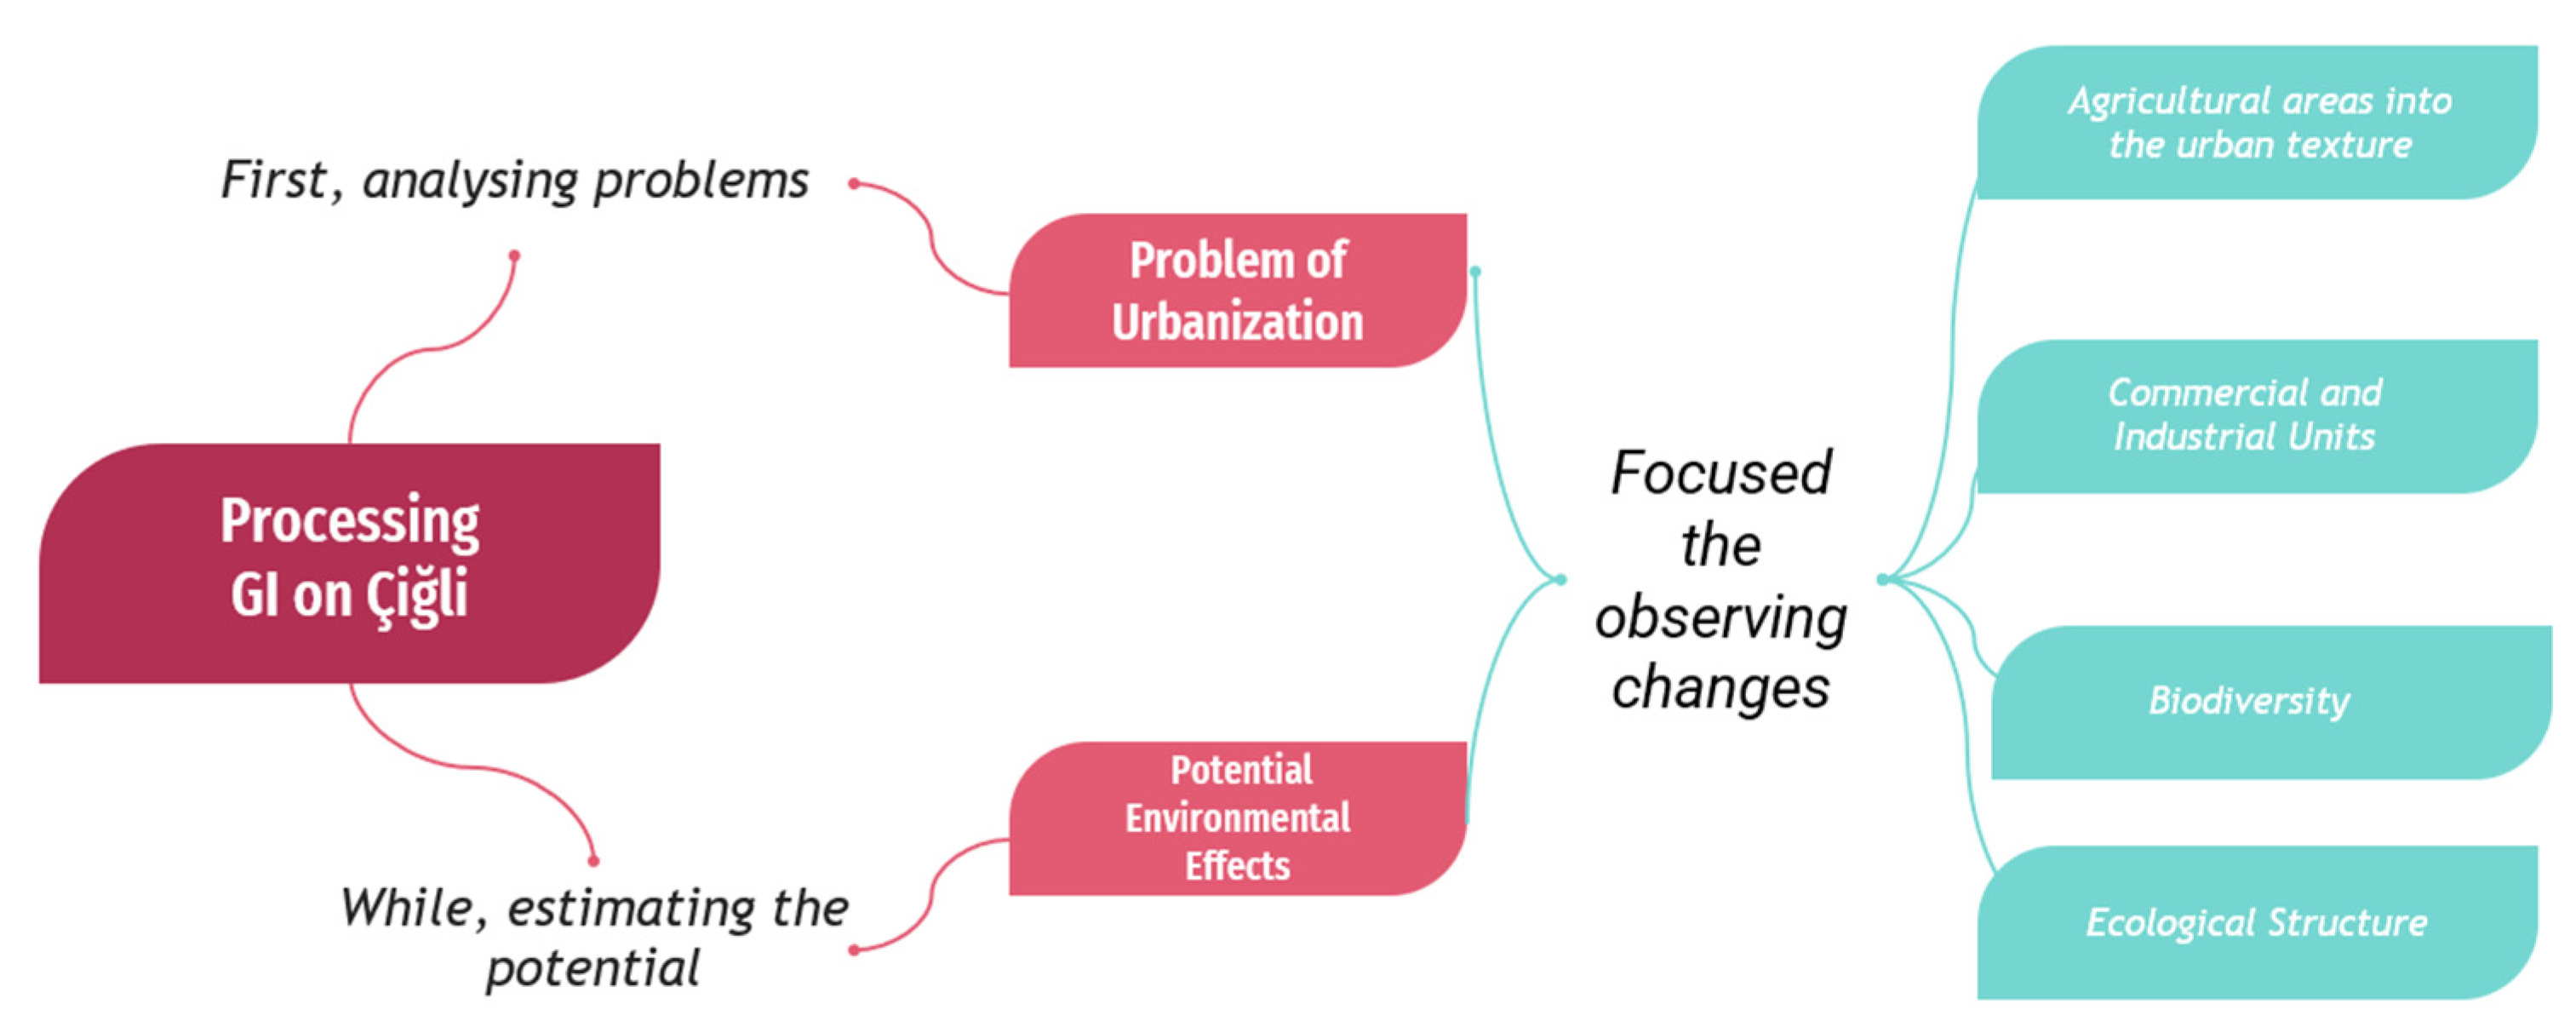
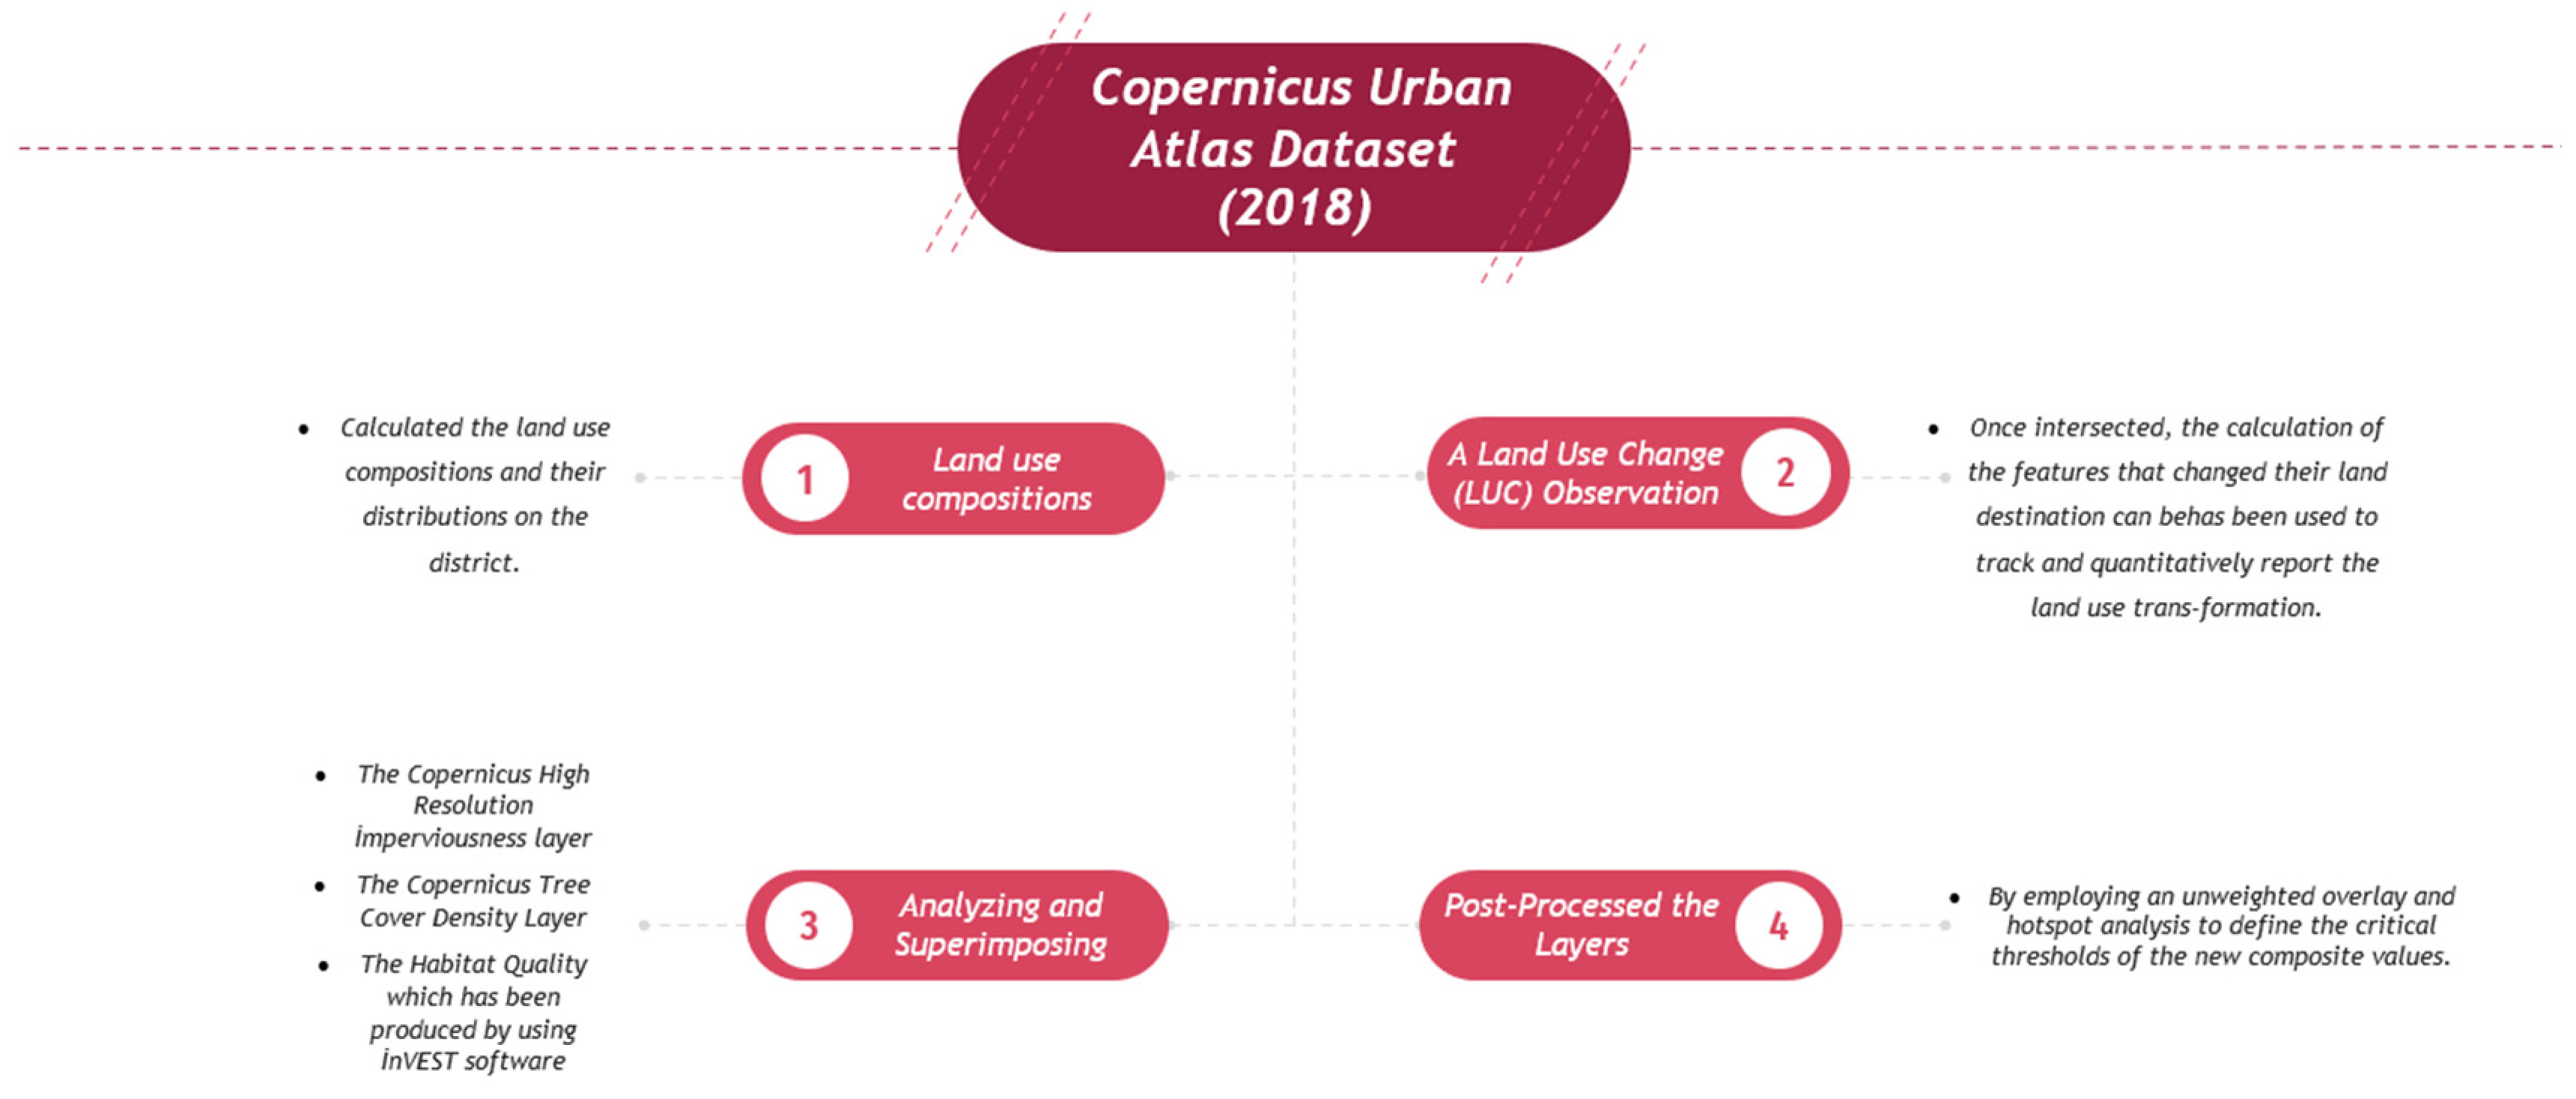
2.2. Land Use Change Analysis
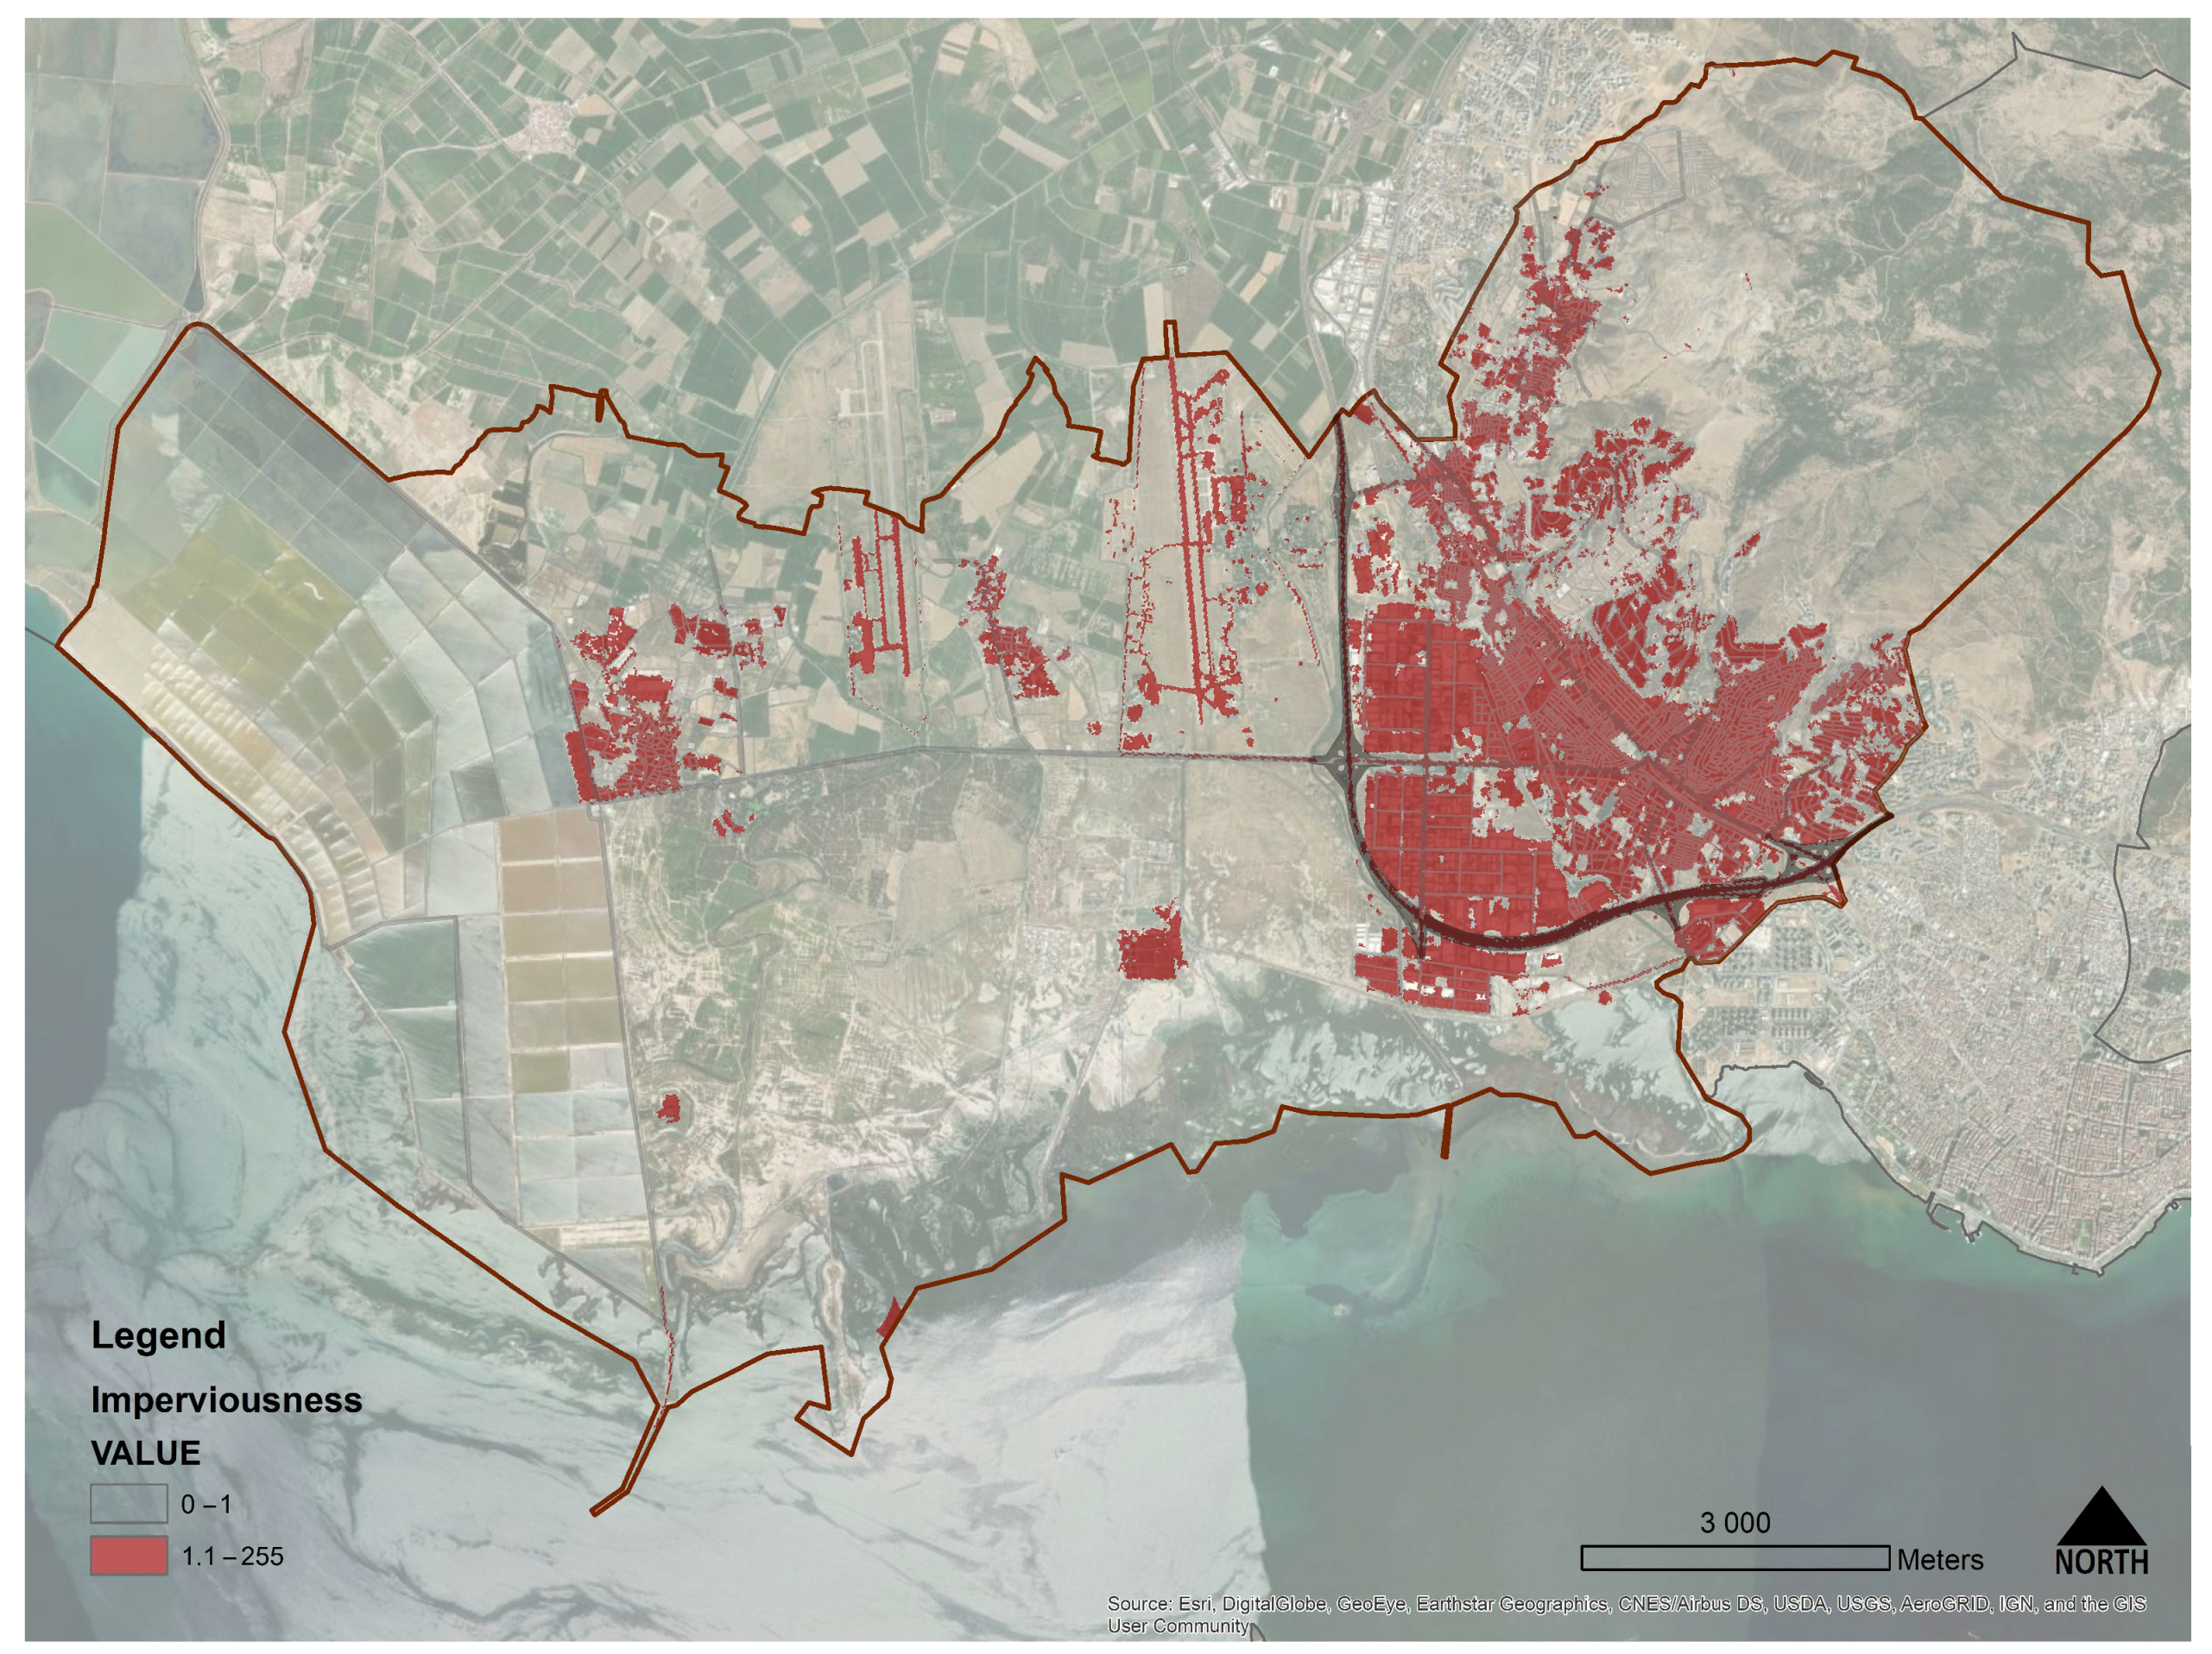
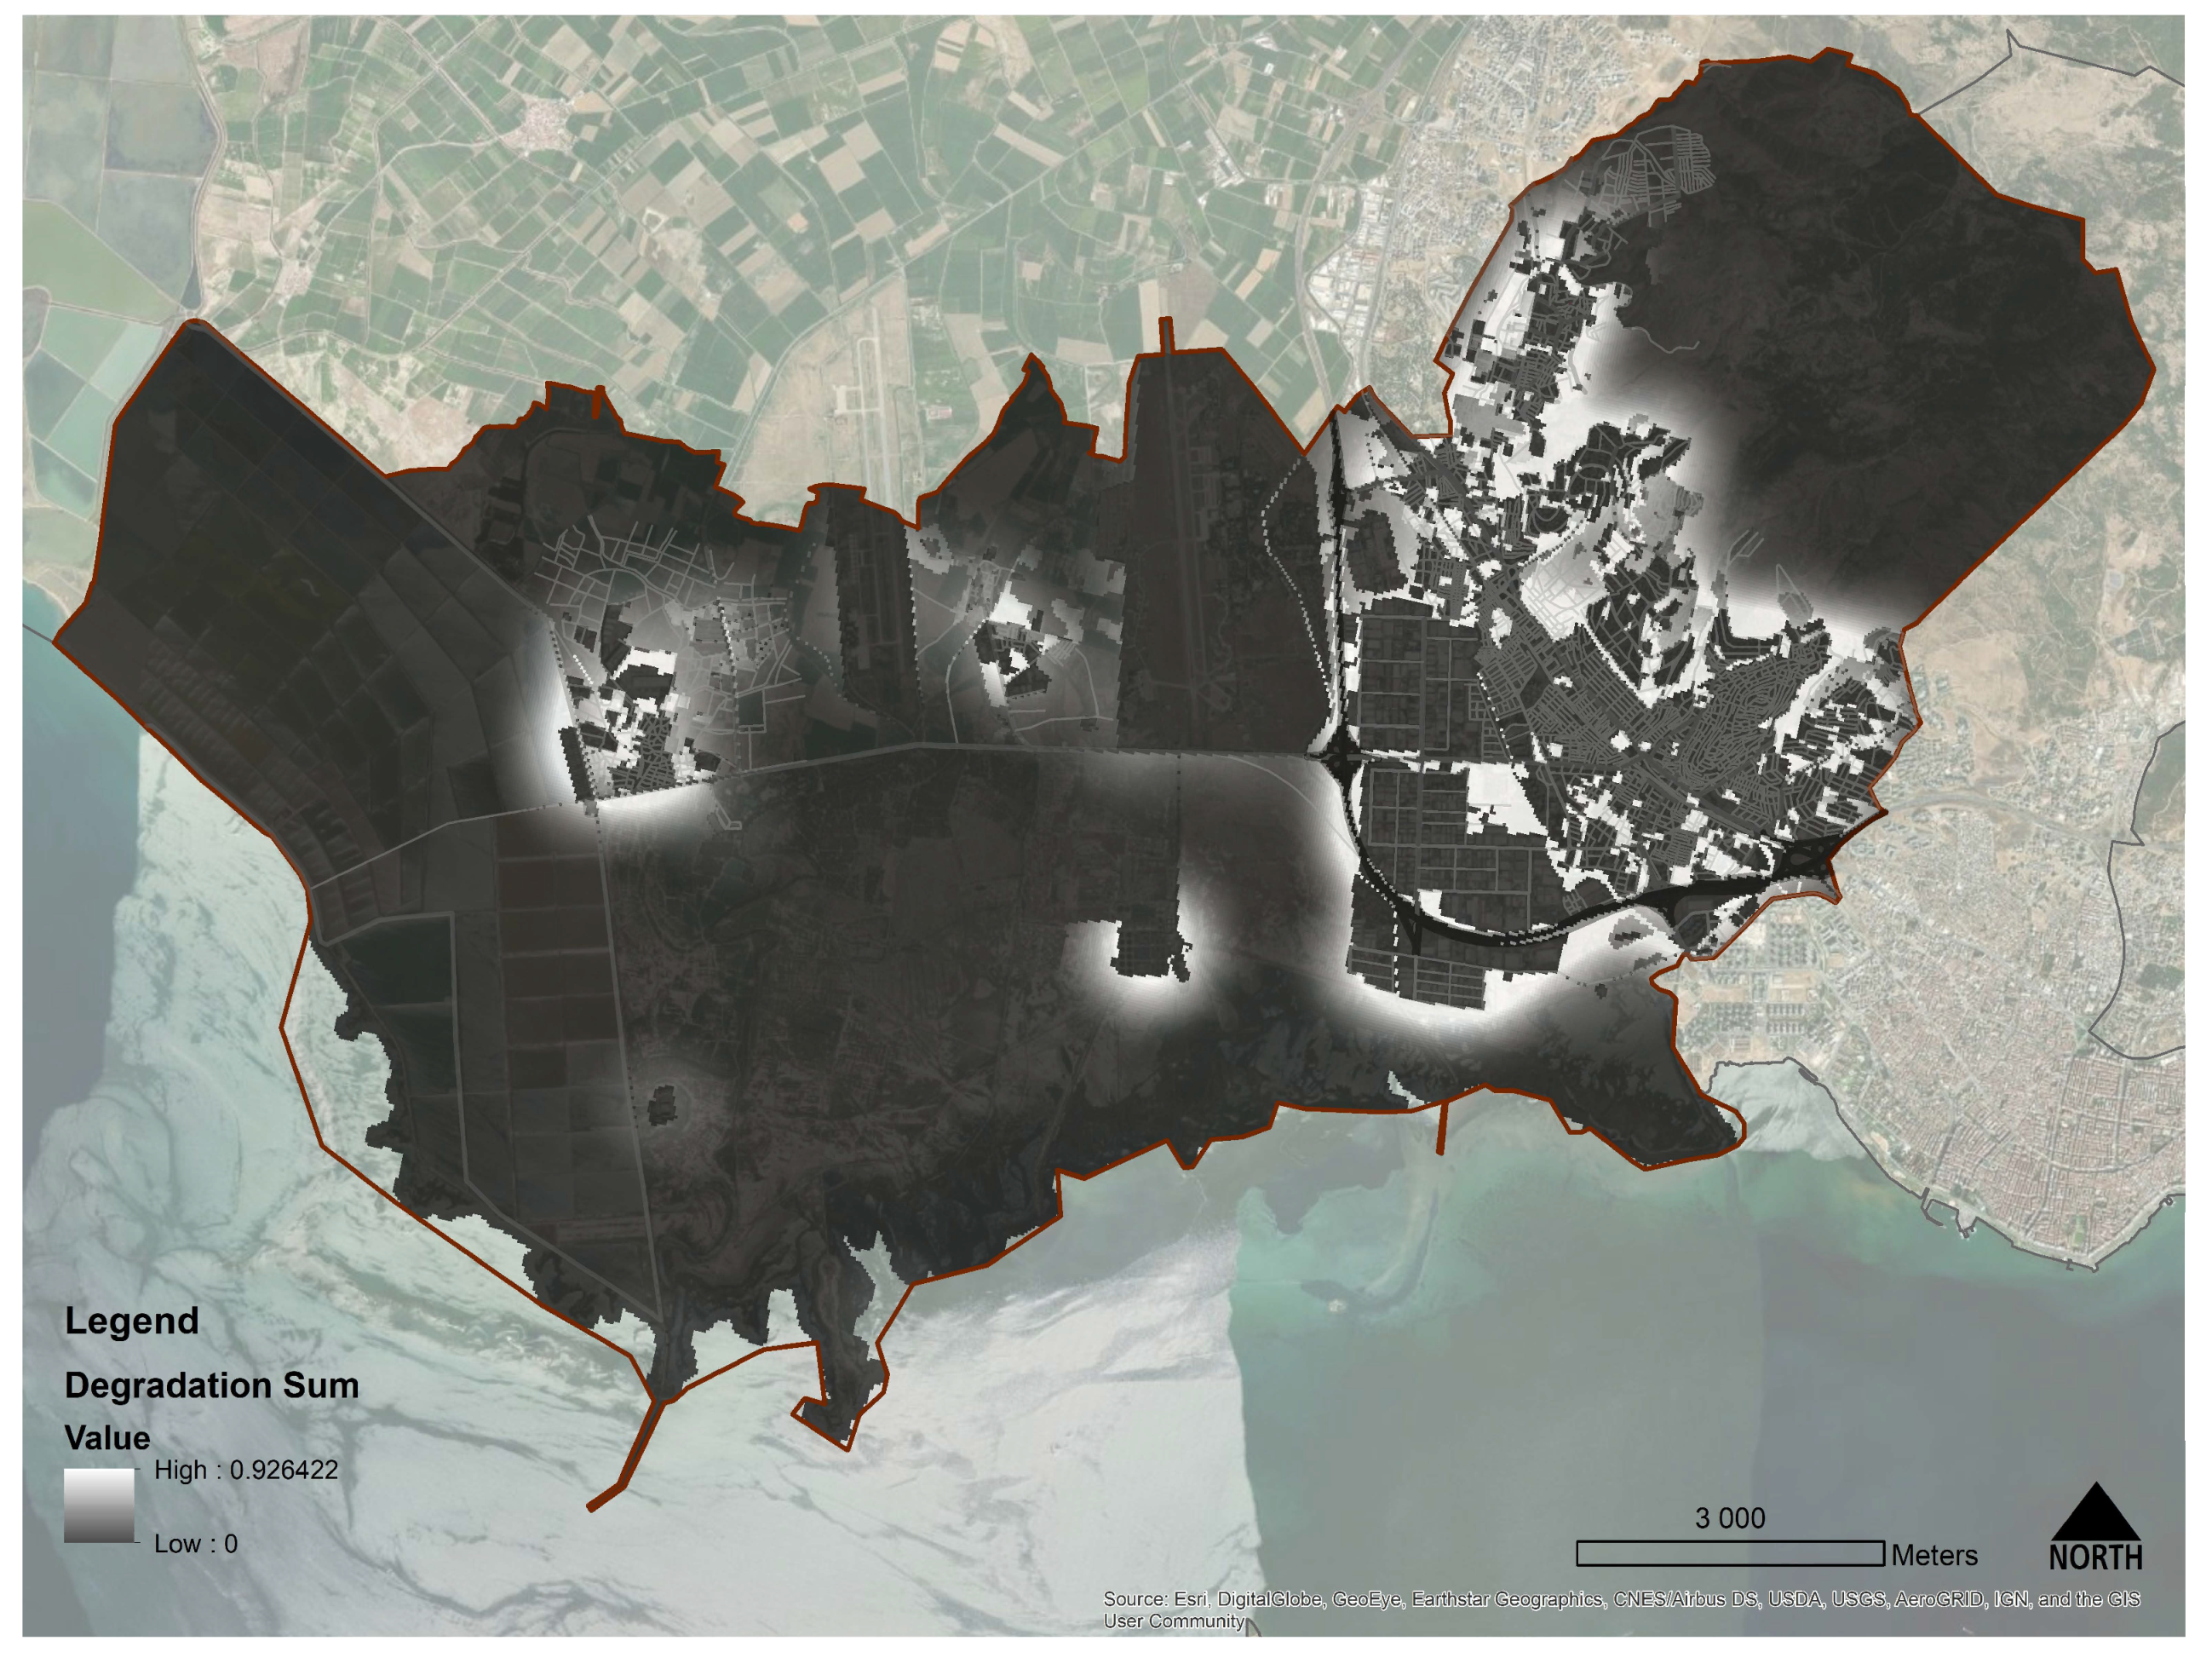
2.3. Analysis of Imperviousness
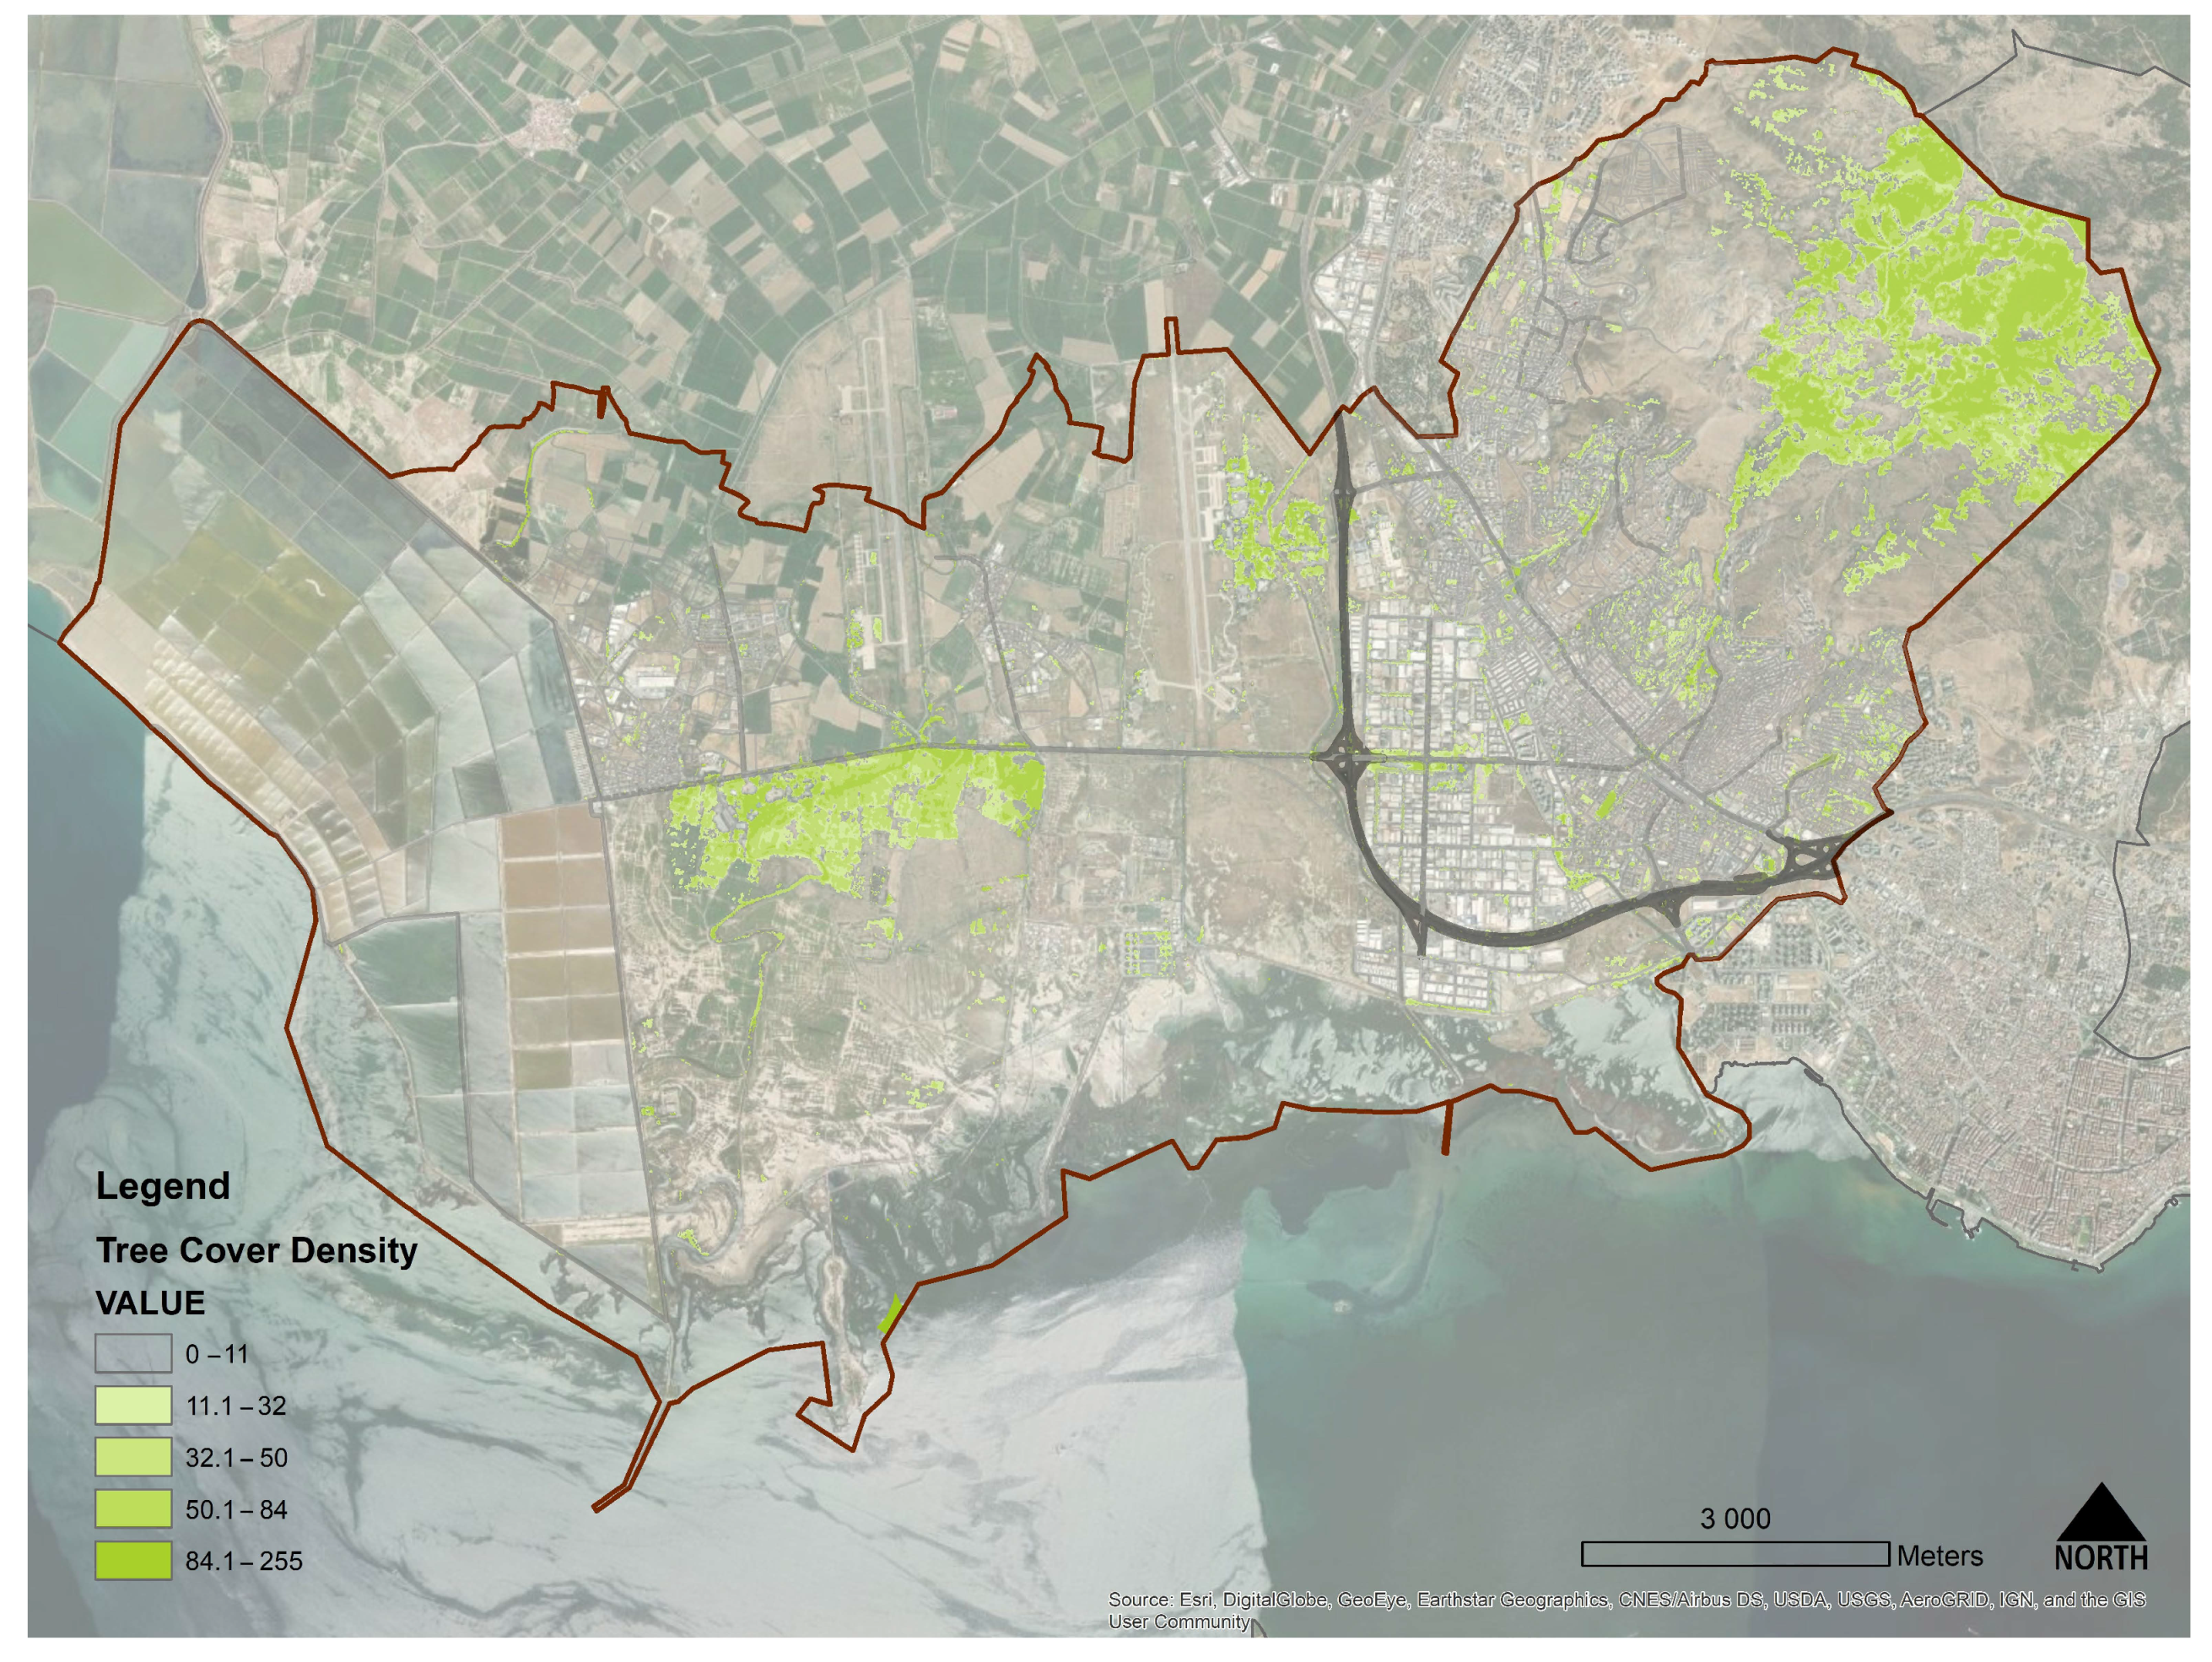
2.4. Analysis of Tree Cover Density
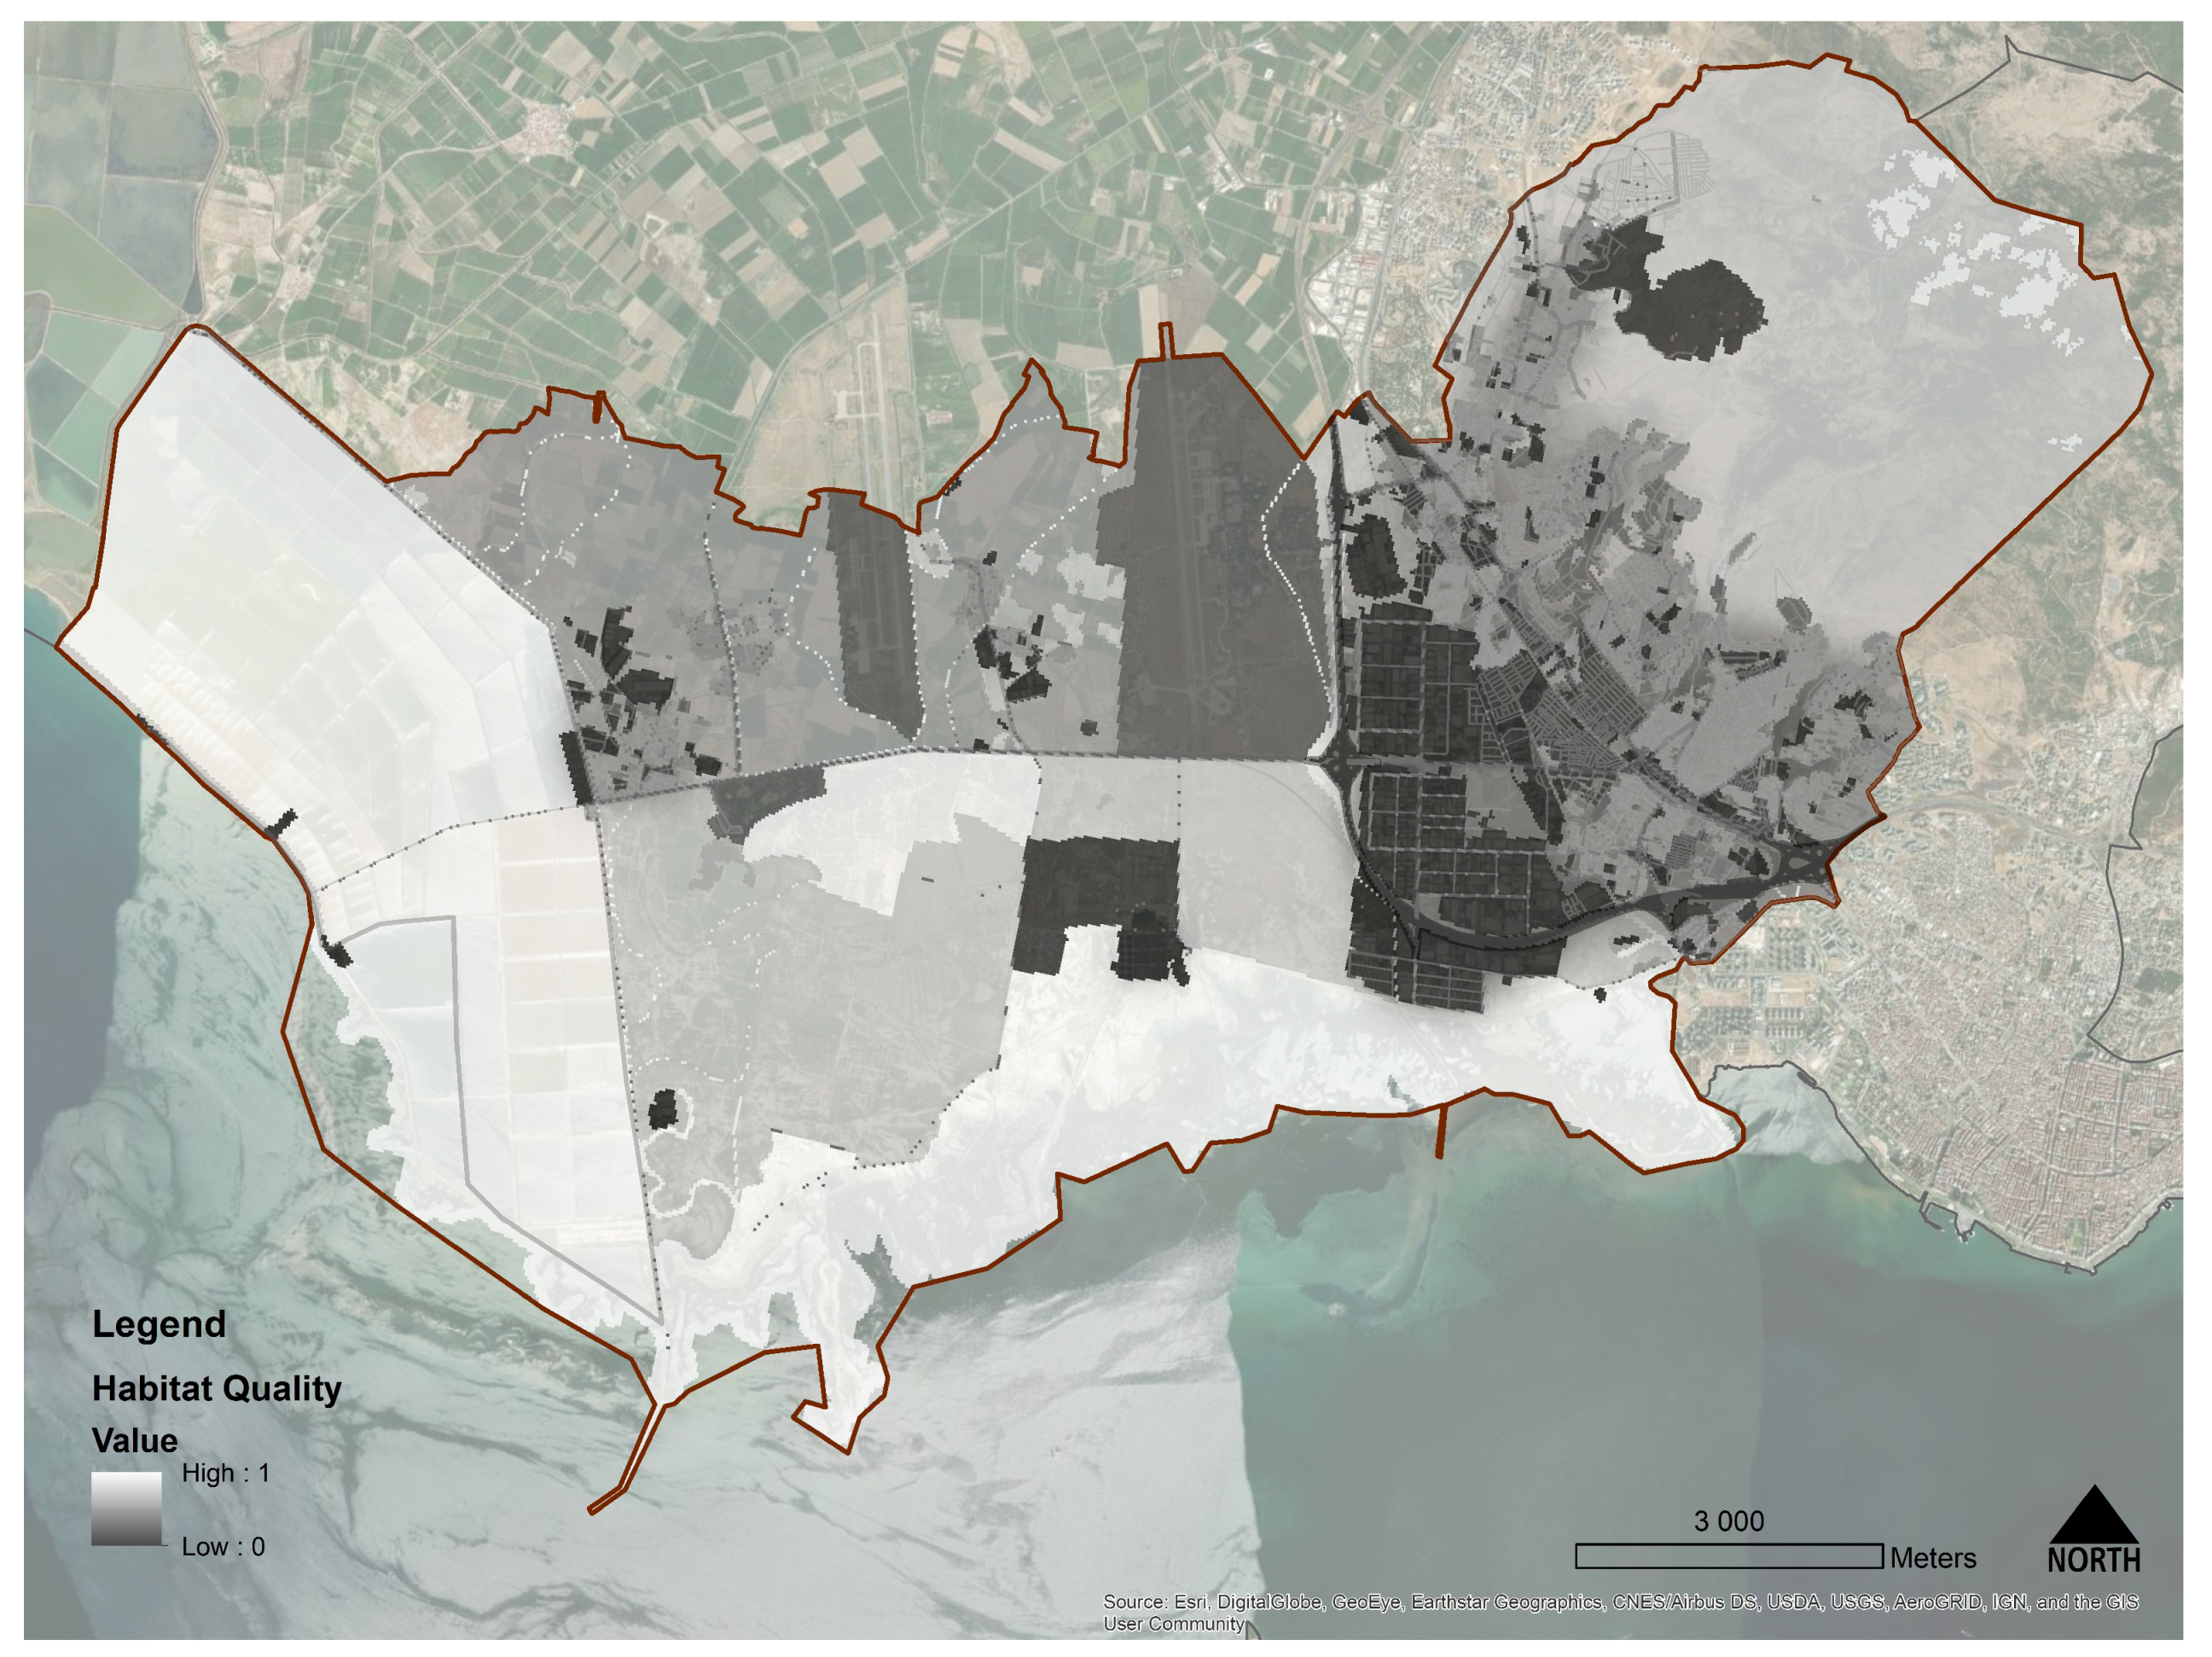
2.5. Modelling the Habitat Quality
3. Results
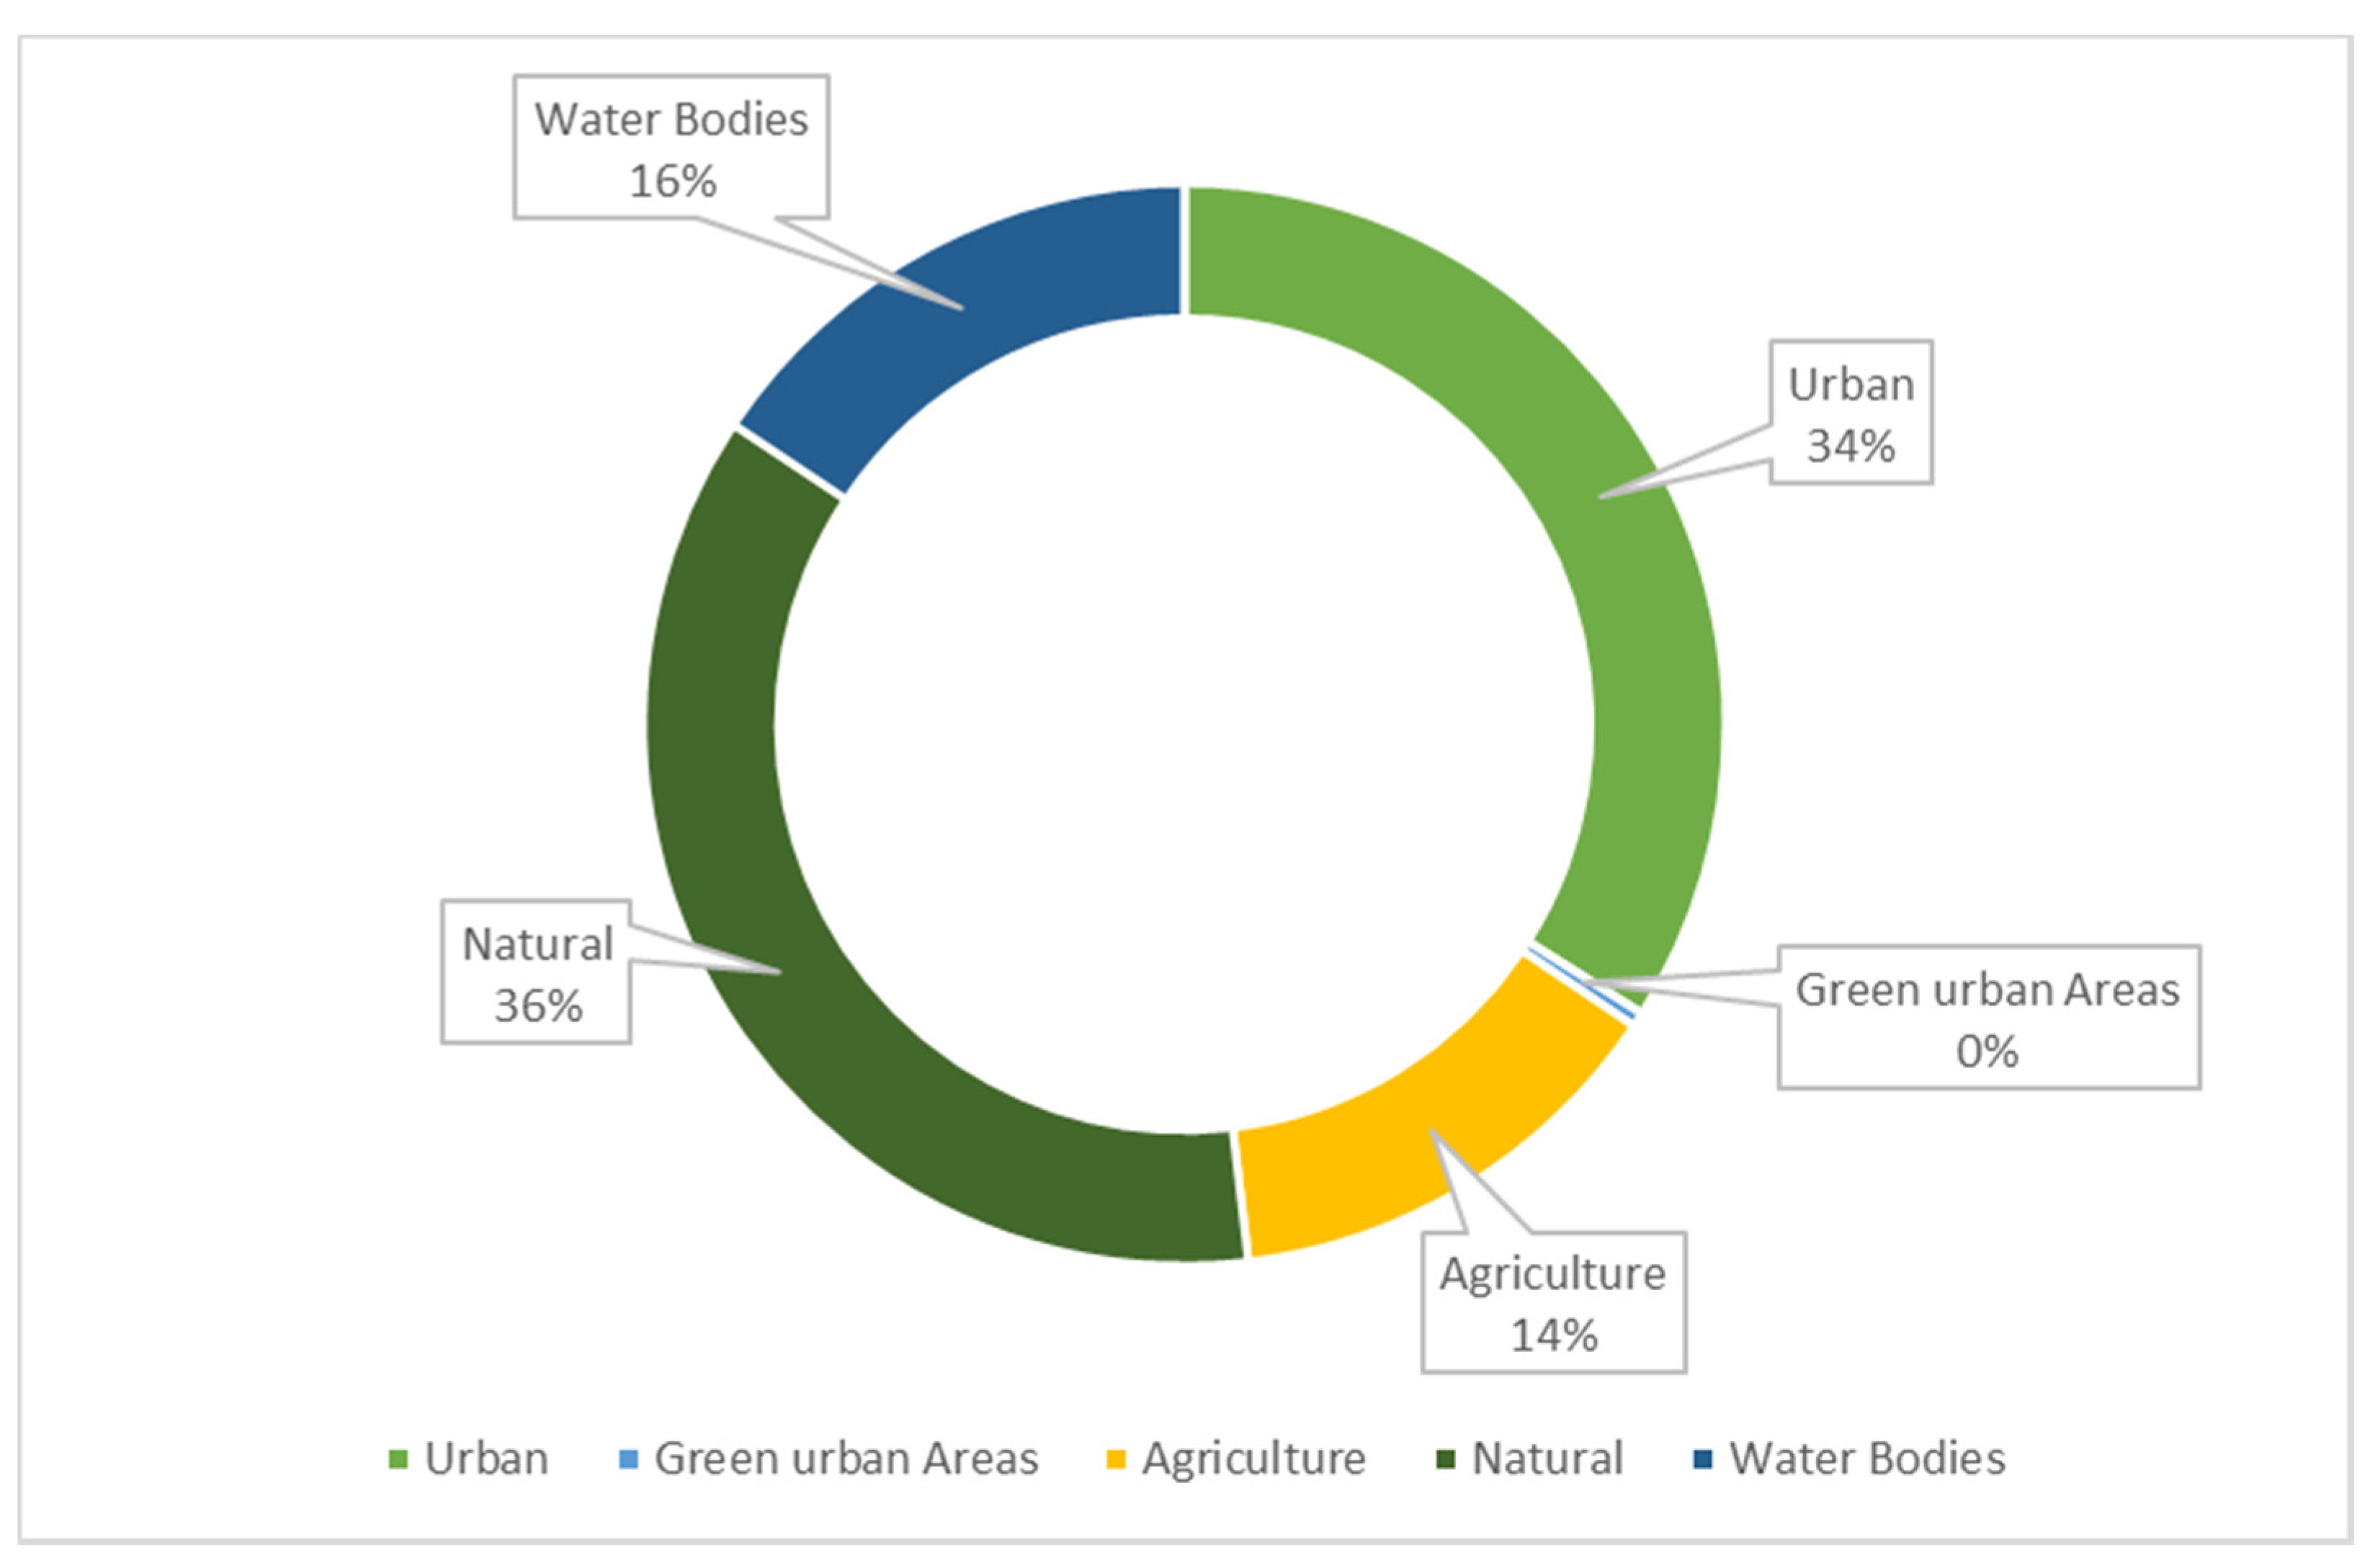
3.1. The Environmental Characteristics of Çiğli
3.2. Modelling Output
3.3. Aggregating the Layers
4. Discussion
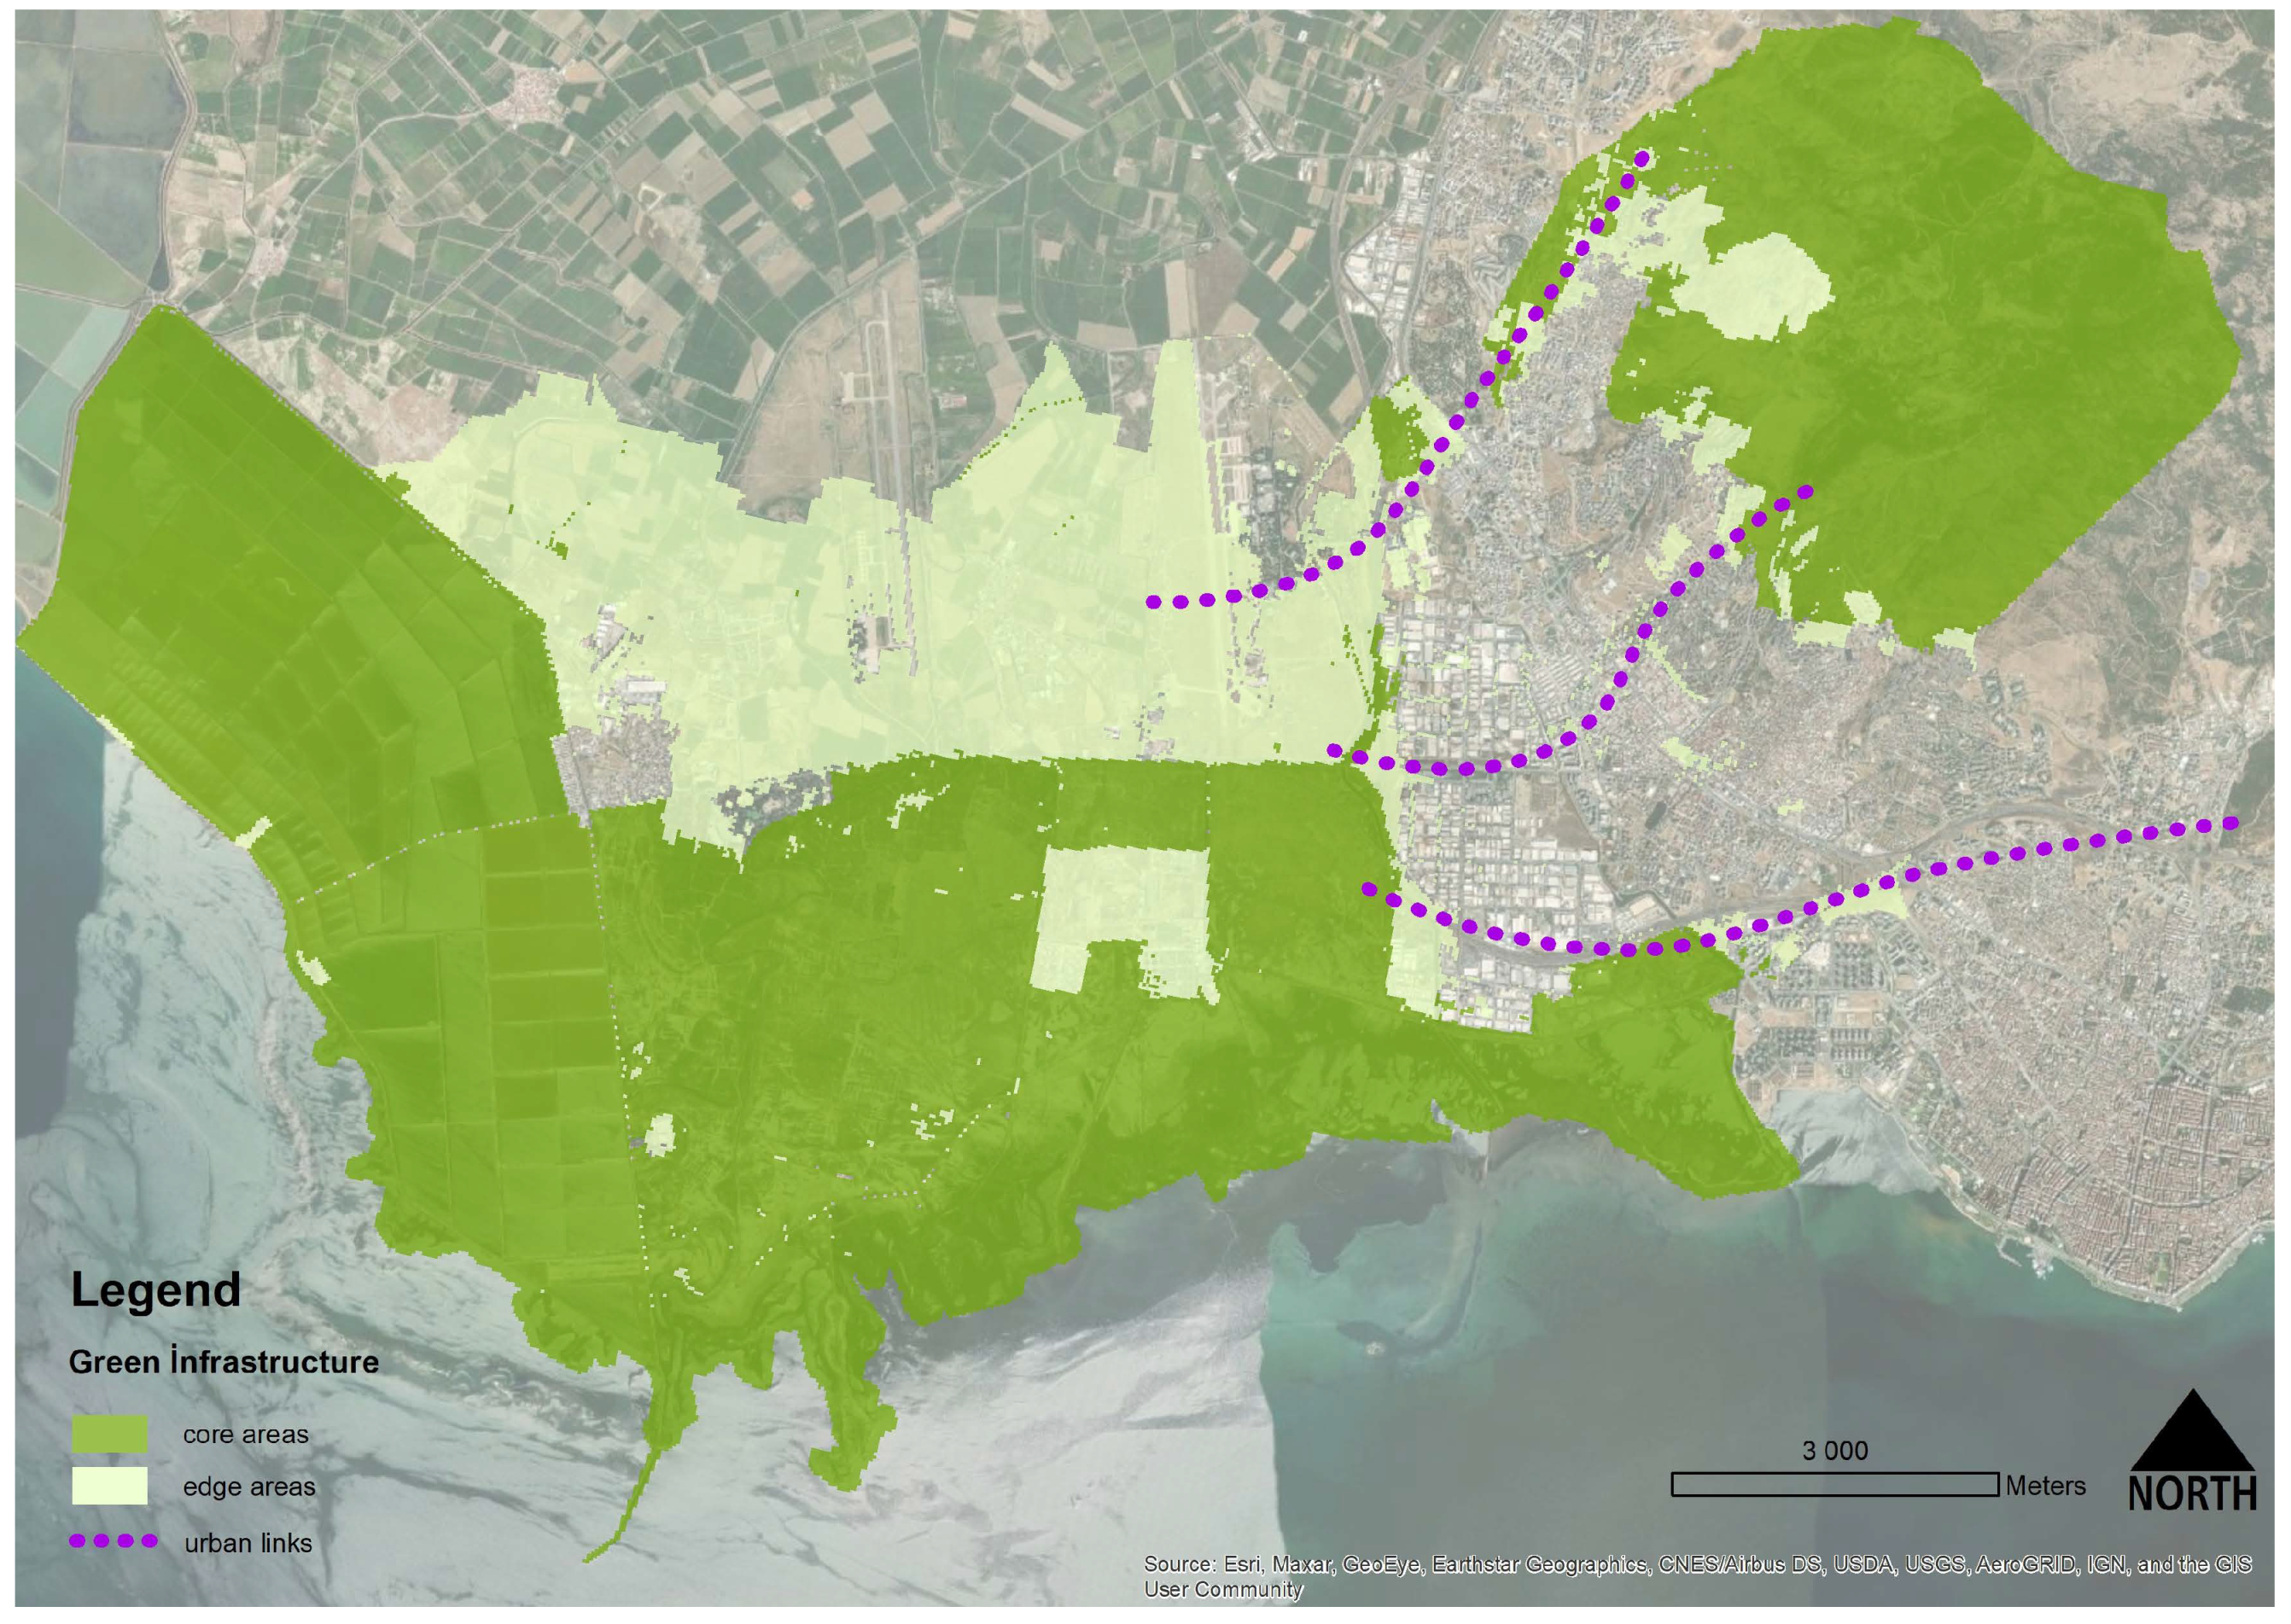
4.1. Designing a Green İnfrastructure
4.1.1. Strategies and NBS for Core Areas
4.1.2. Strategies and NBS for Edge Areas
4.1.3. Strategies and NBS for Urban Links
4.1.4. Specific Interventions for the Existing Settlements
4.2. Limits of the Study
5. Conclusions
Author Contributions
Funding
Institutional Review Board Statement
Informed Consent Statement
Data Availability Statement
Conflicts of Interest
References
- IPCC Climate Change. Part A: Global and Sectoral Aspects; IPCC Climate Change; Cambridge University Press: New York, NY, USA, 2014; ISBN 9781107641655. [Google Scholar]
- Brevik, E.C. The potential impact of climate change on soil properties and processes and corresponding influence on food security. Agriculture 2013, 3, 398. [Google Scholar] [CrossRef] [Green Version]
- Weichselgartner, J.; Kelman, I. Geographies of resilience: Challenges and opportunities of a descriptive concept. Prog. Hum. Geogr. 2015, 39, 249–267. [Google Scholar] [CrossRef] [Green Version]
- Ali, R.; Kuriqi, A.; Kisi, O. Human-environment natural disasters interconnection in China: A review. Climate 2020, 8, 48. [Google Scholar] [CrossRef] [Green Version]
- Maragno, D.; Dall’omo, C.F.; Pozzer, G.; Musco, F. Multi-risk climate mapping for the adaptation of the venice metropolitan area. Sustainability 2021, 13, 1334. [Google Scholar] [CrossRef]
- Orgiazzi, A.; Panagos, P.; Yigini, Y.; Dunbar, M.B.; Gardi, C.; Montanarella, L.; Ballabio, C. A knowledge-based approach to estimating the magnitude and spatial patterns of potential threats to soil biodiversity. Sci. Total Environ. 2016, 545, 11–20. [Google Scholar] [CrossRef]
- Wilbanks, T.J.; Kates, R.W. Beyond adapting to climate change: Embedding adaptation in responses to multiple threats and stresses. Ann. Assoc. Am. Geogr. 2010, 100, 719–728. [Google Scholar] [CrossRef]
- Reckien, D.; Salvia, M.; Heidrich, O.; Church, J.M.; Pietrapertosa, F.; De Gregorio-Hurtado, S.; D’Alonzo, V.; Foley, A.; Simoes, S.G.; Krkoška Lorencová, E.; et al. How are cities planning to respond to climate change? Assessment of local climate plans from 885 cities in the EU-28. J. Clean. Prod. 2018, 191, 207–219. [Google Scholar] [CrossRef]
- Brunetta, G.; Salata, S. Mapping Urban Resilience for Spatial Planning—A First Attempt to Measure the Vulnerability of the System. Sustainability 2019, 11, 2331. [Google Scholar] [CrossRef] [Green Version]
- Van Vuuren, D.P.; Isaac, M.; Kundzewicz, Z.W.; Arnell, N.; Barker, T.; Criqui, P.; Berkhout, F.; Hilderink, H.; Hinkel, J.; Hof, A.; et al. The use of scenarios as the basis for combined assessment of climate change mitigation and adaptation. Glob. Environ. Change 2011, 21, 575–591. [Google Scholar] [CrossRef] [Green Version]
- Schipper, E.L.F. Climate Change Adaptation and Development: Exploring the Linkages. Tyndall Cent. Clim. Chang. Res. Work. Pap. 2007, 107, 20. [Google Scholar] [CrossRef]
- Giampieri, M.A. A review of flood vulnerability indices for coastal cities. In Understanding Disaster Risk; Elsevier: Amsterdam, The Netherlands, 2021; pp. 37–57. [Google Scholar] [CrossRef]
- Salata, S.; Arslan, B. Designing with Ecosystem Modelling: The Sponge District Application in İzmir, Turkey. Sustainability 2022, 14, 3420. [Google Scholar] [CrossRef]
- Silvia Ronchi; Stefano Salata; Andrea Arcidiacono An indicator of urban morphology for landscape planning in Lombardy (Italy). Manag. Environ. Qual. 2018, 29, 623–642. [CrossRef]
- Moudon, A.V. Urban Morphology as an Emerging Interdisiplinary Field.pdf. Urban Morphol. 1997, 1, 3–10. [Google Scholar]
- Günther, A.; Van Den Eeckhaut, M.; Malet, J.P.; Reichenbach, P.; Hervás, J. Climate-physiographically differentiated Pan-European landslide susceptibility assessment using spatial multi-criteria evaluation and transnational landslide information. Geomorphology 2014, 224, 69–85. [Google Scholar] [CrossRef]
- Weng, Q. Land use change analysis in the Zhujiang Delta of China using satellite remote sensing, GIS and stochastic modelling. J. Environ. Manag. 2002, 64, 273–284. [Google Scholar] [CrossRef] [Green Version]
- Chelleri, L.; Waters, J.J.; Olazabal, M.; Minucci, G. Resilience trade-offs: Addressing multiple scales and temporal aspects of urban resilience. Environ. Urban. 2015, 27, 181–198. [Google Scholar] [CrossRef] [Green Version]
- Carpignano, A.; Golia, E.; Di Mauro, C.; Bouchon, S.; Nordvik, J.P. A methodological approach for the definition of multi-risk maps at regional level: First application. J. Risk Res. 2009, 12, 513–534. [Google Scholar] [CrossRef]
- Bertilsson, L.; Wiklund, K.; de Moura Tebaldi, I.; Rezende, O.M.; Veról, A.P.; Miguez, M.G. Urban flood resilience—A multi-criteria index to integrate flood resilience into urban planning. J. Hydrol. 2019, 573, 970–982. [Google Scholar] [CrossRef]
- Fuchs, S.; Keiler, M.; Ortlepp, R.; Schinke, R.; Papathoma-Köhle, M. Recent advances in vulnerability assessment for the built environment exposed to torrential hazards: Challenges and the way forward. J. Hydrol. 2019, 575, 587–595. [Google Scholar] [CrossRef]
- Tyler, S.; Moench, M. A framework for urban climate resilience. Clim. Dev. 2012, 4, 311–326. [Google Scholar] [CrossRef]
- Davoudi, S.; Brooks, E.; Mehmood, A. Evolutionary Resilience and Strategies for Climate Adaptation. Plan. Pract. Res. 2013, 28, 307–322. [Google Scholar] [CrossRef] [Green Version]
- Dorst, H.; van der Jagt, S.; Raven, R.; Runhaar, H. Urban greening through Nature-Based Solutions—Key characteristics of an emerging concept. Sustain. Cities Soc. 2019, 49, 101620. [Google Scholar] [CrossRef]
- McPhearson, T.; Cook, E.M.; Berbés-Blázquez, M.; Cheng, C.; Grimm, N.B.; Andersson, E.; Barbosa, O.; Chandler, D.G.; Chang, H.; Chester, M.V.; et al. A social-ecological-technological systems framework for urban ecosystem services. One Earth 2022, 5, 505–518. [Google Scholar] [CrossRef]
- Rehan, B.M. Accounting public and individual flood protection measures in damage assessment: A novel approach for quantitative assessment of vulnerability and flood risk associated with local engineering adaptation options. J. Hydrol. 2018, 563, 863–873. [Google Scholar] [CrossRef]
- Liotta, C.; Kervinio, Y.; Levrel, H.; Tardieu, L. Planning for environmental justice—Reducing well-being inequalities through urban greening. Environ. Sci. Policy 2020, 112, 47–60. [Google Scholar] [CrossRef]
- Herreros-Cantis, P.; McPhearson, T. Mapping supply of and demand for ecosystem services to assess environmental justice in New York City. Ecol. Appl. 2021, 31, e02390. [Google Scholar] [CrossRef] [PubMed]
- Salata, S.; Giaimo, C.; Barbieri, C.A.; Garnero, G. The utilization of ecosystem services mapping in land use planning: The experience of LIFE SAM4CP project. J. Environ. Plan. Manag. 2019, 1–23. [Google Scholar] [CrossRef] [Green Version]
- European Commission. Future Brief: No Net Land Take by 2050? European Commission: Brussels, Belgium, 2016. [Google Scholar]
- Meerow, S.; Newell, J.P. Spatial planning for multifunctional green infrastructure: Growing resilience in Detroit. Landsc. Urban Plan. 2017, 159, 62–75. [Google Scholar] [CrossRef]
- Burkhard, B.; Kroll, F.; Nedkov, S.; Müller, F. Mapping ecosystem service supply, demand and budgets. Ecol. Indic. 2012, 21, 17–29. [Google Scholar] [CrossRef]
- Geneletti, D.; Cortinovis, C.; Zardo, L.; Adem Esmail, B. Planning for Ecosystem Services in Cities; Springer Nature: Cham, Switzerland, 2020; ISBN 978-3-030-20024-4. [Google Scholar]
- Partidario, M.R.; Gomes, R.C. Ecosystem services inclusive strategic environmental assessment. Environ. Impact Assess. Rev. 2013, 40, 36–46. [Google Scholar] [CrossRef]
- Ten Brink, P.; Kettunen, M.; Vakrou, A.; Wittmer, H. The Economics of Ecosystems and Biodiversity; TEEB for National and International Policy Makers; A Banson Production: Cambridge, UK, 2009. [Google Scholar]
- Cortinovis, C.; Geneletti, D. Ecosystem services in urban plans: What is there, and what is still needed for better decisions. Land Use Policy 2018, 70, 298–312. [Google Scholar] [CrossRef]
- Andersson, E.; Langemeyer, J.; Borgström, S.; McPhearson, T.; Haase, D.; Kronenberg, J.; Barton, D.N.; Davis, M.; Naumann, S.; Röschel, L.; et al. Enabling Green and Blue Infrastructure to Improve Contributions to Human Well-Being and Equity in Urban Systems. Bioscience 2019, 69, 566–574. [Google Scholar] [CrossRef] [PubMed]
- Rahmati, O.; Darabi, H.; Panahi, M.; Kalantari, Z.; Naghibi, S.A.; Ferreira, C.S.S.; Kornejady, A.; Karimidastenaei, Z.; Mohammadi, F.; Stefanidis, S.; et al. Development of novel hybridized models for urban flood susceptibility mapping. Sci. Rep. 2020, 10, 12937. [Google Scholar] [CrossRef] [PubMed]
- Ward Thompson, C.; Elizalde, A.; Cummins, S.; Leyland, A.H.; Botha, W.; Briggs, A.; Tilley, S.; Silveirinha de Oliveira, E.; Roe, J.; Aspinall, P.; et al. Enhancing Health Through Access to Nature: How Effective are Interventions in Woodlands in Deprived Urban Communities? A Quasi-experimental Study in Scotland, UK. Sustainability 2019, 11, 3317. [Google Scholar] [CrossRef] [Green Version]
- Meisner, C.; Gjorgjev, D.; Tozija, F. Estimating health impacts and economic costs of air pollution in the Republic of Macedonia. Southeast. Eur. J. Public Health 2015, 10, 1–8. [Google Scholar] [CrossRef]
- Dilling, L.; Failey, E. Managing carbon in a multiple use world: The implications of land-use decision context for carbon management. Glob. Environ. Change 2013, 23, 291–300. [Google Scholar] [CrossRef]
- Sala, S.; Ciuffo, B.; Nijkamp, P. A systemic framework for sustainability assessment. Ecol. Econ. 2015, 119, 314–325. [Google Scholar] [CrossRef]
- Salata, S.; Giaimo, C.; Barbieri, C.A.; Ballocca, A.; Scalise, F.; Pantaloni, G. The Utilization of Normalized Difference Vegetation Index to Map Habitat Quality in Turin (Italy). Sustainability 2020, 12, 7751. [Google Scholar] [CrossRef]
- Meerow, S.; Newell, J.P.; Stults, M. Defining urban resilience: A review. Landsc. Urban Plan. 2016, 147, 38–49. [Google Scholar] [CrossRef]
- Mehmood, A. Of resilient places: Planning for urban resilience. Eur. Plan. Stud. 2016, 24, 407–419. [Google Scholar] [CrossRef] [Green Version]
- Schwarz, A.M.; Béné, C.; Bennett, G.; Boso, D.; Hilly, Z.; Paul, C.; Posala, R.; Sibiti, S.; Andrew, N. Vulnerability and resilience of remote rural communities to shocks and global changes: Empirical analysis from Solomon Islands. Glob. Environ. Change 2011, 21, 1128–1140. [Google Scholar] [CrossRef]
- Childers, D.L.; Bois, P.; Hartnett, H.E.; Exploration, S.; Mcphearson, T.; Metson, G.S. Urban Ecological Infrastructure: An inclusive concept for the non-built urban environment. Elem. Sci. Anthr. 2019, 7, 46. [Google Scholar] [CrossRef] [Green Version]
- Ronchi, S.; Arcidiacono, A.; Pogliani, L. Integrating green infrastructure into spatial planning regulations to improve the performance of urban ecosystems. Insights from an Italian case study. Sustain. Cities Soc. 2020, 53, 101907. [Google Scholar] [CrossRef]
- Costanza, R.; de Groot, R.; Braat, L.; Kubiszewski, I.; Fioramonti, L.; Sutton, P.; Farber, S.; Grasso, M. Twenty years of ecosystem services: How far have we come and how far do we still need to go? Ecosyst. Serv. 2017, 28, 1–16. [Google Scholar] [CrossRef]
- Lafortezza, R.; Davies, C.; Sanesi, G.; Konijnendijk, C.C.C. Green Infrastructure as a tool to support spatial planning in European urban regions. iForest-Biogeosci. For. 2013, 6, 102–108. [Google Scholar] [CrossRef] [Green Version]
- Potschin, M.; Haines-Young, R. Landscapes, sustainability and the place-based analysis of ecosystem services. Landsc. Ecol. 2013, 28, 1053–1065. [Google Scholar] [CrossRef]
- Raymond, C.M.; Frantzeskaki, N.; Kabisch, N.; Berry, P.; Breil, M.; Nita, M.R.; Geneletti, D.; Calfapietra, C. A framework for assessing and implementing the co-benefits of nature-based solutions in urban areas. Environ. Sci. Policy 2017, 77, 15–24. [Google Scholar] [CrossRef]
- Kopperoinen, L.; Itkonen, P.; Niemelä, J. Using expert knowledge in combining green infrastructure and ecosystem services in land use planning: An insight into a new place-based methodology. Landsc. Ecol. 2014, 29, 1361–1375. [Google Scholar] [CrossRef]
- European Commission. Guidelines on Best Practice to Limit, Mitigate or Compensate Soil Sealing; European Commission: Brussels, Belgium, 2012; ISBN 9789279262104. [Google Scholar]
- Liu, Z.; Xiu, C.; Ye, C. Improving Urban Resilience through Green Infrastructure: An Integrated Approach for Connectivity Conservation in the Central City of Shenyang, China. Complexity 2020, 2020, 1653493. [Google Scholar] [CrossRef]
- Hansen, R.; Olafsson, A.S.; van der Jagt, A.P.N.; Rall, E.; Pauleit, S. Planning multifunctional green infrastructure for compact cities: What is the state of practice? Ecol. Indic. 2019, 96, 99–110. [Google Scholar] [CrossRef]
- Sharps, K.; Masante, D.; Thomas, A.; Jackson, B.; Redhead, J.; May, L.; Prosser, H.; Cosby, B.; Emmett, B.; Jones, L. Comparing strengths and weaknesses of three ecosystem services modelling tools in a diverse UK river catchment. Sci. Total Environ. 2017, 584, 118–130. [Google Scholar] [CrossRef] [PubMed] [Green Version]
- Zulian, G.; Stange, E.; Woods, H.; Carvalho, L.; Dick, J.; Andrews, C.; Baró, F.; Vizcaino, P.; Barton, D.N.; Nowel, M.; et al. Practical application of spatial ecosystem service models to aid decision support. Ecosyst. Serv. 2018, 29, 465–480. [Google Scholar] [CrossRef] [PubMed]
- Salata, S.; Grillenzoni, C. A spatial evaluation of multifunctional Ecosystem Service networks using Principal Component Analysis: A case of study in Turin, Italy. Ecol. Indic. 2021, 127, 107758. [Google Scholar] [CrossRef]
- Albert, C.; Schröter, B.; Haase, D.; Brillinger, M.; Henze, J.; Herrmann, S.; Gottwald, S.; Guerrero, P.; Nicolas, C.; Matzdorf, B. Addressing societal challenges through nature-based solutions: How can landscape planning and governance research contribute? Landsc. Urban Plan. 2019, 182, 12–21. [Google Scholar] [CrossRef]
- Venter, Z.S.; Barton, D.N.; Martinez-Izquierdo, L.; Langemeyer, J.; Baró, F.; McPhearson, T. Interactive spatial planning of urban green infrastructure—Retrofitting green roofs where ecosystem services are most needed in Oslo. Ecosyst. Serv. 2021, 50, 101314. [Google Scholar] [CrossRef]
- Vanderhaegen, S.; De Munter, K.; Canters, F. High resolution modelling and forecasting of soil sealing density at the regional scale. Landsc. Urban Plan. 2015, 133, 133–142. [Google Scholar] [CrossRef]
- Salata, S.; Ozkavaf-Senalp, S.; Velibeyoğlu, K.; Elburz, Z. Land Suitability Analysis for Vineyard Cultivation in the Izmir Metropolitan Area. Land 2022, 11, 416. [Google Scholar] [CrossRef]
- Tallis, H.T.; Ricketts, T.; Guerry, A.D.; Wood, S.A.; Sharp, R.; Nelson, E.; Ennaanay, D.; Wolny, S.; Olwero, N.; Vigerstol, K.; et al. InVEST 2.0 Beta User’s Guide; Stanford University: Stanford, CA, USA, 2011. [Google Scholar]
- Velibeyoğlu, K.; Özdemir, S.; Baba, A.; Arsan, Z.D.; Yazdani, H.; Hazar, D.; Kaplan, A.; Boyacı, M.; Kurucu, Y.; Erdoğan, N.; et al. ‘Urla-Çeşme-Karaburun’ Peninsula Sustainable Development Strategy 2014–2023; İZKA (İzmir Development Agency): Izmir, Turkey, 2014.
- Velibeyoglu, K. Regional Acupuncture for Izmir Peninsula: Creating Capital Web for Creative Eco-Tourism. J. Environ. Prot. Ecol. 2016, 17, 666–674. [Google Scholar]
- Salata, S. The Utilization of Supervised Classification Sampling for Environmental Monitoring in Turin (Italy). Sustainability 2021, 13, 2494. [Google Scholar] [CrossRef]
- Li, H.; Wang, S.; Ji, G.; Zhang, L. Changes in land use and ecosystem service values in Jinan, China. Energy Procedia 2011, 5, 1109–1115. [Google Scholar] [CrossRef] [Green Version]
- Liu, T.; Yang, X. Monitoring land changes in an urban area using satellite imagery, GIS and landscape metrics. Appl. Geogr. 2015, 56, 42–54. [Google Scholar] [CrossRef]
- Mosammam, H.M.; Nia, J.T.; Khani, H.; Teymouri, A.; Kazemi, M. Monitoring land use change and measuring urban sprawl based on its spatial forms: The case of Qom city. Egypt. J. Remote Sens. Space Sci. 2017, 20, 103–116. [Google Scholar] [CrossRef] [Green Version]
- Zang, S.; Wu, C.; Liu, H.; Na, X. Impact of urbanization on natural ecosystem service values: A comparative study. Environ. Monit. Assess. 2011, 179, 575–588. [Google Scholar] [CrossRef] [PubMed]
- Coskun Hepcan, C. Quantifying landscape pattern and connectivity in a Mediterranean coastal settlement: The case of the Urla district, Turkey. Environ. Monit. Assess. 2013, 185, 143–155. [Google Scholar] [CrossRef]
- Artmann, M.; Chen, X.; Iojă, C.; Hof, A.; Onose, D.; Poniży, L.; Lamovšek, A.Z.; Breuste, J. The role of urban green spaces in care facilities for elderly people across European cities. Urban For. Urban Green. 2017, 27, 203–213. [Google Scholar] [CrossRef]
- Yang, J.; Sun, J.; Quansheng, G.; Li, X. Assessing the impacts of urbanization-associated green space on urban land surface temperature: A case study of Dalian, China. Urban For. Urban Green. 2017, 22, 1–10. [Google Scholar] [CrossRef]
- McHarg, I.L. Design with Nature; Wiley: Hoboken, NJ, USA, 1969. [Google Scholar]
- BenDor, T.K.; Spurlock, D.; Woodruff, S.C.; Olander, L. A research agenda for ecosystem services in American environmental and land use planning. Cities 2017, 60, 260–271. [Google Scholar] [CrossRef]
- Dizdaroglu, D.; Yigitcanlar, T. Integrating urban ecosystem sustainability assessment into policy-making: Insights from the Gold Coast City. J. Environ. Plan. Manag. 2016, 59, 1982–2006. [Google Scholar] [CrossRef] [Green Version]
- Mubareka, S.; Koomen, E.; Estreguil, C.; Lavalle, C. Development of a composite index of urban compactness for land use modelling applications. Landsc. Urban Plan. 2011, 103, 303–317. [Google Scholar] [CrossRef]
- McGarigal, K.; Marks, B.J. FRAGSTATS: Spatial Pattern Analysis Program for Quantifying Landscapes Structure; General Technical Report PNW-GTR-351; U.S. Department of Agriculture, Forest Service, Pacific Northwest Research Station: Portland, OR, USA, 1994; Volume 97331, p. 134.
- Bailey, D.; Billeter, R.; Aviron, S.; Schweiger, O.; Herzog, F. The influence of thematic resolution on metric selection for biodiversity monitoring in agricultural landscapes. Landsc. Ecol. 2007, 22, 461–473. [Google Scholar] [CrossRef]
- Borgogno-Mondino, E.; Fabietti, G.; Ajmone-Marsan, F. Soil quality and landscape metrics as driving factors in a multi-criteria GIS procedure for peri-urban land use planning. Urban For. Urban Green. 2015, 14, 743–750. [Google Scholar] [CrossRef]
- Artmann, M. Managing urban soil sealing in Munich and Leipzig (Germany)—From a wicked problem to clumsy solutions. Land Use Policy 2015, 46, 21–37. [Google Scholar] [CrossRef]
- Artmann, M. Urban gray vs. urban green vs. soil protection—Development of a systemic solution to soil sealing management on the example of Germany. Environ. Impact Assess. Rev. 2016, 59, 27–42. [Google Scholar] [CrossRef]
- Gustafson, E.J. Quantifying Landscape Spatial Pattern: What Is the State of the Art? Ecosystems 1998, 1, 143–156. [Google Scholar] [CrossRef]
- Lennon, M.; Scott, M. Delivering ecosystems services via spatial planning: Reviewing the possibilities and implications of a green infrastructure approach. Town Plan. Rev. 2014, 85, 563–587. [Google Scholar] [CrossRef] [Green Version]
- Williams, P.; Hannah, L.; Andelman, S. Planning for Climate Change: Identifying Minimum-Dispersal Corridors for the Cape Proteaceae. Conserv. Biol. 2005, 19, 1063–1074. [Google Scholar] [CrossRef]
- Armson, D.; Stringer, P.; Ennos, A.R. The effect of street trees and amenity grass on urban surface water runoff in Manchester, UK. Urban For. Urban Green. 2013, 12, 282–286. [Google Scholar] [CrossRef]
- Chang, J.; Qu, Z.; Xu, R.; Pan, K.; Xu, B.; Min, Y.; Ren, Y.; Yang, G.; Ge, Y. Assessing the ecosystem services provided by urban green spaces along urban center-edge gradients. Sci. Rep. 2017, 7, 11226. [Google Scholar] [CrossRef] [Green Version]


| Lulc | Name | Habitat | Urban |
|---|---|---|---|
| 1 | Forests | 1 | 1 |
| 2 | Continuousu | 0.1 | 0 |
| 3 | Discontinuous | 0.5 | 0 |
| 4 | Industrial | 0 | 0 |
| 5 | Discontinuouslow | 0.5 | 0.5 |
| 6 | Land withoutcu | 0.5 | 0.5 |
| 7 | Arable land | 0.6 | 0.4 |
| 8 | Mineral extraction dump | 0.1 | 0 |
| 9 | Permanent crops | 0.7 | 0.7 |
| 10 | Pastures | 0.8 | 1 |
| 11 | Herbaceous vegetation | 0.8 | 1 |
| 12 | Isolated structures | 0.6,0.2 | |
| 13 | Other roads | 0.3 | 0 |
| 14 | Railways | 0.3 | 0 |
| 15 | Fast transit roads | 0.3 | 0 |
| 16 | Discontinuousmedi | 0.5 | 0.3 |
| 17 | Airports | 0.3 | 0 |
| 18 | Green urban areas | 0.5 | 0.5 |
| 20 | Water | 1 | 1 |
| 21 | Open spaces | 1 | 1 |
| 22 | Wetlands | 1 | 1 |
| 23 | Discontinuousvl | 0.5 | 0.5 |
| 24 | Construction sites | 0.3 | 0 |
| 25 | Sports | 0.3 | 0 |
| Indıcator/Index | Max | Min | Mean | Units |
|---|---|---|---|---|
| Imperviousness | 100 | 0 | 10.98 | % |
| Tree Cover Density | 100 | 0 | 13.86 | % |
Publisher’s Note: MDPI stays neutral with regard to jurisdictional claims in published maps and institutional affiliations. |
© 2022 by the authors. Licensee MDPI, Basel, Switzerland. This article is an open access article distributed under the terms and conditions of the Creative Commons Attribution (CC BY) license (https://creativecommons.org/licenses/by/4.0/).
Share and Cite
Salata, S.; Erdoğan, B.; Ayruş, B. Designing Urban Green Infrastructures Using Open-Source Data—An Example in Çiğli, Izmir (Turkey). Urban Sci. 2022, 6, 42. https://doi.org/10.3390/urbansci6030042
Salata S, Erdoğan B, Ayruş B. Designing Urban Green Infrastructures Using Open-Source Data—An Example in Çiğli, Izmir (Turkey). Urban Science. 2022; 6(3):42. https://doi.org/10.3390/urbansci6030042
Chicago/Turabian StyleSalata, Stefano, Bensu Erdoğan, and Bersu Ayruş. 2022. "Designing Urban Green Infrastructures Using Open-Source Data—An Example in Çiğli, Izmir (Turkey)" Urban Science 6, no. 3: 42. https://doi.org/10.3390/urbansci6030042
APA StyleSalata, S., Erdoğan, B., & Ayruş, B. (2022). Designing Urban Green Infrastructures Using Open-Source Data—An Example in Çiğli, Izmir (Turkey). Urban Science, 6(3), 42. https://doi.org/10.3390/urbansci6030042