Article

Assessing the Impacts of Dike Systems on Water Quality in Natural Reserves of the Vietnamese Mekong Delta

1
College of Environment and Natural Resources Management (CENREs), Can Tho University, Can Tho 900000, Vietnam
2
Department of Water Resources, College of Environment and Natural Resources (CENREs), Can Tho University, Can Tho 900000, Vietnam
3
Institute for Global Environmental Strategies, Hayama 240-0115, Japan
4
Institute of Environmental Sciences and Technology, Tra Vinh University, Tra Vinh 940000, Vietnam
5
Department of Hydraulic Engineering, College of Technology, Can Tho University, Can Tho 900000, Vietnam
6
Faculty of Environmental Earth Science, Hokkaido University, Sapporo 060-0810, Japan
*
Author to whom correspondence should be addressed.
Urban Sci. 2022, 6(1), 21; https://doi.org/10.3390/urbansci6010021
Submission received: 18 December 2021 / Revised: 3 March 2022 / Accepted: 6 March 2022 / Published: 9 March 2022

Abstract

:
Protected places such as nature reserves (NRs) are used to maintain ecological balance, biodiversity, and support surrounding ecosystems. However, the development and operation of infrastructure such as dikes and sluice gates in NRs, as seen in the Vietnamese Mekong Delta (VMD), often adversely affects the hydrological regime and water quality at both local and regional scales. This study analyzes the consequences of a constructed dike system on the hydrological regime and water quality in the NRs through an integrated approach including hydrochemical analysis (using descriptive statistics and weighted arithmetic water quality index (WAWQI) analysis), traditional interviews (face to face), using semi-structured questionnaires, field surveys, and secondary data. Results show that constructed infrastructure has helped maintain water supplies for both livelihoods and forest fire prevention. However, considerable impacts on the hydrological regime and water quality have occurred. From water quality assessments in three NRs, 29% of sampling sites in the My Phuoc melaleuca forest (MPMF) had WAWQI values over 100, while all sites in Lung Ngoc Hoang NR (LNHNR) and Mua Xuan Agriculture Center (MXAC) had WAWQI values over 100. This was to a large extent due to elevated concentration of chemical oxygen demand (COD), biological oxygen demand (BOD5), and phosphate (PO43−). Meanwhile, during the wet season, pollution was marginally reduced by dilution, with 42.86% of sites at Lung Ngoc Hoang NR, 28.57% of sites at MXAC, and 78.57% of sites at MPMF having WAWQI values of less than 100. These results show the issue of water pollution at spatio-temporal scales, and call for better holistic management options for improving the hydrological regime and water quality.

1. Introduction

The water resources of the Vietnamese Mekong Delta (VMD) are vulnerable to both anthropogenic and natural changes, affecting both the quantity and quality of the hydrological regime [1,2,3]. Furthermore, recent socioeconomic development and transformation of the delta has resulted in increased agricultural and aquaculture production; increased pollution; urban sprawl; and a scarcity of human, financial, and technical resources, which in turn have led to poor governance and challenges to nature protection and biodiversity conservation efforts. The state management of some fields between local and central government has shown overlapping issues and lacks close cooperation [4]. The most recent climate change scenarios for Vietnam forecast a sea level rise of between 0.75 to 1 m by year 2100. This would inundate about 20–38% of the VMD, seriously affecting 27% of Vietnam’s listed critical natural habitats, 33% of protected areas, 23% of nationally and internationally important biodiversity sites, and 23 other important conservation sites. As the largest nature reserve (NR) in the VMD, Lung Ngoc Hoang Nature Reserve (LNHNR) is a wetland NR located in Phuong Binh commune, Phung Hiep district, Hau Giang province with a total area of ~3000 ha. LNHNR was created between the two ecological zones, west of Hau River (Bassac River) and Ca Mau Peninsula. The LNHNR was formed from the process of sea retreat, and exhibits rich alluvial accretion with mainly coastal sediments and swamps, leading to a low and quite flat topography dissected by a system of canals. The LNHNR was formed with the objectives of safeguarding a habitat for different species, maintaining the ecological balance, maintaining and increasing forest cover, and safeguarding the sustainable development of the VMD [5].
However, the construction and operation of hard engineering infrastructure aimed at regulating water in order to store water into channel to prevent the forest fires, such as dikes and sluices, has resulted in changes in tidal fluctuation and flow directions. Additionally, the conversion of forest land to agriculture has contributed to the above changes, as melaleuca forests are known to play an important role in ecosystem conservation and water regulation. Initially, sluices and dikes were erected as part of short-term plans to preserve water for forest fire prevention. However, after a short period of time, the water regime has changed; it no longer follows the natural tidal flow and is solely dependent on the structure’s operation. To assess the spatial and temporal dynamics of water quality, the water quality index (WQI) is one of the most utilized and reliable used tools worldwide [6] Additional index systems, such as the National Sanitation Foundation Water Quality Index (NSFWQI) and the Canadian Council of Ministers of the Environment Water Quality Index (CCMEWQI), Oregon Water Quality Index (OWQI), and weighted arithmetic water quality index (WAWQI) are also widely used [7,8,9,10,11,12]. The WAWQI is a multi-objective decision-making method, and has been widely used in the assessment and management of water quality in developing countries [7,13,14,15].
To date, no studies have been conducted to assess the impacts of natural and anthropogenic factors on the hydrological regimes and water quality in the nature reserves of Vietnam. Considering the above-mentioned information gap and necessity, this study aimed to assess the impacts of infrastructure development in the LNHNR and its surrounding areas using an integrated hybrid approach of hydrochemical analysis, WAWQI development, and household surveys.

2. Materials and Methods

Current analysis of water quality parameters was undertaken as representative of the current situation post dike and sluice construction. However, as no past data on water quality parameter were available previous to construction, household surveys were conducted to understand the situation before the construction and operation of engineered solutions and to quantify differences.

2.1. Materials

2.1.1. Apparatus and Chemicals
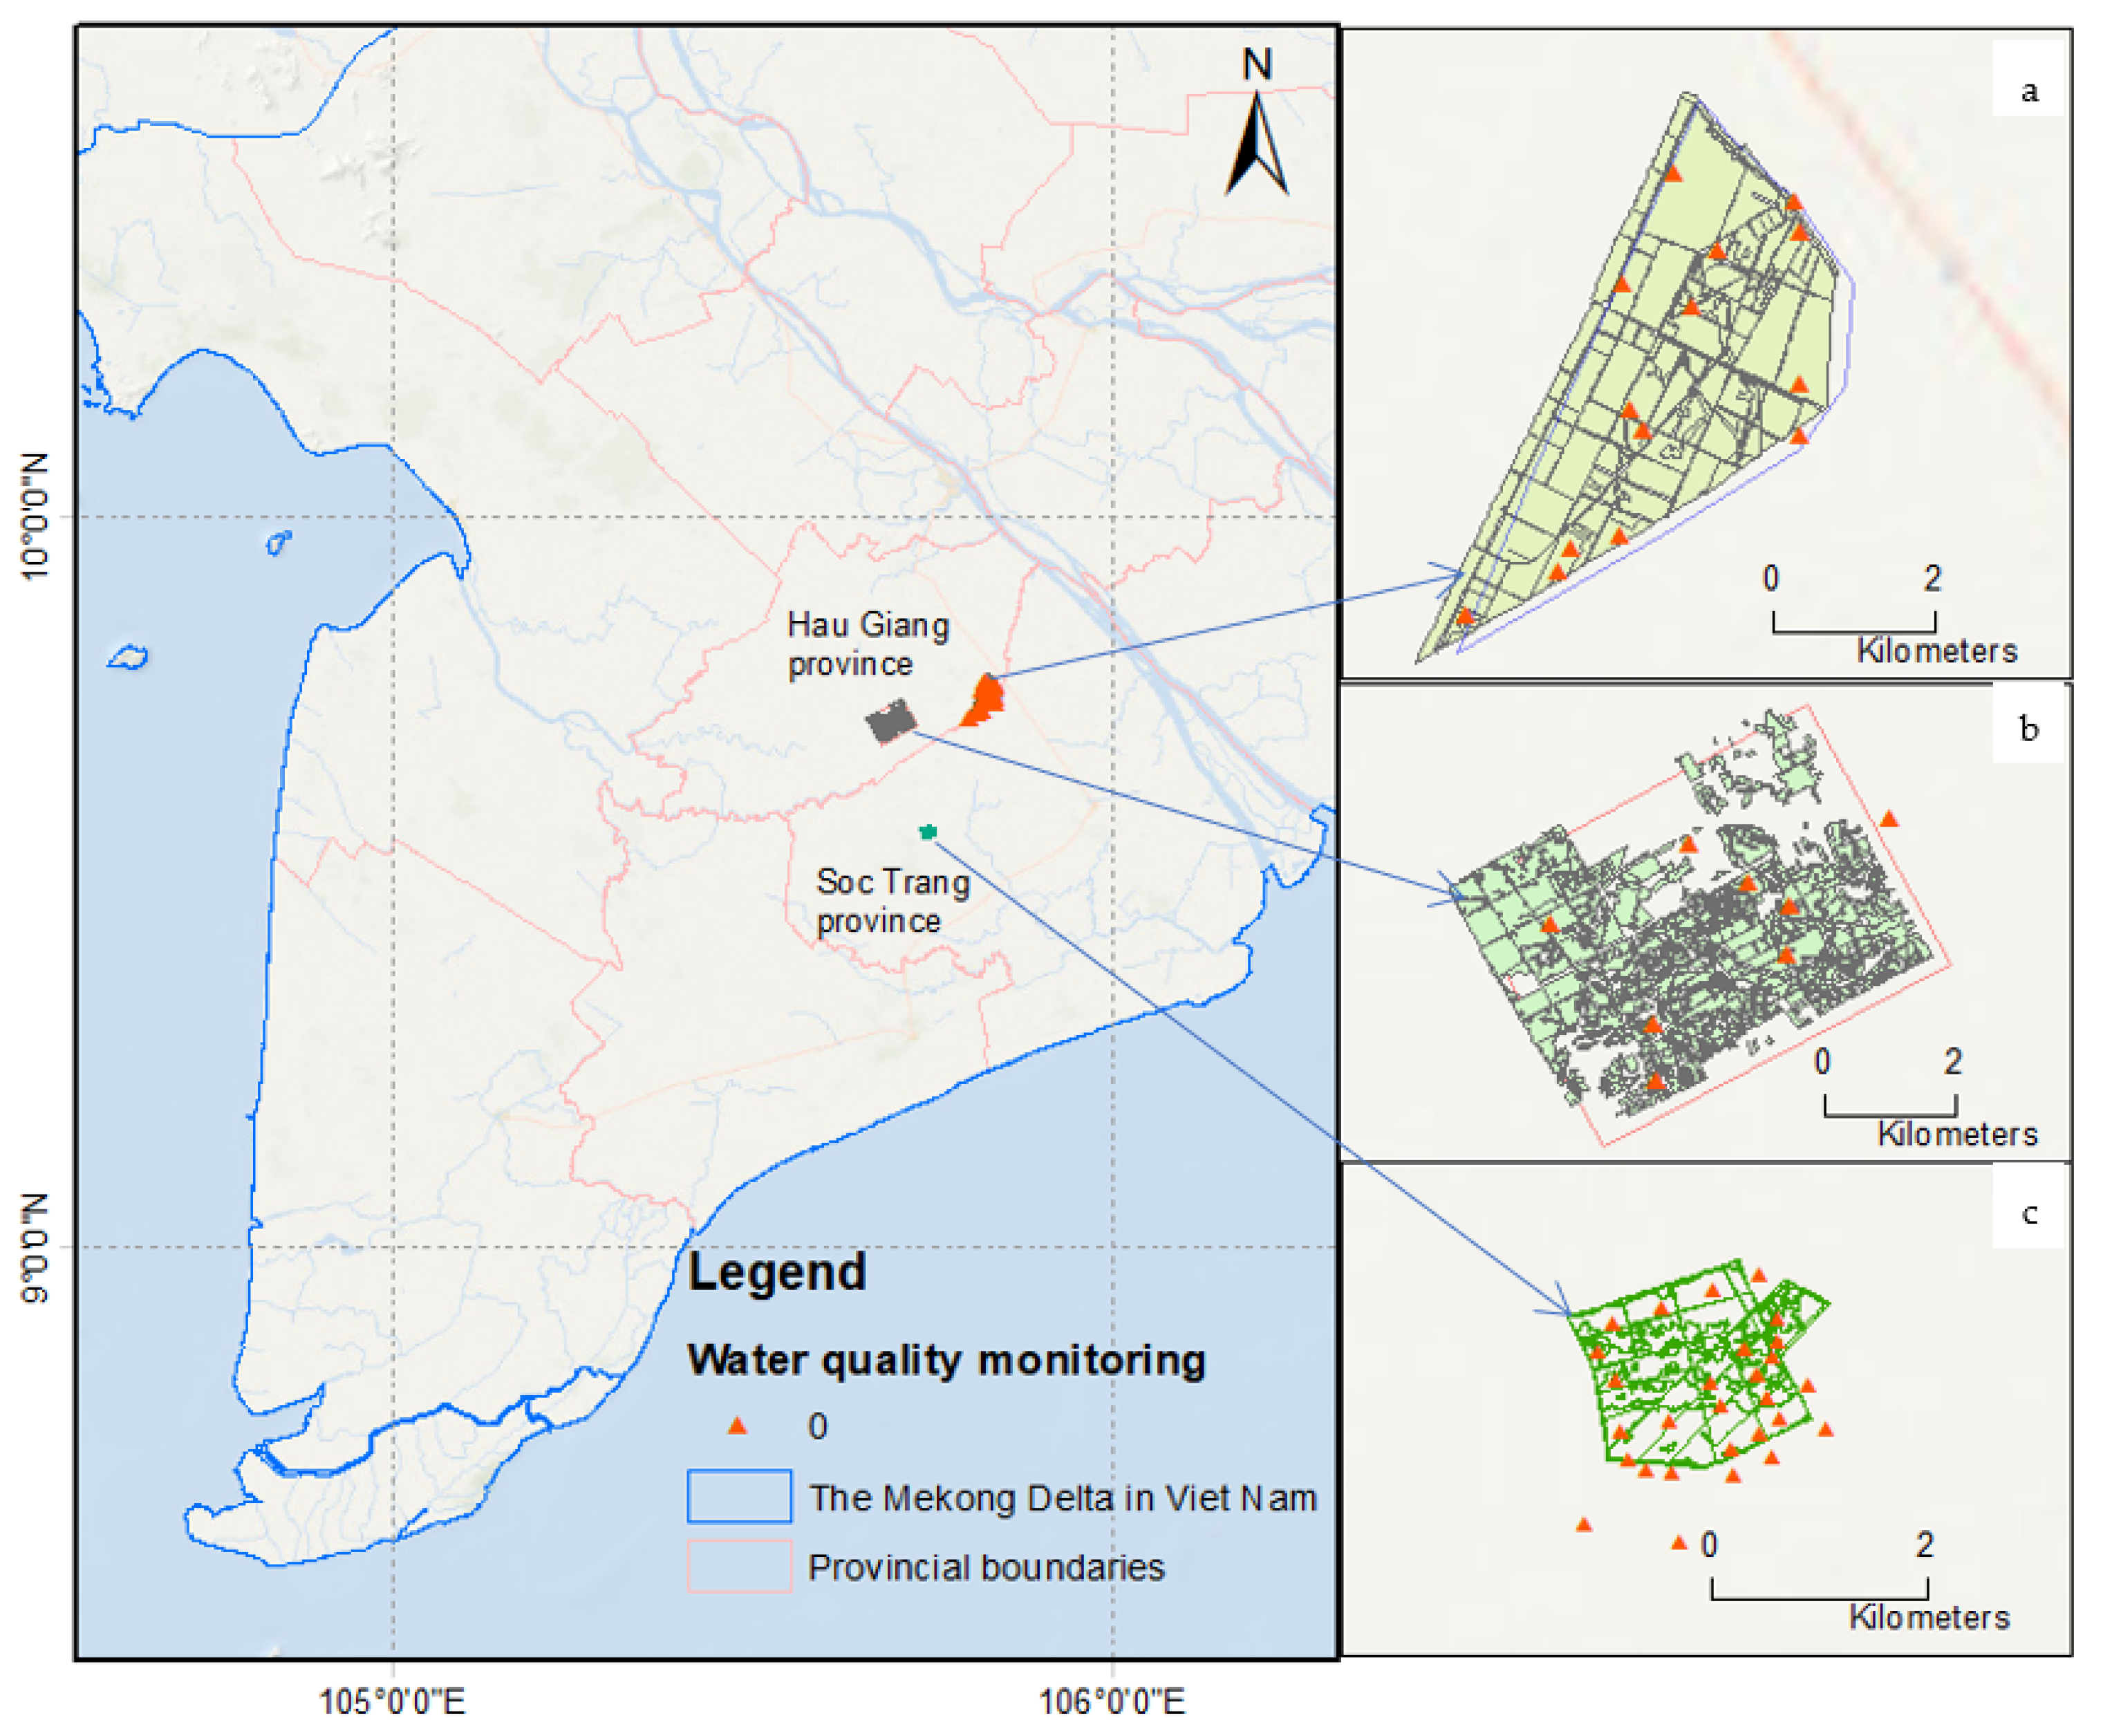
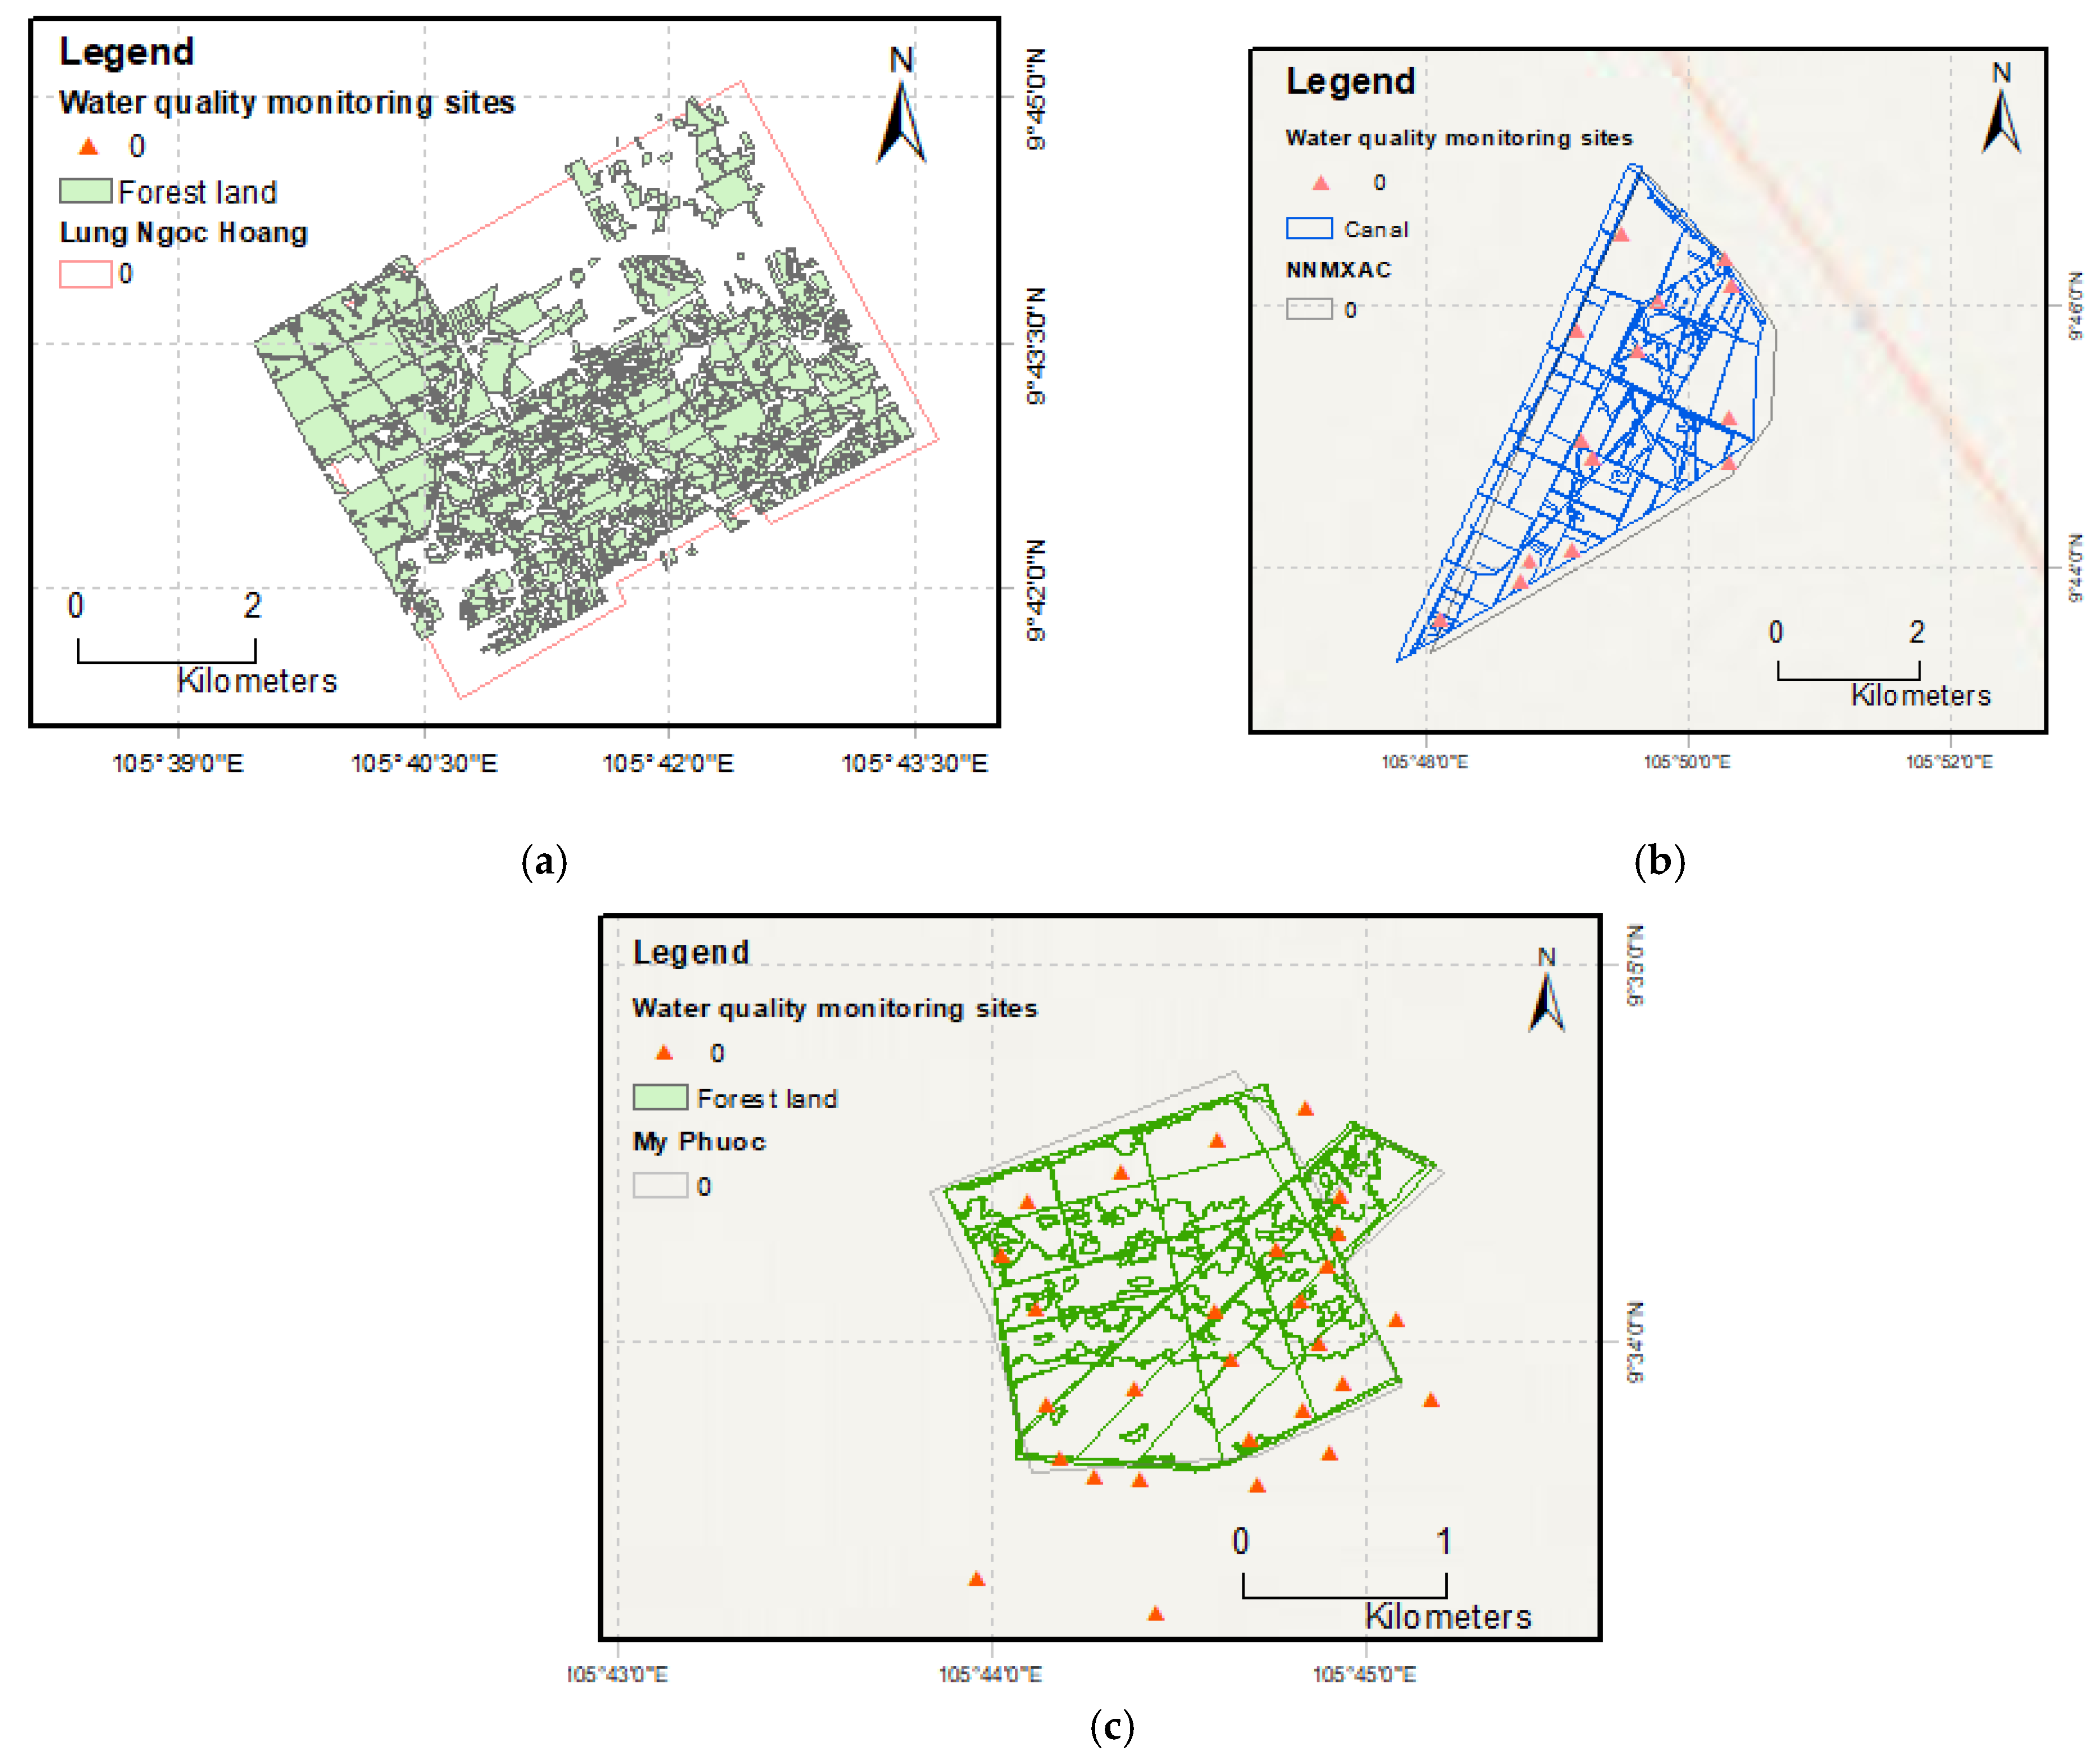
GPS navigation device, thermometer, pH meter, multiparameter probe, turbidity meter, HCl (0.05 M).

2.1.2. Study Area

The Lung Ngoc Hoang Nature Reserve (LNHNR), Mua Xuan Agriculture Center (MXAC), and My Phuoc melaleuca forest (MPMF) were chosen as three case study areas. They can be seen in Figure 1.
The Lung Ngoc Hoang Nature Reserve (LNHNR) is a species habitat protection area with a total area of approximately 3000 ha, in which functional subdivisions include: a Strict Protection Zone (1000 ha), Ecological Restoration Zone (1000 ha), and Administrative Service Subdivision (400 ha). The LNHNR is a low-lying area located southwest of the Hau River that borders the Lai Hieu, Quan Lo, Xang Bo, and Xeo Xu canal systems. The MXAC has a total natural area of 1500 ha and is located in Tan Phuoc Hung Commune, Phung Hiep District, Hau Giang province. The MXAC’s hydrological regime is primarily influenced by the Quan Lo and Soc Trang canals. The MPMF is alluvial land located along the My Thanh River in My Phuoc commune, My Tu district, Soc Trang Province. The MPMF is located on a low plain with an elevation of only 0.2 m AMSL. The climate of the MPMF is mild in the sub-equatorial monsoon tropical region, and has an average temperature of 27 °C and total rainfall of 1100 mm. Due to the influence of tides, the water in the MPMF is typically salinized to a high degree during the dry season (from December to April).

2.2. Methodology

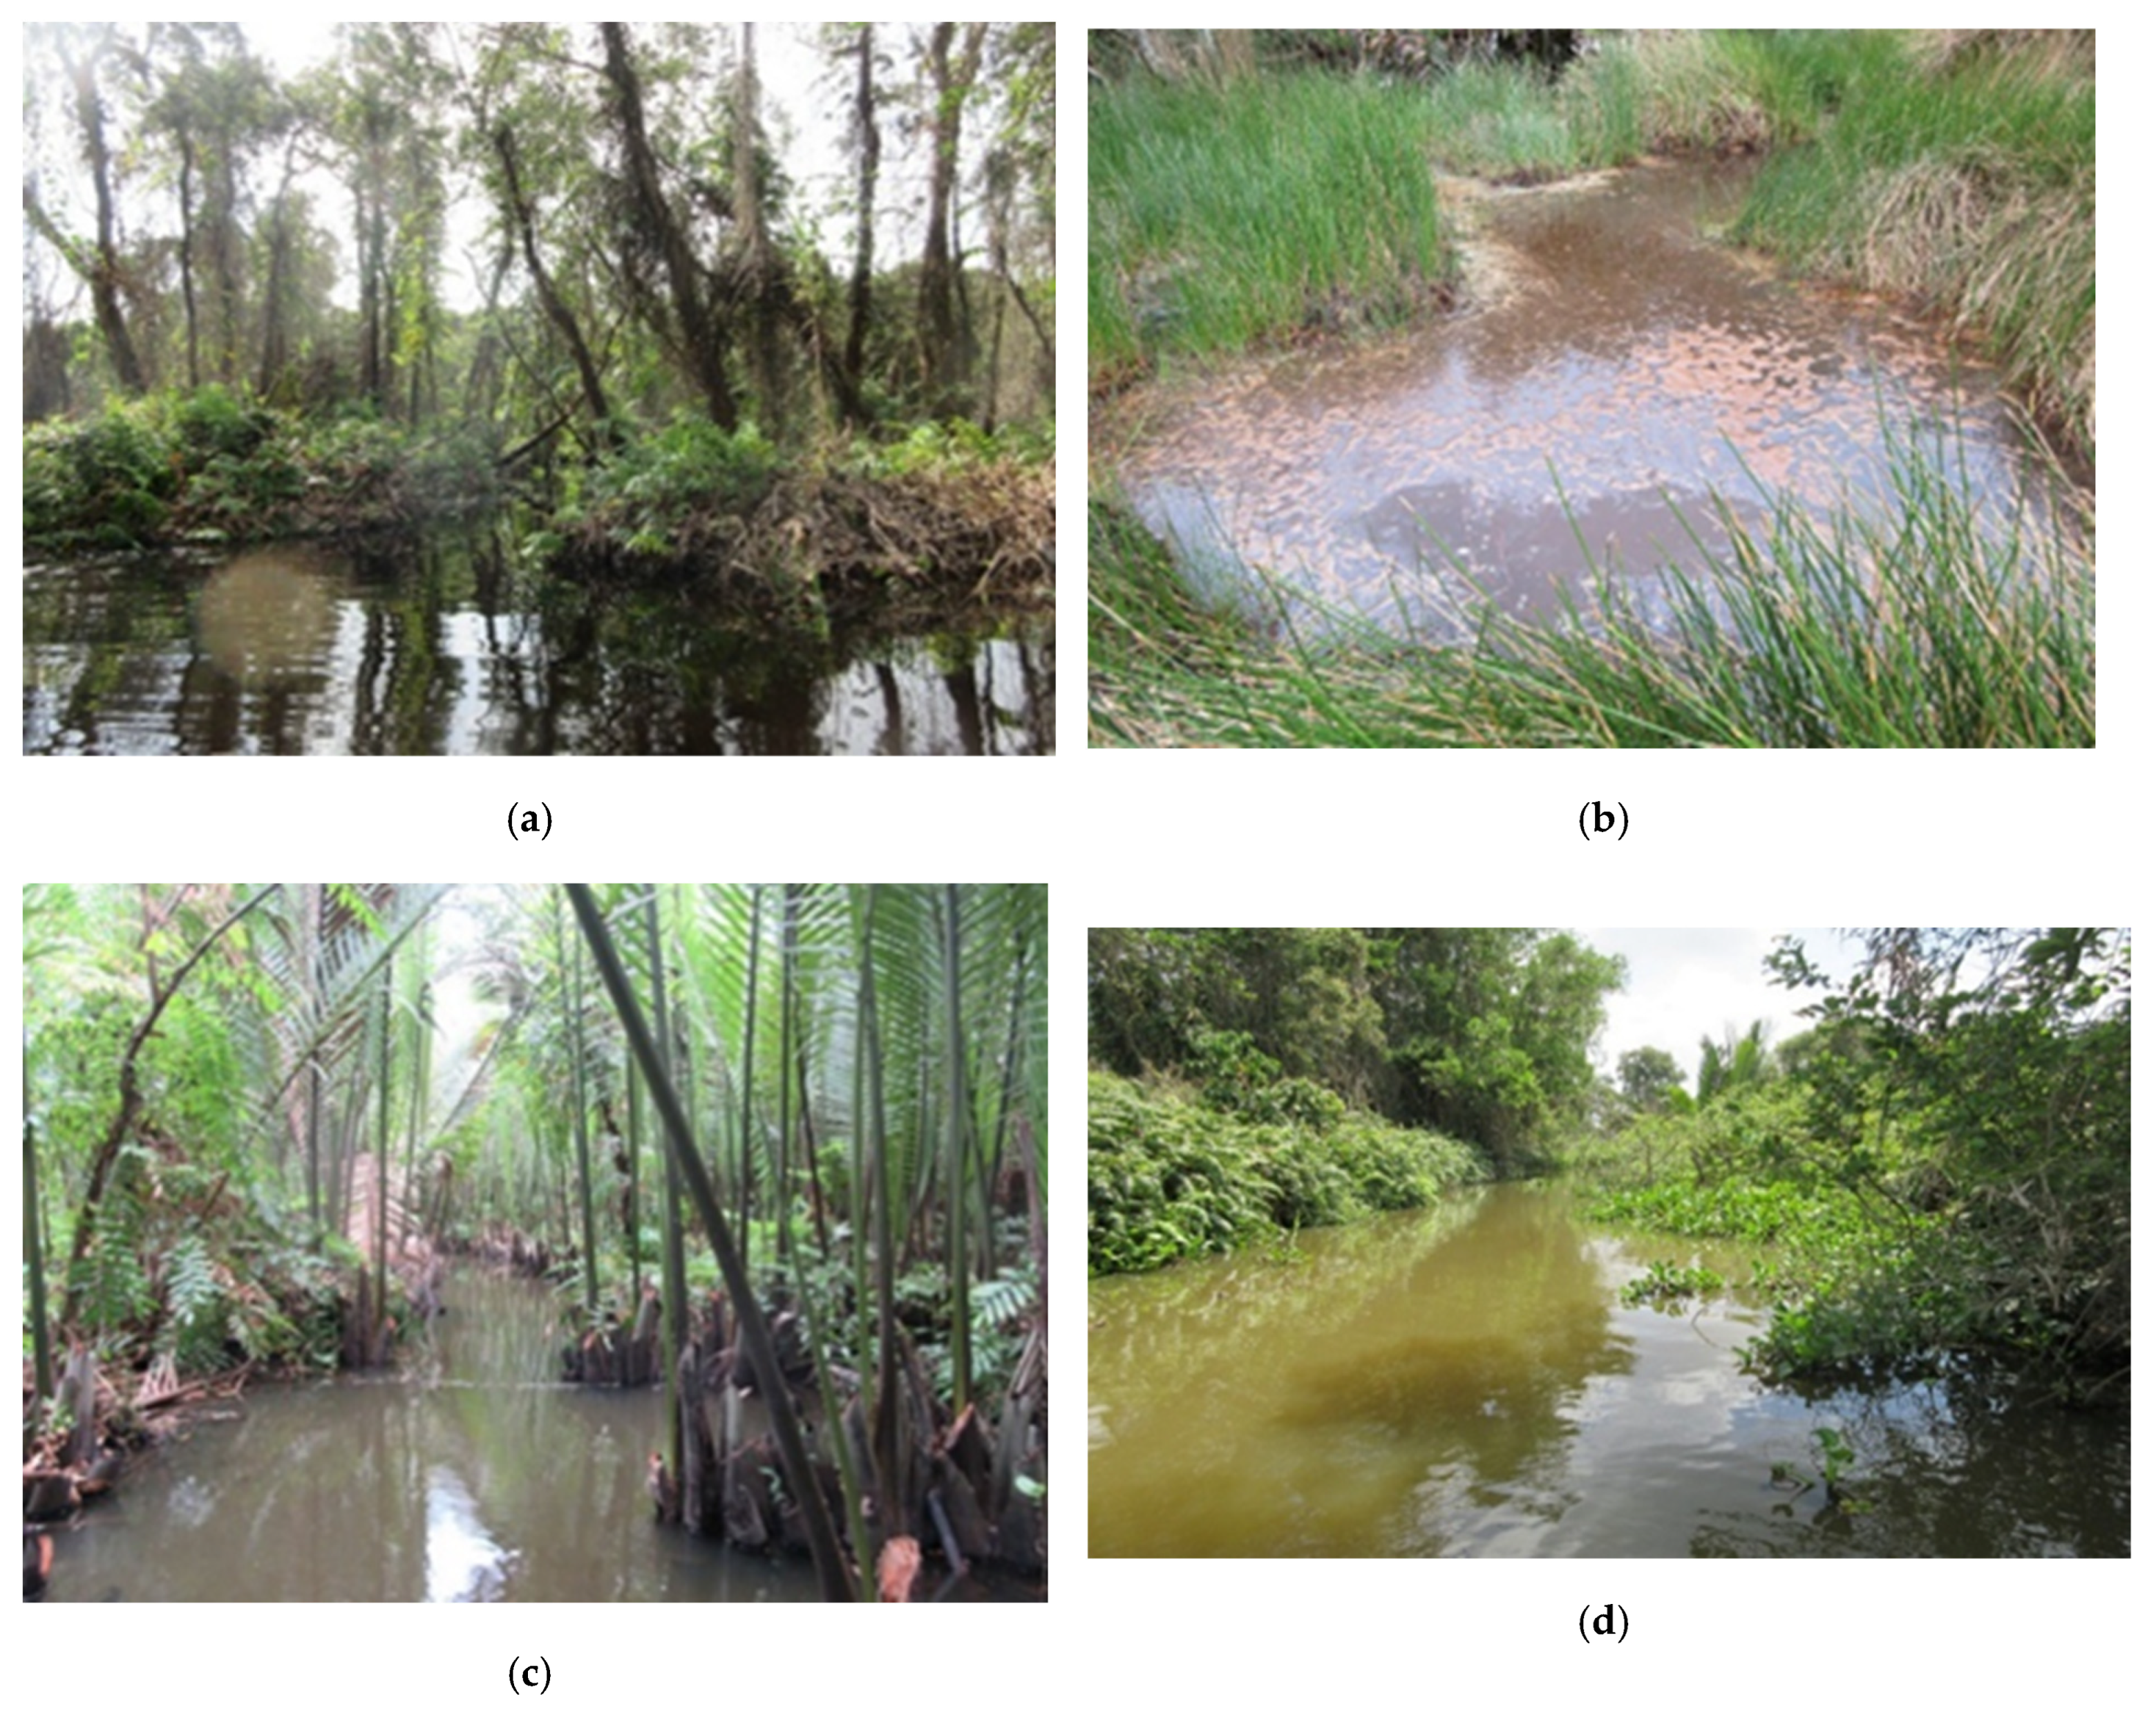
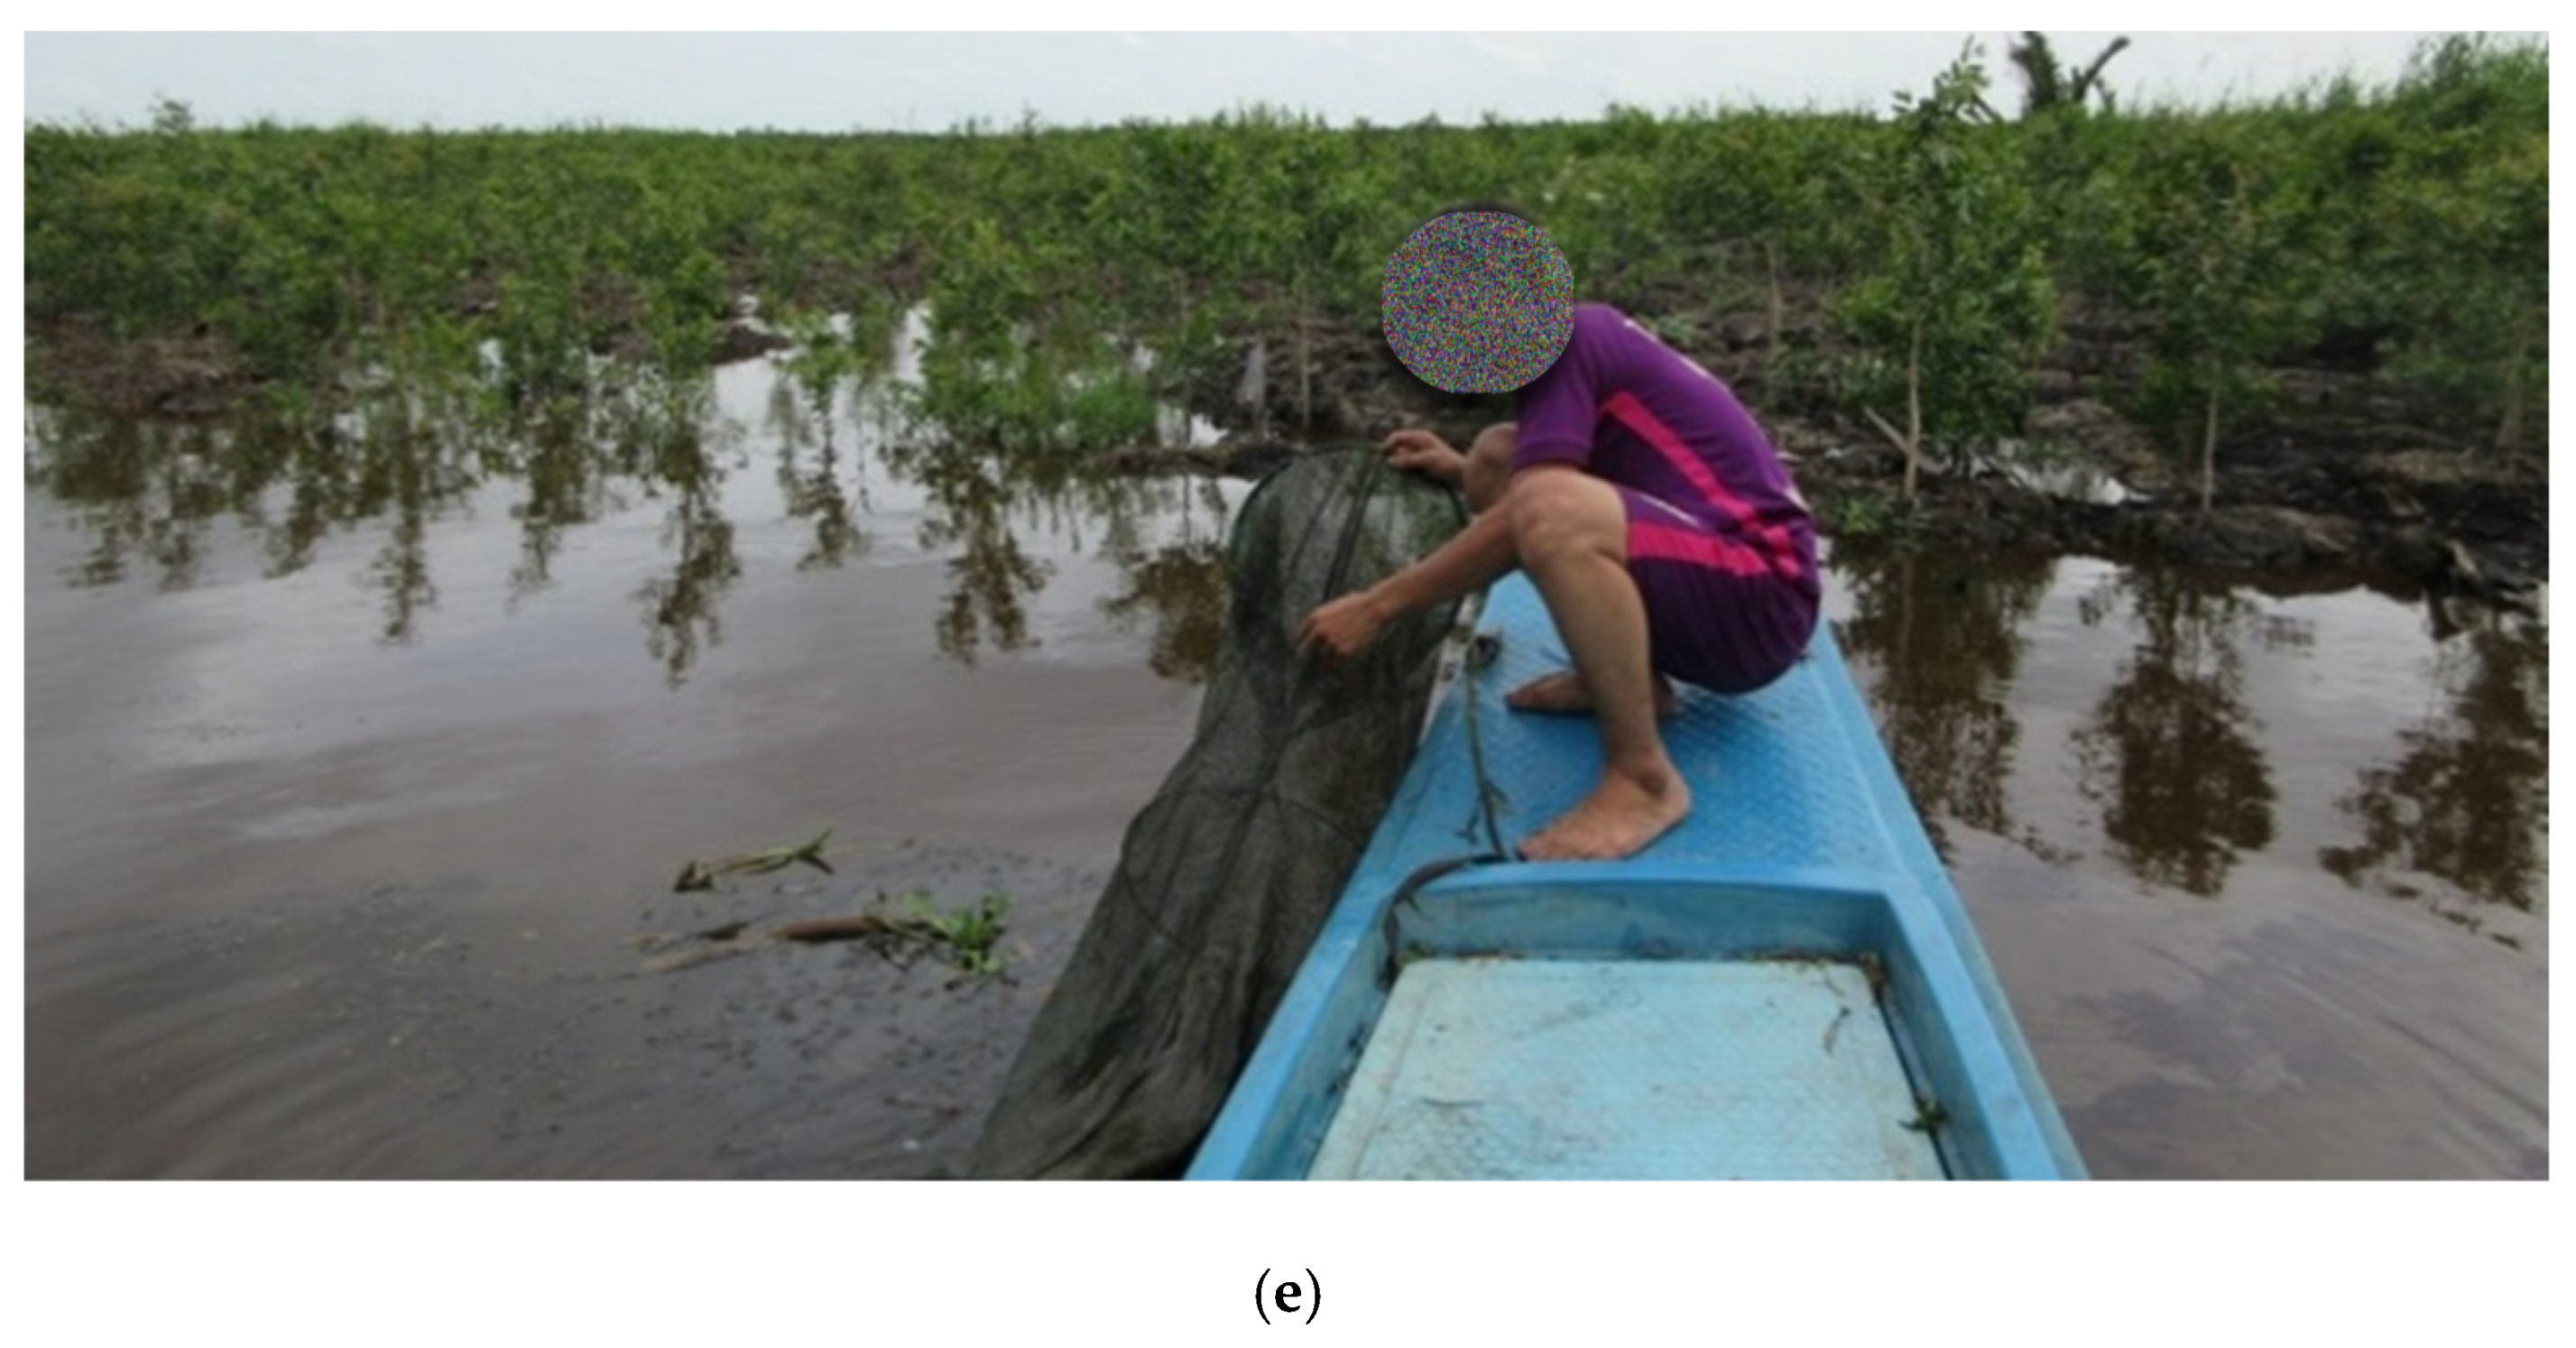
2.2.1. Water Sampling

Water samples were collected from 8, 14, and 28 different points from the LNHNR, MXAC, and MPMF respectively, distributed randomly across the NRs’ canal systems (Figure 1).
Prior to the sampling, 1000 mL capacity plastic bottles were soaked overnight in a solution of HCl (0.05 M), washed thoroughly the next day, and rinsed several times with distilled water before being sun-dried. Each water sample was collected at a depth of 20–30 cm in the canal from random and homogenous locations. Samples were collected twice/year, i.e., during the wet and dry seasons of the year 2016 (at LNHNR, MXAC) and 2018 (at MPMF). On-site measurements of temperature, DO, pH, and electrical conductivity were carried out using multi-probe meters [16,17,18]. The turbidity was determined via three sub-samples of 10 mL (the maximum capacity of the turbidimeter model Tub-430) within glass containers of different sizes and calculating the average of the three subsamples [19]. All samples that were not measured on-site were stored at 4 °C under laboratory conditions and analyzed within 24 h for parameters [20].

2.2.2. Data Collection

Random water sampling was done from various canal system locations and habitat types in the areas shown in Figure 2 and Figure 3. Table 1 additionally displays information about surface water sampling locations including their coordinates.
Primary data was collected from direct interviews through semi-structured questionnaires. In total, in the LNHNR, MXAC and MPMF 120, 105, and 200 households were interviewed, respectively). The targeted households were in hamlets adjacent to melaleuca forests. Other interviewees were from diverse fields, including local stakeholders such as authorities, forestry staff, and management staff of the NRs. Households participating in the interviews were randomly selected without classification of household economic conditions and occupations, and were divided into 6 groups: (1) rice-growers; (2) growers of other crops and breeders of livestock (or a combination); (3) inhabitants of the melaleuca forest; (4) non-agricultural service workers in agricultural product processing, trade, machinery repair, etc.; (5) staff with stable salary/jobs (local governance staff); and (6) irregular employees receiving daily wages. Comparison of before and after the construction of irrigation infrastructure was done to assess the impact of irrigation construction on livelihoods, water quality, and quality of irrigation construction. As a result, the study employed a closed-question structure to classify the impacts of dyke and sluice gates on livelihoods (based on the annual average income). The following terminologies were used to quantify the impact. (a) “Good” means that the interviewee’s family income increased compared to that before the irrigation construction; (b) “Not good/not bad” means that the interviewee’s family’s income did not change before and after irrigation construction; and (c) “Bad” means the interviewee’s family income further reduced compared to that before the construction of irrigation infrastructure; (d) “Clean” means water quality improved post-installation of irrigation infrastructures compared to that pre-installment; (e) “Pollution” means water quality deteriorated a bit after the installation; (f) “More pollution” means water quality deteriorated a lot after the infrastructure’s installation. Finally, in terms of the current water quality in the canal system, five different options, viz., “Very good”, “Good”, “Permissible”, “Not good”, and “No opinion” represented the different levels of consumers’ satisfaction.

2.3. Data Analysis

2.3.1. Descriptive Statistics Method

The collected surface water quality data from the LNHNR, MXAC, and MPMF were processed using Microsoft Excel software using descriptive statistics and WQI. Water quality parameters including temperature, pH, electrical conductivity (EC), and dissolved oxygen (DO) were measured directly on-site using handheld devices. Samples for chemical oxygen demand (COD), biological oxygen demand (BOD), total suspended solids (TSS), nitrogen nitrate (NO3 -N), and ammonium orthophosphate (PO43− -P) were collected, properly stored, and transported to the laboratory for the analysis using standard methods.

2.3.2. Water Quality Assessment

The index classifies water quality according to the degree of water purity by using the most commonly measured water quality variables; WQI was calculated to evaluate the suitability of water quality. Scientific communities have employed this approach extensively in water-related research works [2,21,22,23,24,25,26,27,28,29]. According to theory, WAWQI was calculated via the weightage of water quality parameters by the Equations (1)–(3) [2,7,22,23,24,25,26,27,28,29,30,31]; the rating of water quality according to WAWQI is given in Table 2 [29]:
Q i   =   [ ( V i V di ) ( S i V di ) ]   ×   100
W i   =   K S i   =   1 i = 1 n 1 / S i S i
WAWQI i   =   i = 1 n Q i   ×   W i i = 1 n W i
where Vi is the estimated value of ith parameter, Vdi is the ideal value of ith parameter in pure water (pH = 7 and all other parameters equal to zero), Si is the permissive standard of ith parameter, Wi is the weightage of ith parameter and K is a proportionality constant.
The WAWQI has the following merits: 1. it incorporates data from multiple water quality parameters into a mathematical equation that quantitively rates the health of a water body; 2. it also requires fewer parameters in comparison to all water quality parameters for particular uses; 3. it is useful for the communication of overall water quality information to concerned citizens and policy makers alike; 4. it reflects the composite influence of different parameters, i.e., those that are important in the assessment and management of water quality; 5. it describes the suitability of both surface and groundwater sources for human consumption.
The weighted arithmetic water quality index (WAWQI) was used as a standard indicator for classifying water quality status (Table 3).

3. Results and Discussions

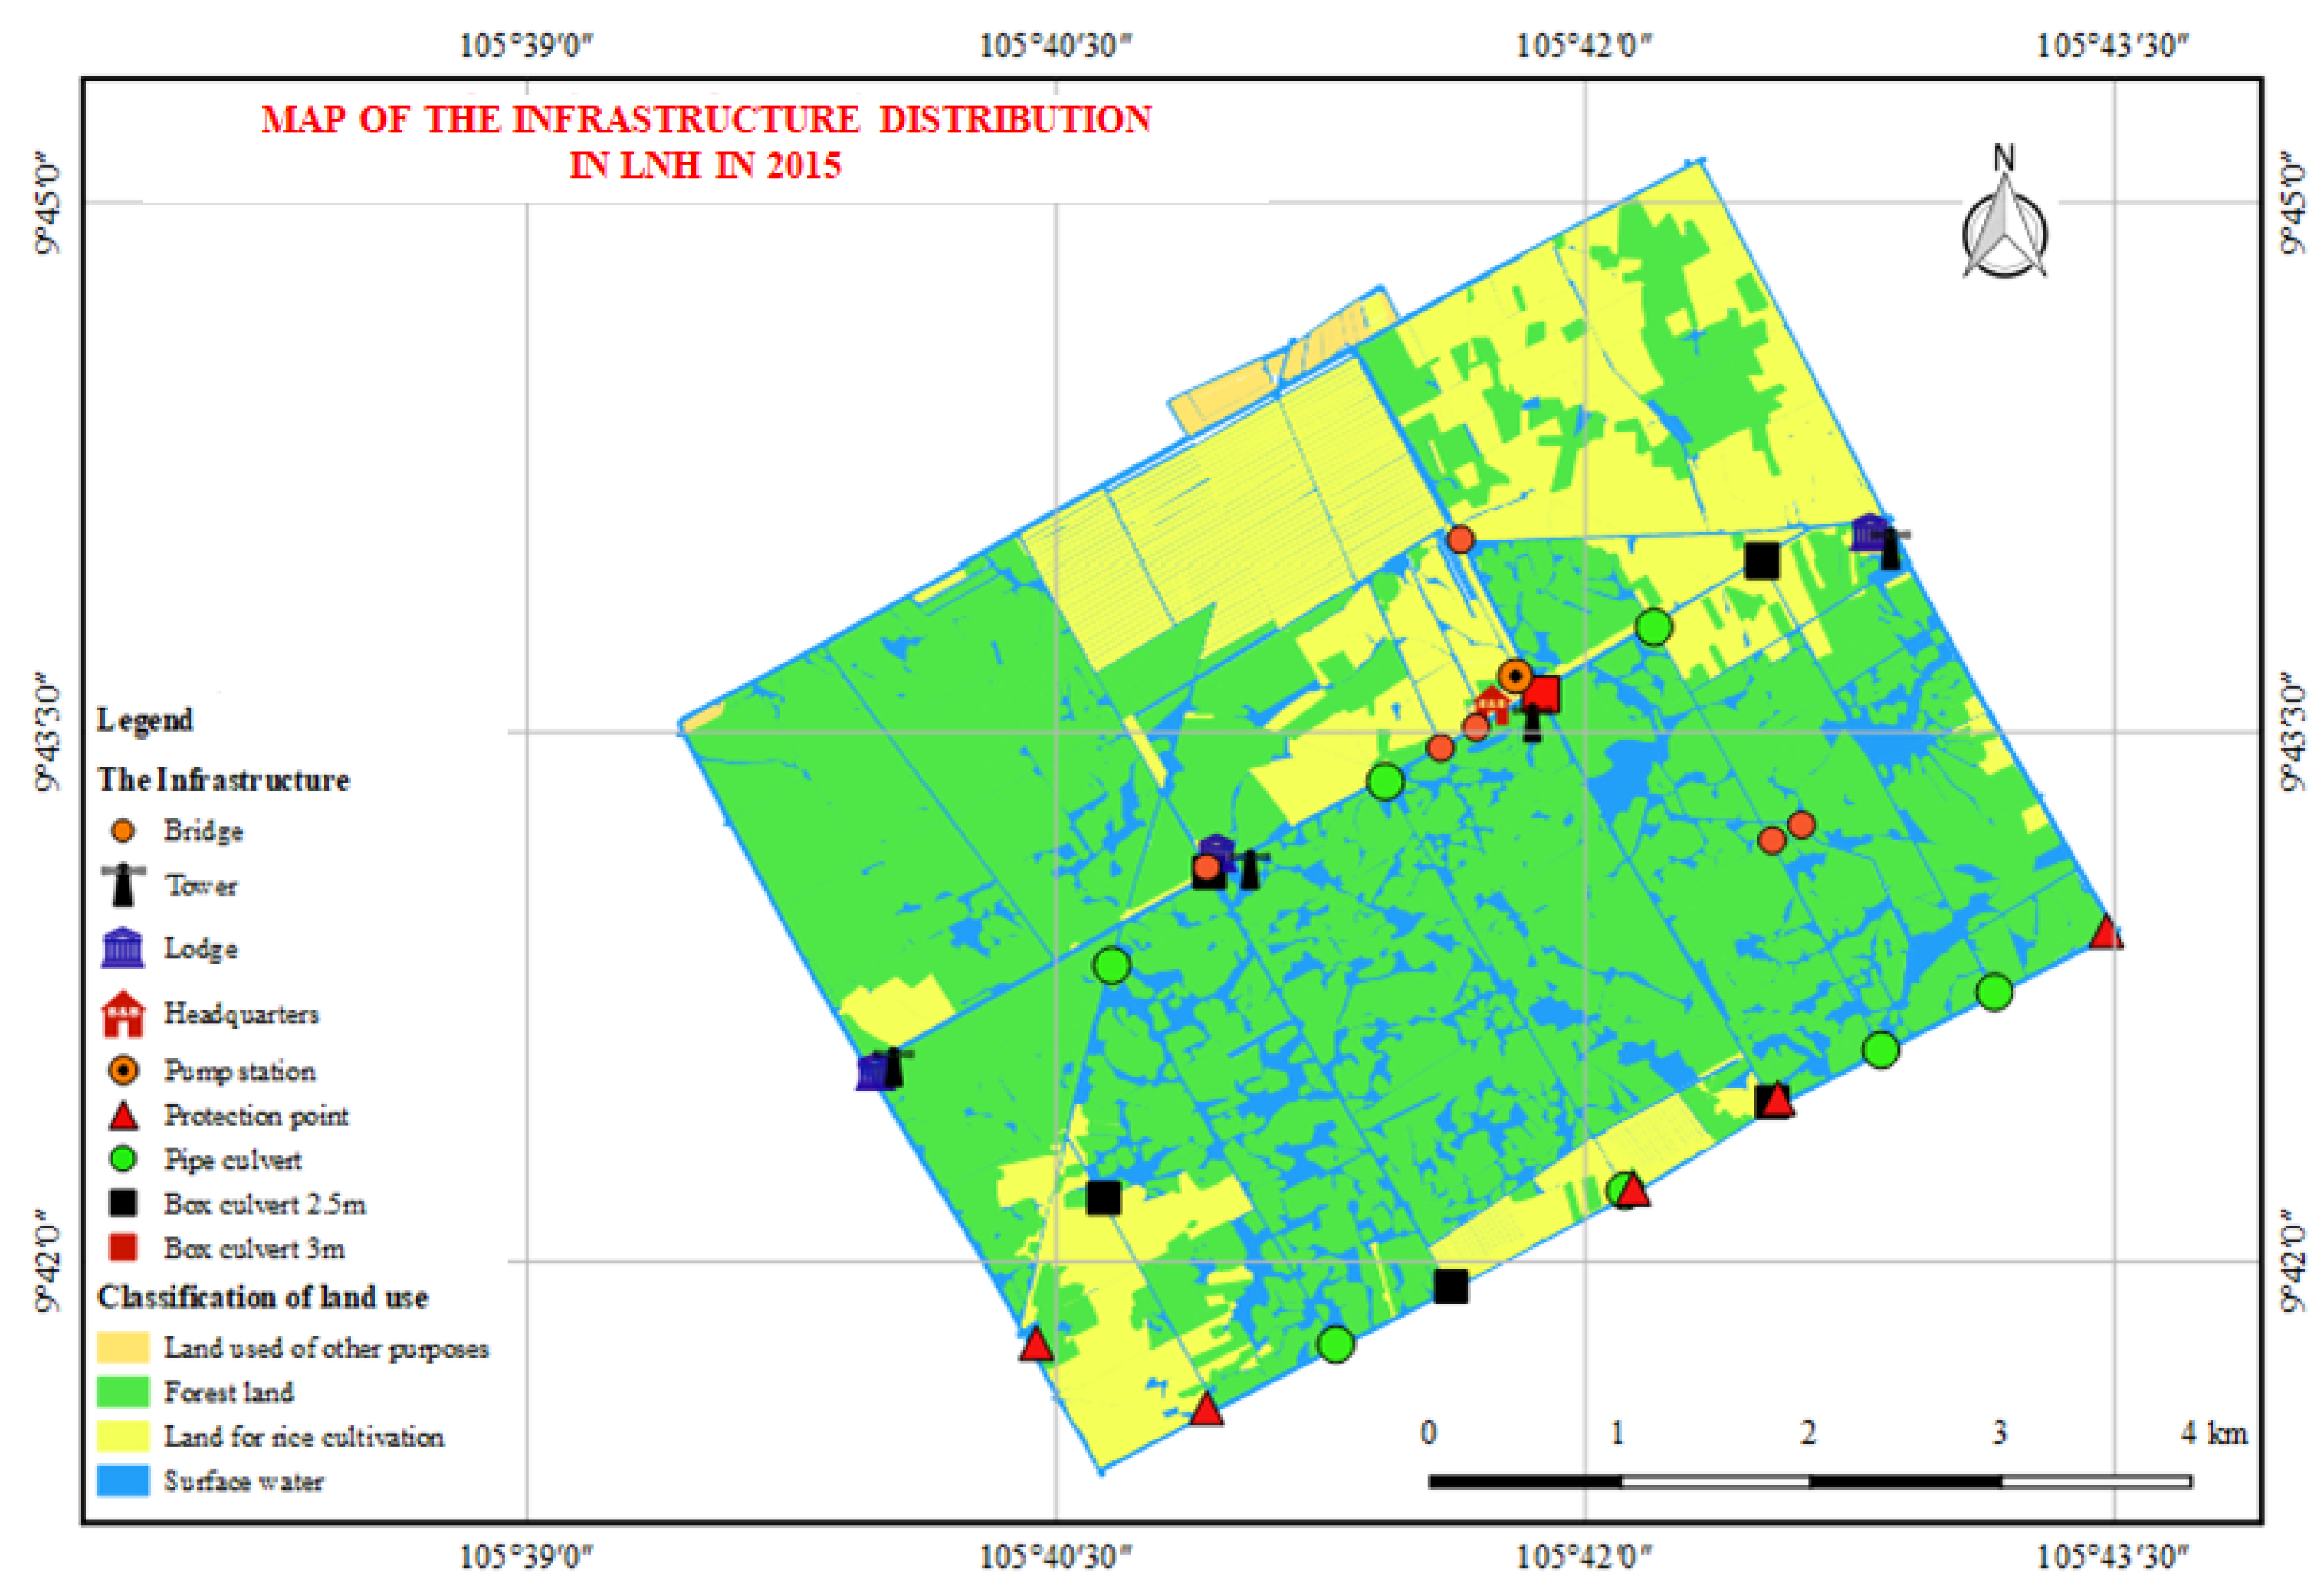
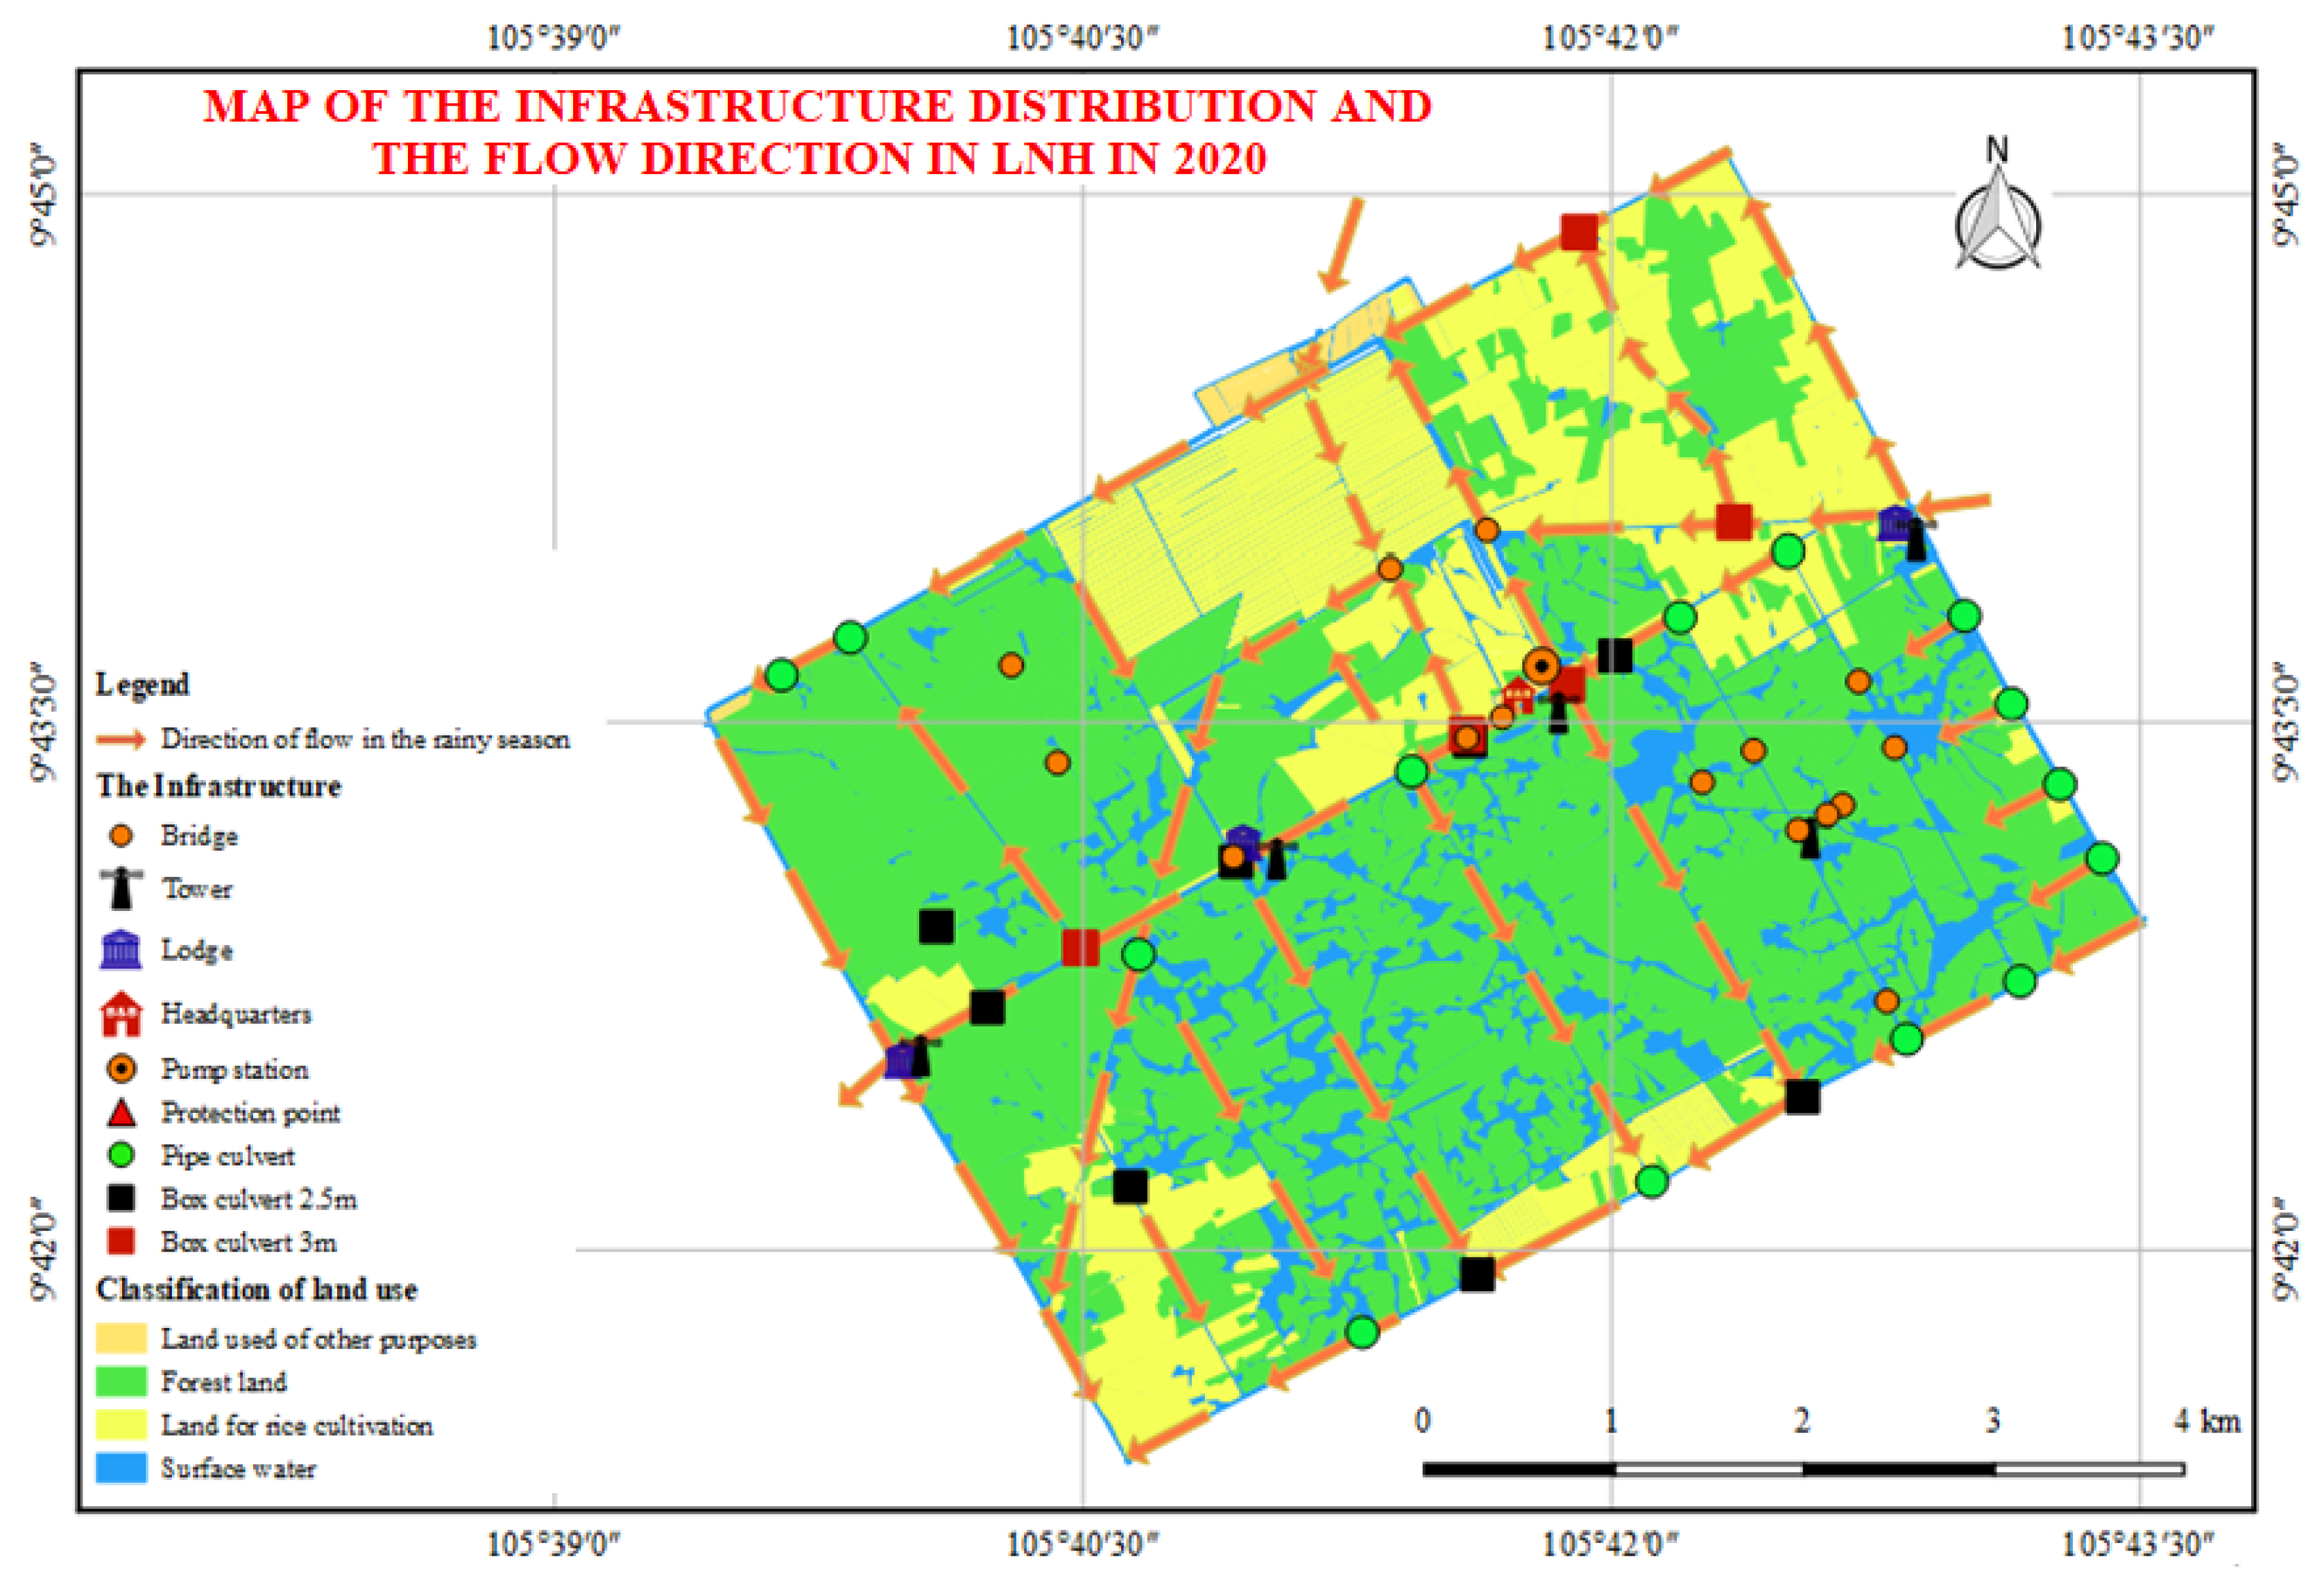
3.1. Hydrological Regime in LNHNR

Figure 4 and Figure 5 show the change in the infrastructure distribution and the flow directions in the LNHNR for the years 2015 and 2020, respectively. It can be seen that increased infrastructure in the year 2020, such as bridges, sluices, and pumping stations, were built for regulating, exchanging, and supplying water to the LNHNR. The construction of infrastructure was considered to have a positive impact on the surrounding community by 48.39% of interviewee respondents (Figure 6). However, 6.45% disagreed, mentioning that sluices were closed to store water for the fire protection work in the dry season, resulting in a lack of water for farming and aquaculture. Moreover, the lack of water also affected the quality of water sources in the LNHNR, which was evaluated sensorily by people living in the LNHNR as summarized in Figure 7. This is because the closed sluices in the dry season could restrict the flow out to the LNHNR, resulting in no exchange of water inside and outside the LNHNR, affecting both the quality and quantity of the water. Additionally, the biological decomposition of plants contributed to a decrease in the water quality, causing a black color at the end of the dry season.
The hydrological regime in the LNHNR is influenced by the diurnal and semi-diurnal tides of the West Sea and East Seas. The Cai Con and Cai Lon-Cai Be rivers in the East and West Sea, respectively, as well as well-planned canals, provide adequate water to the LNHNR. Figure 8 presents the current status of the canal system based on the assessments of people living in the LNHNR, in which 61% of respondents rated it good or very good, while 26% rated it permissible and 10% rated it not good.

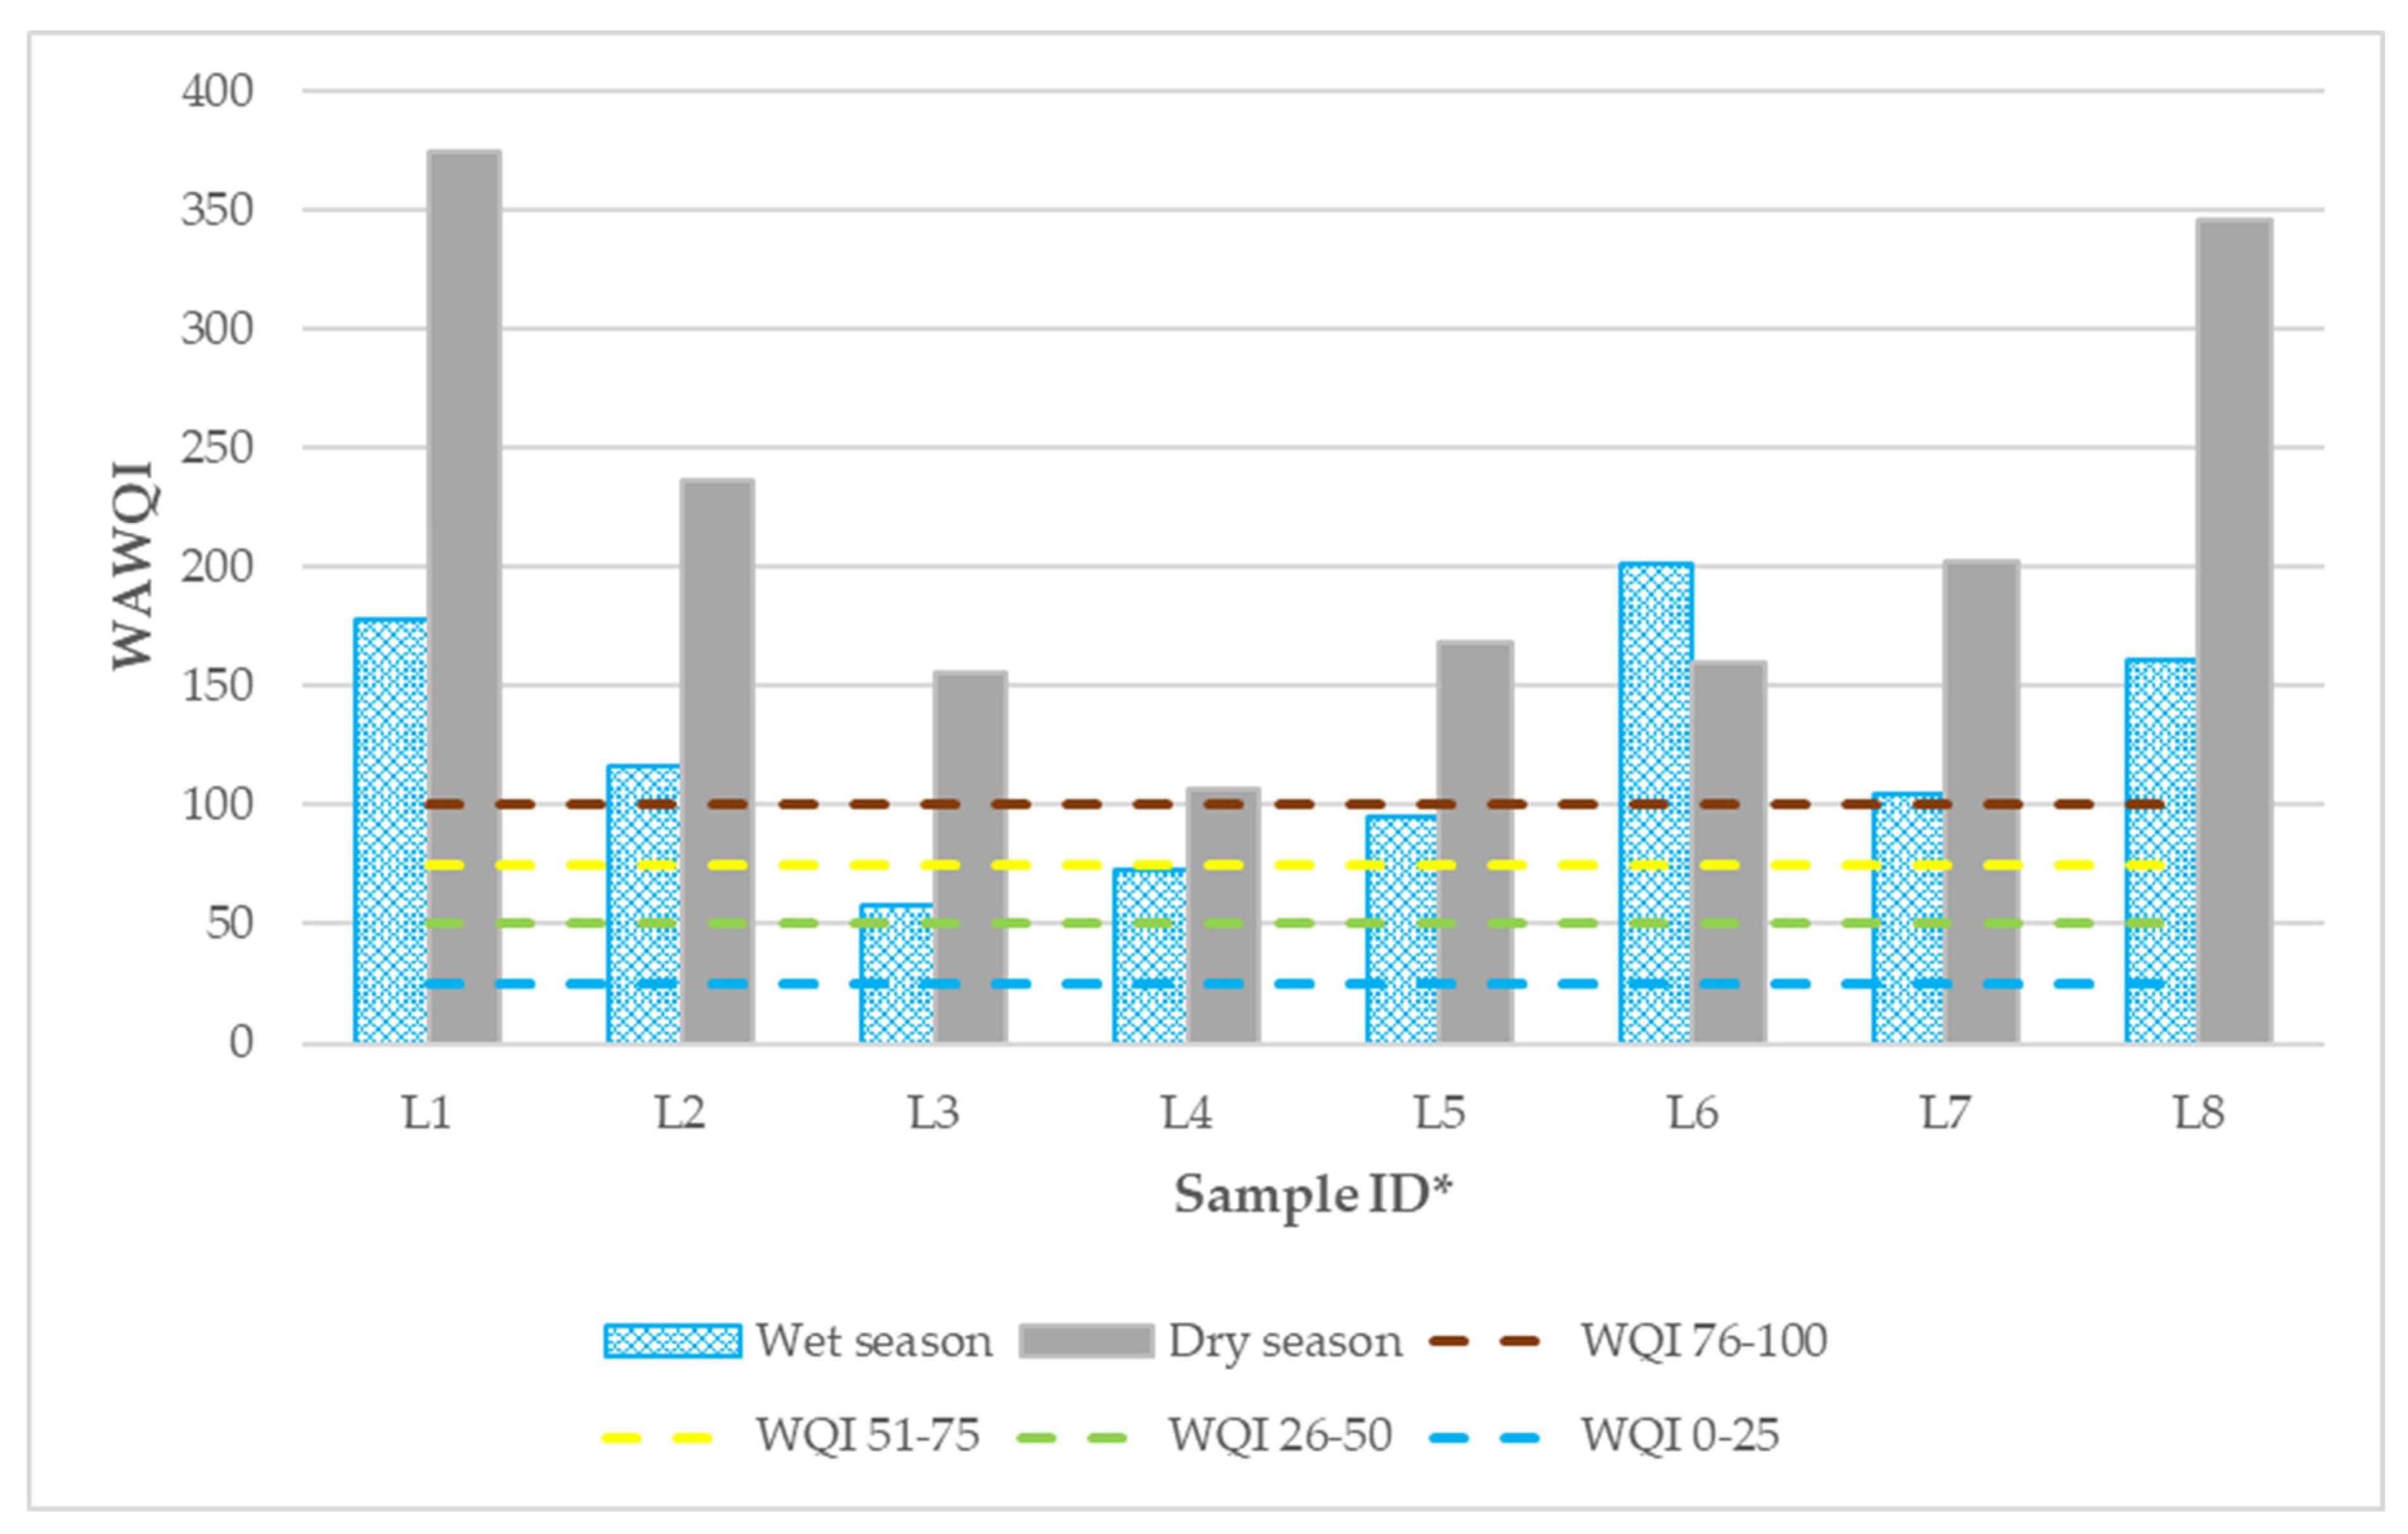
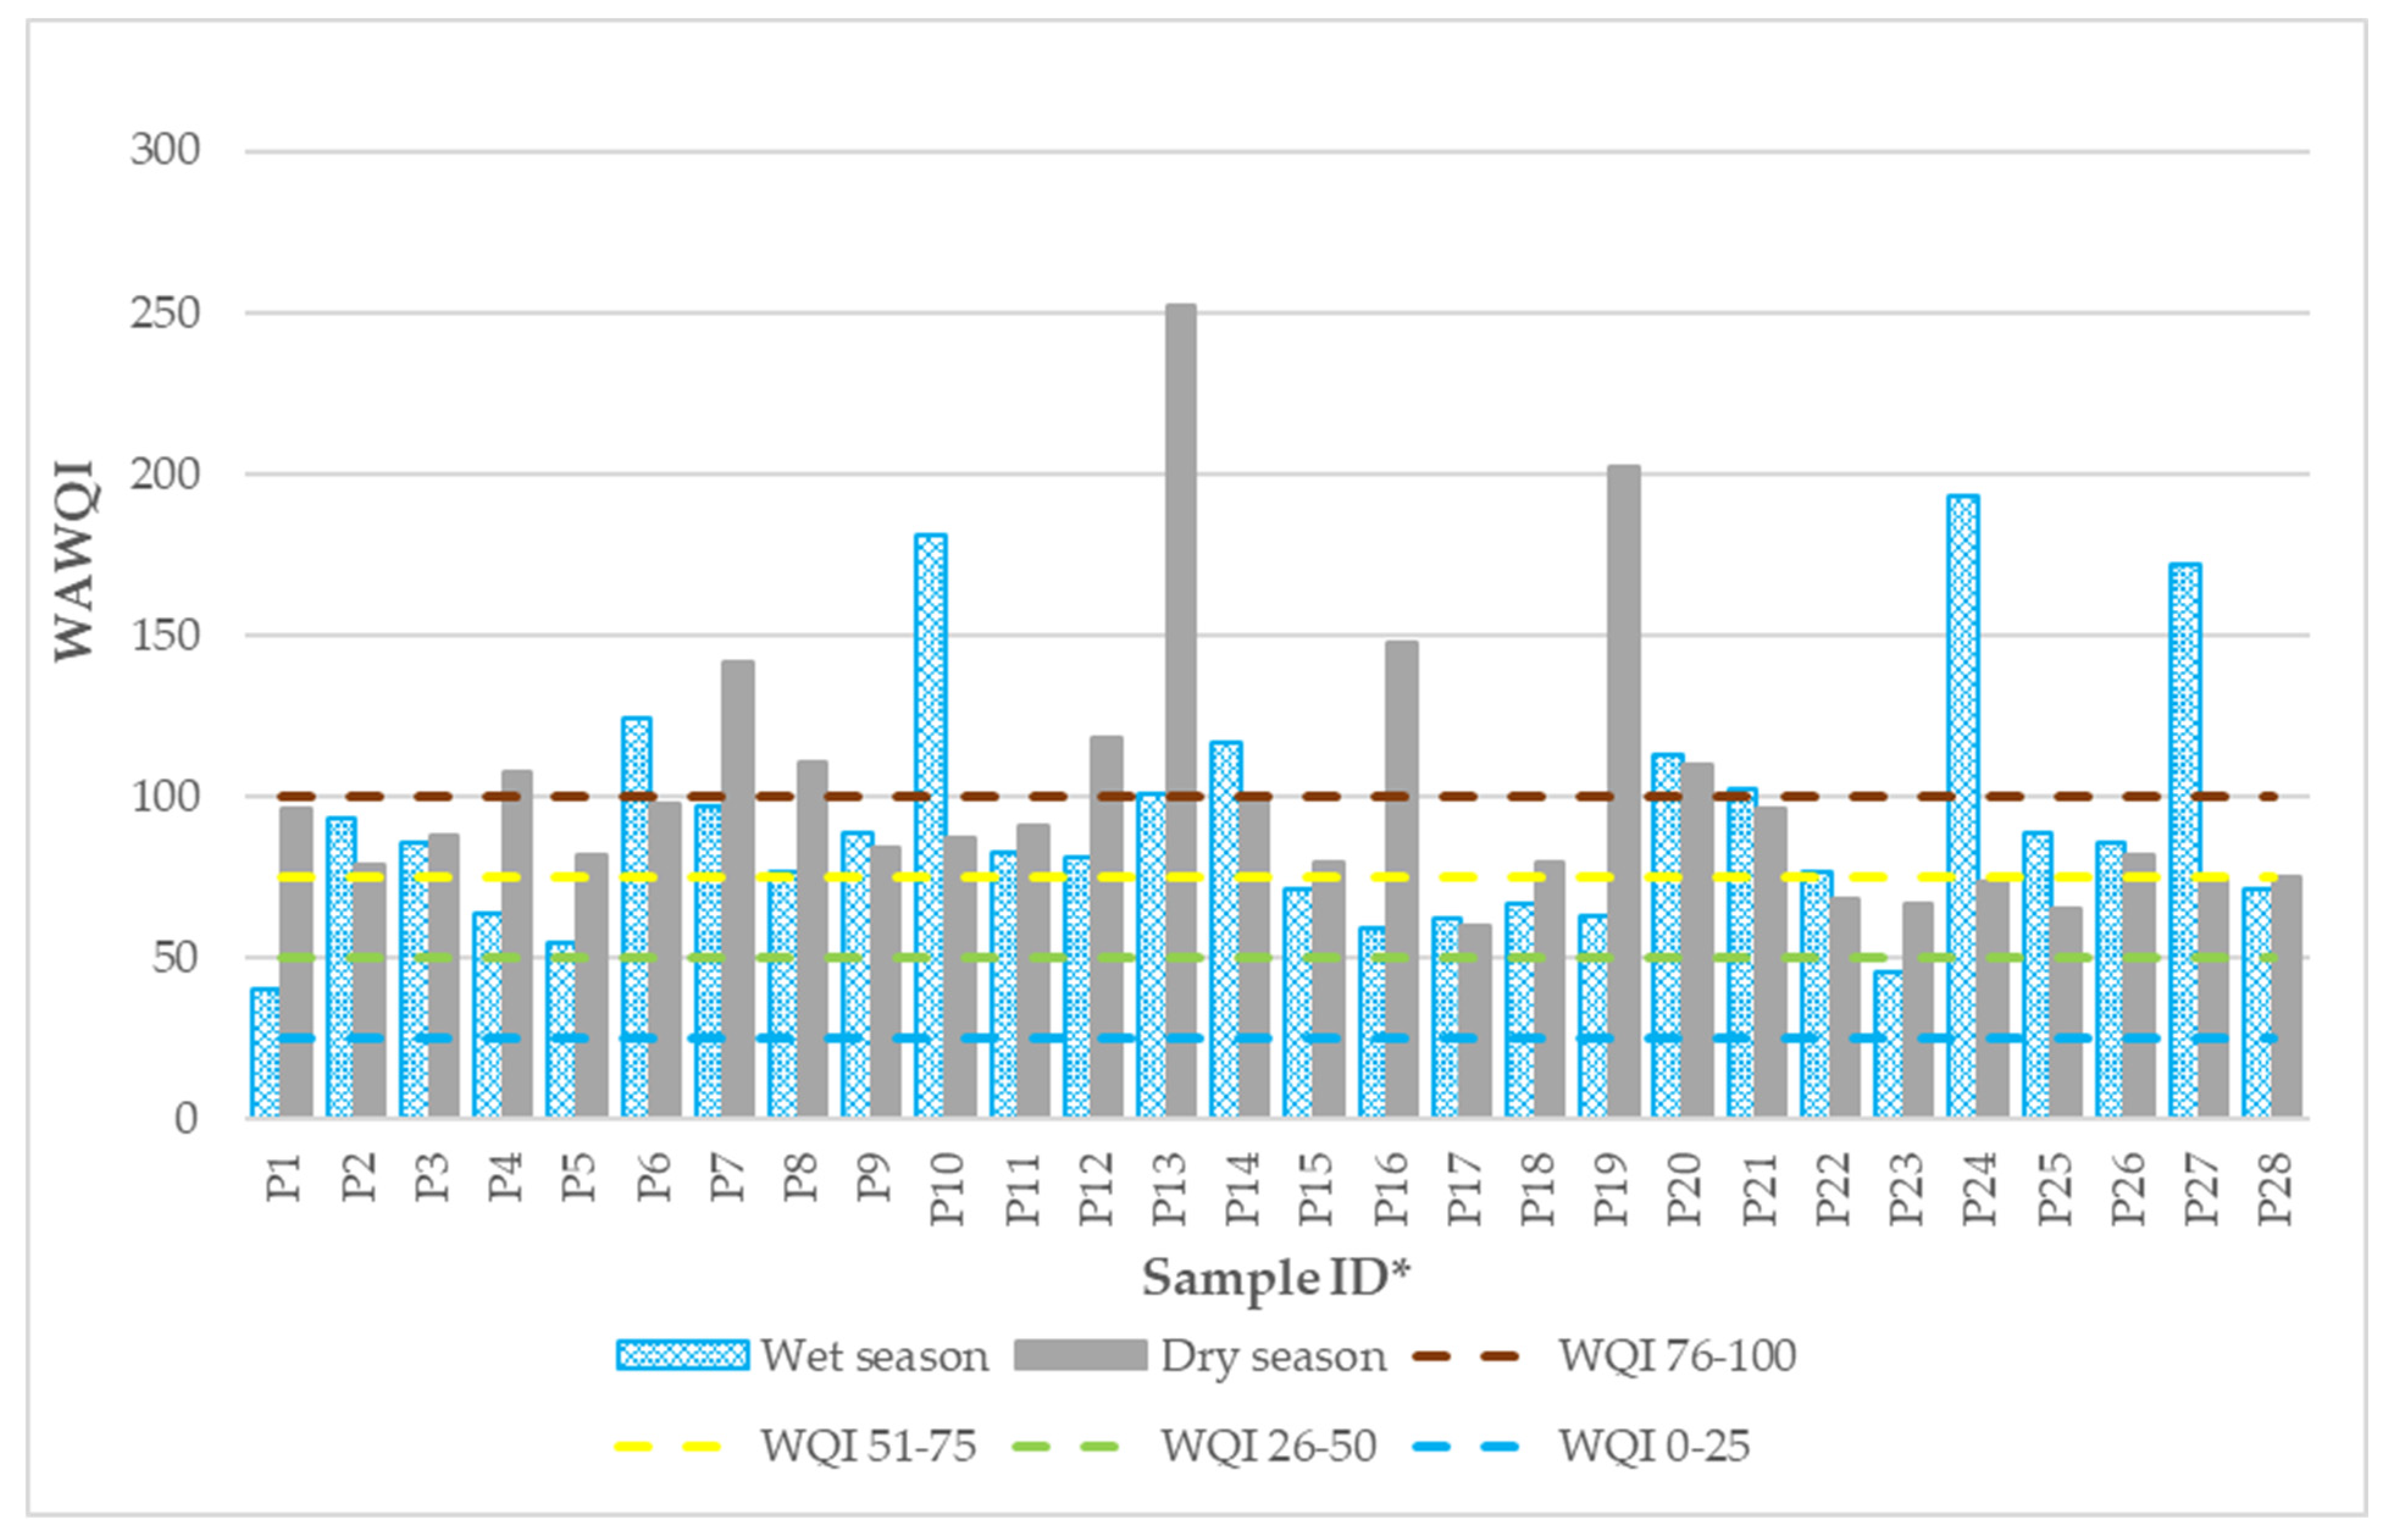
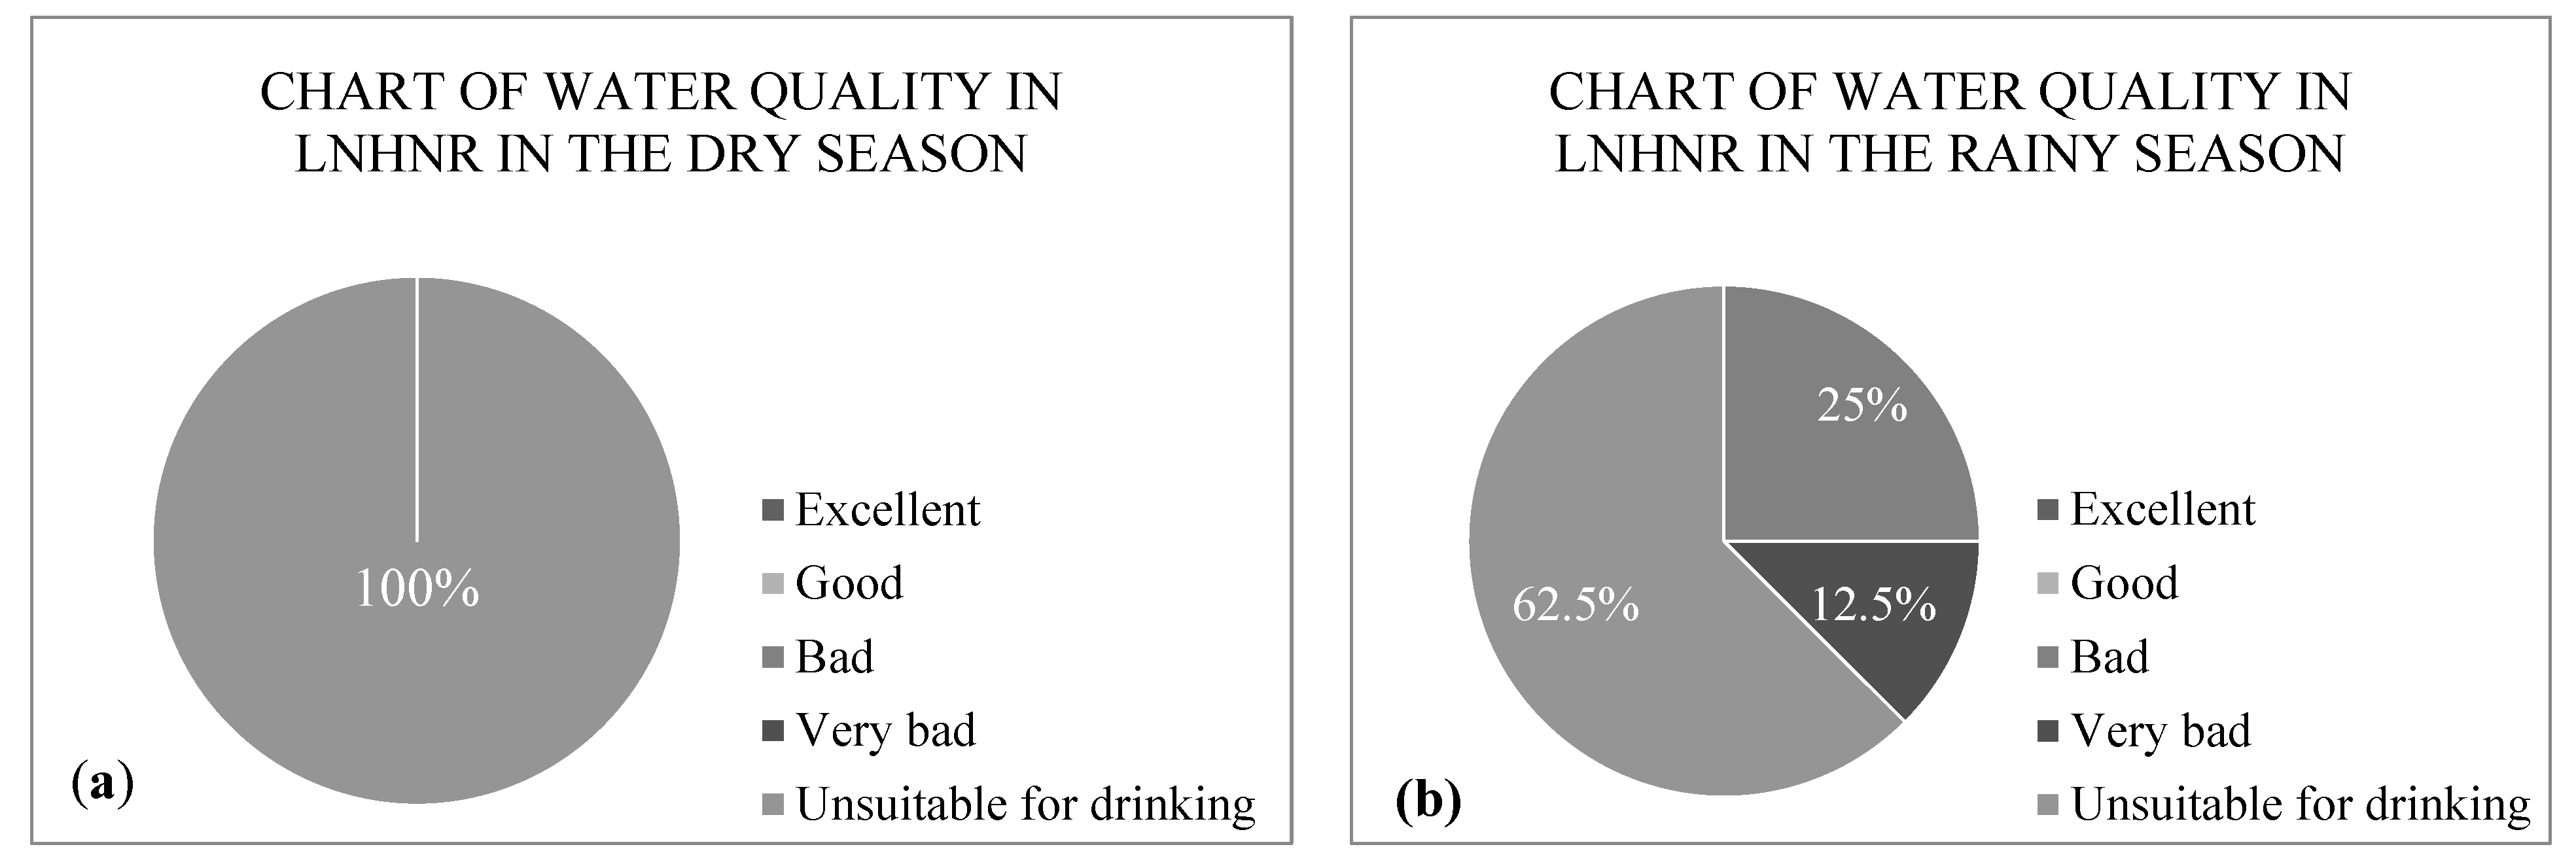
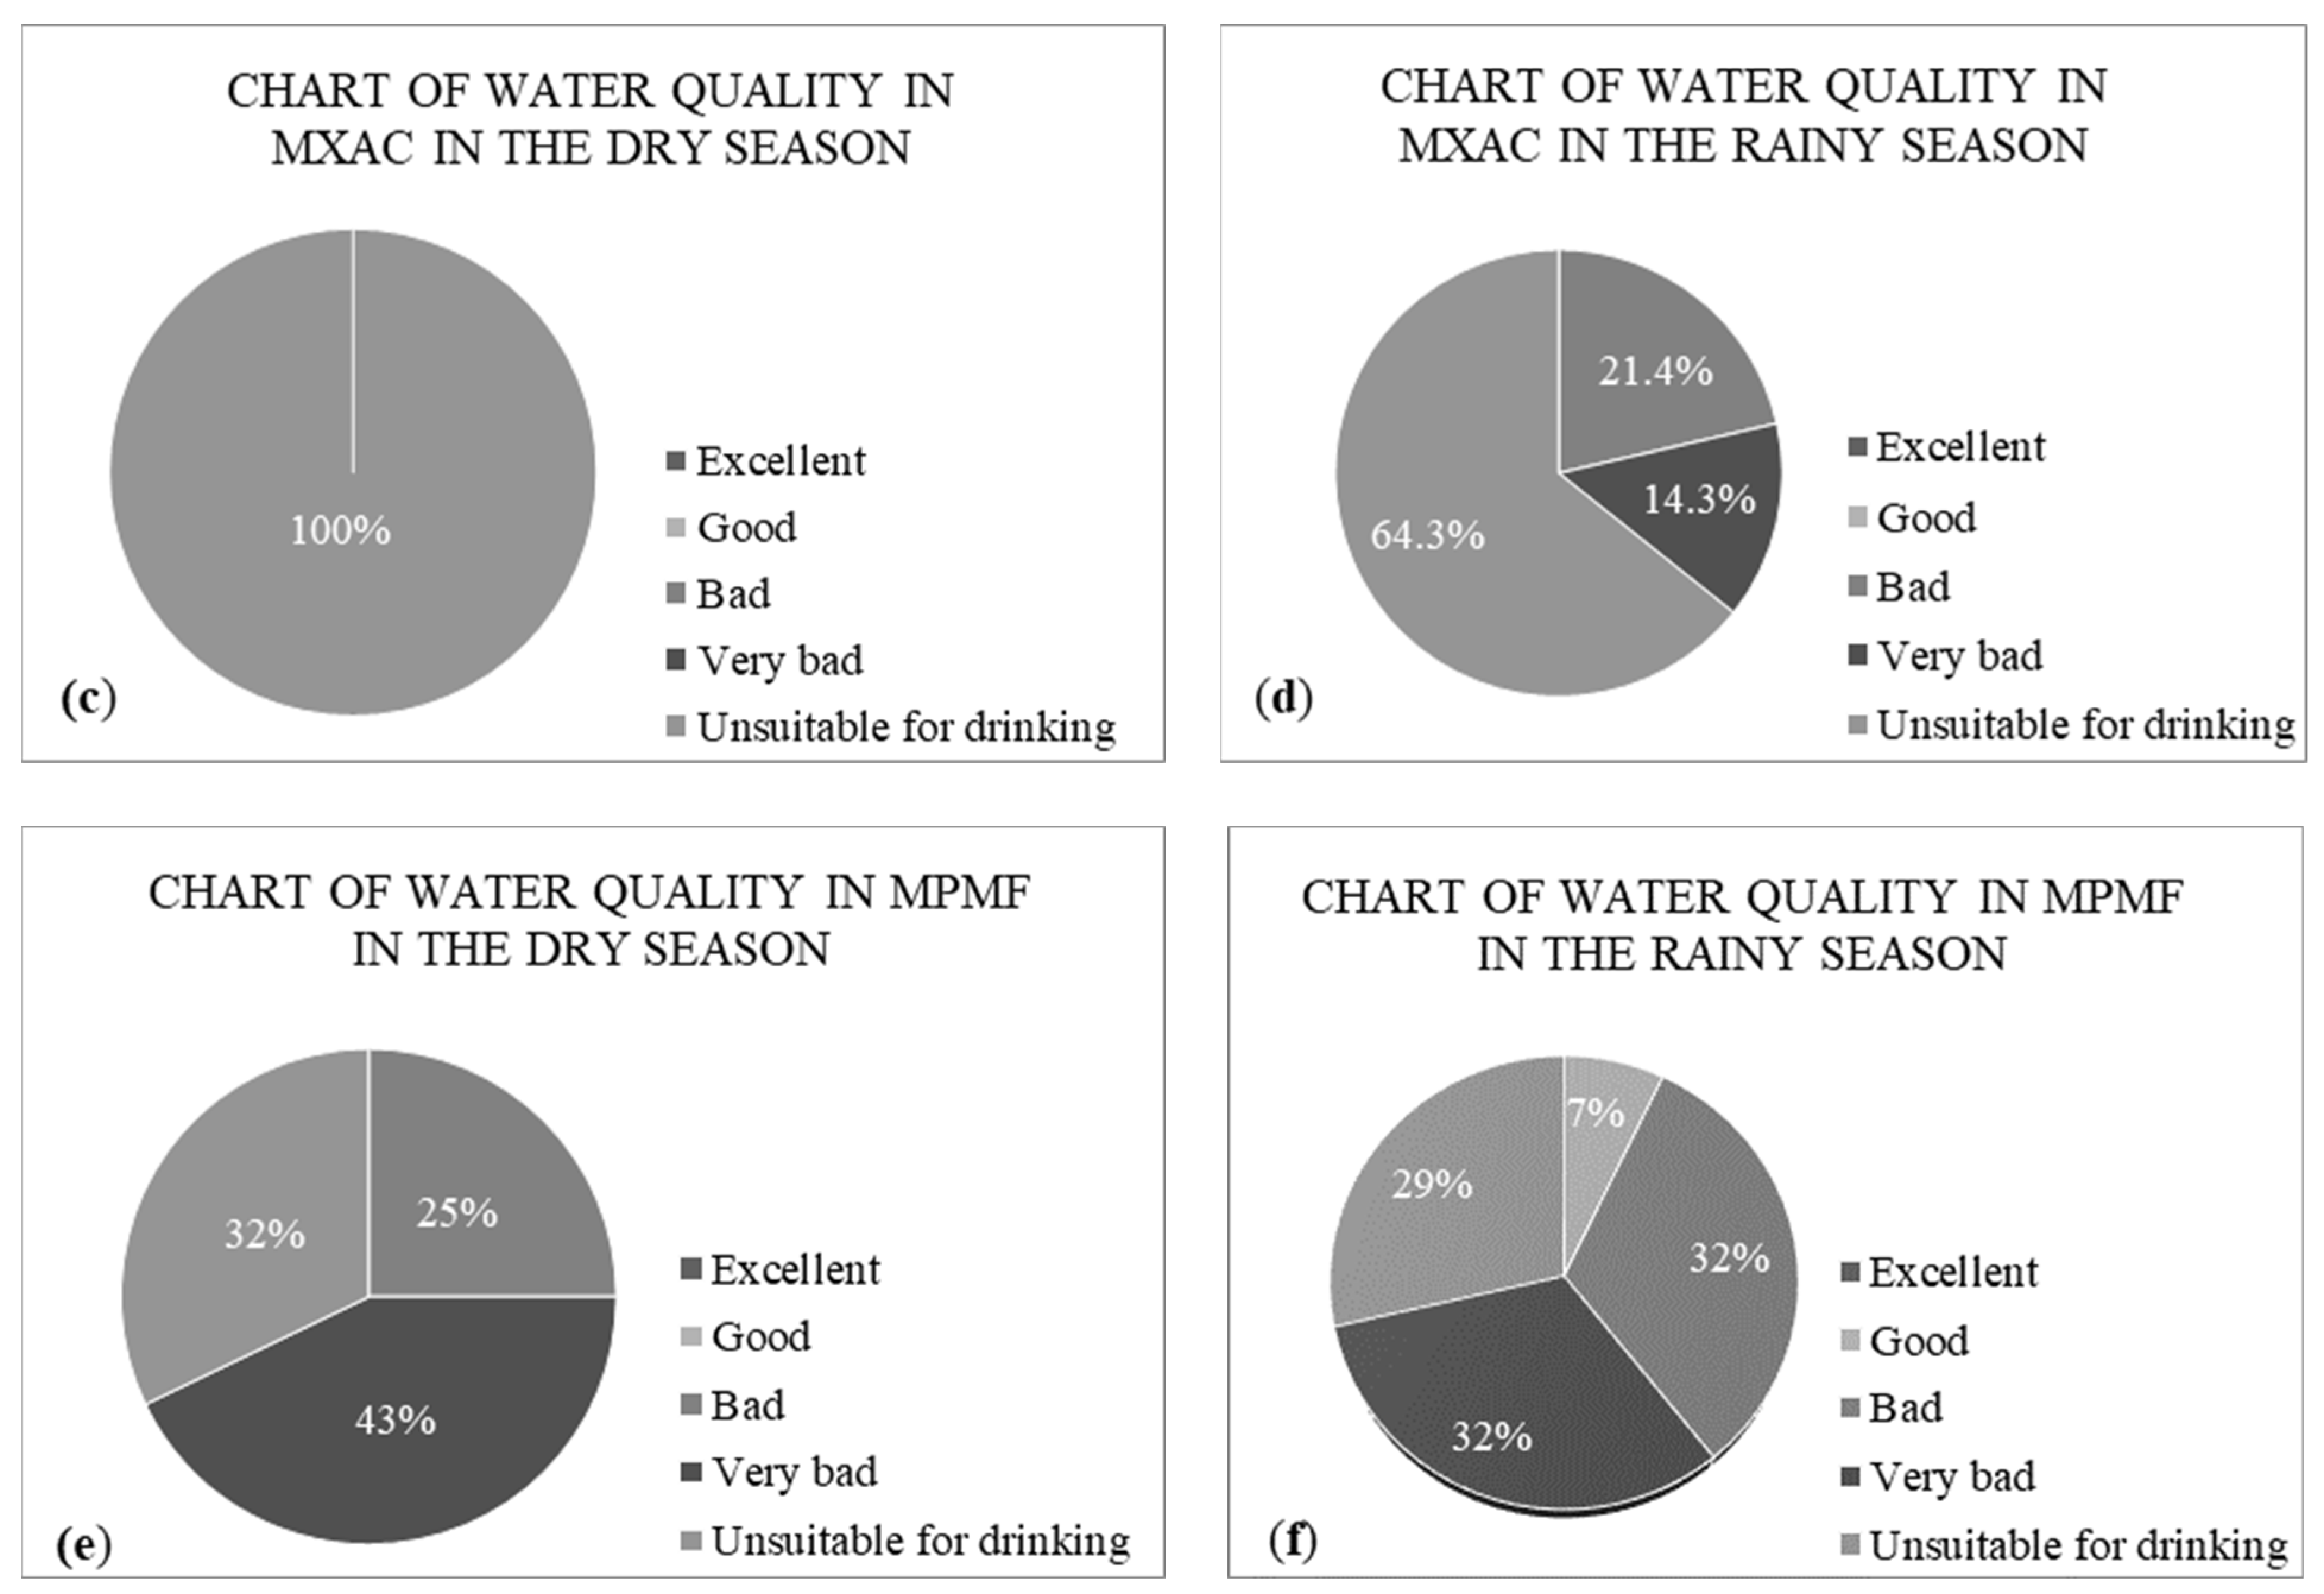
3.2. Weighted Arithmetic Water Quality Index

According to the calculations, the WAWQI value in 2016 showed a discrepancy between ranks. Water quality index readings at locations ranged from 58 (L3) to 201 (L6) during the wet season, and from 107 (L4 point) to 375 (L1 point) during the dry season (Table 4 and Table 5 and Figure 9).
During the dry season, the WAWQI water quality levels highlight an extremely polluted status (WAWQI ≥ 100). By contrast, the WAWQI values in the rainy season ranged from 58, 73, to 95, corresponding to light and moderate pollution levels, respectively. Although the remaining values remain at heavy pollution levels, their values are still lower than those in the dry season. The water quality index in L3, L4, and L5 sample locations were lower than those in other locations, because those sites are located in the core zone of the melaleuca forest, far from residential areas. In the dry season, the WAWQI index in L1 and L8 was above 300, owing to high phosphate P-PO43− (0.39 mg/L and 0.36 mg/L) concentrations of 3.5–4 times the standard (0.1 mg/L). This can be explained by the fact that point L1 was a small canal area where the flow was close to stagnant, leaving plant residues, whereas position L8 was in a densely populated area where the surface water contained a lot of phosphate from household waste. Most of the indicators at the survey sites were below the acceptable national standards, such as a high EC (264.67–323 S.cm−1), the DO indicator below standard (≥6.0 mg/L), the COD indicator at only one qualified position (L7), the BOD5 indicator exceeding the standard by 1.09–2.93 times, and the P-PO43− indicator exceeding the standard by 1.1–3.9 times. The results clearly show that the NRs’ surface water quality was polluted throughout both the wet and dry seasons.
Table 6 and Table 7 and Figure 10 show the calculation of WAWQI values in the MXAC. It should be noted that the WAWQI values ranged from 134 (T11) to 7344 (T10) in the dry season to roughly 82 (T11) to 272 (T13) in the wet season.
The WAWQI values at all sampling points indicate heavy pollution (WAWQI ≥ 100) during the dry season. During the wet season, the WAWQI values at locations T5, T6, and T7 were 68, 70, and 65, respectively, indicating light pollution levels, whereas location T14 had an average pollution level of 81. The rest of the locations were taken as extremely polluted, showing WAWQI values ranging from 103–221, but still less so than during the dry season. There were very high WAWQI values above 5000 at sites T6 and T13 due to a very high concentration of phosphorus P-PO4 (9.01 and 9.2 mg/L), which is more than 90 times higher than the standard (0.1 milligrams per liter). The T6 site can be explained as an aqueous environment. The majority of the locations were polluted due to a number of unsatisfactory criteria, including a high EC (191–584 S.cm−1), low DO content (≥6 mg/L) with only one site at the standard position (7.5 mg/L), COD levels exceeding the standard by 1.7–17 times, the BOD5 criterion exceeding the standard by 1.23–37 times, and the P-PO43− criterion exceeding the standard by 1.3–92 times. As a result, the results of the WAWQI analyses in the heavy pollution classification range are reliable.
The WAWQI values at the MPMF are shown in Table 8 and Table 9 and Figure 11, which range from 60 (P17) to 252 (P13) in the dry season and around 404 (P1) to 193 (P24) in the wet season.
During the dry season, 25% (7 locations) of WAWQI water quality values were in the moderately polluted range, 43% (12 locations) were in the average pollution range, and 32% (9 locations) were in the seriously polluted range (≥100). In the dry season, the greatest WAWQI values were found at positions P13 and P19, which were caused by a low dissolved oxygen index below the acceptable threshold and a relatively high concentration of phosphorus P-PO43 (0.3 and 0.25 mg/L, respectively) three times that of the norm (0.1 mg/L). This can be explained by the presence of several plant remains in the P13 and P19 locations, which had decomposed or were in the process of decomposition. The water quality was better in the wet season, with 7% (2 sites) having an acceptable quality; equal numbers containing light and medium pollution, accounting for 32% of the total number (9 sites for each); and 28% (8 sites) being severely contaminated. In the wet season, the WAWQI was highest at positions P24, P27, and P10, which was due to low DO contents below the standard level by 8.5 to 10.3 times, very high EC indicator values of 1414 and 1432 S.cm−1, and high N-NH4+ contents at 1883 and 1514 mg/L at P24 and P27, respectively.
The percentages of water quality levels according to the WAWQI in the wet and dry seasons in the NRs can be seen in Figure 12. During the dry season, the WAWQI in the LNHNR and MXAC was clearly in the heavy pollution category (100). During the wet season, the water quality improved slightly; 25% of sites contained slight pollution, and 12.5% and 62.5% contained heavy pollution in the LNHNR, while pollution and heavy pollution levels in the MXAC were 21.4%, 14.3%, and 64.3%, respectively. The main reason is that the concentrations of parameters such as EC, COD, BOD5, and P-PO43− were higher than the standard. Due to the low concentrations of EC and COD, the WAWQI at the MPMF (Figure 10e) in the dry season was in 25% of sites at little pollution, 43% at moderate pollution, and 32% at heavy pollution levels. Similarly, during the wet season, pollution in the MPMF decreased progressively, with 7%, 32%, 32%, and 29% having good, slight pollution, pollution, and heavy pollution levels, respectively. The reason for this is the dilution effect of rainfall on pollution concentrations.
Spatially and temporally, the aforementioned assessments are generally consistent. Spatially, the high population densities in the LNHNR and MXAC might lead to increased water exploitation and retention for the purpose of living, resulting in substantial water quality impacts during the dry season. The MPMF, on the other hand, contained only a melaleuca forest with no inhabitants, hence the water quality was better. The flow velocity did not differ between the dry and wet seasons. The flow velocity in canals is normally very low, because sluice systems are normally closed except in rare cases where the flow rate may increase due to the sluice opening. The water level inside the dyke system was always kept at a sufficient level in rivers and canals to help prevent forest fires. As a result, during the wet season, some of the water from the on-site rain and upstream runoff reached the protected areas, necessitating the use of the sluice gate system to drain this excess water. As a result, the water was diluted, resulting in a water quality improvement compared to the water quality in the dry season.
Based on the results of the annual average, the WQI values at the LNHNR, MXAC, and MPFM were 171, 658, and 96, respectively, which means that the surface water quality in the three NRs was very bad and could not be used for domestic use. In this case, it should be noted that the annual average in the MXAC was 3.8–6.9 times higher than that in the other study areas. In addition, the WAWQI results also reveal that the WQI tended to be higher in the dry season at all three sites.
Due to organic pollution waste from falling leaves and trunks, the water quality had deteriorated (the surface water became black), which was seen at all three studied NRs. PO43− concentrations at T6 and T13 were found to be 90–92 times higher than QCVN 08-MT:2015/BTNMT [32] during the dry season of 2016. As a result, the WQI calculation results ranged between 5686 and 7433. Poor water circulation and low water flow conditions resulted in high phosphate levels, reducing the self-purifying ability of the channels. Agricultural practices, specifically rice and sugarcane cultivation in the TTNNMX, were responsible for the high phosphate levels. Furthermore, the DO contents in the NRs were significantly lower than the standard 08:2015/BTNMT (column A1) used for aquatic animal conservation. It should be noted that the levels of organic pollution were found to be higher in the study area than those found in the intensive rice [2,3,33,34,35], aquaculture [36,37], and fruit areas [34] in the VMD.
In summary, this study provides an overall assessment of the impact of different infrastructural developments on NRs and the effects on their ecosystem services, especially regulation. It also provides scientific evidence for designing robust management plans. This kind of study is of great importance, especially in the context of urban landscape where green spaces, namely, public parks, forests, green open spaces, etc., contribute to human well-being (recreation, meditation, community bonding, etc.), as well as environmental management (water quality improvement, air quality improvement, regulation of micro-climate, etc.) [38,39,40,41].

4. Conclusions

The water quantity was circulated throughout the wet season, but flow directions were problematic due to the geography, which included several intersecting canals. During the dry season, the sluices were closed, which prevented water exchange in and out of the LNHNR and resulted in somewhat stagnant water dynamics with no distinct flow direction. Furthermore, the construction of infrastructure has had a significant impact on the hydrological regime and degradation of the water quality due to water retention for firefighting and livelihood provision for the inhabitants.
Although the water budget conditions have improved for forest fire prevention, they have had an impact on the water quality in the reserves and surrounding areas. The irrigation infrastructure can benefit trade and fire prevention purposes, changes the natural hydrological conditions, and pollutes the, water which has an impact on the livelihoods and quality of life of some households outside of the NRs. The hard construction works may also have a negative impact on biodiversity conservation. As a result, finding a solution that combines hard and soft works may minimize the impact of construction on the long-term development on NRs in the Mekong Delta of Vietnam.

Author Contributions

Conceptualization, B.T.B.L., N.T.T.N., T.T.K.H., P.K. and H.V.T.M.; methodology, B.T.B.L., H.V.T.M. and T.V.T.; software, T.T.K.H.; validation, B.T.B.L., T.V.T., H.V.T.M. and T.T.K.H.; formal analysis, N.T.T.N., H.V.T.M. and T.T.T.D.; investigation, T.T.K.H. and N.T.T.N.; data curation, B.T.B.L., T.T.K.H.; writing—original draft preparation, B.T.B.L., P.K. and N.T.T.N.; writing—review and editing, B.T.B.L., N.T.T.N., T.T.T.D., P.K., T.T.K.H., T.V.T., R.A. and H.V.T.M.; supervision, H.V.T.M. All authors have read and agreed to the published version of the manuscript.

Funding

This research received no external funding.

Institutional Review Board Statement

Not applicable.

Informed Consent Statement

Not applicable.

Data Availability Statement

Not applicable.

Acknowledgments

We would like to thank the Department of Natural Resources and Environment of Hau Giang and Soc Trang provinces, Vietnam. The authors would also like to acknowledge Nigel K. Downes for the language check.

Conflicts of Interest

The authors declare no conflict of interest.

References

  1. Dat, T.Q.; Kanchit, L.; Thares, S.; Trung, N.H. Modeling the Influence of River Discharge and Sea Level Rise on Salinity Intrusion in Mekong Delta. In Proceedings of the 1st EnvironmentAsia International Conference, Bangkok, Thailand, 22–25 March 2011; Volume 35, pp. 685–701. [Google Scholar]
  2. Thu Minh, H.V.; Avtar, R.; Kumar, P.; Le, K.N.; Kurasaki, M.; Ty, T.V. Impact of Rice Intensification and Urbanization on Surface Water Quality in An Giang Using a Statistical Approach. Water 2020, 12, 1710. [Google Scholar] [CrossRef]
  3. Minh, H.V.T.; Kurasaki, M.; Ty, T.V.; Tran, D.Q.; Le, K.N.; Avtar, R.; Rahman, M.M.; Osaki, M. Effects of Multi-Dike Protection Systems on Surface Water Quality in the Vietnamese Mekong Delta. Water 2019, 11, 1010. [Google Scholar] [CrossRef] [Green Version]
  4. Nhan, H.T.T.; Tinh, T.K.; Hung, P.V. Managerial Status of Protected Areas in Viet Nam. Available online: https://repository.vnu.edu.vn/handle/VNU_123/10033 (accessed on 15 October 2021).
  5. Trang, N.T.N.; Dan, T.H. Assessment of the Farming Models in the Lung Ngoc Hoang Nature Reserve in Hau Giang Province. Available online: http://www.iebr.ac.vn/PAGES/proceedings7_Display.asp (accessed on 22 October 2021).
  6. Brown, R.M.; McClelland, N.I.; Deininger, R.A.; Tozer, R.G. A Water Quality Index-Do We Dare. Water Sew. Work. 1970, 117, 339–343. [Google Scholar]
  7. Tyagi, S.; Sharma, B.; Singh, P.; Dobhal, R. Water Quality Assessment in Terms of Water Quality Index. AJWR 2013, 1, 34–38. [Google Scholar] [CrossRef]
  8. Dunnette, D. A Geographically Variable Water Quality Index Used in Oregon. J. Water Pollut. Control. Fed. 1979, 51, 53–61. [Google Scholar]
  9. Dinius, S.H. Design of an index of water quality. J. Am. Water Resour. Assoc. 1987, 23, 833–843. [Google Scholar] [CrossRef]
  10. Kumar, D.; Alappat, B.J. NSF-Water Quality Index: Does It Represent the Experts’ Opinion? Pract. Period. Hazard. Toxic Radioact. Waste Manag. 2009, 13, 75–79. [Google Scholar] [CrossRef]
  11. Khan, A.A.; Paterson, R.; Khan, H. Modification and Application of the Canadian Council of Ministers of the Environment Water Quality Index (CCME WQI) for the Communication of Drinking Water Quality Data in Newfoundland and Labrador. Water Qual. Res. J. 2004, 39, 285–293. [Google Scholar] [CrossRef] [Green Version]
  12. Khan, A.A.; Tobin, A.; Paterson, R.; Khan, H.; Warren, R. Application of CCME Procedures for Deriving Site-Specific Water Quality Guidelines for the CCME Water Quality Index. Water Qual. Res. J. 2005, 40, 448–456. [Google Scholar] [CrossRef]
  13. Akter, T.; Jhohura, F.T.; Akter, F.; Chowdhury, T.R.; Mistry, S.K.; Dey, D.; Barua, M.K.; Islam, M.A.; Rahman, M. Water Quality Index for Measuring Drinking Water Quality in Rural Bangladesh: A Cross-Sectional Study. J. Health Popul. Nutr. 2016, 35, 1–12. [Google Scholar] [CrossRef] [Green Version]
  14. Amadi, A.; Olasehinde, P.; Okosun, E.; Yisa, J. Assessment of the Water Quality Index of Otamiri and Oramiriukwa Rivers. Phys. Int. 2010, 1, 102–109. [Google Scholar]
  15. Yisa, J.; Tijani, J.O. Analytical Studies on Water Quality Index of River Landzu. Am. J. Appl. Sci. 2010, 7, 453–458. [Google Scholar] [CrossRef] [Green Version]
  16. EZODO Instrument. Ezodo 7031 Waterproof Multi-Function Pocket Meter User Manual. 2016. Available online: https://www.manualslib.com/manual/1480487/Ezodo-Pl-700al.html#manual (accessed on 10 March 2021).
  17. Adwa Instrument. Manual Adwa AD12 Waterproof pH Testers. 1998. Available online: https://adwainstruments.com/manuals/manual_ad11_12.pdf (accessed on 17 October 2021).
  18. HM Instrument. Manual HM-COM 100 Waterproof Professional Series EC/TDS Meter. 2000. Available online: http://hmdigital.com/wp-content/uploads/2016/11/com100manual.pdf (accessed on 17 October 2021).
  19. GOnDO Instrument. Manual Tub-430 Portable Microprocessor Turbidity Meter. 2016. Available online: https://www.manualsdir.com/manuals/311336/xylem-turb-430-portable-turbidity-meter.html?original=1 (accessed on 17 October 2021).
  20. Vietnam Environment Administration. National standard TCVN 6663-3:2016 (ISO 5667-3:2012) on Water Quality—Sampling—Part 3: Preservation and Handing of Water Samples. 2016. Available online: https://vanbanphapluat.co/tcvn-6663-3-2016-iso-5667-3-2012-chat-luong-nuoc-lay-mau-phan-3#van-ban-goc (accessed on 7 February 2021).
  21. Sarwar, S.; Ahmmed, I.; Mustari, S.; Shaibur, M.R. Use of Weighted Arithmetic Water Quality Index (WAWQI) to Determine the Suitability of Groundwater of Chaugachcha and Manirampur Upazila, Jashore, Bangladesh. Environ. Biolog. Res. 2020, 2, 22–30. [Google Scholar]
  22. Chandra, D.S.; Asadi, S.; Raju, M.V.S. Estimation of water quality index by weighted arithmetic water quality index method: A model study. Int. J. Civ. Eng. Technol. 2017, 8, 1215–1222. [Google Scholar]
  23. Sârbu, C.; Pop, H. Principal Component Analysis versus Fuzzy Principal Component Analysis: A Case Study: The Quality of Danube Water (1985–1996). Talanta 2005, 65, 1215–1220. [Google Scholar] [CrossRef]
  24. Akoteyon, I.; Omotayo, A.; Soladoye, O.; Olaoye, H. Determination of Water Quality Index and Suitability of Urban River for Municipal Water Supply in Lagos-Nigeria. Eur. J. Sci. Res. 2011, 54, 263–271. [Google Scholar]
  25. Yogendra, K.; Puttaiah, E. Determination of Water Quality Index and Suitability of an Urban Waterbody in Shimoga Town, Karnataka. In Proceedings of the Taal 2007: The 12th World Lake Conference, Jaipur City, India, 29 October–2 November 2007; pp. 342–346. [Google Scholar]
  26. Miller, W.; Joung, H.; Mahannah, C.; Garrett, J. Identification of Water Quality Differences in Nevada through Index Application. J. Environ. Quality 1986, 15, 265–272. [Google Scholar] [CrossRef]
  27. Chowdhury, R.M.; Muntasir, S.Y.; Hossain, M.M. Water Quality Index of Water Bodies along Faridpur-Barisal Road in Bangladesh. Glob. Eng. Tech. Rev. 2012, 2, 1–8. [Google Scholar]
  28. Paun, I.; Cruceru, L.; Chiriac, F.L.; Niculescu, M.; Vasile, G.; Marin, N.M. Water Quality Indices-Methods for Evaluating the Quality of Drinking Water. INCD ECOIND—International Symposium-SIMI 2016. The Environment and the Industry. Proceeding Book. Available online: https://www.researchgate.net/publication/309304038_WATER_QUALITY_INDICES_-_METHODS_FOR_EVALUATING_THE_QUALITY_OF_DRINKING_WATER (accessed on 17 October 2021).
  29. Brown, R.M.; McClelland, N.I.; Deininger, R.A.; O’Connor, M.F. A Water Quality Index—Crashing the Psychological Barrier. In Indicators of Environmental Quality; Springer: Berlin/Heidelberg, Germany, 1972; pp. 173–182. [Google Scholar]
  30. Ministry of Natural Resources and Environment (Vietnam). QCVN 08-MT: 2015/BTNMT National Technical Regulation on Surface Water Quality. Available online: http://vea.gov.vn/Quy%20chun%20Vit%20Nam/QCVN%2008-MT-2015-BTNMT.pdf (accessed on 23 October 2021).
  31. Indian Council of Medical Research. Manual of Standards of Quality for Drinking Water Supplies. 1975, Spe. Rep. Ser. No. 44: p. 27. Available online: http://www.sciepub.com/reference/34835 (accessed on 13 May 2021).
  32. Etim, E.; Odoh, R.; Itodo, A.; Umoh, S.; Lawal, U. Water Quality Index for the Assessment of Water Quality from Different Sources in the Niger Delta Region of Nigeria. Front. Sci. 2013, 3, 89–95. [Google Scholar]
  33. Jyothi, S.; Thomas, G.M.; RV, R.R.; Masetti, A.; Tammana, A.; Motheram, M.; Gutlapalli, N.C. Assessment of Water Quality Index and Study of the Impact of Pollution on the Rivers of Kerala. Mater. Today Proc. 2021, 43, 3447–3451. [Google Scholar]
  34. Tam, N.T.; Bao, T.Q.; Minh, H.V.T.; Thanh, N.T.; Lien, B.T.B.; Minh, D.T.T. Assessment of Surface Water Quality due to the impact of activities in Can Tho City. Vietnam J. Hydrometeorol. 2022, 733, 39–55. [Google Scholar] [CrossRef]
  35. Minh, H.V.T.; Tam, N.T.; Nhu, D.T.H.; Thanh, N.T.; Ty, T.V. Assessment of the Surface Water Quality and Effectiveness of Triple-Glutinous Rice Cropping System in the Full–Dike Protected Area of Bac Vam Nao, An Giang. Vietnam J. Hydrometeorol. 2021, 732, 38–48. [Google Scholar] [CrossRef]
  36. Thu Minh, H.V.; Tri, V.P.; Ut, V.N.; Avtar, R.; Kumar, P.; Dang, T.T.; Hoa, A.V.; Ty, T.V.; Downes, N.K. A Model-Based Approach for Improving Surface Water Quality Management in Aquaculture Using MIKE 11: A Case of the Long Xuyen Quadangle, Mekong Delta, Vietnam. Water 2022, 14, 412. [Google Scholar] [CrossRef]
  37. Mutea, F.G.; Nelson, H.K.; Au, H.V.; Huynh, T.G.; Vu, U.N. Assessment of Water Quality for Aquaculture in Hau River, Mekong Delta, Vietnam Using Multivariate Statistical Analysis. Water 2021, 13, 3307. [Google Scholar] [CrossRef]
  38. Yang, Y.; Zhang, H.; Zhao, X.; Chen, Z.; Wang, A.; Zhao, E.; Cao, H. Effects of Urbanization on Ecosystem Services in the Shandong Peninsula Urban Agglomeration, in China: The Case of Weifang City. Urban Sci. 2021, 5, 54. [Google Scholar] [CrossRef]
  39. Avtar, R.; Komolafe, A.A.; Kouser, A.; Singh, D.; Yunus, A.P.; Dou, J.; Kumar, P.; Gupta, R.D.; Johnson, B.A.; Thu Minh, H.V.; et al. Assessing Sustainable Development Prospects through Remote Sensing: A Review. Remote Sens. Appl. Soc. Environ. 2020, 20, 100402. [Google Scholar] [CrossRef]
  40. Chakraborty, S.; Avtar, R.; Raj, R.; Thu Minh, H.V. Village Level Provisioning Ecosystem Services and Their Values to Local Communities in the Peri-Urban Areas of Manila, The Philippines. Land 2019, 8, 177. [Google Scholar] [CrossRef] [Green Version]
  41. Wang, Y.; Gao, J.; Wang, J.; Qiu, J. Value Assessment of Ecosystem Services in Nature Reserves in Ningxia, China: A Response to Ecological Restoration. PLoS ONE 2014, 9, e89174. [Google Scholar] [CrossRef]
Figure 1. Location map of the studied wetland areas of MXAC (a), LNHNR (b), and My Phuoc Maleuleca Forest (MPMF) (c).
Urbansci 06 00021 g001
Figure 2. Water sampling locations at (a) Lung Ngoc Hoang Natural Reserve; (b) Mua Xuan Agriculture Center; (c) My Phuoc melaleuca forest.
Urbansci 06 00021 g002
Figure 3. Location sampling at MPMF. (a) Melaleuca habitat, (b) wetland, (c) Nypa fruticans habitat, (d) canal habitat, (e) buffer zone.
Urbansci 06 00021 g003aUrbansci 06 00021 g003b
Figure 4. Infrastructure distribution in LNHNR in 2015.
Urbansci 06 00021 g004
Figure 5. Map of the infrastructure distribution and the flow directions in LNHNR in 2020.
Urbansci 06 00021 g005
Figure 6. Interview results of the assessment of the impact of construction projects on people’s livelihoods in the surrounding community.
Urbansci 06 00021 g006
Figure 7. Sensory assessment of water quality in the study area quality in LNHNR.
Urbansci 06 00021 g007
Figure 8. Interview results on the quality of irrigation systems in LNHNR.
Urbansci 06 00021 g008
Figure 9. WAWQI in LNHNR by season in 2016. * Sample ID is mentioned in Table 2 with specific location.
Urbansci 06 00021 g009
Figure 10. WAWQI at the MXAC by season in 2016. * Sample ID is mentioned in Table 2 with specific location.
Urbansci 06 00021 g010
Figure 11. WAWQI at MPMF by season in 2018. * Sample ID is mentioned in Table 2 with specific location.
Urbansci 06 00021 g011
Figure 12. Water quality classification based on WAWQI values. (a,b) Water quality at LNHNR in dry and wet seasons; (c,d) Water quality at MXAC in dry and wet seasons; (e,f) Water quality at MPMF in dry and wet seasons.
Urbansci 06 00021 g012aUrbansci 06 00021 g012b
Table 1. Sample Location Specifications with Global Positioning System (GPS) coordinates. Seasonal samples were collected in 2016 and 2018.
Sample ID *Sampling SiteSample ID *Sampling Site
Locational FeaturesLocational Features
L1Level 2 canal (TKII canal, plot 88)P1Canal habitat
L2Sub-branch canal (plot 85)P2Nypa fruticans habitat
L3Sub-branch canal (plot 27)P3Canal habitat
L4Sub-branch canal (plot 5, plot 32)P4Control canal in buffer zone
L5Level 2 canal (plot 1, plot 7)P5Control canal in buffer zone surrounded by the trees and Acacia auriculiformis
L6Sub-branch canal (plot 45)P6Canal habitat surrounded by tropical hornwort, Ipomoea aquatic, Eichhornia crassipes
L7Level 1 canal (Hau Giang 3 canal, plot 48)P7Nypa fruticans habitat
L8Level 1 canal (Phung Hiep canal)P8Canal habitat
T1Melaleuca habitatP9Canal habitat
T2Melaleuca habitatP10Wetland habitat
T3Melaleuca habitatP11Melaleuca habitat
T4Melaleuca habitatP12Melaleuca habitat
T5Melaleuca habitatP13Melaleuca habitat with floating membrane surrounded by Melaleuca, Nypoideae
T6Melaleuca habitatP14Melaleuca habitat surrounded by tropical hornwort, Annona glabra, Melaleuca, Nypoideae
T7Melaleuca habitatP15Canal habitat with Eichhornia crassipes
T8Melaleuca habitatP16Canal habitat with Eichhornia crassipes
T9Melaleuca habitatP17Canal habitat
T10Paddy habitatP18Canal habitat with Eichhornia crassipes
T11Paddy habitatP19Canal habitat with membrane and Eichhornia crassipes
T12Sugarcane habitatP20Nypa fruticans habitat
T13Sugarcane habitatP21Nypa fruticans habitat
T14Sugarcane habitatP22Canal habitat surrounded by Eichhornia crassipes, Stenochlaena palustris Annona glabra
--P23Canal habitat, surrounded by Pistia stratiotes L, Stenochlaena palustris Annona glabra, Neptunia oleracea
--P24Canal habitat with Eichhornia crassipes Annona glabra,
--P25Canal habitat with Annona glabra, Stenochlaena palustris, Eichhornia crassipes
--P26Level 1 canal
--P27Nypa fruticans habitat with tropical hornwort, Eichhornia crassipes, Pistia stratiotes L,
--P28Canal habitat with Eichhornia crassipes, tropical hornwort
L: Lung Ngoc Hoang Natural Reserve; T: Mua Xuan Agriculture Center; P: My Phuoc melaleuca forest; Sample ID * is used in the subsequent tables.
Table 2. Classification of Weighted Arithmetic Water Quality Index.
Range of WAWQIClassification of Water Quality
<25Excellent
26–50Good
51–75Poor
76–100Very poor
>100Unsuitable for drinking
Table 3. Water parameters for WAWQI calculation [30]. (QCVN 08-MT:2015/BTNMT, Column A1-Ministry of Natural Resources and Environment-Vietnam Environment Directorate).
NoParametersStandard (Si)Units
1pH8.5
2EC300 **µS/cm
3COD10mg/L
4PO43−0.1mg/L
5BOD54mg/L
6DO6mg/L
7NO32mg/L
8NH4+0.3mg/L
9TSS20mg/L
10Fe0.5Mg/L
** ICMR (1975) [31,32,33].
Table 4. Calculation of the WAWQI for the LNHNR in the 2016 Wet Season.
Sample ID *ECpHCODPO43−BOD5DOWAWQI
µS/cmmg/L
QCVN 08-MT:2015/BTNMT (Column A1)300 **6.5–8.5100.146
L12766.9411.280.184.854.73178
L22787.0212.730.125.483.25116
L32747.0316.780.057.223.8358
L42916.9619.170.078.243.0973
L52726.9423.200.099.983.6595
L62976.8022.400.209.634.11201
L72657.167.740.113.334.79105
Descriptive Statistics
Maximum2977.1623.200.209.984.79201
Minimum2656.807.740.053.333.0958
Mean2796.9715.980.126.874.00123
SD100.095.080.052.190.6148
* Sample ID is mentioned in Table 2 with specific locations; ** ICMR (1975); SD = standard deviation.
Table 5. Calculation of the WAWQI for the LNHNR in the 2016 Dry Season.
Sample ID *ECpHCODPO43−BOD5DOWAWQI
µS/cmmg/L
QCVN 08-MT:2015/BTNMT (Column A1)300 **6.5–8.5100.146
L1306.807.1710.170.394.374.33375
L2301.407.1914.430.246.212.67236
L3275.737.1618.070.167.772.72156
L4309.007.0114.600.116.283.11107
L5284.437.2027.270.1711.725.38168
L6316.107.1715.870.166.824.70160
L7323.007.148.830.213.804.84202
Descriptive Statistics
Maximum323.007.2027.270.3911.725.38375
Minimum275.737.018.830.113.802.67107
Mean301.507.1515.630.236.724.03219
SD14.790.065.240.102.250.9889
* Sample ID is mentioned in Table 2 with specific locations; ** ICMR (1975); SD = standard deviation.
Table 6. Calculation of WAWQI for the MXAC in the 2016 Dry Season.
Sample ID *ECpHCODPO43−NH4+FeBOD5DOWAWQI
µS/cmmg/L
QCVN 08-T:2015/BTNMT (Column A1)300 **6.5–8.5100.10.30.546
T15306.8342.70.410.701.4926.702.50357
T23157.1332.00.330.300.6426.202.60257
T35456.8364.00.360.601.4722.202.70318
T44066.8458.70.330.301.4626.201.33280
T52166.9048.00.290.201.1025.302.02237
T62486.8042.79.010.100.8927.601.925686
T72726.8442.70.17ND0.5220.43.44166
T82586.9742.70.560.10.7313.81.73386
T94546.61170.70.25ND3.271481.5390
T102826.8158.70.40.2129.81.3306
T114236.9158.70.45ND1.0922.21.3408
T124886.94640.31ND0.7128.91.6289
T132536.9242.79.2ND1.4725.327344
T142427.34640.140.20.8317.87.5134
Descriptive Statistics
Maximum5457.34170.79.20.73.271487.57344
Minimum2166.61320.140.100.5213.81.3134
Mean352.296.9159.451.590.301.1932.892.391183
SD112.920.1632.433.070.200.6632.211.542201
* Sample ID is mentioned in Table 2 with specific locations; ** ICMR (1962); SD = standard deviation; ND: not detected.
Table 7. Calculation of WAWQI from Data from the MXAC in the 2016 Wet Season.
Sample ID *ECpHCODPO43−NH4+FeBOD5DOWAWQI
µS/cm mg/L
QCVN 08-T:2015/BTNMT (Column A1)300 **6.5–8.5100.10.30.546
T11956.265.20.250.001.124.003.10187
T21916.243.80.170.001.241.903.30140
T32036.224.10.150.000.552.403.50110
T42236.263.70.190.001.001.601.90146
T55795.715.50.040.001.605.202.7068
T63806.156.80.070.000.875.902.3070
T75605.9170.03ND1.145.61.665
T82786.357.40.13ND0.8752.7135
T95535.657.80.04ND2.1151.6103
T102926.114.70.18ND1.492.52193
T112436.3140.22ND1.42.21.6221
T125846.44170.17ND0.66.52.1160
T132126.154.20.18ND1.072.42.9179
T144326.35.10.09ND0.194.95.581
Descriptive Statistics
Maximum5846.44170.2502.116.55.5221
Minimum1915.653.70.0300.191.61.665
Mean351.796.156.160.1401.093.942.63133
SD152.640.233.290.0700.461.631.0149
* Sample ID is mentioned in Table 2 with samples’ specific location; ** ICMR (1962); SD = standard deviation; ND: not detected.
Table 8. Calculation of WAWQI for data at MPMF in Dry season 2018.
Sample ID *ECpHCODPO43−NH4+NO3TSSBOD5DOWAWQI
µS/cmmg/L
QCVN 08-T:2015/BTNMT (Column A1)300 **6.5–8.5100.10.30.52046
P119506.8180.10.23.1458.402.484.296
P24606.818.50.090.12.1687.902.324.2879
P319906.516.50.080.32.5176.401.494.1988
P421006.6180.130.12.1311.402.695.1108
P521506.319.50.10.11.213.500.675.4482
P63186.01900.090.252.3812.403.482.3498
P73416.331100.150.23.80818.804.403.02142
P83226.9950.10.33.61810.202.082.47111
P93304.571110.080.13.517.604.243.2284
P103386.511000.090.092.98711.202.511.7487
P113295.211160.090.153.0188.901.872.991
P123306.35900.0850.53.33118.504.532.12118
P133346.53900.30.33.02522.305.441.52252
P143336.121100.10.13.10324.105.521.18101
P153226.8318.50.050.453.0038.201.713.4880
P163167.01190.150.42.72514.603.444.24148
P173316.8518.50.060.12.01512.302.534.2360
P183346.8920.50.0850.152.128.702.125.4380
P193796.7819.50.250.223.0412.402.884.85202
P203506.519.50.090.383.41524.608.644.56110
P213476.6818.50.10.13.22126.208.644.3796
P223366.01105.20.0260.472.0156.04.242.6568
P233326.41108.90.0260.452.2015.03.441.6267
P243356.51113.60.0260.512.6138.04.241.6774
P253346.6113.60.0210.402.91512.52.531.8265
P263356.65120.30.0360.463.02517.52.121.9782
P273386.9119.30.0210.533.0810.52.083.975
P283267.06111.00.0600.243.2090.52.321.8375
Descriptive Statistics
Maximum215071200.30.533.8126.28.645.44252
Minimum3164.5716.50.020.091.210.50.671.1860
Mean583.576.4768.870.090.272.8012.453.383.23101
SD598.980.5244.10.060.150.586.471.861.3041
* Sample ID is mentioned in Table 2 with specific locations; ** ICMR (1975); SD = standard deviation.
Table 9. Calculation of WAWQI for data at MPMF in Wet season 2018.
Sample ID *ECpHCODPO43−NH4+NO3TSSBOD5DOWAWQI
µS/cmmg/L
QCVN 08-T:2015/BTNMT (Column A1)300 **6.5–8.5100.10.30.5 46
P116406.94750.0100.1892.985145.911.7540
P214675.38900.0150.6712.776443.550.7993
P312755.87900.0400.4502.615272.850.6786
P416115.76800.0200.3281.942363.013.3664
P513826.18820.0250.2472.005193.310.5455
P611956.67770.0450.4842.6351023.970.79124
P76196.541050.0800.2844.49274.050.3297
P87566.79800.0750.0694.443113.730.6877
P96157.28950.0850.1624.41153.952.0189
P108846.56900.1650.1134.395995.231.73181
P117476.751150.0800.0694.234124.270.6583
P127066.591050.0650.2164.21776.290.4581
P137556.56850.1050.1124.201126.290.56101
P146386.54870.1250.1394.573104.400.73117
P1515146.94770.0550.1994.40665.651.7671
P1614716.85800.0400.1864.12567.091.5459
P1713086.23900.0300.1684.337303.731.4962
P1811795.33800.0200.2153.987554.961.8767
P1913576800.0400.1294.014273.361.3163
P2014785.77900.0450.3244.403975.812.73113
P217176.541100.1050.0964.783112.831.27102
P2212216.45950.0600.2002.748182.400.777
P2313786.14850.0300.0122.416303.550.9446
P2414146.02850.0301.8833.675343.680.58193
P2514066.01900.0350.4743.669333.870.489
P2614395.94900.0300.4574.107374.590.586
P2714325.64700.0351.5144.321426.480.71172
P2813866.63850.0550.154.272165.651.6771
Descriptive Statistics
Maximum16407.281150.171.884.781027.093.36193
Minimum6155.33700.010.0121.9452.40.3240
Mean1178.216.3287.960.060.343.7630.254.451.1691
SD337.240.4810.430.040.410.8427.291.250.7337
* Sample ID is mentioned in Table 2 with specific locations; ** ICMR (1975); SD = standard deviation.
Publisher’s Note: MDPI stays neutral with regard to jurisdictional claims in published maps and institutional affiliations.

