Study on the Evolution of the Source-Flow-Sink Pattern of China’s Chunyun Population Migration Network: Evidence from Tencent Big Data
Abstract
:1. Introduction
2. Materials and Methods
2.1. Research Data
2.2. Research Methods
2.2.1. Source-Sink Theory and the Coefficient of Net Population Flow
2.2.2. Regionalization with Dynamically Constrained Agglomerative Clustering and Partitioning (REDCAP)
3. Identification of Source and Sink Areas of Population Flow during Spring Festival Transport in China
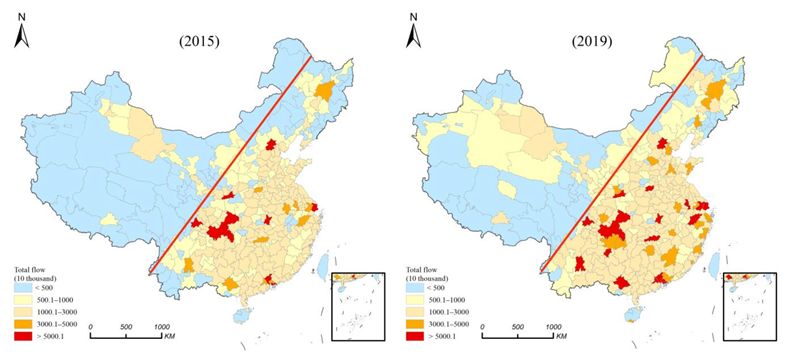
3.1. Spatial Differentiation of the Total Population Flow during Spring Festival Transport in China
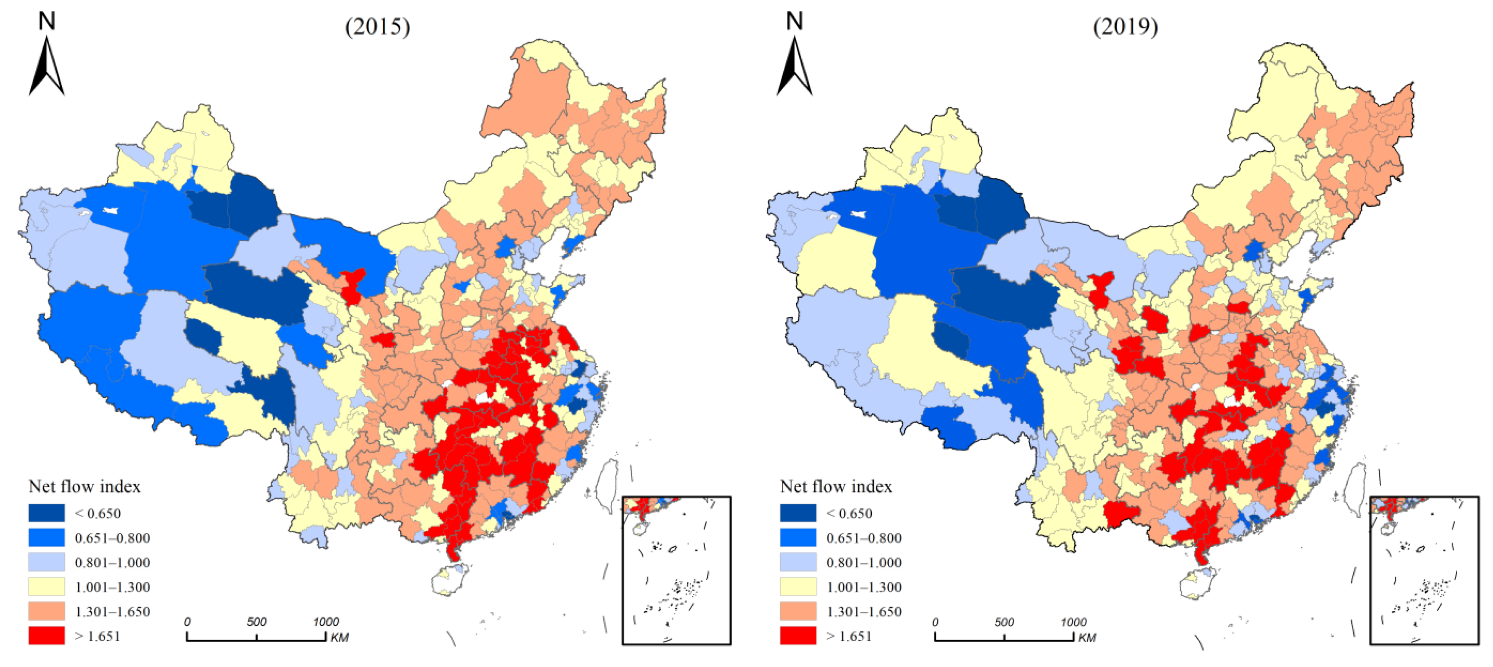
3.2. The Spatial Distribution Characteristics of the Net Population Flow during the Spring Festival Travel Season in China
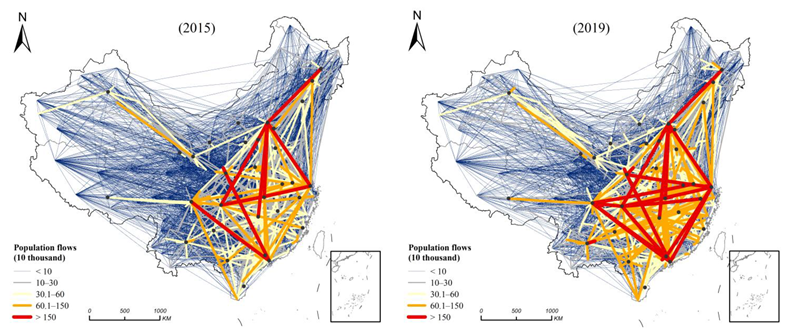
3.3. The Network Pattern of China’s Spring Festival Transport Population Flow
3.4. Identifying the Source and Sink Areas of Population Flow at Different Levels
3.4.1. Dynamic Division of the Source and Sink Areas of Population Flow
3.4.2. Classification of Source and Sink Areas of Population Flow
3.4.3. The Organization Model of Population Flow Sources and Sinks
4. Discussion
4.1. Significance for Research on Population Mobility
4.2. The Role of and Suggestions for the Optimal Allocation of Population Resources
5. Conclusions
- (1)
- The population flow during Spring Festival Transport in China is mainly concentrated east of the Hu Huanyong Line, which plays a relatively stable role in defining the differences in the population flow in China. There is strong spatial heterogeneity in the growth of the total population flow. The population flow in the “T-shaped” area formed by the Hu Huanyong Line and Lanxin Line has increased considerably. Provincial capital cities such as Hangzhou, Nanjing, and Hefei are gathering and dispersing in population flow. The role is increasingly prominent.
- (2)
- The net population outflow areas are mainly concentrated in the easternmost developed regions, some provincial capital cities, and some western regions. The net population flow in space presents an inverted U-shaped pattern that is high in the middle and low on both sides. The net inflow areas are concentrated in Anhui central provinces, such as Henan and Jiangxi, which have evolved spatially and discretely, and they distributed on the boundaries of provincial administrative regions, forming the labour export zone surrounding the central province.
- (3)
- The population flow network during Spring Festival Transport in China has gradually formed a diamond network structure. The Beijing-Tianjin-Hebei, Yangtze River Delta, Pearl River Delta, and Chengdu-Chongqing regions and the middle reaches of the Yangtze River act as the fulcrum. The Beijing-Kowloon Line and the cross-shaped corridor of the Yangtze River Economic Belt act as the axis. The western region represents a series of weak population ties. The population flow network has obvious hierarchical characteristics. The first level of connection mainly occurs in core cities such as Beijing, Shanghai, Guangzhou, Shenzhen, Chengdu, and Chongqing, and the distance attenuation effect is weakened. The second and third levels are concentrated in the important population source and sink areas. The fourth level of population flow is connected to China. The main traffic arteries are relatively consistent and the effect of population flow along the way is obvious. The fifth-level population flow network is similar to the random network.
- (4)
- The population flow source and sink areas are divided into four areas of the first level similar to the three economic belts of eastern, central, and western China. In the second level, which contains 10 areas, important population sources and sink areas are divided, such as the Pearl River Delta and the central region. The 18 regions in the tier can basically reflect the overall situation of China’s economic development. Among the six types of population movement, the first two source areas are mainly the eastern coastal urban agglomeration areas, which bear most of China’s population outflow. The western source areas are due to industry, tourism, and other factors that have high population mobility. The three-tier confluence areas are mainly concentrated in Sichuan and Chongqing and the central provinces, especially at the junction of the central provinces. The source-sink system of population flow shows obvious network nesting.
Author Contributions
Funding
Informed Consent Statement
Data Availability Statement
Conflicts of Interest
References
- De Haas, H. Migration and development: A theoretical perspective. Int. Migr. Rev. 2010, 44, 227–264. [Google Scholar] [CrossRef] [PubMed] [Green Version]
- Li, S.M. Population migration regional economic growth and income determination: A comparative study of Dongguan and Meizhou China. Urban Stud. 2014, 34, 999–1026. [Google Scholar] [CrossRef]
- Halás, M.; Klapka, P.; Tonev, P. The use of migration data to define functional regions: The case of the Czech Republic. Appl. Geogr. 2016, 76, 98–105. [Google Scholar] [CrossRef]
- Wang, J.; Kim, S. Multilevel analysis of social and Policy acceptance of immigrants across European countries and its implications for comparative policy. J. Comp. Policy Anal. 2020, 1–52. [Google Scholar] [CrossRef]
- Windzio, M. The network of global migration 1990–2013. Soc. Netw. 2018, 53, 20–29. [Google Scholar] [CrossRef]
- Morrill, R. Fifty years of population change in the US 1960–2010. Cities 2012, 29, S29–S40. [Google Scholar] [CrossRef]
- Wang, X.; Hui, E.C.; Sun, J. Population migration, urbanization and housing prices: Evidence from the cities in China. Habitat Int. 2017, 66, 49–56. [Google Scholar] [CrossRef]
- Louail, T.; Lenormand, M.; Cantu Ros, O.G.; Picornell, M.; Herranz, R.; Frias-Martinez, E.; Barthelemy, M. From mobile phone data to the spatial structure of cities. Sci. Rep. 2014, 4, 1–12. [Google Scholar] [CrossRef] [PubMed] [Green Version]
- Bengtsson, L.; Gaudart, J.; Lu, X.; Moore, S.; Wetter, E.; Sallah, K.; Piarroux, R. Using mobile phone data to predict the spatial spread of cholera. Sci. Rep. 2015, 5, 1–5. [Google Scholar] [CrossRef] [PubMed]
- Gariazzo, C.; Pelliccioni, A. A multi-city urban population movement study using mobile phone traffic data. Appl. Spat. Anal. 2019, 12, 753–771. [Google Scholar] [CrossRef]
- Lee, K.S.; You, S.Y.; Eom, J.K.; Song, J.; Min, J.H. Urban spatiotemporal analysis using mobile phone data: Case study of medium- and large-sized Korean cities. Habitat Int. 2018, 73, 6–15. [Google Scholar] [CrossRef]
- Picornell, M.; Ruiz, T.; Lenormand, M.; Ramasco, J.J.; Dubernet, T.; Frías-Martínez, E. Exploring the potential of phone call data to characterize the relationship between social network and travel behavior. Transportation 2015, 42, 647–668. [Google Scholar] [CrossRef] [Green Version]
- Sagl, G.; Delmelle, E.; Delmelle, E. Mapping collective human activity in an urban environment based on mobile phone data. Cartogr. Geogr. Inform. Sci. 2014, 41, 272–285. [Google Scholar] [CrossRef] [Green Version]
- Rinzivillo, S.; Mainardi, S.; Pezzoni, F.; Coscia, M.; Pedreschi, D.; Giannotti, F. Discovering the geographical borders of human mobility. Künstl. Intell. 2012, 26, 253–260. [Google Scholar] [CrossRef]
- Guimera, R.; Mossa, S.; Turtschi, A.; Amaral, L.A.N. The worldwide air transportation network: Anomalous centrality, subnetwork structure, and cities’global roles. Proc. Natl. Acad. Sci. USA 2005, 102, 7794–7799. [Google Scholar] [CrossRef] [Green Version]
- Wang, L. High-speed rail services development and regional accessibility restructuring: The case of the Yangtze River Delta, China. Transport. Policy 2018, 72, 34–44. [Google Scholar] [CrossRef]
- Zhong, Y.; Wu, S.; Feng, X.; Wu, Q. The network structure characteristics of the urban agglomeration in the middle reaches of the Yangtze River from the perspective of multi-flow space. J. Jiangxi Norm. Univ. (Philos. Soc. Sci. Ed.) 2020, 53, 47–55. (In Chinese) [Google Scholar]
- Hawelka, B.; Sitko, I.; Beinat, E.; Sobolevsky, S.; Kazakopoulos, P.; Ratti, C. Geo-located Twitter as proxy for global mobility patterns. Cartogr. Geogr. Inform. Sci. 2014, 41, 260–271. [Google Scholar] [CrossRef] [Green Version]
- Liu, Y.; Sui, Z.; Kang, C.; Gao, Y. Uncovering Patterns of Inter-Urban Trip and Spatial Interaction from Social Media Check-In Data. PLoS ONE 2014, 9, e86026. [Google Scholar] [CrossRef] [PubMed]
- Roberts, H.; Sadler, J.; Chapman, L. Using Twitter to INVESTIGATE seasonal variation in physical activity in urban green space. Geo Geogr. Environ. 2017, 4, e00041. [Google Scholar] [CrossRef]
- Xu, J.; Li, A.; Li, D. Difference of urban development in China from the perspective of passenger transport around Spring Festival. Appl. Geogr. 2017, 87, 85–96. [Google Scholar] [CrossRef]
- Wei, Y.; Song, W.; Xiu, C.; Zhao, Z. The rich-club phenomenon of China’s population flow network during the country’s spring festival. Appl. Geogr. 2018, 96, 77–85. [Google Scholar] [CrossRef]
- Kawecki, T.J. Demography of source-sink populations and the evolution of ecological niches. Evol. Ecol. 1995, 9, 38–44. [Google Scholar] [CrossRef]
- Pan, J.; Lai, J. Spatial pattern of population mobility among cities in China: Case study of the National day plus Mid-autumn festival based on tencent migration data. Cities 2019, 94, 55–69. [Google Scholar] [CrossRef]
- Brawn, J.D.; Robinson, S.K. Source-Sink Population Dynamics may Complicate the Interpretation of Long-Term Census Data. Ecology 1996, 1, 3–12. [Google Scholar] [CrossRef]
- Gundersen, G.; Johannesen, E.; Andreassen, H.P.; Ims, R.A. Source–sink dynamics: How sinks affect demography of sources. Ecol. Lett. 2001, 4, 14–21. [Google Scholar] [CrossRef]
- Ma, Z.; Zhang, S.; Zhao, S. Study on the spatial pattern of Migration population in Egypt and its flow field characteristics from the perspective of “source-flow-sink”. Sustainability 2021, 13, 350. [Google Scholar] [CrossRef]
- Fuchs, M.; Hopken, W.; Lexhagen, M. Big data analytics for knowledge generation in tourism destinations—A case from Sweden. J. Destin. Mark. Manag. 2014, 3, 198–209. [Google Scholar] [CrossRef]
- Li, J.; Ye, Q.; Deng, X.; Liu, Y.; Liu, Y. Spatial-temporal analysis on spring festival travel rush in China based on multisource big data. Sustainability 2016, 8, 1184. [Google Scholar] [CrossRef] [Green Version]
- Wang, X.; Chen, L.; Mao, W.; Hu, Z.; Gu, L. Tracing the largest seasonal migration on earth. Physics 2014, arXiv:1411.0983. [Google Scholar]
- Wei, Y.; Xiu, C.; Liu, Z.; Chen, W. Spatial pattern of city network in transitional China based on the population flows in “Chunyun” period. Sci. Geogr. Sin. 2016, 36, 1654–1660. (In Chinese) [Google Scholar]
- Wu, Q.; Tao, J.; Wu, K.; Zhao, M. Daily commuting behavior characteristics of high-speed rail passengers in the Yangtze River Delta region: A case study of Shanghai-Hangzhou, Nanjing-Hangzhou, and Hangzhou-Ningbo lines. City Plan. Rev. 2018, 42, 90–97. (In Chinese) [Google Scholar]
- Kain, J.F. A pioneers perspective on the spatial mismatch literature. Urban Stud. 2004, 41, 7–32. [Google Scholar] [CrossRef]
- Wang, Y.; Wang, F.; Zhang, Y.; Liu, Y. Delineating urbanization “SOURCE-SINK” regions in China: Evidence from mobile app data. Cities 2019, 86, 167–177. [Google Scholar] [CrossRef]
- Zhang, W.; Chong, Z.; Li, X.; Nie, G. Spatial patterns and Determinant factors of population FLOW networks in China: Analysis on Tencent Location big data. Cities 2020, 99, 102640. [Google Scholar] [CrossRef]
- Paquet, M.; Arlt, D.; Knape, J.; Low, M.; Forslund, P.; Part, T. Why we should care about movements: Using spatially explicit integrated population models to assess habitat source–sink dynamics. J. Anim. Ecol. 2020, 89, 2922–2933. [Google Scholar] [CrossRef] [PubMed]
- Feng, X.; Xiu, C.; Bai, L.; Zhong, Y.; Wei, Y. Comprehensive evaluation of urban resilience based on the perspective of landscape pattern: A case study of Shenyang city. Cities 2020, 104, 102722. [Google Scholar] [CrossRef]
- Huang, W.; Gao, B.; Lin, J.; Cui, S.; Zhong, Q.; Huang, C.L. Driving forces of nitrogen input into city-level food systems: Comparing a food-source with a food-sink prefecture-level city in China. Resour. Conserv. Recycl. 2020, 160, 104850. [Google Scholar] [CrossRef]
- Sakalli, A. The responses of net ecosystem production to climate change: A modelling study to identify the sink and source of carbon regions at the paneuropean scale. Appl. Ecol. Environ. Res. 2020, 18, 4569–4581. [Google Scholar] [CrossRef]
- Liu, Y.; Wang, F.; Xiao, Y.; Gao, S. Urban land uses and traffic ‘source-sink areas’: Evidence from GPS-enabled taxi data in Shanghai. Landsc. Urban. Plan. 2012, 106, 73–87. [Google Scholar] [CrossRef]
- Guo, D. Regionalization with dynamically constrained agglomerative clustering and partitioning (redcap). J. Geogr. Inf. Sci. 2008, 22, 801–823. [Google Scholar] [CrossRef]
- Guo, D.; Wang, H. Automatic region building for spatial analysis: Automatic region building for spatial analysis. Trans. GIS 2011, 15, 29–45. [Google Scholar] [CrossRef]
- Liu, C.; Xu, Y.; Wang, F. Population distribution patterns and changes in China 1953–2010. J. Geogr. Sci. 2019, 29, 1908–1922. [Google Scholar] [CrossRef] [Green Version]


| Types | Classification | 2015 | 2019 | ||||||
|---|---|---|---|---|---|---|---|---|---|
| Region ID | Flow Index | Specific Region | Description | Region ID | Flow Index | Specific Region | Description | ||
| I | High outflow regions | 7 | 0.761 | Pearl River Delta region | Guangzhou, Shenzhen, Zhuhai, Foshan, Jiangmen, Huizhou, Dongguan, and Zhongshan | 6 | 0.799 | Pearl River Delta region | Guangzhou, Shenzhen, Zhuhai, Foshan, Jiangmen, Huizhou, Dongguan, and Zhongshan |
| 1 | 0.84 | Yangtze River Delta region | Shanghai, southern Jiangsu, and Zhejiang Province | 1 | 0.846 | Yangtze River Delta | Shanghai, southern Jiangsu, and most of Zhejiang | ||
| 13 | 0.908 | Beijing-Tianjin-Hebei region | Beijing, Tianjin, Tangshan, Qinhuangdao, and Langfang | 12 | 0.958 | Beijing-Tianjin-Hebei region | Beijing, Tianjin, Tangshan, Qinhuangdao, and Langfang | ||
| II | Moderate outflow regions | 15 | 0.953 | Shandong Peninsula | Jinan, Qingdao, Zibo, Dongying, Yantai, Weifang, Weihai, and Binzhou | 13 | 0.983 | Shandong Peninsula | Jinan, Qingdao, Zibo, Dongying, Yantai, Weifang, Weihai, and Binzhou |
| 16 | 0.983 | West coast of the strait | Fuzhou, Xiamen, Putian, and Quanzhou | ||||||
| III | Weak outflow regions | 2 | 0.93 | Western China | Xinjiang, Tibet, Qinghai, Sichuan, Gansu, and parts of Yunnan Province | 17 | 0.984 | Yinchuan-Hohhot | Western Inner Mongolia and Yinchuan |
| 12 | 0.442 | Turpan-Hami | Turpan and Hami | 2 | 0.965 | Western China | Xinjiang, Tibet, Qinghai, Sichuan, Gansu, and parts of Yunnan | ||
| 11 | 0.706 | Qinghai-centred region | The borders of Xinjiang, Gansu, Qinghai, Qamdo, and Tibet | ||||||
| IV | Weak inflow region | 17 | 1.143 | Kunming-centred region | Panzhihua, Leshan, Meishan, Ya’an and Liangshan in Yunnan, and Sichuan Province | 15 | 1.14 | West coast of the strait | Fuzhou, Xiamen and other areas of Fujian Province and Lishui, Shantou, and Chaozhou |
| 9 | 1.239 | Nanchang-Changsha area | Changsha, Zhuzhou, Xiangtan, and Nanchang, Xinyu, Pingxiang, and Yichun in Hunan Province | 14 | 1.158 | Hefei-Changsha region | Anhui, Jiangxi, Hunan, and other provincial capitals and their surrounding areas | ||
| 5 | 1.247 | Northern inland | Parts of Inner Mongolia, Jilin, Liaoning, Hebei, Shaanxi, Shanxi, Shandong and Henan Provinces | 3 | 1.217 | Part of the southwest | Parts of Yunnan, Sichuan, Guizhou, Hubei and Hunan Provinces | ||
| 5 | 1.274 | Northern inland | Parts of Inner Mongolia, Jilin, Liaoning, Hebei, Shaanxi, and other provinces | ||||||
| V | Moderate inflow region | 8 | 1.318 | Southern Anhui-northern Fujian | Sanming, Nanping and Ningde in Fujian Province, Jingdezhen and Yingtan in Jiangxi Province, and parts of Anhui Province | 16 | 1.411 | Guangxi and surrounding areas | Guangxi Province, western Guangdong Province and southwest Guizhou |
| 3 | 1.4 | Southern inland | Parts of Henan, Shaanxi, Hubei, Hunan, Guangxi and Sichuan provinces | 10 | 1.472 | Harbin-centred region | Central and eastern Heilongjiang, Jilin Province, Siping, Songyuan | ||
| 10 | 1.507 | Harbin-centred region | The central and eastern parts of Heilongjiang Province, Siping and Songyuan of Jilin Province | ||||||
| VI | Highly inflow region | 14 | 1.345 | Sichuan-Chongqing region | Chongqing and the provinces of Chengdu, Deyang, Suining, Nanchong, Guang’an, Dazhou, and Ziyang | 18 | 1.353 | Sichuan-Chongqing region | Chongqing, Chengdu, Deyang, Mianyang and other Sichuan provinces |
| 18 | 1.518 | Northern Jiangsu | Northern Jiangsu, Bengbu, Huaibei, Chuzhou, Heze, and Shandong | 9 | 1.523 | Henan-northern Jiangsu region | North Jiangsu, Shandong, Anhui, Henan, Shanxi, Shaanxi and Hubei Provinces and other border areas | ||
| 6 | 1.619 | Guangdong-Guangxi region | The western part of Guangdong and the eastern part of Guangxi | 4 | 1.714 | South-eastern inland | Parts of Henan, Shaanxi, Hubei, Hunan, Jiangxi, Guangxi, Guangdong and Fujian Provinces | ||
| 4 | 1.871 | Central region | Parts of Anhui, Henan, Hubei, Hunan, Jiangxi and Guangxi Provinces | 8 | 1.717 | Shaanxi-Gansu border region | Southeast Gansu Province, Hanzhong and Baoji | ||
| 11 | 2.349 | Southern Guangdong | Zhanjiang and Maoming | 7 | 1.794 | South of Guangxi, Guangdong | South Guangxi, Zhanjiang and Maoming | ||
Publisher’s Note: MDPI stays neutral with regard to jurisdictional claims in published maps and institutional affiliations. |
© 2021 by the authors. Licensee MDPI, Basel, Switzerland. This article is an open access article distributed under the terms and conditions of the Creative Commons Attribution (CC BY) license (https://creativecommons.org/licenses/by/4.0/).
Share and Cite
Xiao, Z.; Bi, M.; Zhong, Y.; Feng, X.; Ma, H. Study on the Evolution of the Source-Flow-Sink Pattern of China’s Chunyun Population Migration Network: Evidence from Tencent Big Data. Urban Sci. 2021, 5, 66. https://doi.org/10.3390/urbansci5030066
Xiao Z, Bi M, Zhong Y, Feng X, Ma H. Study on the Evolution of the Source-Flow-Sink Pattern of China’s Chunyun Population Migration Network: Evidence from Tencent Big Data. Urban Science. 2021; 5(3):66. https://doi.org/10.3390/urbansci5030066
Chicago/Turabian StyleXiao, Zeping, Manyu Bi, Yexi Zhong, Xinghua Feng, and Hongzhi Ma. 2021. "Study on the Evolution of the Source-Flow-Sink Pattern of China’s Chunyun Population Migration Network: Evidence from Tencent Big Data" Urban Science 5, no. 3: 66. https://doi.org/10.3390/urbansci5030066
APA StyleXiao, Z., Bi, M., Zhong, Y., Feng, X., & Ma, H. (2021). Study on the Evolution of the Source-Flow-Sink Pattern of China’s Chunyun Population Migration Network: Evidence from Tencent Big Data. Urban Science, 5(3), 66. https://doi.org/10.3390/urbansci5030066


