Are Knowledge-Intensive Services an Urban Growth Factor in the Global Periphery? (Un)Fulfilled Possibilities in the Large Metropolitan Areas of Mexico


Abstract
:1. Introduction
2. Knowledge, Economic Transformation, and the Urban Milieu
- (i)
- Do larger Mexican metropolitan areas concentrate the best and most qualified employment of KIS, as in big cities of developed countries like Canada or England?
- (ii)
- Do agglomeration economies have a similar effect over KIS, independently of its type of knowledge?
- (iii)
- And if so, is the positive effect constant over time?
3. Data and Methodology
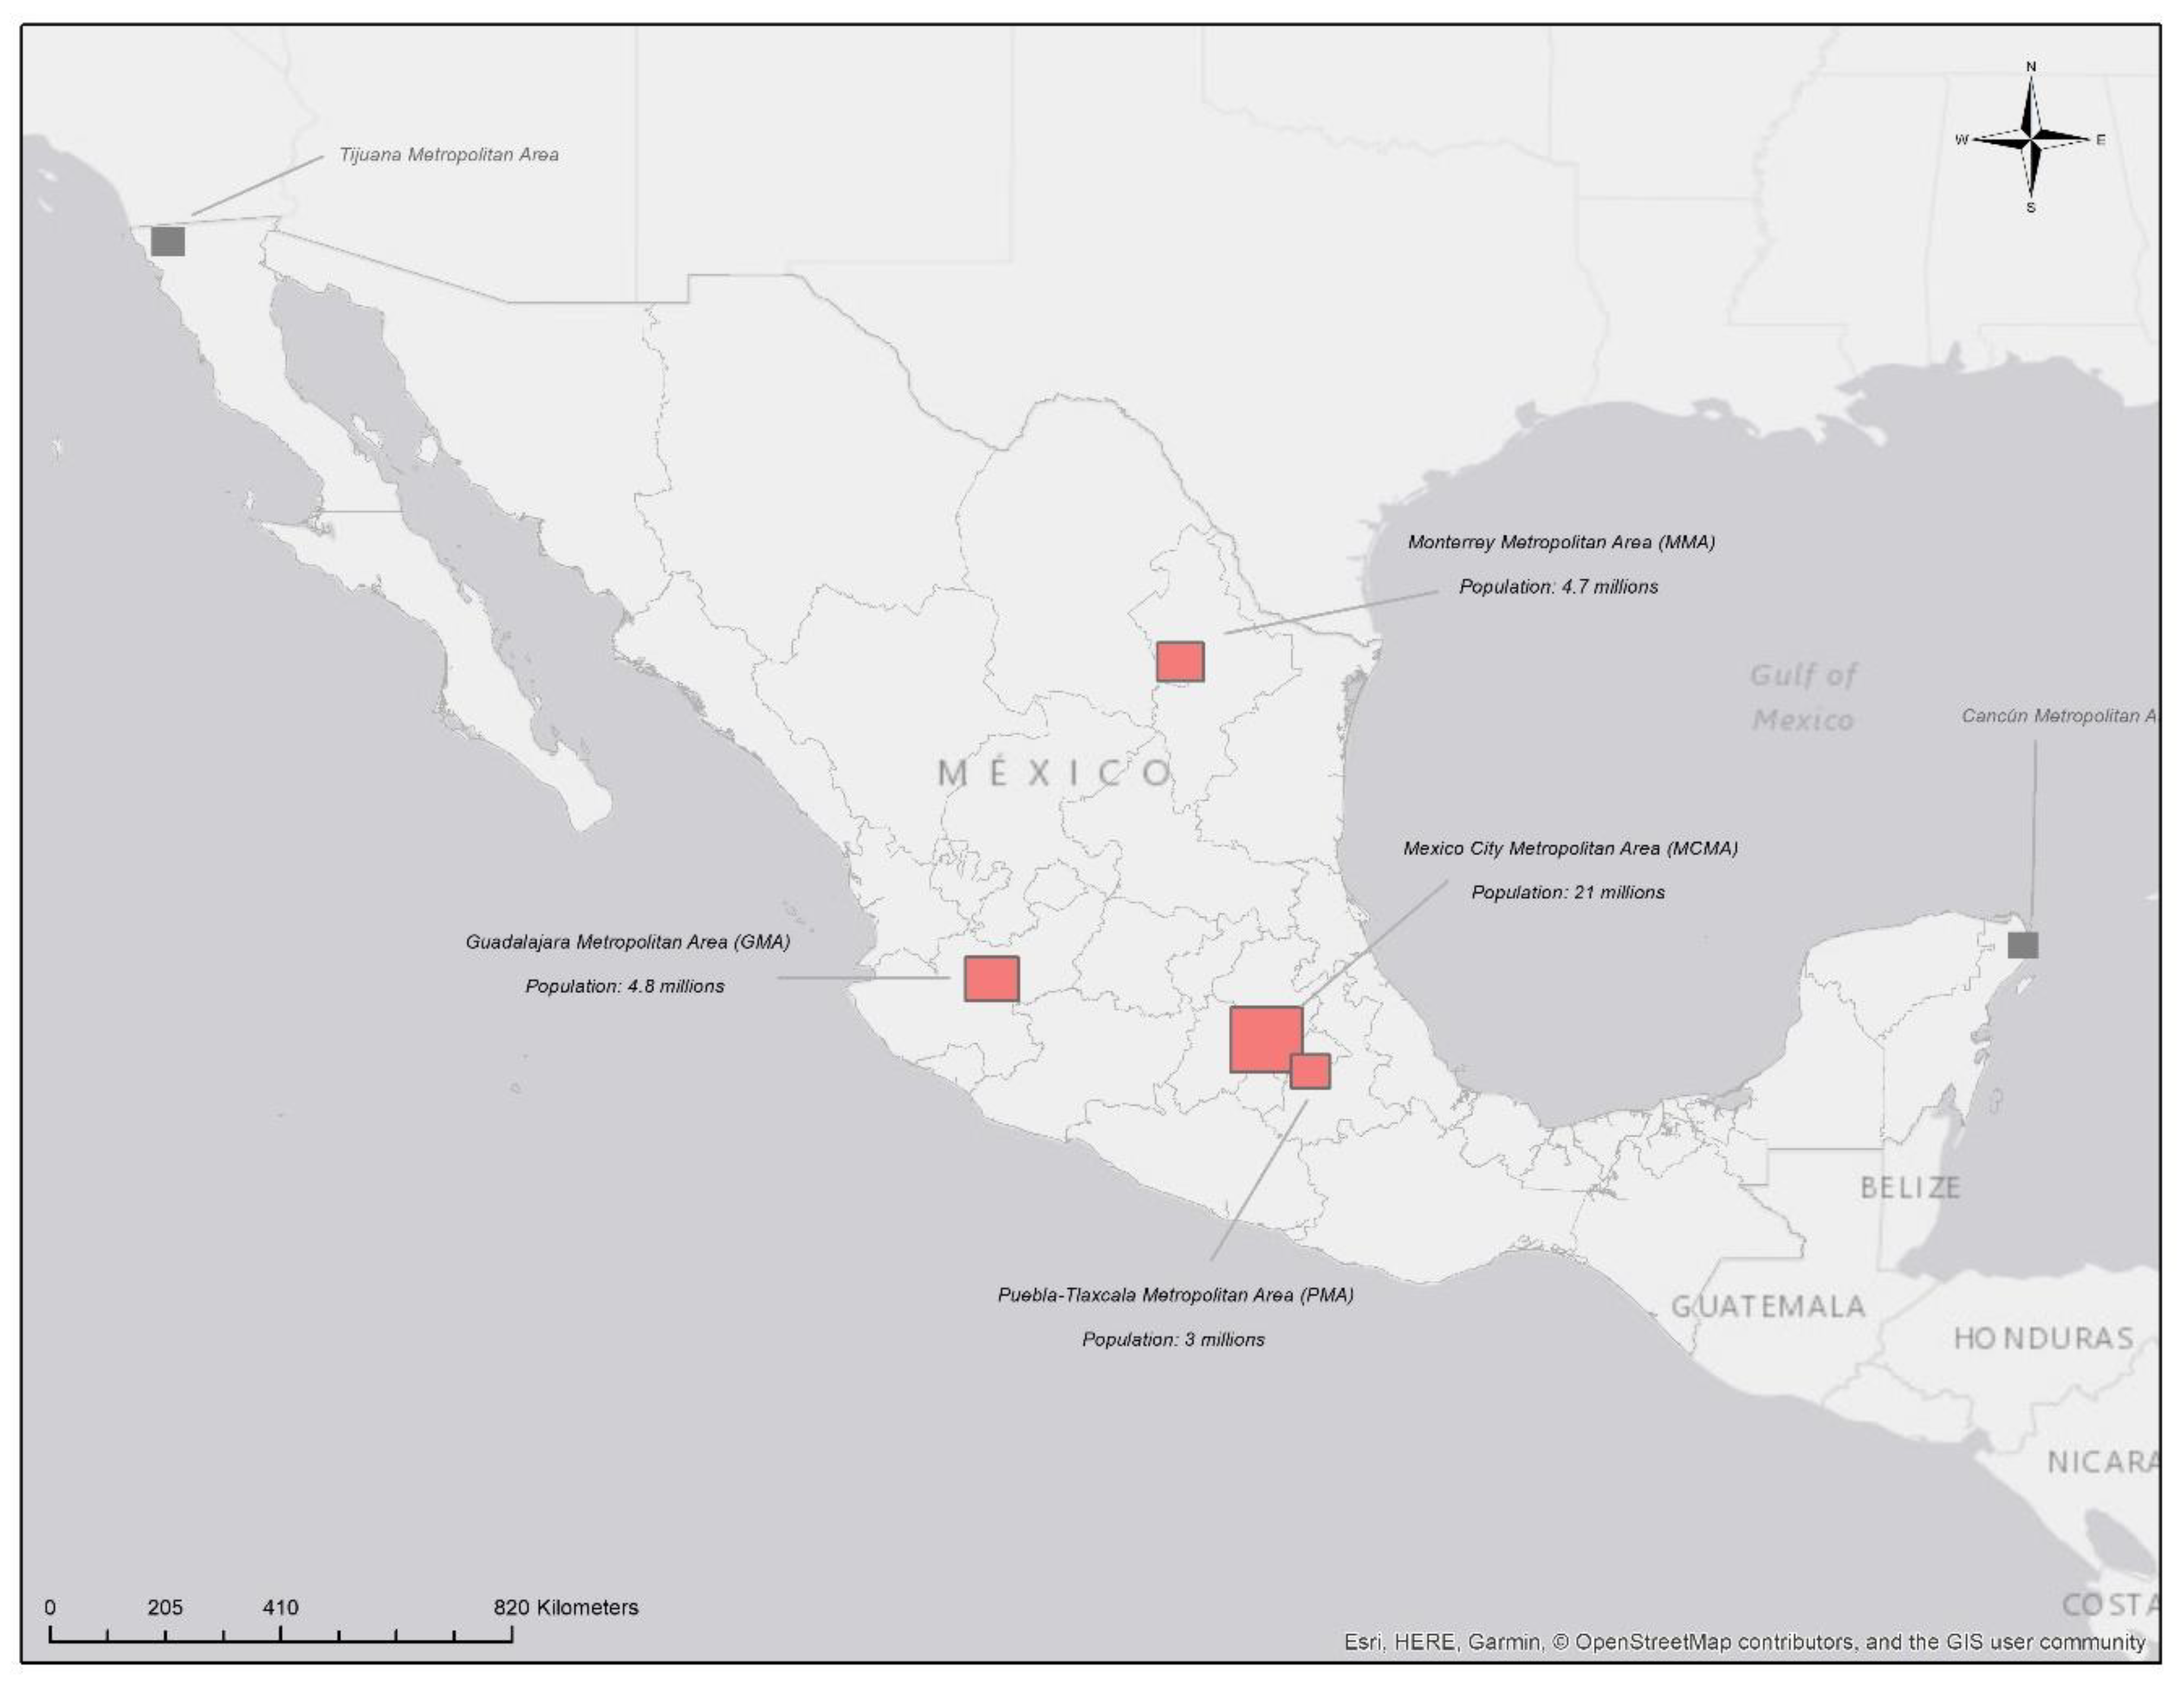
3.1. The Four Cases
3.2. Data and Indicators
4. Results
4.1. Location
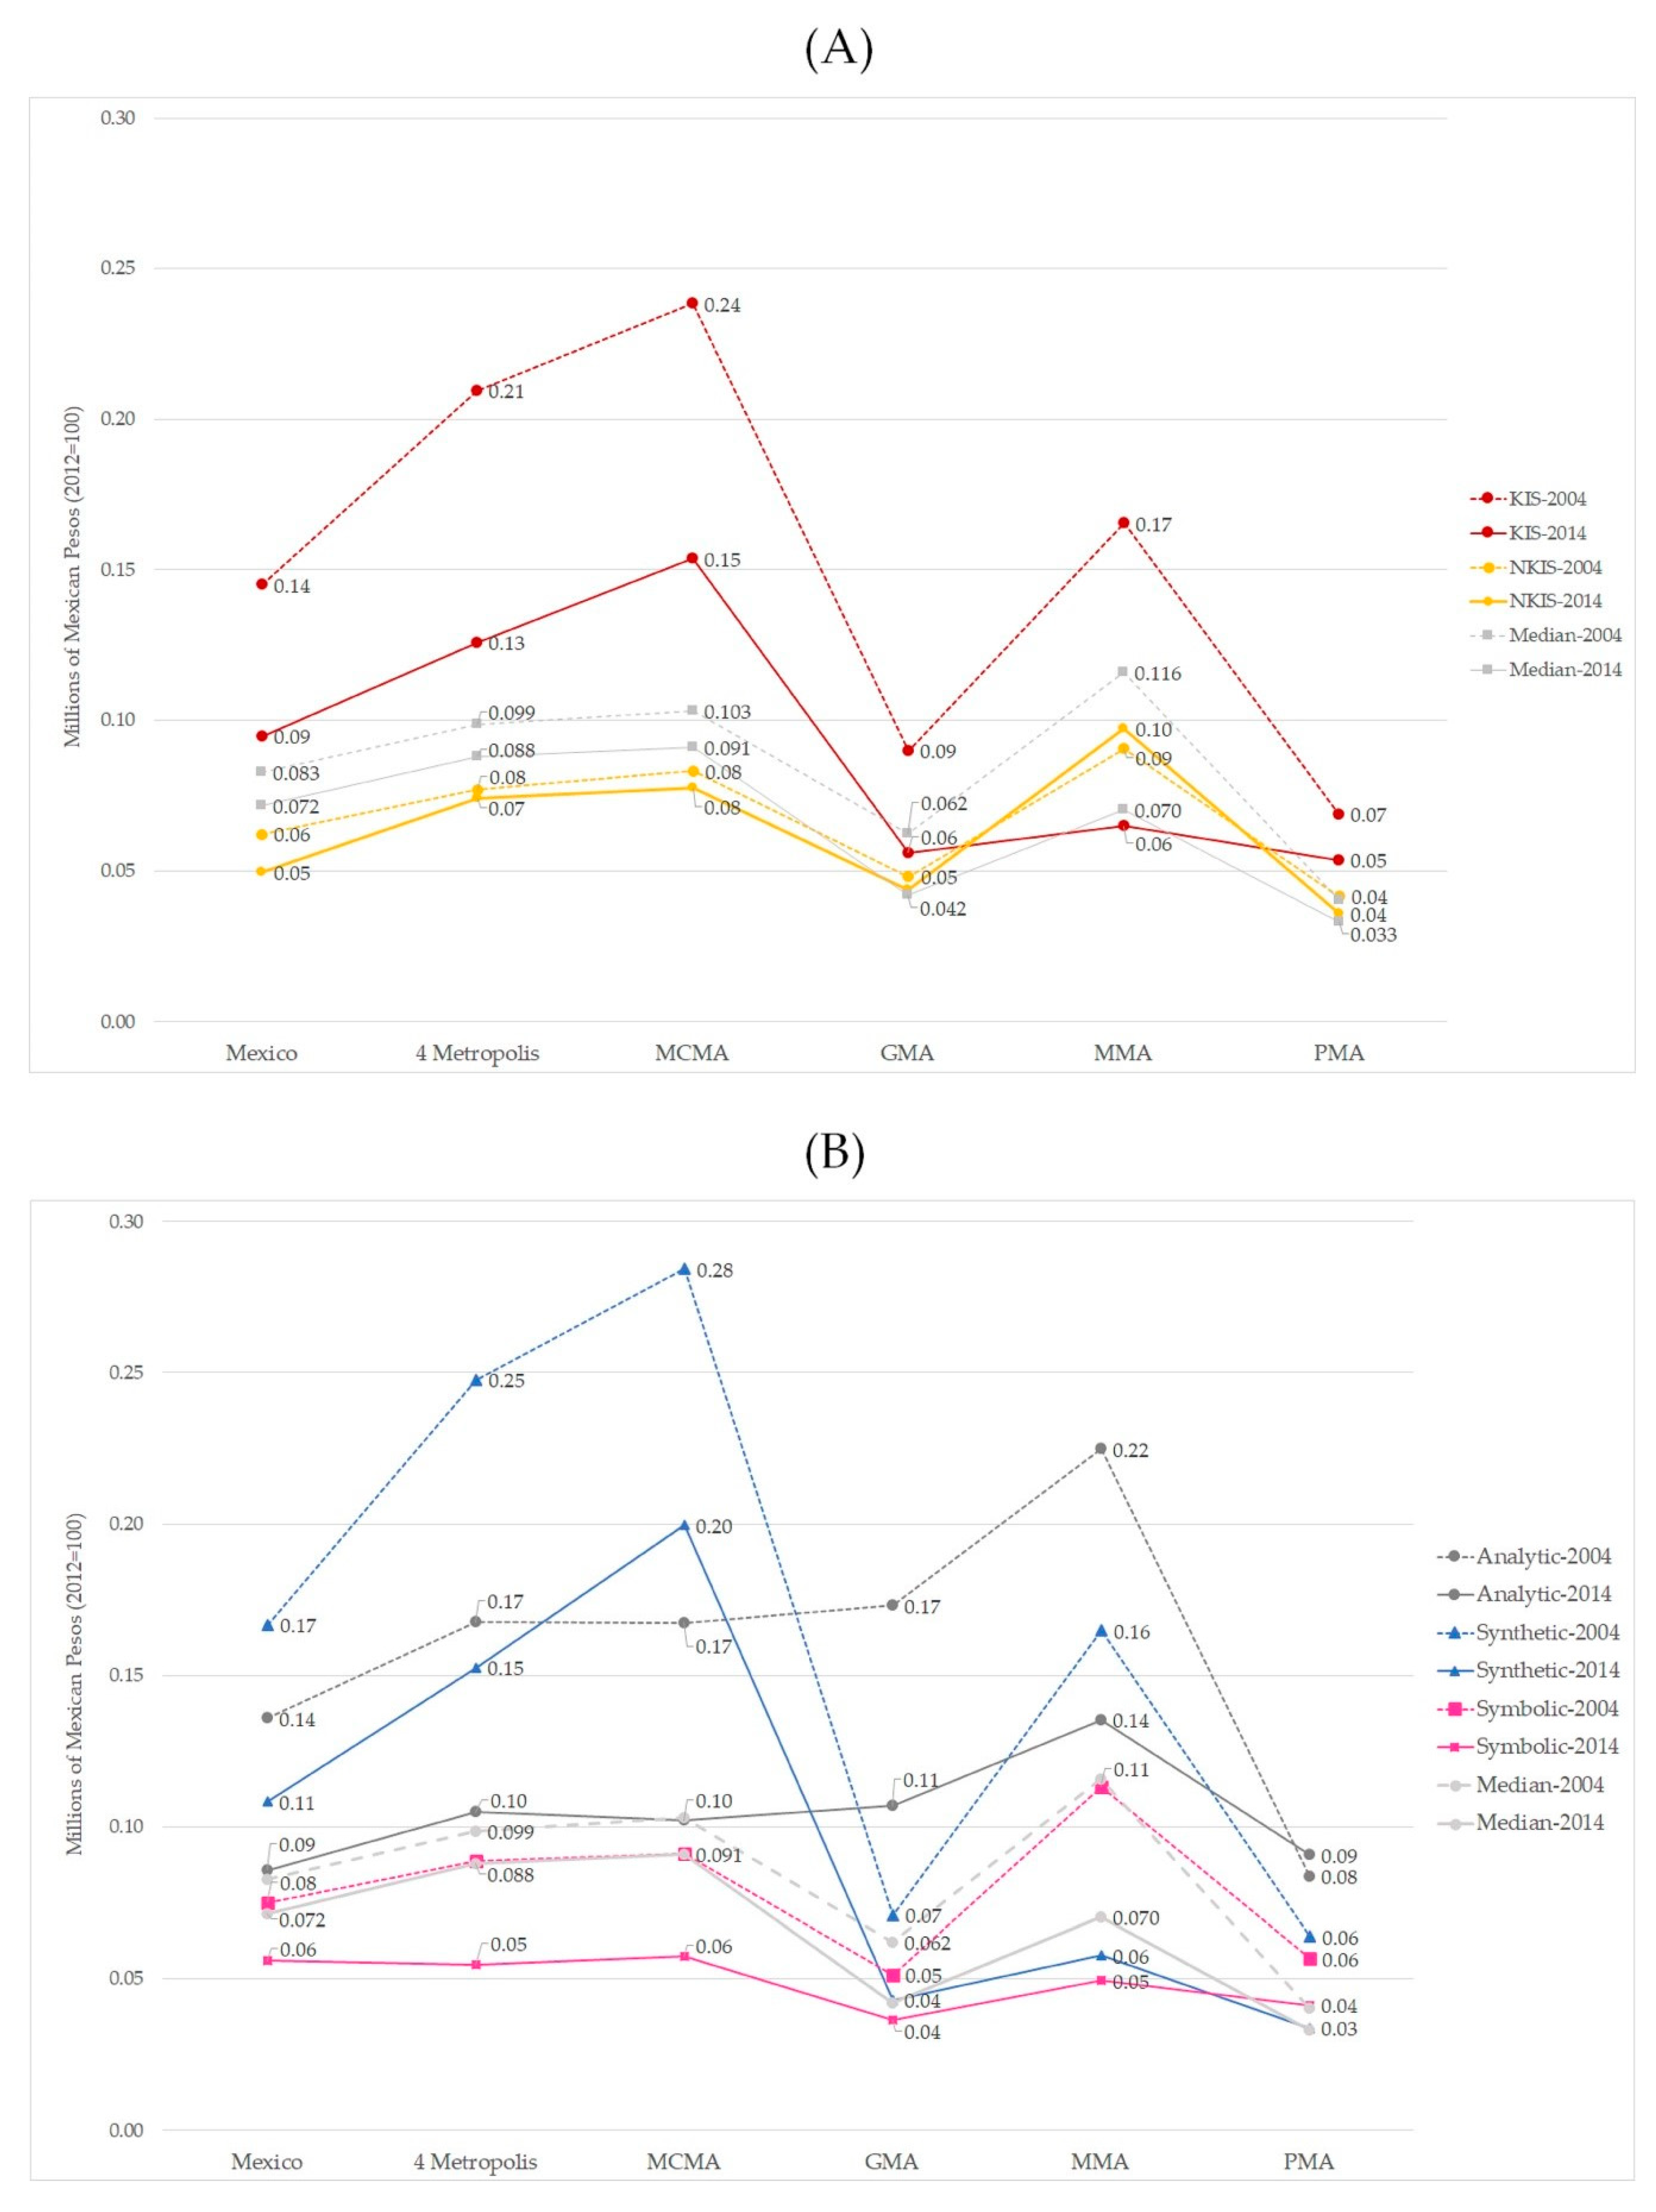
4.2. Productivity
4.3. Average Salaries
5. Discussion and Concluding Remarks
Author Contributions
Funding
Conflicts of Interest
Appendix A

| Absolut | Growth | |||||||||||||||||
|---|---|---|---|---|---|---|---|---|---|---|---|---|---|---|---|---|---|---|
| A | B | C | D | E | F | A | B | C | D | E | F | |||||||
| 2004 | 2014 | 2004 | 2014 | 2004 | 2014 | 2004 | 2014 | 2004 | 2014 | 2004 | 2014 | |||||||
| Total | 0.31 | 0.27 | 0.35 | 0.30 | 0.38 | 0.33 | 0.24 | 0.19 | 0.36 | 0.33 | 0.28 | 0.24 | −12.9 | −12.9 | −13.3 | −21.6 | −7.5 | −12.0 |
| Agriculture a | 0.06 | 0.07 | 0.03 | 0.01 | 0.03 | 0.01 | 0.00 | 0.00 | 0.00 | 0.00 | 0.00 | 0.00 | 6.5 | −72.5 | −53.1 | 0.0 | 0.0 | 0.0 |
| Mining and extraction | 5.85 | 6.08 | −0.08 | −0.52 | −0.37 | −0.86 | 0.36 | −0.05 | 0.41 | 0.61 | 0.14 | 0.13 | 4.0 | 588.3 | 131.5 | −112.5 | 47.7 | −10.4 |
| Electricity | 1.34 | 1.13 | 1.96 | 1.86 | 1.84 | 1.90 | 3.05 | 0.00 | 1.54 | 1.15 | 0.00 | 0.00 | −15.5 | −5.3 | 3.1 | −100.0 | −25.1 | 0.0 |
| Construction | 0.14 | 0.18 | 0.15 | 0.21 | 0.14 | 0.23 | 0.11 | 0.17 | 0.23 | 0.20 | 0.16 | 0.15 | 32.8 | 33.8 | 61.3 | 51.4 | −13.4 | −8.7 |
| Manufacture | 0.34 | 0.33 | 0.35 | 0.35 | 0.31 | 0.29 | 0.30 | 0.31 | 0.45 | 0.41 | 0.51 | 0.50 | −1.9 | −2.3 | −4.4 | 1.4 | −9.2 | −3.4 |
| Trade and transportation | 0.18 | 0.15 | 0.23 | 0.18 | 0.24 | 0.18 | 0.22 | 0.16 | 0.26 | 0.19 | 0.16 | 0.15 | −17.4 | −23.1 | −22.7 | −26.4 | −25.7 | −7.8 |
| Services b | 0.29 | 0.21 | 0.44 | 0.32 | 0.53 | 0.37 | 0.14 | 0.11 | 0.32 | 0.36 | 0.13 | 0.09 | −28.2 | −26.6 | −31.3 | −24.6 | 15.3 | −33.0 |
| KIS c | 0.66 | 0.42 | 1.05 | 0.68 | 1.27 | 0.78 | 0.19 | 0.18 | 0.54 | 0.76 | 0.28 | 0.11 | −36.8 | −35.3 | −38.5 | −9.1 | 41.2 | −59.2 |
| Analytical | 0.22 | 0.16 | 0.29 | 0.18 | 0.28 | 0.19 | 0.28 | 0.17 | 0.42 | 0.20 | 0.18 | 0.17 | −30.3 | −37.4 | −33.7 | −38.8 | −53.2 | −8.2 |
| Synthetic | 0.84 | 0.56 | 1.33 | 0.94 | 1.59 | 1.12 | 0.17 | 0.20 | 0.59 | 0.91 | 0.38 | 0.09 | −33.2 | −29.3 | −29.8 | 16.1 | 53.1 | −75.3 |
| Symbolic | 0.31 | 0.16 | 0.41 | 0.18 | 0.44 | 0.20 | 0.16 | 0.08 | 0.42 | 0.14 | 0.16 | 0.06 | −50.6 | −55.6 | −55.2 | −50.4 | −66.9 | −61.8 |
| NKIS d | 0.18 | 0.15 | 0.21 | 0.22 | 0.23 | 0.24 | 0.13 | 0.09 | 0.24 | 0.27 | 0.09 | 0.08 | −12.9 | 4.6 | 5.8 | −31.3 | 9.7 | −9.6 |
| Descriptive Statistics | ||||||||||||||||||
| Average | 1.09 | 1.07 | 0.49 | 0.37 | 0.46 | 0.35 | 0.55 | 0.11 | 0.46 | 0.45 | 0.17 | 0.14 | −2.6 | −24.0 | −24.4 | −80.4 | −2.2 | −17.0 |
| Median | 0.26 | 0.26 | 0.22 | 0.21 | 0.23 | 0.24 | 0.21 | 0.13 | 0.34 | 0.34 | 0.15 | 0.12 | −1.4 | −3.4 | 2.0 | −39.3 | 0.4 | −20.3 |
| Maximum | 5.85 | 6.08 | 1.96 | 1.86 | 1.84 | 1.90 | 3.05 | 0.31 | 1.54 | 1.15 | 0.51 | 0.50 | 4.0 | −5.3 | 3.1 | −89.9 | −25.1 | −3.4 |
| 3rd Quartile | 0.83 | 0.60 | 0.53 | 0.43 | 0.55 | 0.41 | 0.32 | 0.17 | 0.47 | 0.65 | 0.19 | 0.15 | −28.2 | −18.7 | −24.2 | −47.1 | 36.8 | −23.3 |
| 2nd Quartile | 0.26 | 0.26 | 0.22 | 0.21 | 0.23 | 0.24 | 0.21 | 0.13 | 0.34 | 0.34 | 0.15 | 0.12 | −1.4 | −3.4 | 2.0 | −39.3 | 0.4 | −20.3 |
| 1st Quartile | 0.17 | 0.15 | 0.12 | 0.14 | 0.12 | 0.14 | 0.13 | 0.00 | 0.24 | 0.20 | 0.07 | 0.06 | −8.2 | 10.5 | 22.1 | −100.0 | −17.2 | −8.3 |
| Minimum | 0.06 | 0.07 | −0.08 | −0.52 | −0.37 | −0.86 | 0.00 | −0.05 | 0.00 | 0.00 | 0.00 | 0.00 | 6.5 | 588.3 | 131.5 | 0.0 | 0.0 | 0.0 |
| Standard deviation | 1.97 | 2.06 | 0.69 | 0.69 | 0.72 | 0.78 | 1.02 | 0.12 | 0.47 | 0.37 | 0.17 | 0.16 | 4.5 | 0.6 | 7.1 | −88.4 | −19.7 | −6.8 |
| Coef. Var. | 0.00 | 0.00 | 0.00 | 0.00 | 0.00 | 0.00 | 0.00 | 0.00 | 0.00 | 0.00 | 0.00 | 0.00 | 7.3 | 32.4 | 41.7 | −40.7 | −17.8 | 12.4 |
| Absolute | Growth | |||||||||||||||||
|---|---|---|---|---|---|---|---|---|---|---|---|---|---|---|---|---|---|---|
| A | B | C | D | E | F | A | B | C | D | E | F | |||||||
| 2004 | 2014 | 2004 | 2014 | 2004 | 2014 | 2004 | 2014 | 2004 | 2014 | 2004 | 2014 | |||||||
| Total | 0.08 | 0.06 | 0.10 | 0.08 | 0.11 | 0.09 | 0.07 | 0.06 | 0.11 | 0.09 | 0.07 | 0.06 | −18.3 | −17.5 | −17.2 | −19.3 | −19.3 | −14.6 |
| Agriculture a | 0.02 | 0.01 | 0.01 | 0.00 | 0.01 | 0.00 | 0.00 | 0.00 | 0.00 | 0.00 | 0.00 | 0.00 | −4.9 | −79.3 | −63.8 | 0.0 | 0.0 | 0.0 |
| Mining and extraction | 0.22 | 0.29 | 0.32 | 0.72 | 0.43 | 1.04 | 0.07 | 0.02 | 0.17 | 0.08 | 0.03 | 0.03 | 34.4 | 122.9 | 141.6 | −76.3 | −56.3 | −16.6 |
| Electricity | 0.22 | 0.27 | 0.25 | 0.42 | 0.23 | 0.44 | 0.33 | 0.00 | 0.25 | 0.20 | 0.00 | 0.00 | 23.9 | 67.3 | 87.3 | −100.0 | −21.9 | 0.0 |
| Construction | 0.05 | 0.05 | 0.05 | 0.05 | 0.06 | 0.05 | 0.04 | 0.05 | 0.06 | 0.05 | 0.05 | 0.06 | 11.7 | −4.1 | −15.7 | 28.2 | −9.6 | 25.7 |
| Manufacture | 0.10 | 0.09 | 0.12 | 0.10 | 0.12 | 0.10 | 0.09 | 0.08 | 0.14 | 0.11 | 0.11 | 0.10 | −12.9 | −15.6 | −15.3 | −12.6 | −20.1 | −8.8 |
| Trade and transportation | 0.05 | 0.04 | 0.07 | 0.05 | 0.07 | 0.05 | 0.05 | 0.04 | 0.07 | 0.06 | 0.04 | 0.03 | −23.3 | −31.3 | −35.1 | −23.0 | −22.4 | −22.2 |
| Services b | 0.08 | 0.06 | 0.11 | 0.09 | 0.13 | 0.09 | 0.06 | 0.05 | 0.11 | 0.09 | 0.05 | 0.04 | −27.7 | −24.1 | −26.1 | −18.2 | −16.9 | −17.2 |
| KIS c | 0.14 | 0.09 | 0.21 | 0.13 | 0.24 | 0.15 | 0.09 | 0.06 | 0.17 | 0.06 | 0.07 | 0.05 | −34.6 | −39.9 | −35.5 | −37.7 | −60.8 | −21.9 |
| Analytical | 0.14 | 0.09 | 0.17 | 0.10 | 0.17 | 0.10 | 0.17 | 0.11 | 0.22 | 0.14 | 0.08 | 0.09 | −36.8 | −37.4 | −39.0 | −38.2 | −39.8 | 8.4 |
| Synthetic | 0.17 | 0.11 | 0.25 | 0.15 | 0.28 | 0.20 | 0.07 | 0.04 | 0.16 | 0.06 | 0.06 | 0.03 | −35.1 | −38.4 | −29.8 | −39.4 | −65.0 | −47.1 |
| Symbolic | 0.08 | 0.06 | 0.09 | 0.05 | 0.09 | 0.06 | 0.05 | 0.04 | 0.11 | 0.05 | 0.06 | 0.04 | −25.4 | −38.5 | −37.1 | −28.8 | −56.5 | −27.2 |
| NKIS d | 0.06 | 0.05 | 0.08 | 0.07 | 0.08 | 0.08 | 0.05 | 0.04 | 0.09 | 0.10 | 0.04 | 0.04 | −20.2 | −3.6 | −6.8 | −9.3 | 7.2 | −14.3 |
| Descriptive Statistics | ||||||||||||||||||
| Average | 0.11 | 0.11 | 0.14 | 0.19 | 0.16 | 0.24 | 0.09 | 0.04 | 0.12 | 0.08 | 0.04 | 0.04 | 5.2 | 39.1 | 53.5 | −59.5 | −31.2 | −9.7 |
| Median | 0.08 | 0.07 | 0.10 | 0.09 | 0.10 | 0.09 | 0.06 | 0.04 | 0.12 | 0.07 | 0.04 | 0.03 | −13.7 | −10.9 | −11.9 | −32.4 | −39.2 | −18.1 |
| Maximum | 0.22 | 0.29 | 0.32 | 0.72 | 0.43 | 1.04 | 0.33 | 0.08 | 0.25 | 0.20 | 0.11 | 0.10 | 32.0 | 122.9 | 141.6 | −74.8 | −21.9 | −8.8 |
| 3rd Quartile | 0.16 | 0.14 | 0.22 | 0.20 | 0.23 | 0.22 | 0.09 | 0.05 | 0.17 | 0.10 | 0.05 | 0.05 | −14.4 | −9.1 | −4.2 | −39.7 | −39.8 | 6.2 |
| 2nd Quartile | 0.08 | 0.07 | 0.10 | 0.09 | 0.10 | 0.09 | 0.06 | 0.04 | 0.12 | 0.07 | 0.04 | 0.03 | −13.7 | −10.9 | −11.9 | −32.4 | −39.2 | −18.1 |
| 1st Quartile | 0.05 | 0.05 | 0.06 | 0.05 | 0.07 | 0.05 | 0.05 | 0.01 | 0.07 | 0.05 | 0.02 | 0.02 | −4.7 | −19.9 | −26.6 | −72.6 | −19.7 | −16.1 |
| Minimum | 0.02 | 0.01 | 0.01 | 0.00 | 0.01 | 0.00 | 0.00 | 0.00 | 0.00 | 0.00 | 0.00 | 0.00 | −4.9 | −79.3 | −63.8 | 0.0 | 0.0 | 0.0 |
| Standard deviation | 0.08 | 0.11 | 0.11 | 0.25 | 0.14 | 0.35 | 0.10 | 0.03 | 0.08 | 0.06 | 0.04 | 0.03 | 36.5 | 124.7 | 154.2 | −70.9 | −27.9 | −8.4 |
| Coef. Var. | 0.00 | 0.00 | 0.00 | 0.00 | 0.00 | 0.00 | 0.00 | 0.00 | 0.00 | 0.00 | 0.00 | 0.00 | 29.8 | 61.6 | 65.6 | −28.2 | 4.8 | 1.4 |
References
- Shearmur, R.; Doloreux, D. KIBS as both innovators and knowledge intermediaries in the innovation process: Intermediation as a contingent role. Pap. Reg. Sci. 2018, 98, 191–209. [Google Scholar] [CrossRef] [Green Version]
- Glückler, J.; Hammer, I. A new service typology: Geographical diversity and dynamics of the German service economy. In Service Industries and Regions: Growth, Location and Regional Effects; Cuadrado-Roura, J.R., Ed.; Springer: New York, NY, USA, 2014; pp. 339–364. [Google Scholar]
- Gallouj, F.; Savona, M. Innovation in services: A review of the debate and a research agenda. J. Evol. Econ. 2009, 19, 149–172. [Google Scholar] [CrossRef]
- Mudambi, R. Location, control and innovation in knowledge-intensive industries. J. Econ. Geogr. 2008, 8, 699–725. [Google Scholar] [CrossRef]
- Graizbord, B.; Santiago, L.E. Ciudades y conocimiento. Clase creativa y servicios de alto contenido de conocimiento en las zonas metropolitanas de México. In Desarrollo Urbano y Metropolitano en México; Sobrino, J., Ugalde, V., Eds.; El Colegio de México: Mexico City, Mexico, 2019; pp. 205–251. [Google Scholar]
- Pina, K.; Tether, B.S. Towards understanding variety in knowledge intensive business services by distinguishing their knowledge base. Res. Policy 2016, 45, 401–413. [Google Scholar] [CrossRef] [Green Version]
- Gallego, M.; Maroto, S. The specialization in knowledge-intensive business services (KIBS) across Europe: Permanent co-localization to debate. Reg. Stud. 2015, 49, 644–664. [Google Scholar] [CrossRef]
- Shearmur, R.; Doloreux, D. Central places or networks? Paradigms, metaphors, and spatial configurations of innovation-related service use. Environ. Plan. A 2015, 47, 1521–1539. [Google Scholar] [CrossRef]
- Angoa, I.; Pérez-Mendoza, S.; Polèse, M. Los tres Méxicos: Análisis de la distribución del empleo en la industria y los servicios superiores, por tamaño urbano y región. EURE 2009, 35, 121–143. [Google Scholar] [CrossRef] [Green Version]
- Camagni, R. Regional clusters, regional competencies and regional competition. In Proceedings of the International Conference on Cluster Management in Structural Policy-International Experiences and Consequences for Northrhine-Westfalia, Duisburg, Germany, 5 December 2003; Available online: http://citeseerx.ist.psu.edu/viewdoc/download?doi=10.1.1.197.4247&rep=rep1&type=pdf (accessed on 10 October 2020).
- Glaeser, E.; Gottlieb, J. The Wealth of Cities: Agglomeration Economies and Spatial Equilibrium in the US; Technical Report No. 14806; National Bureau of Economic Research: Cambridge, MA, USA, 2020. [Google Scholar]
- Echeverri-Carroll, E.; Ayala, S. Urban wages: Does city size matter? Urban Stud. 2011, 48, 253–271. [Google Scholar] [CrossRef]
- Piore, M.; Sabel, C. The Second Industrial Divide: Possibilities for Prosperity; Basic Books: New York, NY, USA, 1984. [Google Scholar]
- Fisher, A. Progreso Económico y Seguridad Social; Fondo de Cultura Económica: Mexico City, Mexico, 1949. [Google Scholar]
- Clark, C. Las Condiciones del Progreso Económico; Alianza: Madrid, Spain, 1980. [Google Scholar]
- Piketty, T. El capital en el Siglo XXI; Fondo de Cultura Económica: Mexico City, Mexico, 2014. [Google Scholar]
- Shearmur, R.; Doloreux, D. Urban hierarchy or local buzz? High-order producer services and (or) knowledge-intensive business services innovation. Prof. Geogr. 2008, 60, 333–355. [Google Scholar] [CrossRef]
- Zhang, C. Agglomeration of knowledge intensive business services and urban productivity. Pap. Reg. Sci. 2016, 95, 801–818. [Google Scholar] [CrossRef]
- Zhang, C. Agglomeration economies and performance in knowledge-intensive business services. Singap. Econ. Rev. 2020, 65, 457–469. [Google Scholar] [CrossRef]
- Sobrino, J.L. Entre mitos y realidades: Ciudades mexicanas que concentran clase creativa. Estudios Demográficos y Urbanos 2016, 31, 501–522. [Google Scholar] [CrossRef] [Green Version]
- Vendrell-Herrero, F.; Darko, C.K.; Ghauri, P. Knowledge management competences, exporting and productivity: Uncovering African paradoxes. J. Knowl. Manag. 2019, 24, 81–104. [Google Scholar] [CrossRef]
- Santos, J. Knowledge-intensive business services and innovation performance in Brazil. Innov. Manag. Rev. 2019, 17, 58–74. [Google Scholar] [CrossRef]
- Hall, P. The world’s urban systems: A European perspective. Glob. Urban Dev. 2005, 1, 1–12. [Google Scholar]
- Howells, J.; Ramlogan, R.; Cheng, S. Innovation and university collaboration: Paradox and complexity within the knowledge economy. Camb. J. Econ. 2012, 36, 703–721. [Google Scholar] [CrossRef]
- Audretsch, D.; Keilbach, M. Resolving the knowledge paradox: Knowledge-spillover entrepreneurship and economic growth. Res. Policy 2008, 37, 1697–1705. [Google Scholar] [CrossRef]
- Florida, R. Cities and the Creative Class; Routledge: Abingdon, UK, 2005. [Google Scholar]
- Florida, R.; Mellander, C. The geography of inequality: Difference and determinants of wage and income inequality across US metros. Reg. Stud. 2016, 50, 79–92. [Google Scholar] [CrossRef]
- Autor, D.; Katz, L.; Salomons, M. The Polarization of the US labor market. Am. Econ. Rev. 2006, 96, 189–194. [Google Scholar] [CrossRef] [Green Version]
- Maroto, A.; Rubalcaba, L. Services productivity revisited. Serv. Ind. J. 2008, 28, 337–353. [Google Scholar] [CrossRef]
- De Fuentes, C.; Dutrenit, G.; Santiago, F.; Gras, N. Determinants of innovation and productivity in the service sector in Mexico. Emerg. Mark. Financ. Tr. 2015, 51, 578–592. [Google Scholar] [CrossRef] [Green Version]
- Álvarez, R.; Bravo-Ortega, C.; Zahler, A. Innovation and productivity in services: Evidence from Chile. Emerg. Mark. Financ. Tr. 2015, 51, 593–611. [Google Scholar] [CrossRef] [Green Version]
- Masso, J.; Vahter, P. The Link between Innovation and Productivity in Estonia’s Service Sectors; Technical Report No. 1012; William Davidson Institute: Michigan, MI, USA, 2012. [Google Scholar]
- Hipp, C.; Grupp, H. Innovation in the service sector: The demand for service-specific innovation measurement concepts and typologies. Res. Policy 2005, 34, 517–535. [Google Scholar] [CrossRef]
- Manning, A. We can work it out: The impact of technological change on the demand for low-skill workers. Scott. J. Political Econ. 2004, 51, 581–608. [Google Scholar] [CrossRef] [Green Version]
- Warf, B. Introduction: Geography, technology, society. In Handbook on Geographies of Technology; Warf, B., Ed.; Edward Elgar Publishing: Northampton, MA, USA, 2017; pp. 1–13. [Google Scholar]
- Dicken, P. Global Shift: Mapping the Changing Contours of the World Economy, 7th ed.; SAGE Publications: London, UK, 2015. [Google Scholar]
- Bryson, J. The second global shift: The offshoring or global sourcing of corporate services and the rise of distanciated emotional labour. Geogr. Ann. B Hum. Geogr. 2007, 89, 31–43. [Google Scholar] [CrossRef]
- Autor, D.; Dorn, D. The growth of low-skill service jobs and the polarization of the US labor market. Am. Econ. Rev. 2013, 103, 1553–1597. [Google Scholar] [CrossRef] [Green Version]
- Moretti, E. The New Geography of Jobs; Mariner Books: New York, NY, USA, 2013. [Google Scholar]
- Castells, M. The Rise of the Network Society; Wiley-Blackwell: Oxford, UK, 1996. [Google Scholar]
- Daniels, P.; Bryson, J. Manufacturing services and servicing manufacturing: Knowledge-based cities and changing forms of production. Urban Stud. 2002, 39, 977–991. [Google Scholar] [CrossRef]
- Hall, P. Looking backward, looking forward: The city region of the mid-21st century. Reg. Stud. 2009, 6, 803–817. [Google Scholar] [CrossRef]
- Asheim, B. Innovating: Creativity, innovation and the role of cities in the globalizing knowledge economy. In Building Prosperous Knowledge Cities: Policies, Plans and Metrics; Yigitcanlar, T., Metaxiotis, K., Carrillo, F., Eds.; Edward Elgar Publishing: Northampton, MA, USA, 2012; pp. 3–23. [Google Scholar]
- Moomaw, R. Productivity and city size: A Critique of the evidence. Q. J. Econ. 1981, 4, 675–688. [Google Scholar] [CrossRef]
- Glaeser, E.; Maré, D. Cities and skills. J. Labour Econ. 2001, 19, 316–342. [Google Scholar] [CrossRef]
- Bryson, J.; Rusten, G. Spatial Divisions of expertise: Knowledge intensive business service firms and regional development in Norway. Serv. Ind. J. 2005, 25, 959–977. [Google Scholar] [CrossRef]
- Wood, P. Urban development and knowledge-intensive business services: Too many unanswered questions? Growth Chang. 2006, 37, 335–361. [Google Scholar] [CrossRef]
- Andersson, M.; Lööf, H. Agglomeration and productivity: Evidence from firms-level data. Ann. Reg. Sci. 2011, 46, 601–620. [Google Scholar] [CrossRef] [Green Version]
- Chen, J.; Zhou, Q. City size and urban labor productivity in China: New evidence from spatial city-level panel data analysis. Econ. Syst. Res. 2017, 41, 165–178. [Google Scholar] [CrossRef]
- Ahrend, R.; Lembcke, A.; Schumann, A. The role of urban agglomerations for economic productivity growth. Int. Product. Monitor 2017, 32, 161–179. [Google Scholar]
- De la Roca, J.; Puga, D. Learning by working in big cities. Rev. Econ. Stud. 2017, 84, 106–142. [Google Scholar] [CrossRef]
- Combes, P.; Duranton, G.; Gobillon, L. Spatial wage disparities: Sorting matters! J. Urban Econ. 2007, 63, 723–742. [Google Scholar] [CrossRef] [Green Version]
- Abel, J.; Dey, I.; Gabe, T. Productivity and the density of human capital. J. Reg. Sci. 2012, 52, 562–586. [Google Scholar] [CrossRef] [Green Version]
- Jones, C.; Romer, P. The new Kaldor facts: Ideas, institutions, population and human capital. Am. Econ. J. Macroecon. 2010, 2, 224–245. [Google Scholar] [CrossRef] [Green Version]
- Storper, M.; Venables, A. Buzz: Face-to-face contact and the urban economy. J. Econ. Geogr. 2004, 4, 351–370. [Google Scholar] [CrossRef] [Green Version]
- Duranton, G.; Puga, D. Micro-foundations of urban agglomeration economies. In Handbook of Regional and Urban Economics; Henderson, J., Thisse, J., Eds.; Elsevier: London, UK, 2004; pp. 2063–2117. [Google Scholar]
- Puga, D. The Magnitude and causes of agglomeration economies. J. Reg. Sci. 2010, 50, 203–219. [Google Scholar] [CrossRef] [Green Version]
- Andersson, M.; Klaesson, J.; Larsson, J. The sources of the urban wage premium by worker skills: Spatial sorting or agglomeration economies? Pap. Reg. Sci. 2014, 93, 727–747. [Google Scholar] [CrossRef] [Green Version]
- Westeren, K. Innovation: From Schumpeter to the knowledge economy. In Foundation of the Knowledge Economy: Innovation, Learning and Clusters; Westeren, K., Ed.; Edward Elgar Publishing: Northampton, MA, USA, 2012; pp. 57–74. [Google Scholar]
- Sveikauskas, L. The productivity of cities. Q. J. Econ. 1975, 89, 393–413. [Google Scholar] [CrossRef]
- Lucas, R. On the mechanics of economic development. J. Monet. Econ. 1988, 22, 3–42. [Google Scholar] [CrossRef]
- Glaeser, E. Triumph of the City: How Our Greatest Invention Makes Us Richer, Smarter, Greener, Healthier and Happier; Penguin Books: London, UK, 2011. [Google Scholar]
- Gertler, M. Tacit knowledge and the economic geography of context, or the undefinable tacitness of being (there). J. Econ. Geogr. 2003, 3, 75–99. [Google Scholar] [CrossRef]
- Storper, M.; Kemeny, T.; Makarem, N.; Osman, T. The Rise and Fall of Urban Economies: Lessons from San Francisco and Los Angeles; Stanford University Press: Palo Alto, CA, USA, 2015. [Google Scholar]
- Van Winden, W.; Carvalho, L. Urbanize or perish? Assessing the urbanization of knowledge locations in Europe. J. Urban Technol. 2016, 23, 53–70. [Google Scholar] [CrossRef] [Green Version]
- Consejo Nacional de Población. Delimitación de las Zonas Metropolitanas de México. 2015. Available online: https://www.gob.mx/conapo/documentos/delimitacion-de-las-zonas-metropolitanas-de-mexico-2015 (accessed on 10 October 2020).
- Graizbord, B.; Rowland, A.; Aguilar, A.G. Mexico City as a peripheral global player: The two side of the coin. Ann. Reg. Sci. 2003, 37, 501–518. [Google Scholar] [CrossRef]
- United Nation. The World’s Cities in 2018. Available online: https://www.un.org/en/events/citiesday/assets/pdf/the_worlds_cities_in_2018_data_booklet.pdf (accessed on 10 October 2020).
- Romo, A.; Villalobos, A.; Toriz, A. Clusters and high technology industries in Mexico: A theoretical review. Organ. Stud. 2015, 2, 32–44. [Google Scholar]
- Santiago, L.E. The industries of the future in Mexico: Local and non-local effects in the localization of “knowledge-intensive services”. Growth Chang. 2020, 51, 584–606. [Google Scholar] [CrossRef]
- Ichikawa, I.; Yamato, N.; Dustan, P. Competitiveness of global cities from the perspective of the global power city index. Procedia Eng. 2017, 198, 736–742. [Google Scholar] [CrossRef]
- Berrone, P.; Ricart, J. IESE Cities in Motion Index 2018; IESE Business School, University of Navarra: Pamplona, Spain, 2018. [Google Scholar]
- Institute for Urban Strategies. Global Power City Index. 2019. Available online: http://www.mori-m-foundation.or.jp/pdf/GPCI2019_summary.pdf (accessed on 10 October 2020).
- Economist Intelligence Unit. Hot Spots 2025. Benchmarking the Future Competitiveness of Cities. 2013. Available online: https://www.citigroup.com/citi/citiforcities/pdfs/hotspots2025.pdf (accessed on 10 October 2020).
- Panreiter, C. Global cities in global commodity chains: Exploring the role of Mexico City in the geography of global economic governance. Glob. Netw. 2010, 10, 35–53. [Google Scholar] [CrossRef]
- National Institute of Statistics, Geography and Informatics (INEGI). Economic Censuses. 2004. Available online: http://en.www.inegi.org.mx/programas/ce/2004/ (accessed on 10 October 2020).
- National Institute of Statistics. Geography and Informatics (INEGI). 2014. Available online: http://en.www.inegi.org.mx/programas/ce/2014/ (accessed on 10 October 2020).
- Santiago, L.E. Ciudades, conocimiento e innovación: Estructura y Distribución Espacial de los Servicios Intensivos en Conocimiento Entre las Zonas Metropolitanas de México. Ph.D. Thesis, El Colegio de México, Mexico City, Mexico, 2016. [Google Scholar]
- OECD (Organisation for Economic Cooperation and Development). Measuring Productivity OECD Manual: Measurement of Aggregate and Industry-Level Productivity Growth. 2001. Available online: http://www.oecd.org/sdd/productivity-stats/2352458.pdf (accessed on 10 October 2020).
- Haltiwanger, J.; Lane, J.; Spletzer, J. Wages, productivity, and the dynamic interaction of businesses and workers. J. Labour Econ. 2007, 14, 575–602. [Google Scholar] [CrossRef] [Green Version]
- Lindley, J.; Machine, S. Spatial changes in labour market inequality. J. Urban Econ. 2014, 79, 121–138. [Google Scholar] [CrossRef] [Green Version]
- Shearmur, R. Are cities the font of innovation? A critical review of the literature on cities and innovation. Cities 2012, 29, 9–18. [Google Scholar] [CrossRef]


| Activity by Type of Knowledge | NAIC Classification by Sub-Branch |
|---|---|
| Analytic knowledge | |
| University education | 61131 |
| Specialized medicine | 62231 |
| Research and development | 54171, 54172 |
| Synthetic knowledge | |
| High-tech engineering | 54133, 54136, 54151, 54169 |
| Administration services | 54121, 54161, 55111 |
| Legal services | 54111, 54112, 54119 |
| Financial services | 52111, 52221, 52222, 523111, 52391, 52399 |
| Technical education | 61121, 61141, 61143, 61163 |
| Non-specialized medicine | 62111, 62121, 62131, 62132, 62133, 62134, 62139, 62211, 62221 |
| Diverse services | 54162, 54193, 54194, 54199, 61171 |
| Symbolic knowledge | |
| Massive communication media | 51112, 51113, 51511, 515122, 51521, 51913, 54181, 54182, 54184, 54186, 54191, 54192, 61162, 71121, 71131, 71132, 71141 |
| Cultural activities | 51211, 51219, 51222, 51223, 51224, 61161, 71111, 71112, 71113, 71151, 71211 |
| Design | 54131, 54132, 54141, 54142, 54143, 54149 |
| Employment | Added-Value (Millions of Pesos, 2012 = 100) | |||||||
|---|---|---|---|---|---|---|---|---|
| Mexico | 4 Metropolis a | Mexico | 4 Metropolis a | |||||
| 2004 | 2014 | 2004 | 2014 | 2004 | 2014 | 2004 | 2014 | |
| Total | 16,244,843 | 21,581,179 | 6,243,357 | 8,090,774 | 5,011,371.2 | 5,801,664.0 | 2,159,399.1 | 2,437,375.1 |
| Services b | 5,231,918 | 8,214,554 | 2,133,026 | 3,372,131 | 1,503,280.6 | 1,695,485.0 | 933,808.2 | 1,084,251.6 |
| KIS c | 1,192,134 | 1,628,575 | 575,792 | 739,284 | 788,297.5 | 680,626.2 | 605,064.4 | 502,613.9 |
| Analytical | 153,732 | 282,835 | 60,261 | 105,545 | 34,351.8 | 44,062.0 | 17,476.6 | 19,160.7 |
| Synthetic | 808,389 | 1,049,029 | 407,546 | 483,722 | 681,527.8 | 590,459.5 | 543,723.6 | 456,376.9 |
| Symbolic | 230,013 | 296,711 | 107,985 | 150,017 | 72,417.9 | 46,104.7 | 43,864.1 | 27,076.2 |
| NKIS d | 4,039,784 | 6,585,979 | 1,557,234 | 2,632,847 | 714,983.1 | 1,014,858.8 | 328,743.8 | 581,637.7 |
| Other sectors e | 11,012,925 | 13,366,625 | 4,110,331 | 4,718,643 | 3,508,090.7 | 4,106,178.9 | 1,225,591.0 | 1,353,123.5 |
| Percentage (%) | ||||||||
| Total | 100.00 | 100.00 | 38.43 | 37.49 | 100.00 | 100.00 | 43.09 | 42.01 |
| Services | 100.00 | 100.00 | 40.77 | 41.05 | 100.00 | 100.00 | 62.12 | 63.95 |
| KIS | 100.00 | 100.00 | 48.30 | 45.39 | 100.00 | 100.00 | 76.76 | 73.85 |
| Analytical | 100.00 | 100.00 | 39.20 | 37.32 | 100.00 | 100.00 | 50.88 | 43.49 |
| Synthetic | 100.00 | 100.00 | 50.41 | 46.11 | 100.00 | 100.00 | 79.78 | 77.29 |
| Symbolic | 100.00 | 100.00 | 46.95 | 50.56 | 100.00 | 100.00 | 60.57 | 58.73 |
| NKIS | 100.00 | 100.00 | 38.55 | 39.98 | 100.00 | 100.00 | 45.98 | 57.31 |
| Other sectors | 100.00 | 100.00 | 37.32 | 35.30 | 100.00 | 100.00 | 34.94 | 32.95 |
| Change 2004–2014 | ||||||||
| Total | 32.85 | 29.59 | 15.77 | 12.87 | ||||
| Services | 57.01 | 58.09 | 12.79 | 16.11 | ||||
| KIS | 36.61 | 28.39 | −13.66 | −16.93 | ||||
| Analytical | 83.98 | 75.15 | 28.27 | 9.64 | ||||
| Synthetic | 29.77 | 18.69 | −13.36 | −16.06 | ||||
| Symbolic | 29.00 | 38.92 | −36.34 | −38.27 | ||||
| NKIS | 63.03 | 69.07 | 41.94 | 76.93 | ||||
| Other sectors | 21.37 | 14.80 | 17.05 | 10.41 | ||||
Publisher’s Note: MDPI stays neutral with regard to jurisdictional claims in published maps and institutional affiliations. |
© 2020 by the authors. Licensee MDPI, Basel, Switzerland. This article is an open access article distributed under the terms and conditions of the Creative Commons Attribution (CC BY) license (http://creativecommons.org/licenses/by/4.0/).
Share and Cite
Graizbord, B.; Santiago, L.E. Are Knowledge-Intensive Services an Urban Growth Factor in the Global Periphery? (Un)Fulfilled Possibilities in the Large Metropolitan Areas of Mexico. Urban Sci. 2020, 4, 58. https://doi.org/10.3390/urbansci4040058
Graizbord B, Santiago LE. Are Knowledge-Intensive Services an Urban Growth Factor in the Global Periphery? (Un)Fulfilled Possibilities in the Large Metropolitan Areas of Mexico. Urban Science. 2020; 4(4):58. https://doi.org/10.3390/urbansci4040058
Chicago/Turabian StyleGraizbord, Boris, and Luis Enrique Santiago. 2020. "Are Knowledge-Intensive Services an Urban Growth Factor in the Global Periphery? (Un)Fulfilled Possibilities in the Large Metropolitan Areas of Mexico" Urban Science 4, no. 4: 58. https://doi.org/10.3390/urbansci4040058
APA StyleGraizbord, B., & Santiago, L. E. (2020). Are Knowledge-Intensive Services an Urban Growth Factor in the Global Periphery? (Un)Fulfilled Possibilities in the Large Metropolitan Areas of Mexico. Urban Science, 4(4), 58. https://doi.org/10.3390/urbansci4040058