1. Introduction
Climate change is a crisis that no government, industry, or law is seemingly able to solve [
1,
2]. The continual improvements in living standards around the globe have resulted in increased transportation activities and a consequential rise in excessive oil consumption and greenhouse gas emissions, further contributing to the spiraling health of the environment [
3]. Hence, there is a strong global argument for a wide deployment and uptake of fuel-efficient and alternative-fuel vehicles, in particular, electric vehicles (EVs) [
4]. EVs are commonly known as vehicles with motors that are powered by electricity rather than liquid fuels [
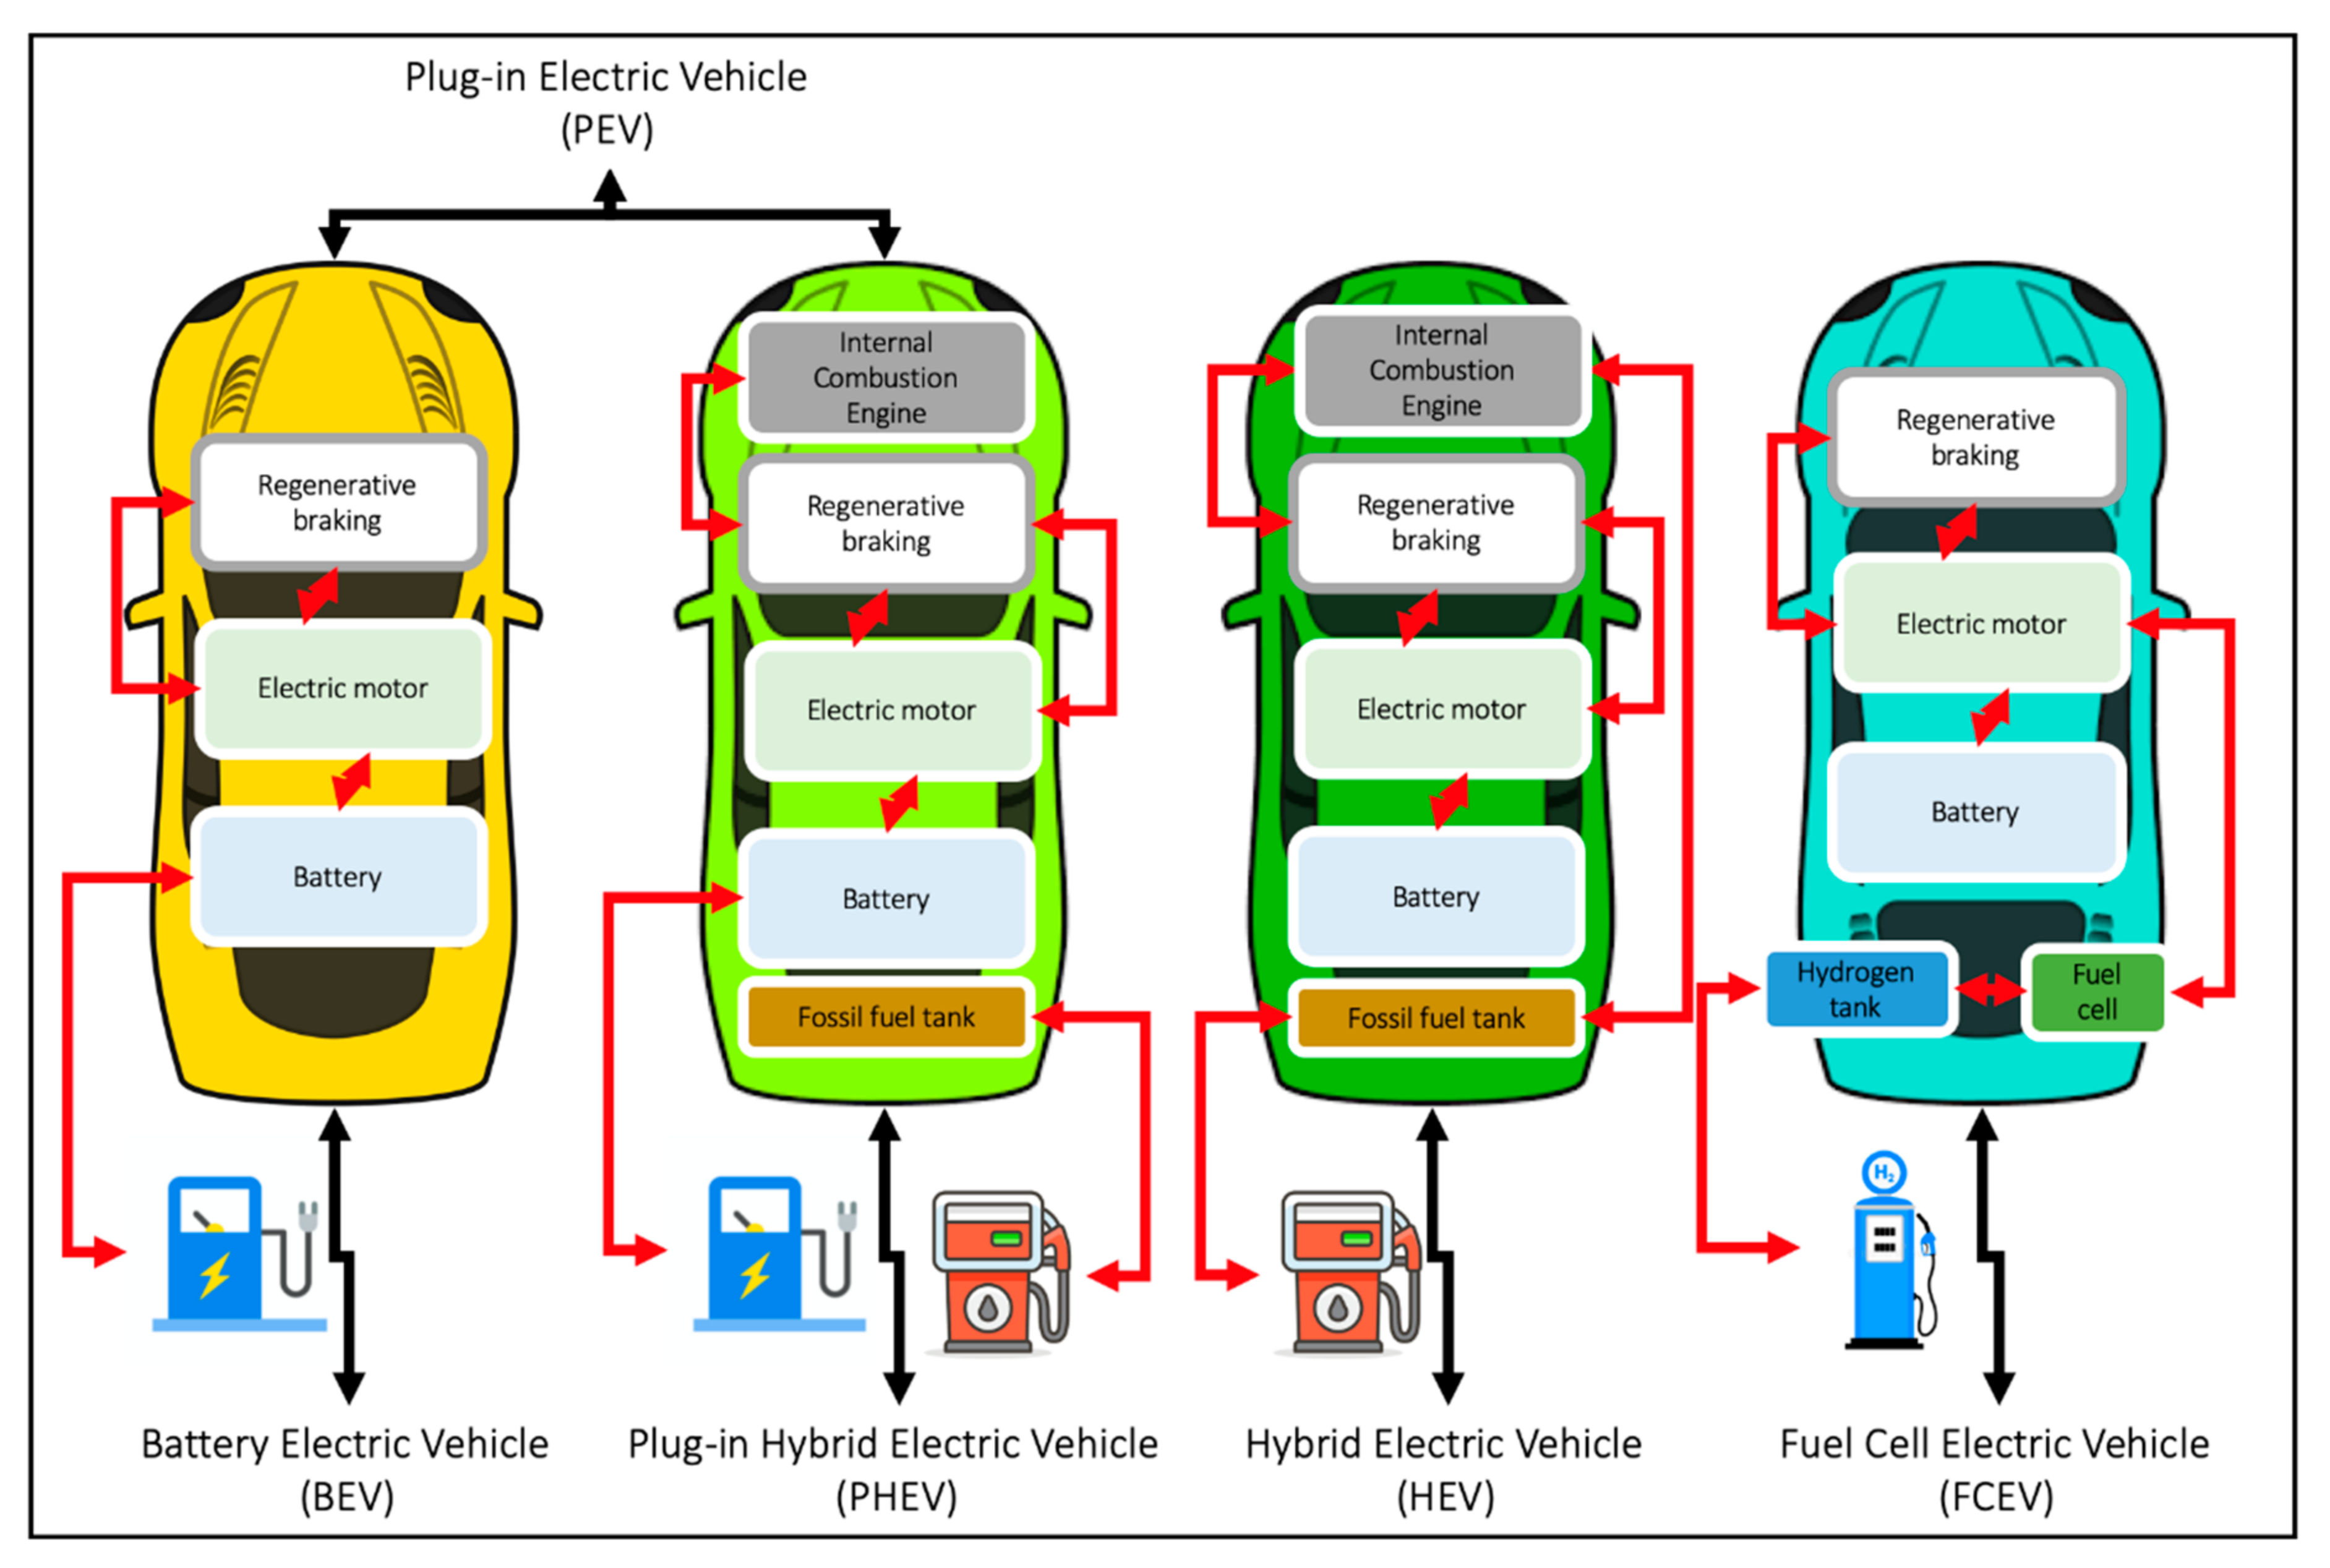
5]. Seen through
Figure 1 below, there are four types of EVs available, and these include the battery electric vehicle (BEV), plug-in hybrid electric vehicle (PHEV), hybrid electric vehicle (HEV) and fuel cell electric vehicle (FCEV) [
6].
Despite some efforts in shifting from internal combustion engines to electric motors, the global market share of EVs is very low—about 1%—and this figure actually goes even lower for some developed countries—e.g., Australia [
7]. A slow rate of uptake can be attributed to a range of critical factors that ultimately result in consumers maintaining their use of traditional internal combustion engine (ICE) vehicles [
8].
Essentially, EVs attract, on average, a higher upfront purchasing cost than many ICE vehicles [
9], creating an initial barrier to adoption [
10,
11]. In some cases, though, this barrier is offset by the allure of lower operational costs, such as the decrease or total elimination of petrol [
9]. As a result of high upfront cost, EV market share is primarily dominated by business purchase. For example, Palmer et al. [
12] found that a high adoption rate of EVs within the state of California compared to other US states was attributed to the prevalence of both individual and public wealth. Zhang et al. [
13] and Heidrich et al. [
14] further reinforced income and education level as statistical indicators of adoption rates, arguing that these factors are generally associated with environmental awareness and affordability.
Many studies have found that the environmental performance and thus environmental awareness associated with EVs is often more influential in the context of adoption rather than the cost of the car [
15,
16], nonetheless noting that might not be the case for current EV users [
17,
18,
19,
20]. This influence can also be dependent on the electricity powering the EVs being produced from renewable sources, as this is the only way EVs can be a true green alternative to ICE vehicles [
21]. The driving range of EVs is commonly cited as a concern amongst potential purchasers, as this range is typically smaller than what an ICE vehicle can offer.
This spatial barrier is further enhanced by the need for readily available charging stations. However, the construction of additional charging infrastructure is a barrier that continually faces the ‘chicken and egg’ problem [
22]. The issue is that, because EVs are an infrastructure dependent vehicle, there needs to be a certain number of charging facilities available for EVs to feasibly penetrate the internal combustion engine car market [
22]. Hence, investors are hesitant to develop further infrastructure if there is no demand for it—i.e., the uptake of EVs is not increasing at a significant pace. This problem thus creates a vicious cycle between consumers, investors, and manufacturers.
Battery management, including battery charging and battery aging of EVs, is also among the key vehicle factors that influence a consumer’s intention to adopt. For instance, lithium-ion (Li-ion) batteries are the main power sources to facilitate EVs due to features such as high energy density, environmental friendliness, and high efficiency [
23]. However, Ouyang et al. [
24] highlighted that with Li-ion battery charging, there is a major economic cost of battery degradation, and hence optimal charging control for the battery pack is essential for Li-ion battery management. Even with this management though, battery charging speed is sacrificed for the objective of low battery cost [
24]. This imbalance thus creates the need for the repurposing of EV batteries to ensure total cost ownership is lowered [
25].
There are a growing, but still limited number of studies investigating these key factors affecting the adoption of EVs [
26]. Moreover, there is no analysis in late-moving countries, such as Australia, which provides knowledge for a better understanding as to why some countries are falling behind in the EV market [
27]. A study conducted in Australia that investigated trip-by-trip range of automobile travel found that 88% of trips were actually less than 30 km [
28]. This indicates that EVs could more than generously provide for the transport needs for a large portion of the population and warrant their accelerated diffusion into the market. Thus, in order to boost EV adoption in Australia, it is imperative that the nation understands how factors such as renewable energy share and charging infrastructure availability (
Figure 2) can favor EV sales [
29].
Against this backdrop and to contribute to the existing research of EV uptake, this study aims to provide a descriptive analysis of these factors and identify further critical factors, such as subsidies for EVs from the government and socio-demographics, so as to support the strategic planning of EV adoption in Australia and sustain its international competitive advantage. Due to some data availability issues, the paper is prepared as a communication rather than a fully-fledged empirical research paper. Hence, the analyses conducted in this paper are only descriptive in nature.
The unit of analysis for this descriptive analysis is determined as the eight states and territories of Australia. The paper begins with an investigation of the contemporary literature exploring EV uptake on an international scale to provide appropriate context to the research. Next, data collection occurs and reveals the share of renewable energy, number of publicly available fast and slow charging stations, as well as EV sales in Australia per state, along with further factors relating to differences in income and education and subsidies for EVs from the government. A descriptive analysis of these variables is conducted to find which factors are most influential in Australian states and then combined with the findings of contemporary literature to provide a unique understanding of EV uptake in late-moving countries. These results are presented and discussed appropriately, and any limitations are made apparent.
2. Literature Background
The current literature discussing the factors affecting EV adoption continues to emerge, nevertheless, the crux of each finding remains relatively constant. The literature reviewed in this section explores EV uptake within different countries around the globe to provide context for this Australia-based investigation.
First, almost all of the studies on EV underline that CO
2 emissions from transport have to be dramatically reduced to reach ambitious CO
2 targets, but these targets cannot be reached with internal combustion engine vehicles [
30]. Hence, there is a strong argument in the literature for a wide deployment and uptake of EVs globally.
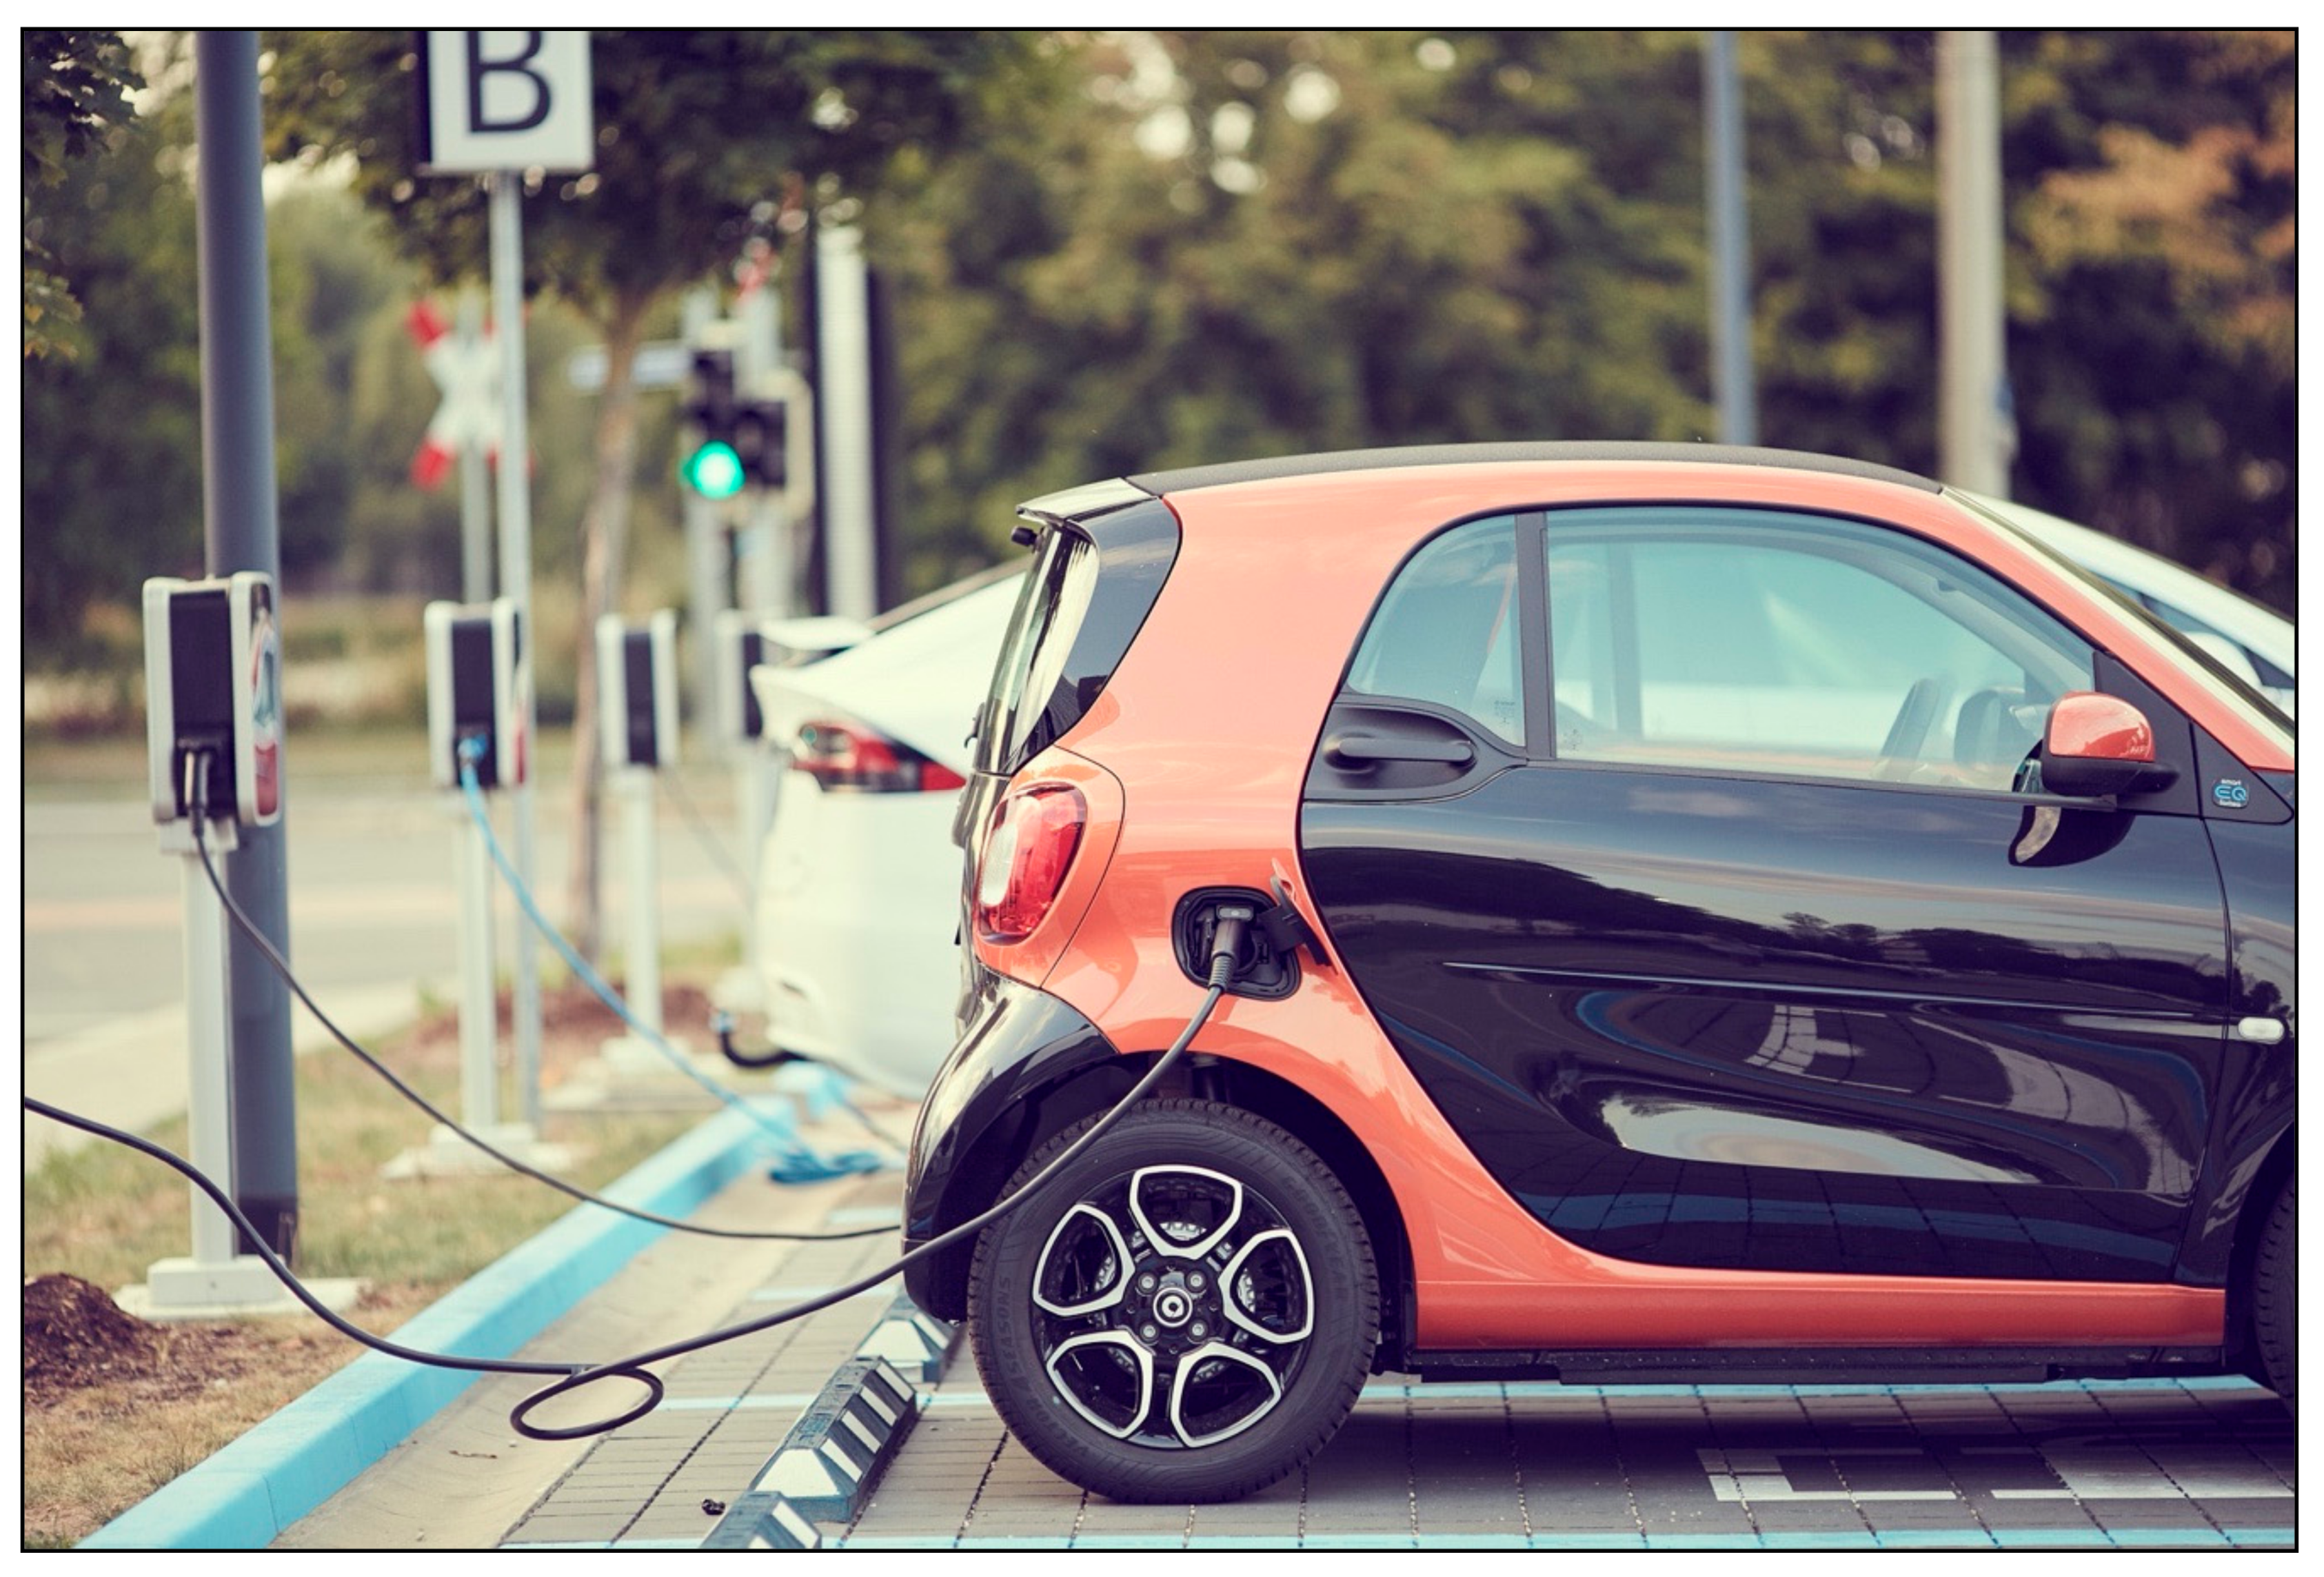
Second, the influence of charging infrastructure (
Figure 3) continually faces the ‘chicken and egg’ problem. The issue is that, because EVs are an infrastructure dependent vehicle, there needs to be a certain number of charging facilities available for EVs to feasibly penetrate the internal combustion engine car market [
22]. Nonetheless, investors are hesitant to develop further infrastructure if there is no demand for it—i.e., the uptake of EVs is not increasing at a significant pace. A reservation service for public charging facilities may benefit both drivers and other stakeholders [
31]. Whilst this service primarily reduces waiting time cost, it also decreases total social cost, which has been recognized as pivotal to the positive promotion of EVs for a more sustainable society [
31,
32,
33].
Next, to maximize this sustainability outcome, a reservation service could be used in conjunction with the concept of shared autonomous EVs [
34,
35,
36]. Not only can this ride sharing service reduce congestion, travel cost, and parking demand, if this service is introduced on the basis that the energy powering the vehicle is exclusively renewable, it will further enhance the environmental legibility of EVs and contribute to reducing emissions [
21,
37,
38,
39,
40]. Even with services like these, the importance of supplementary policies from the government such as a subsidy increase for charging facilities should be reinforced, as the availability and capacity of charging stations is something that is valued by consumers [
41].
Additionally, a lack of adequate available land within dense city centers for charging infrastructure can create a spatial barrier which further influences adoption. This can be seen in many Chinese cities, where the high-density urban layout restricts the construction of land-intensive public charging stations, and thus many governments are forced to locate these stations on the city outskirts [
22].
As mentioned in the introduction section, battery management, including battery charging and battery aging of EVs, is a further key factor that influences adoption [
23,
24,
42]. Liu et al. [
23] argued that the notion of battery calendar aging prediction is of extreme importance for developing durable EVs and thus influencing consumers’ intention to adopt. This is because more than 75% of battery life is spent under parking mode for EVs [
43]. The aging rate is highly dependent on several factors such as the storage temperature and battery state-of-charge [
44]. This state-of-charge might be seen through battery charging speed in the context of battery degradation. Kloor et al. [
25] underlined that repurposing EV batteries for second-life application scenarios may lower the vehicles’ total costs of ownership and increases their ecologic sustainability. Hence, in order to successfully repurpose used EV batteries, utilizing a decision support system (DSS) is essential [
25,
45,
46].
According to a socioeconomic and behavioral based survey conducted in the European Union (EU) [
47], the concept of ‘range anxiety’ was cited as a major fear amongst potential purchasers of EVs. ‘Range anxiety’ could be described as the worry of ending up with an empty battery and having nowhere to recharge it. The survey found this concept as the second highest barrier to EV adoption after purchase cost [
47]. Further to this, Christidis et al. [
47] also highlighted that residents in larger cities were more responsive than residents in regional and rural areas in the context of potential adopters and attributed this to the driving range. There is evidence to suggest that the costs associated with EV ownership can be competitive with the ownership costs of other vehicles; however, ultimately upfront costs still dominate [
48].
As such, EV market share is primarily dominated by business purchase as a result of this high upfront cost. Palmer et al. [
12] found that a high adoption rate of EVs within the state of California compared to other US states was attributed to the prevalence of wealth. A lack of total cost ownership (TCO) information surrounding EVs is further recognized as a potential barrier, with Palmer et al. [
12] suggesting the introduction of a resource that allows future buyers to calculate their fuel saving against depreciations costs. Additionally, Zhang et al. [
13] and Heidrich et al. [
14] reinforce income and education level as statistical indicators of adoption rates, arguing that these factors are generally associated with environmental awareness and affordability.
Moreover, a survey of both Japanese EV and non-EV drivers revealed that while environmental awareness had an indirect influence on the satisfaction of an EV user post-purchase, this awareness actually had a direct influence on the intention to purchase an EV from a current non-EV driver [
20]. Once purchased, an EV owner took little consideration for how much energy vehicle would require, because it was no longer something they chose to consider; essentially, their ownership was not dependent on this factor. A non-EV user, however, had the power to determine whether purchasing an EV was an environmentally beneficial action and if this action was something they wanted to pursue.
Degirmenci and Breitner’s [
49] study of 167 German drivers who drove EVs for a trial period found that rather than range confidence and price value, the environmental performance of EVs had a stronger influence on attitude and thus the intention to adopt. The same study revealed that this environmental performance was dependent on the electricity powering the EVs being produced from renewable energy sources. This would mean EVs would be an authentic green alternative to ICE vehicles. Casals et al.’s [
50] study contradicts the argument for environmental performance influence, however, by finding that three of the top five most EV-selling countries in Europe still rely on highly pollutant electricity power plant fleets.
Furthermore, the environmental analysis of any vehicle, whether EV or ICE, typically involves examining the energy required for the duration of that vehicle’s lifetime [
50]. This duration is from the vehicle fabrication to the vehicle use phase [
50]. In the context of how much energy certain EV chargers require, Zhang et al. [
13] disclosed that the home charger boasted the lowest ‘cumulative energy demand’ (CED). This was then followed by the ‘public direct current’ (DC) and ‘alternating current’ (AC) chargers [
13]. Regarding these energy requirements for EVs, to successfully integrate the highest anticipated increase in EV market share into current distribution networks, a UK study found that a combination of penetration of embedded generation, network reinforcements, and particular management of EV batteries would be required [
51].
Additionally, the EV industry has been gradually constructed through the combined implementation of various subsidies. Song et al. [
41] break these subsidies down into three different types, and identify them as purchasing subsidies, industrial subsidies, and facility supporting subsidy. From a study of 30 different cities across the UK, it was concluded that the current strategies and subsidies put in place by local governments to promote EV adoption are not achieving a positive uptake rate and are thus failing to meet carbon reduction targets [
14]. Essentially, high purchasing subsidies on their own cannot guarantee the long-term success of the EV market [
41,
52].
This notion is reinforced through a study that modelled EV uptake over the next 40 years in the UK, which found that whilst subsidies are significant for EV sales in the short term, they have minimal impact in the long term on market share or on reducing emissions [
53]. It should be noted that conclusion was drawn using a business as usual case. When analyzing the impact of subsidies implemented in a failing market, however, these same subsidies have the ability to nudge the market back into a successful state [
53]. This is assuming manufacturers leave the market unless a particular sales target is met. Essentially, Shepherd et al. [
53] argue that subsidies only provide ‘value for money’ where there is no expectation that an EV market will emerge or where there are political reasons to engage that emerging market that are irrelated to reducing carbon emissions.
Comparatively, the city of Shenzhen in China has successfully developed a government-enterprise model that grants enterprises the opportunity to implement a range of unique business models whilst simultaneously providing local governments with a reduction in the financial pressure often associated with promoting the use of EVs at a local level [
54]. As a result, Shenzhen is now able to use EVs for commercial purposes such as public transport options around city like buses and taxis [
54]. Despite positive results reported by Zhuge and Shao [
55] in their Beijing study, the success of the Chinese model is unlikely to be replicated, because the private and public stakeholders involved have secure financial backing that may not necessarily be guaranteed in the context of a different region [
56].
Lastly, as highlighted in the abovementioned literature, there is a growing, but still limited, number of studies investigating the key factors affecting the uptake of EVs. Additionally, there is no analysis in late-moving countries, which would provide knowledge for a better understanding of why some countries are falling behind in the EV market. With this rationale in mind, the remainder of this paper focuses on Australia as a late mover in the EV market and generates insights into how certain factors can favor EV sales.
3. Methodology
After investigating the findings of key contemporary literature to classify which critical factors currently affect EV adoption in an international context, collection of Australian data occurred that allowed for analysis at a national level. This methodology was influenced through the findings of the literature, and thus the data chosen to be collected was indicative of current contemporary research. The study type used for this project was secondary analysis. Secondary analysis is a research method that involves analyzing data either collected by someone else, or for some other purpose than the one currently being considered, or often a combination of the two. Within this study type, a descriptive analysis was undertaken through a comparison of a range of variables against EV sales.
The unit of analysis was determined as the eight states and territories of Australia. Thus, the sample size could be considered the entire adult population of Australia. It was not possible to reduce the size of the study, as it needed to be conducted in the context of all of Australia. For each state and territory, the following secondary data were collected to form the dataset for the descriptive analysis. The population of each state was collected from 2016 Australian Bureau of Statistics (ABS) census data accessed via the ABS website. The average share of high-income earners from each state, as well as the portion of university educated residents in each state, was collected from 2016 ABS census data accessed via the ABS website. The number of charging stations within each state was collected from the Electric Vehicle Council. The charging stations were categorized as ‘fast charging stations’ (DC) or ‘slow charging stations’ (AC) (
Figure 4). The renewable energy share was collected as a percentage per state and accessed through the Department of Industry, Science, Energy, and Resources from
energy.gov.au. The current EV subsidies in each state were collected through the various relevant government websites. These subsidies also included any applicable financial incentives. The number of registered EVs in each state for 2019 was identified through accessing each state’s transport department website, whilst the EV sales and EVs per 10,000 vehicle sales in each state for 2019 were obtained from the Electric Vehicle Council.
Once all the data were in the correct unit of measurement (e.g., percentage or whole numbers), descriptive analysis of this data occurred. The number of EVs per 10,000 vehicle sales was used as the dependent variable in each comparison. The independent variables were classified as the number of charging stations, renewable energy share, number of EV subsidies, share of high-income earners, and the share of university educated people. It should be noted that both the population and total number of EV sales in each state were used as further comparison benchmarks to analyze the number of public charging stations in each state.
Finally, results of the descriptive analysis were combined with the findings from current contemporary literature to provide an understanding of how critical factors such as charging infrastructure, renewable energy supply, subsidies, income, and education can favor EV sales in Australia. These results are presented in the following section.
4. Results
The results of this analysis have been presented in a series of tables to allow for comparison between each state for each relevant variable.
Table 1 indicates that, whilst NSW has the highest number of EV vehicle sales for 2019, the ACT has the highest number of EVs sold per 10,000 vehicles in the territory for 2019. The NT has both the lowest total EV sales and the lowest rate of EVs sales per 10,000 vehicle sales.
From the results in
Table 2, it is evident that comparing the number of charging stations within each state against the number of EVs sold per 10,000 vehicle sales does not provide a solid basis for analysis. Rather, these charging stations should be compared against both the total number of EV sales and the total population for each state.
Table 3 provides a more accurate depiction of how the availability of public charging stations might affect EV adoption. This is because the number of charging stations should be meeting the demand relative to the number of EVs purchased.
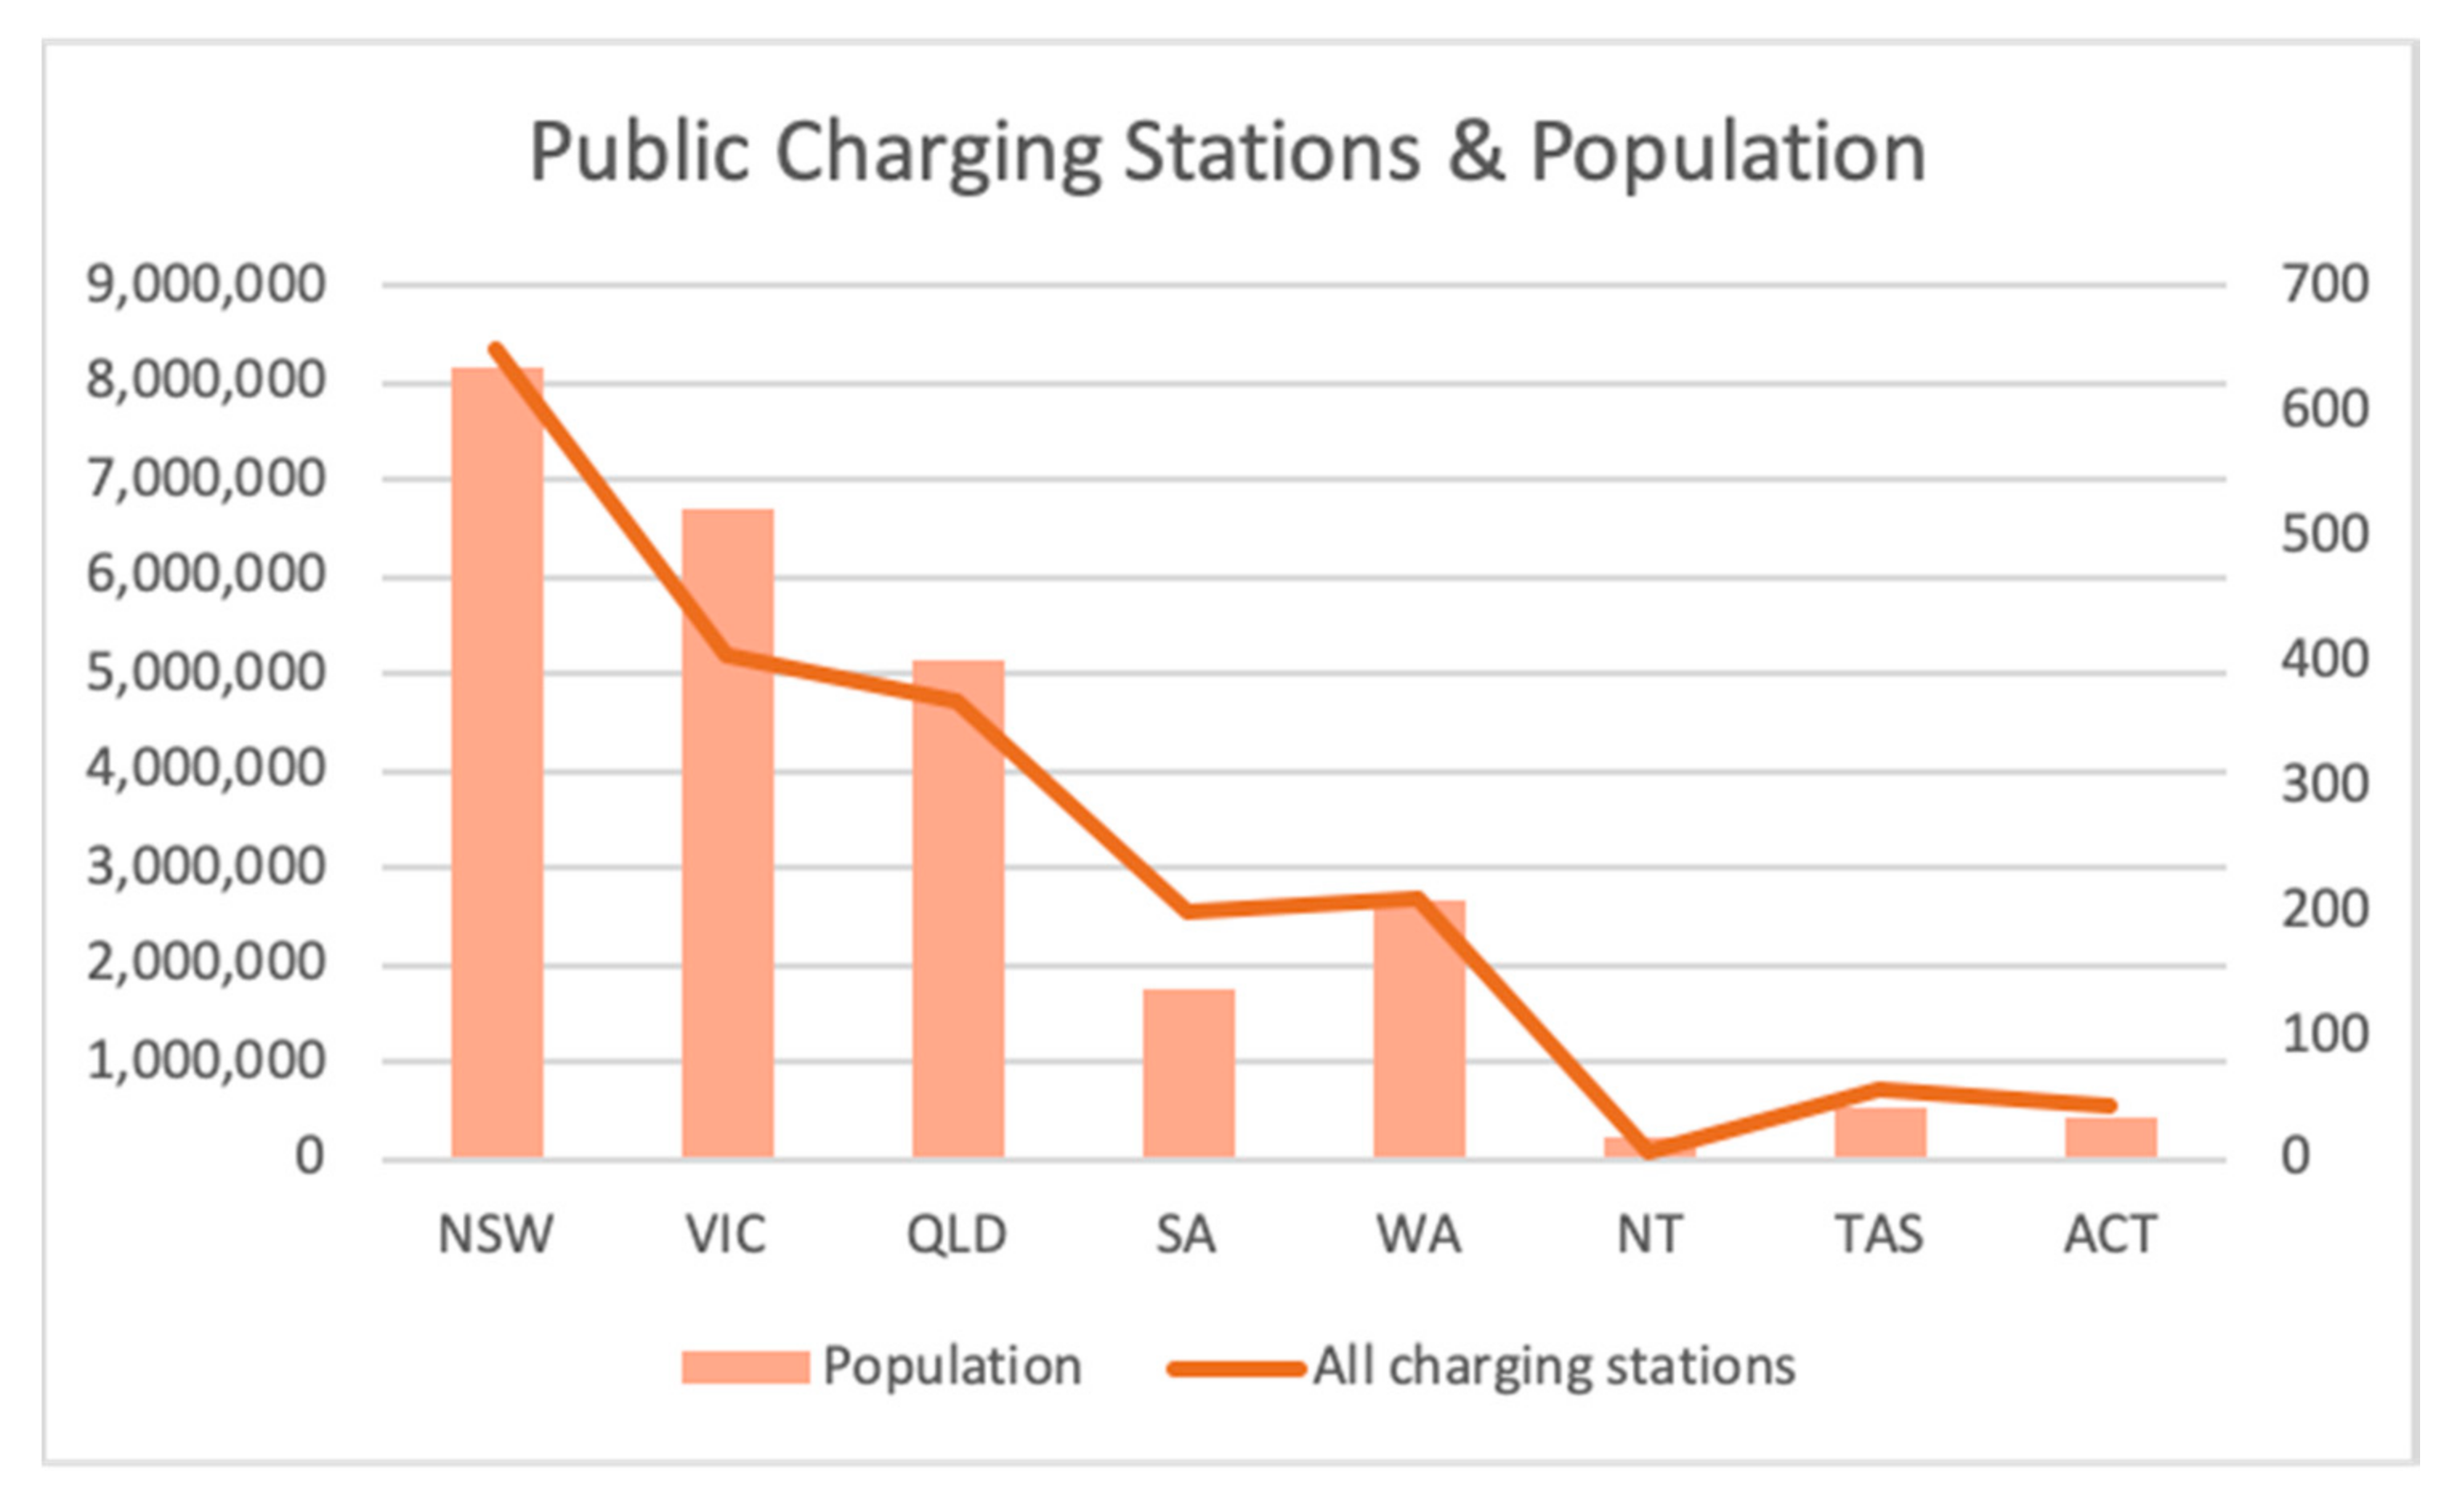
It is evident when looking at the population against the number of charging stations in
Table 4 that the availability of infrastructure is relative to the number of people in the state. As the population decreases, so too does the number of charging stations.
In the context of Tasmania in
Table 5, the share of renewable energy (91%) is very high relative to the number of EV sales. The physical geography and population of this state may be the reason for that high share of renewable energy. As a result of its island-like nature, the state is able to access a large amount of hydro power relative to the amount of energy the state actually requires to power its smaller population. Contrastingly, the share of renewable energy in the ACT (16%) is low in proportion to the number of EV sales in that territory. This could also be attributed to the physical geography of the territory, as the size of area it covers is very small. Hence, the range of available sources of renewable is limited, with solar power most likely being the primary source of renewables.
Table 6 depicts that one state (ACT) offered two subsides, five states offered one subsidy, and the remaining two states offered no subsidies. Subsides included a concession on motor vehicle tax where the value of the concession was dependent on the weight of the car and whether it is used for private or business purposes. Other subsides provided discounts on annual registration fees and reduced stamp duty, whilst some states implemented schemes such as the ‘Sustainability Incentives Scheme’ and ‘Electric Vehicle Fast Charger Support Scheme’. The effectiveness of these subsidies might be dependent on their value and when they are applied, and thus could influence their impact on uptake.
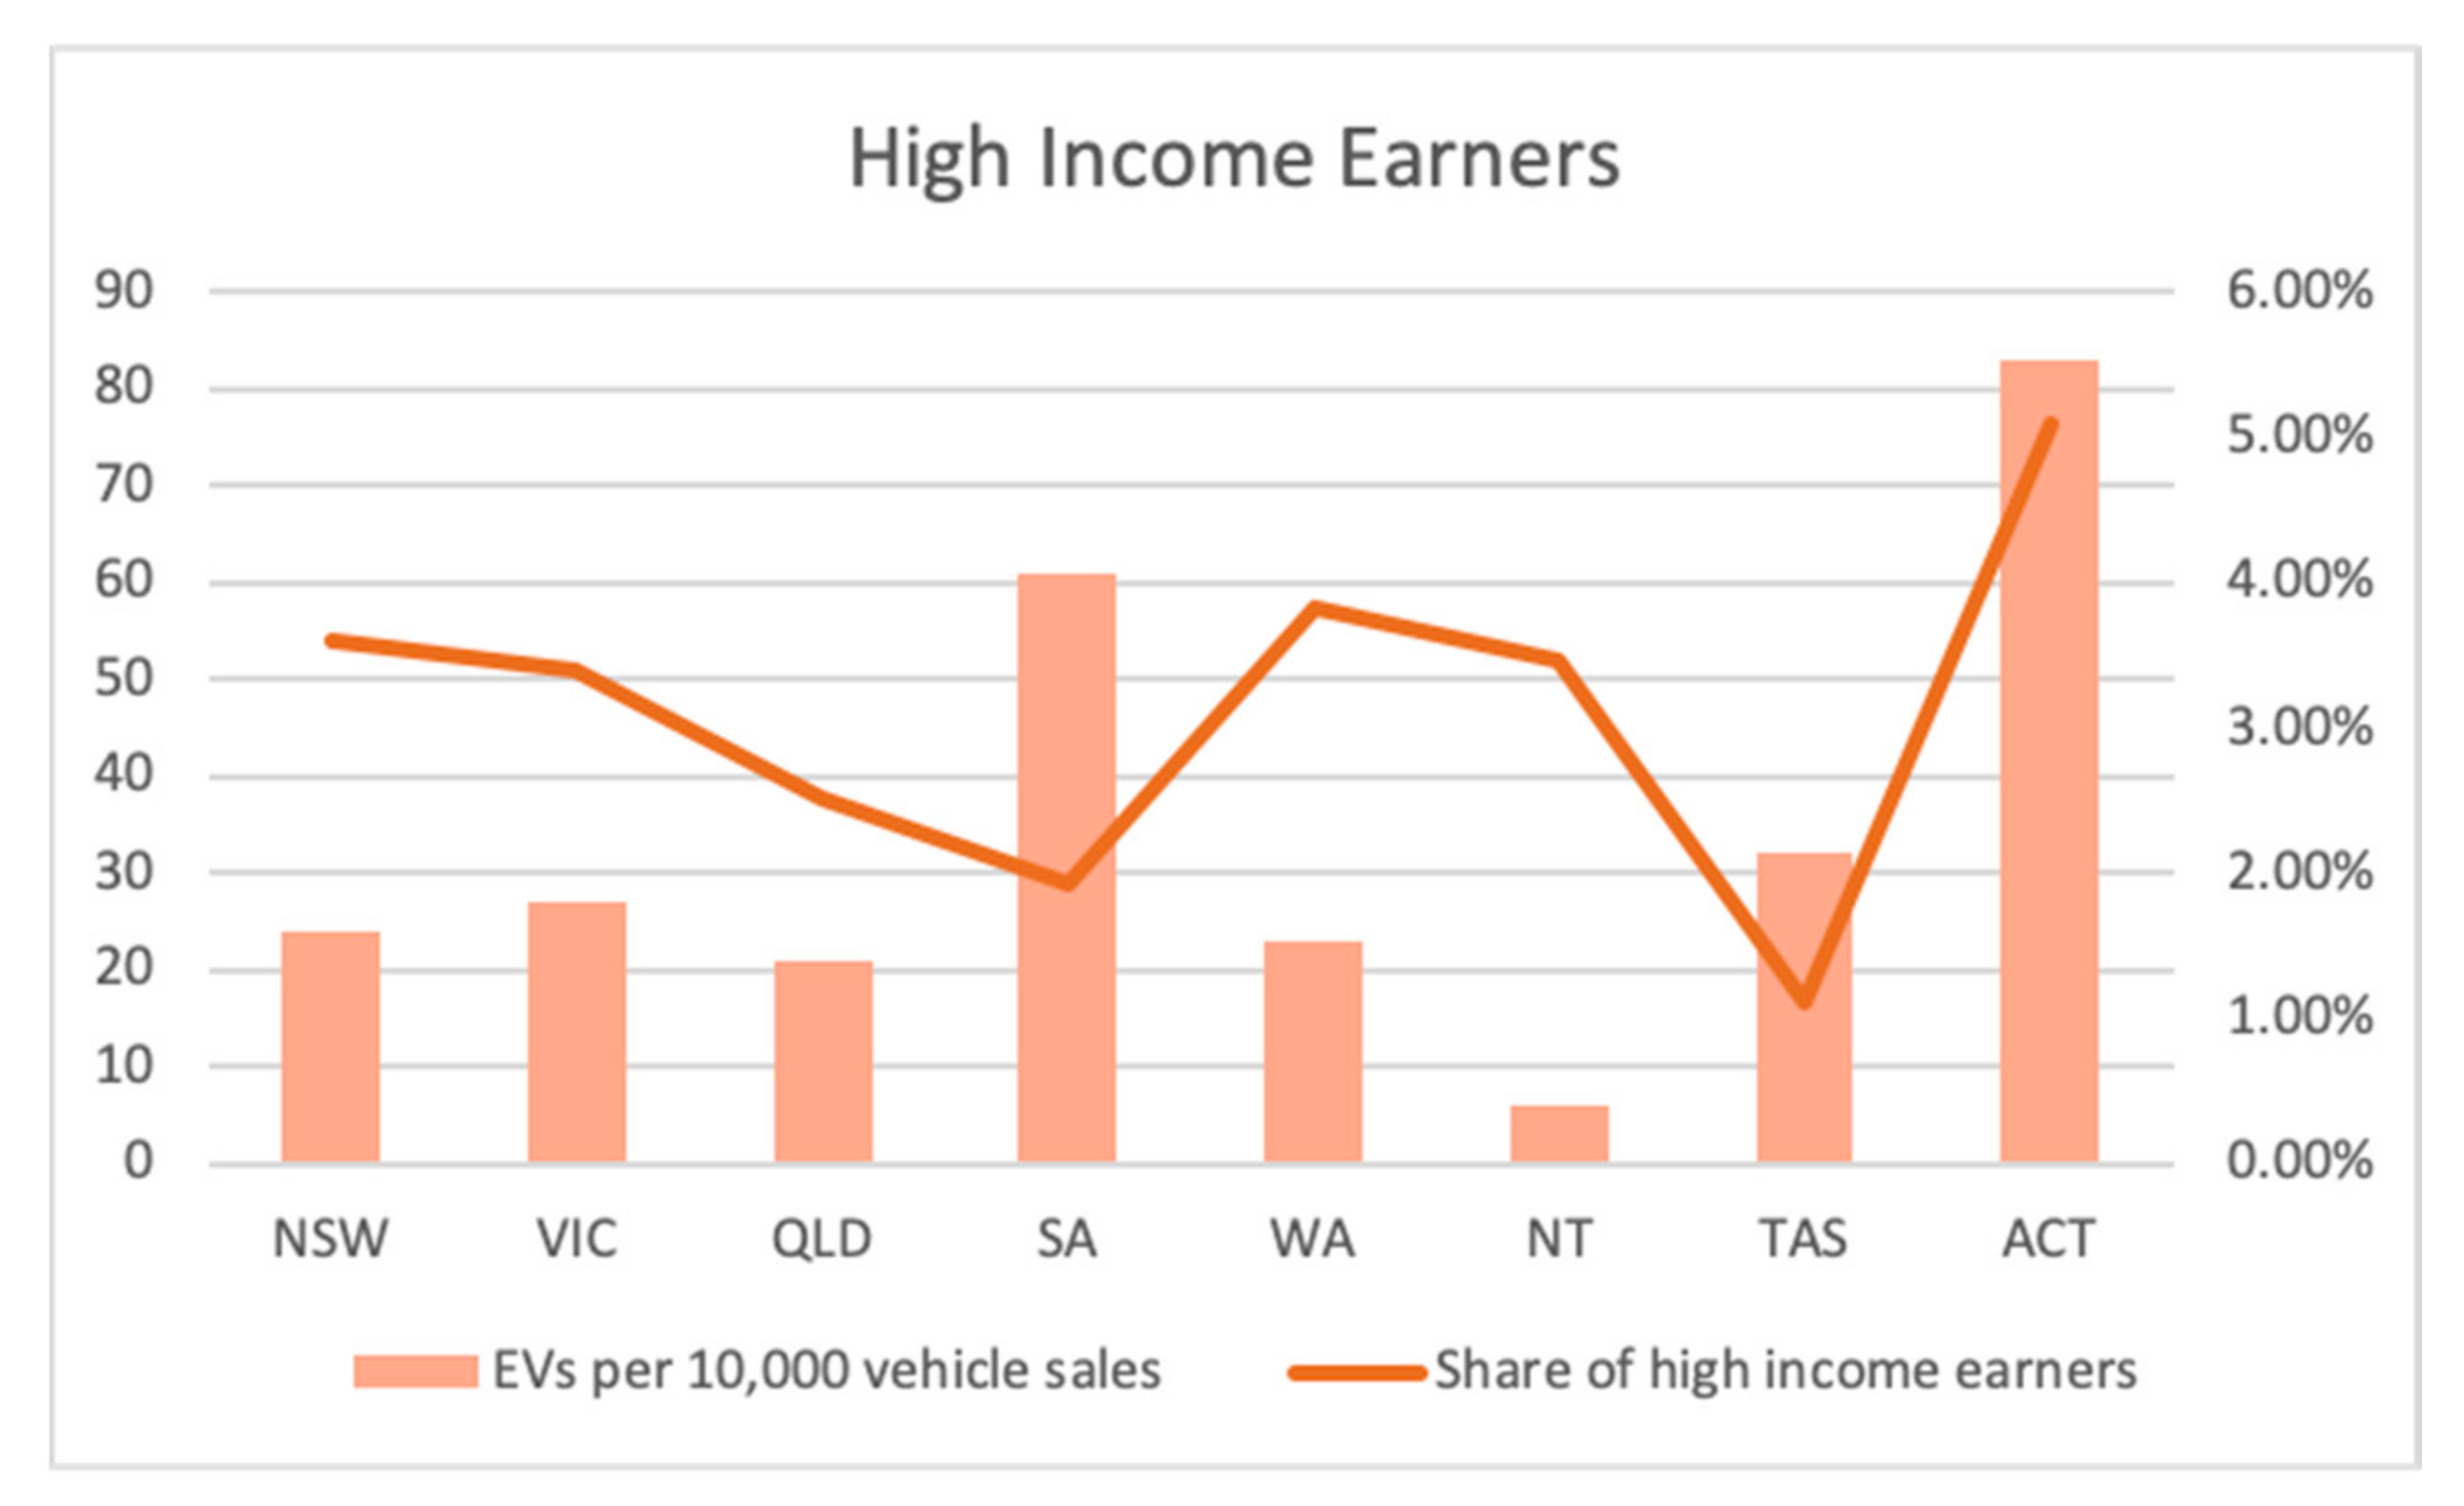
The average yearly income in
Table 7 provides some anomalies. Whilst the highest share of high-income earners (ACT) correlates with the highest number of EVs per 10,000 vehicle sales, the two lowest shares of high incomes are actually in the states with the next highest rates of EVs sales (SA and TAS). Moreover, the share of high-income earners in the NT is higher than the share in VIC. This data suggests that within an Australian context, income may not be as influential as other factors in affecting EV adoption.
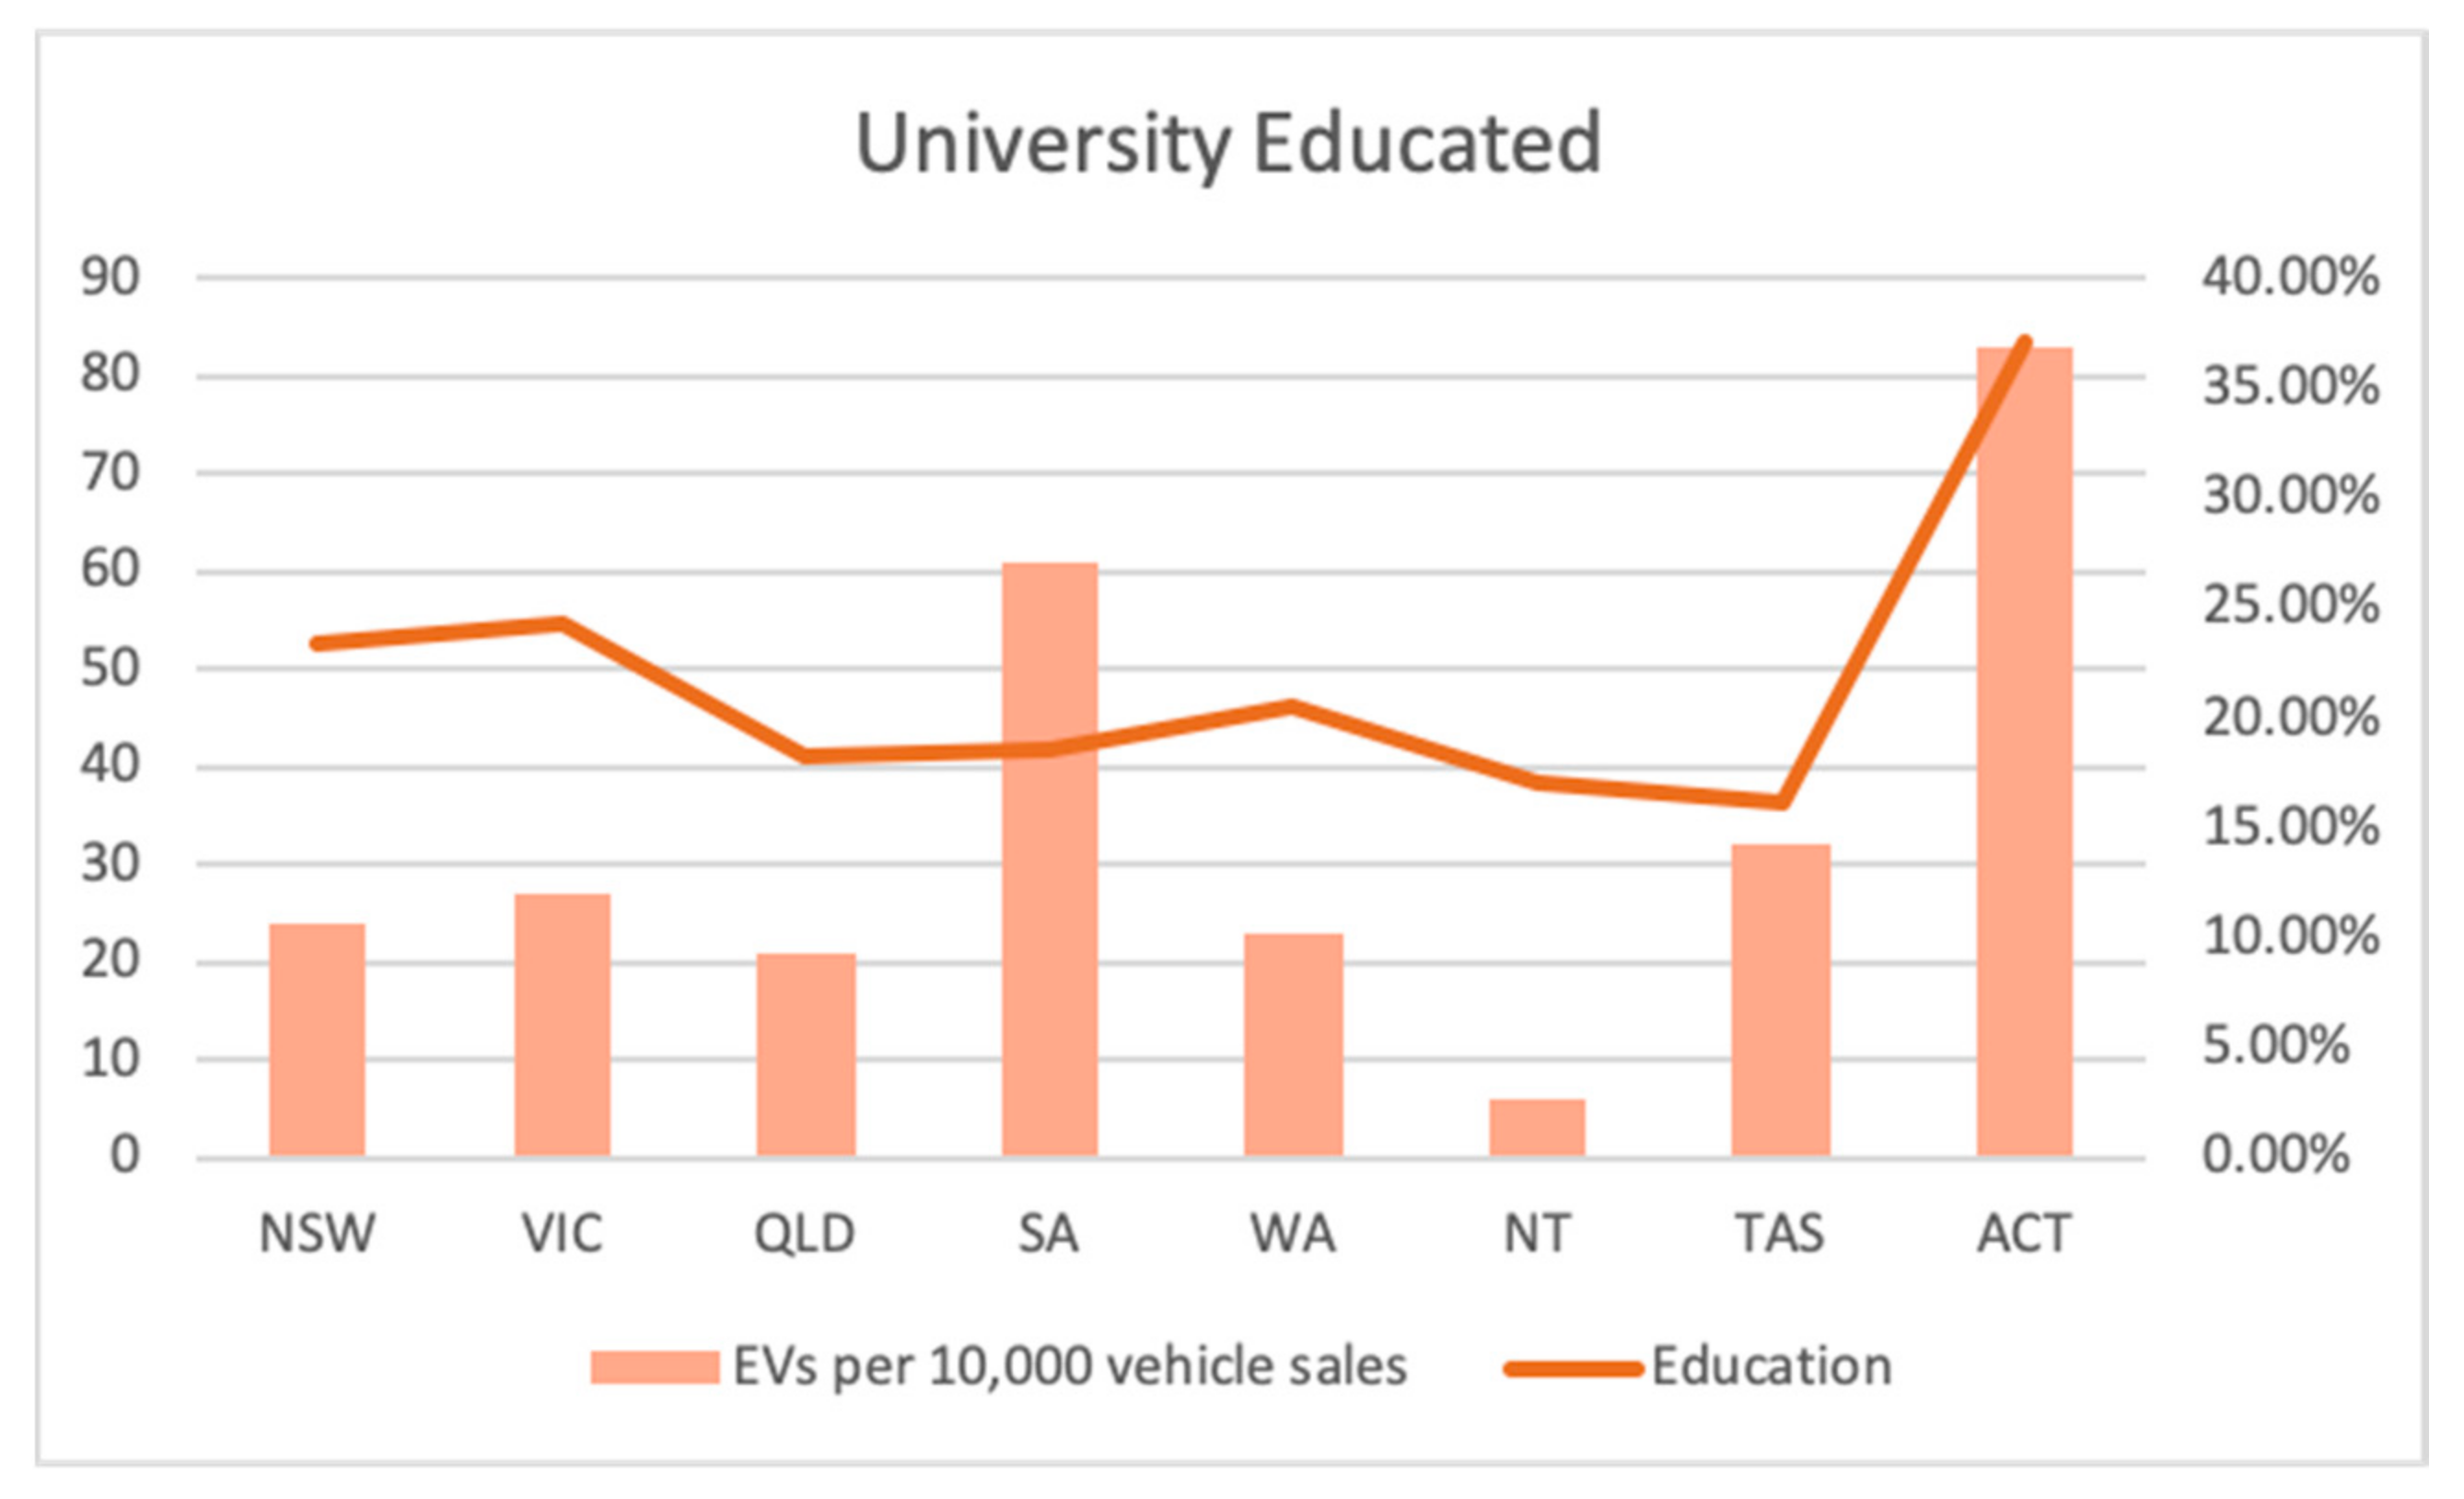
The highest average share of university students was in the ACT, followed by VIC and then NSW (
Table 8). In this context, the number of universities within each state may be a possible indicator, as those three states have the most universities and thus the greatest number of university students enrolled. Whilst this does not necessarily mean that these students will continue to reside in their respective universities’ states after they graduate, it is highly likely.
5. Discussion
Existing contemporary EV literature argues that renewable energy, EV subsidies, charging stations, income, and education are all variables that favor EV sales. Thus, the findings from that literature have been used to draw conclusions surrounding the results of the Australian data.
When looking at the results presenting the number of charging stations, the geographical reach of each state should be considered. The concept of range anxiety was cited as a concern of many consumers within the literature [
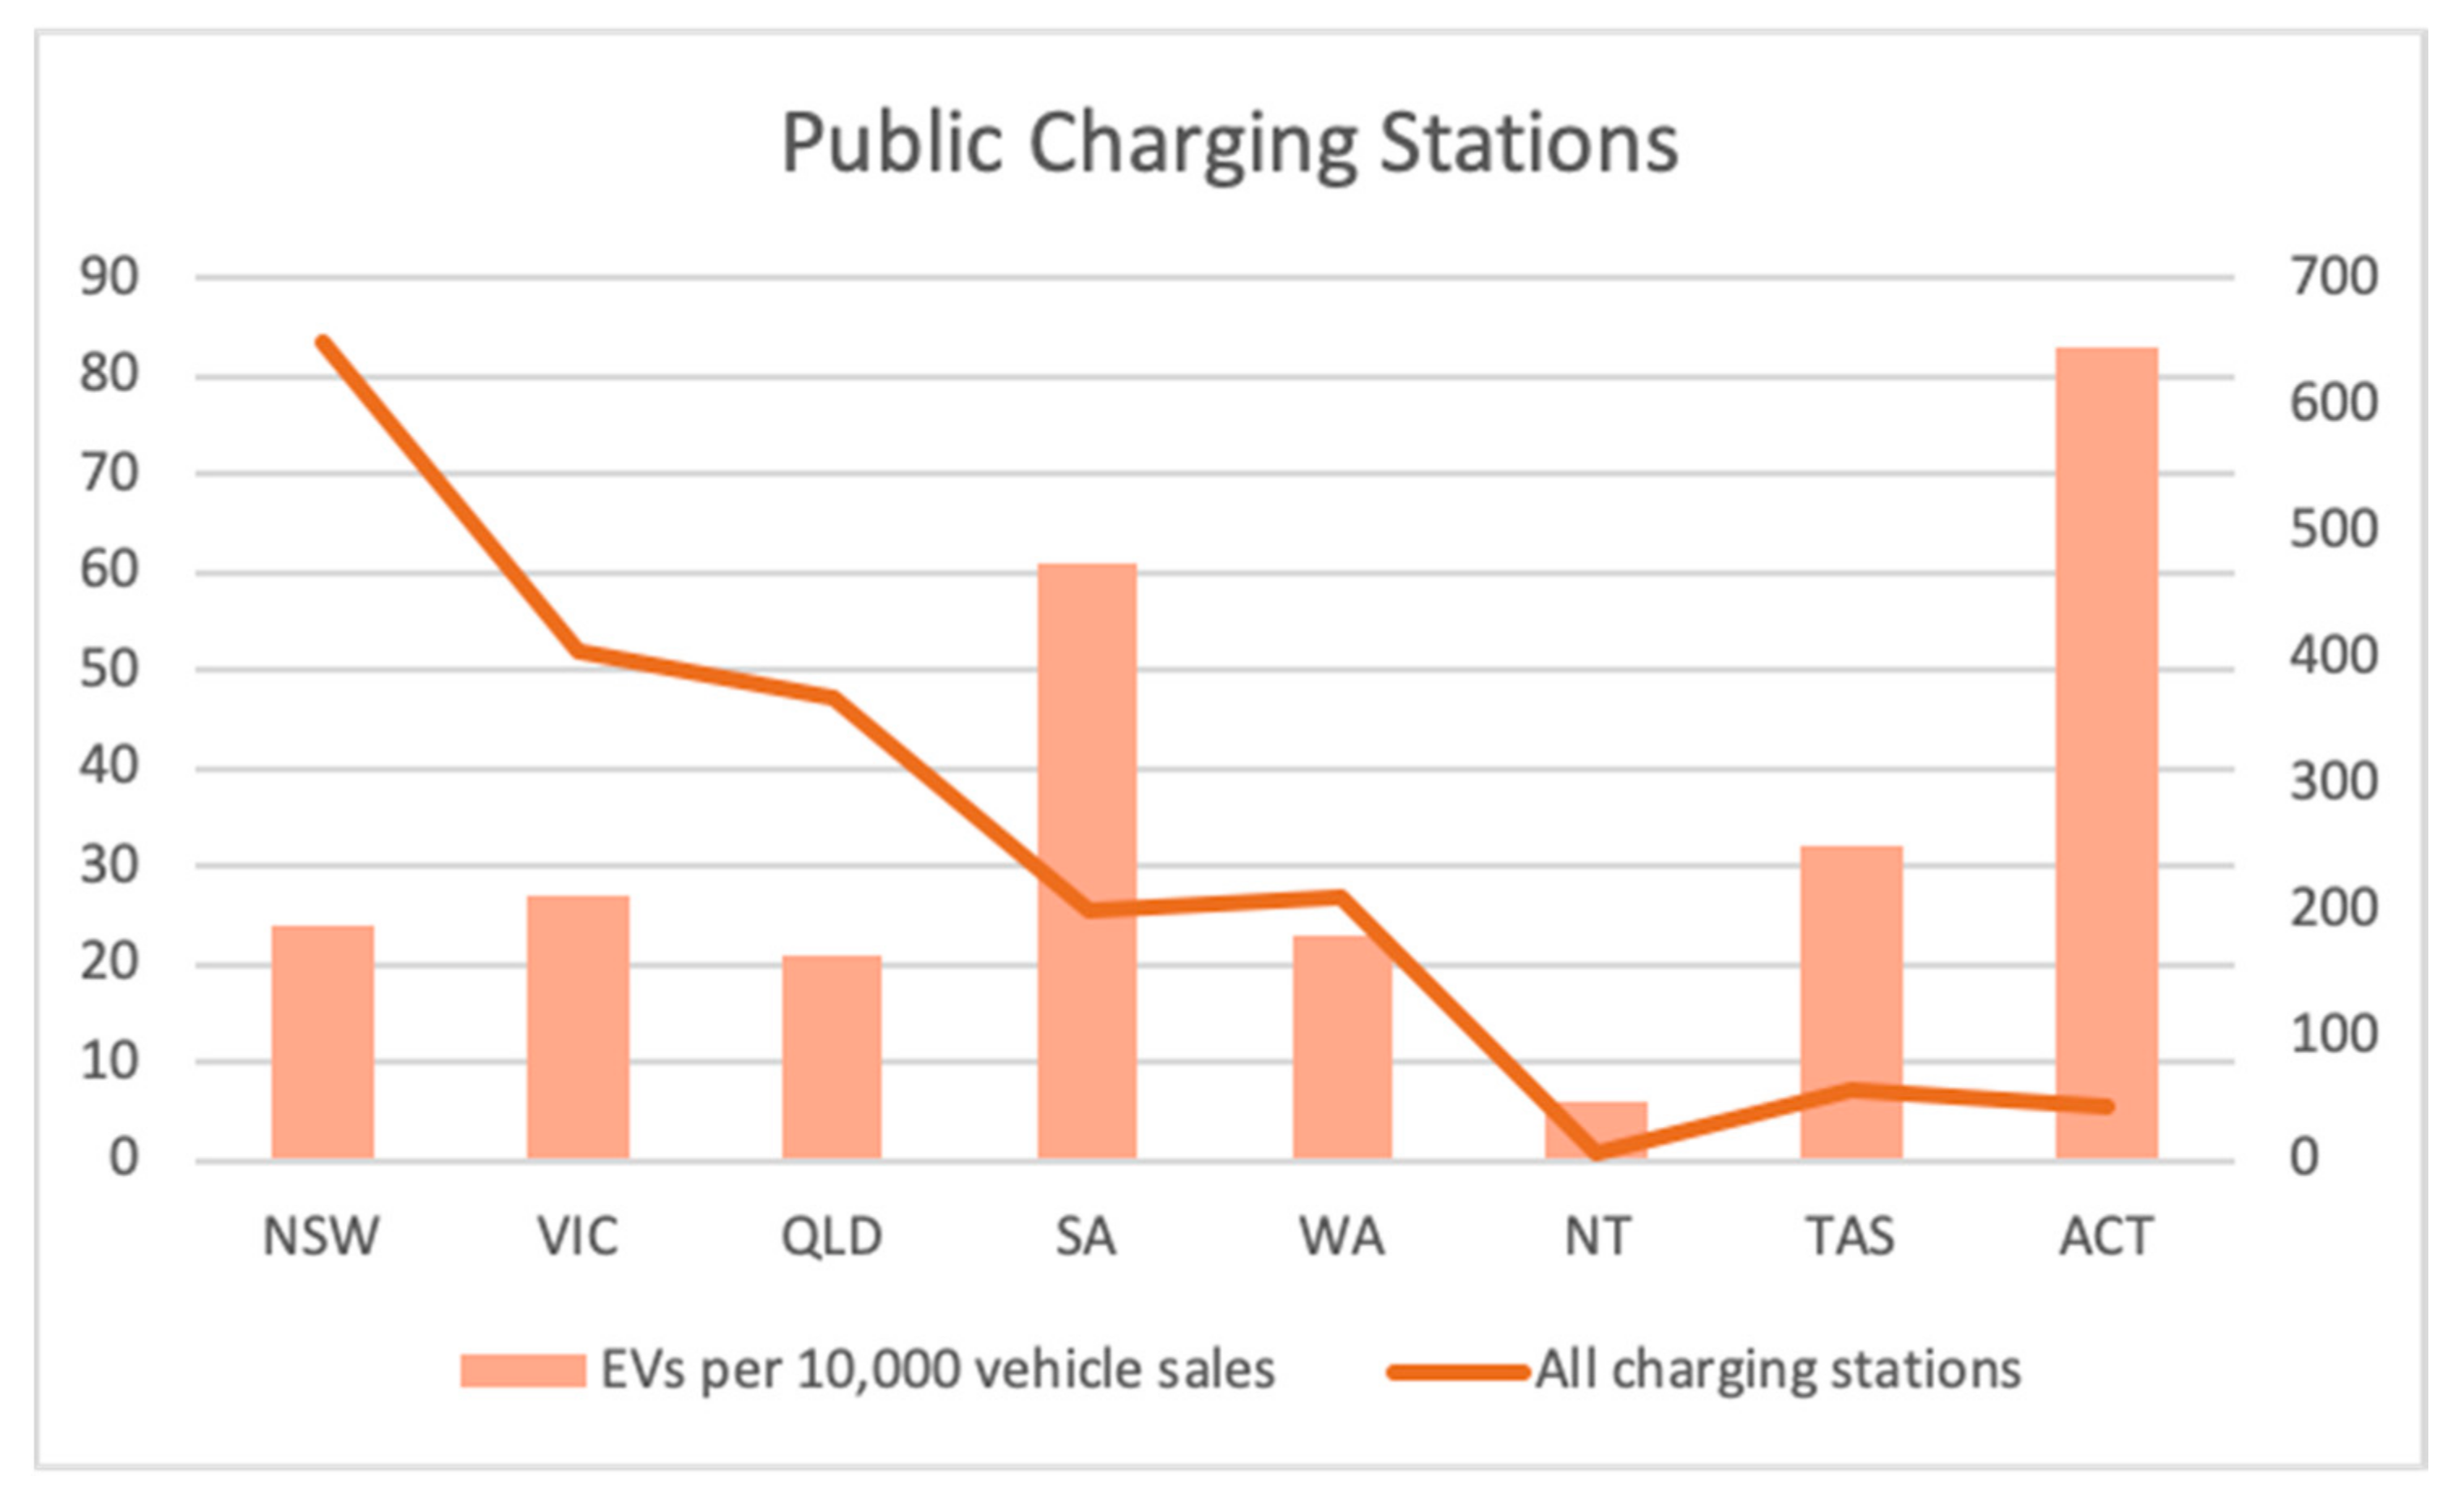
47] and was thus an influencing factor across various different studies. Australian data on public charging stations in
Figure 5 revealed that comparing the total number of public charging stations, which includes both AC and DC charging, against EVs per 10,000 vehicle sales does not present a trend that is conducive to influencing EV adoption. In this instance, the distribution of charging infrastructure appears to be attributed to the population of each state, as per
Figure 6. Essentially the greater the population, the greater the number of charging stations available.
Within the literature, Christidis et al. [
47] concluded that residents in larger cities were more responsive than residents in regional and rural areas in the context of potential adopters and attributed this to the driving range. This could be an influencing factor for the number of charging stations the government has made available to the public. The three largest states by population, and thus the size of their capital cities, are the three states with the highest number of charging stations.
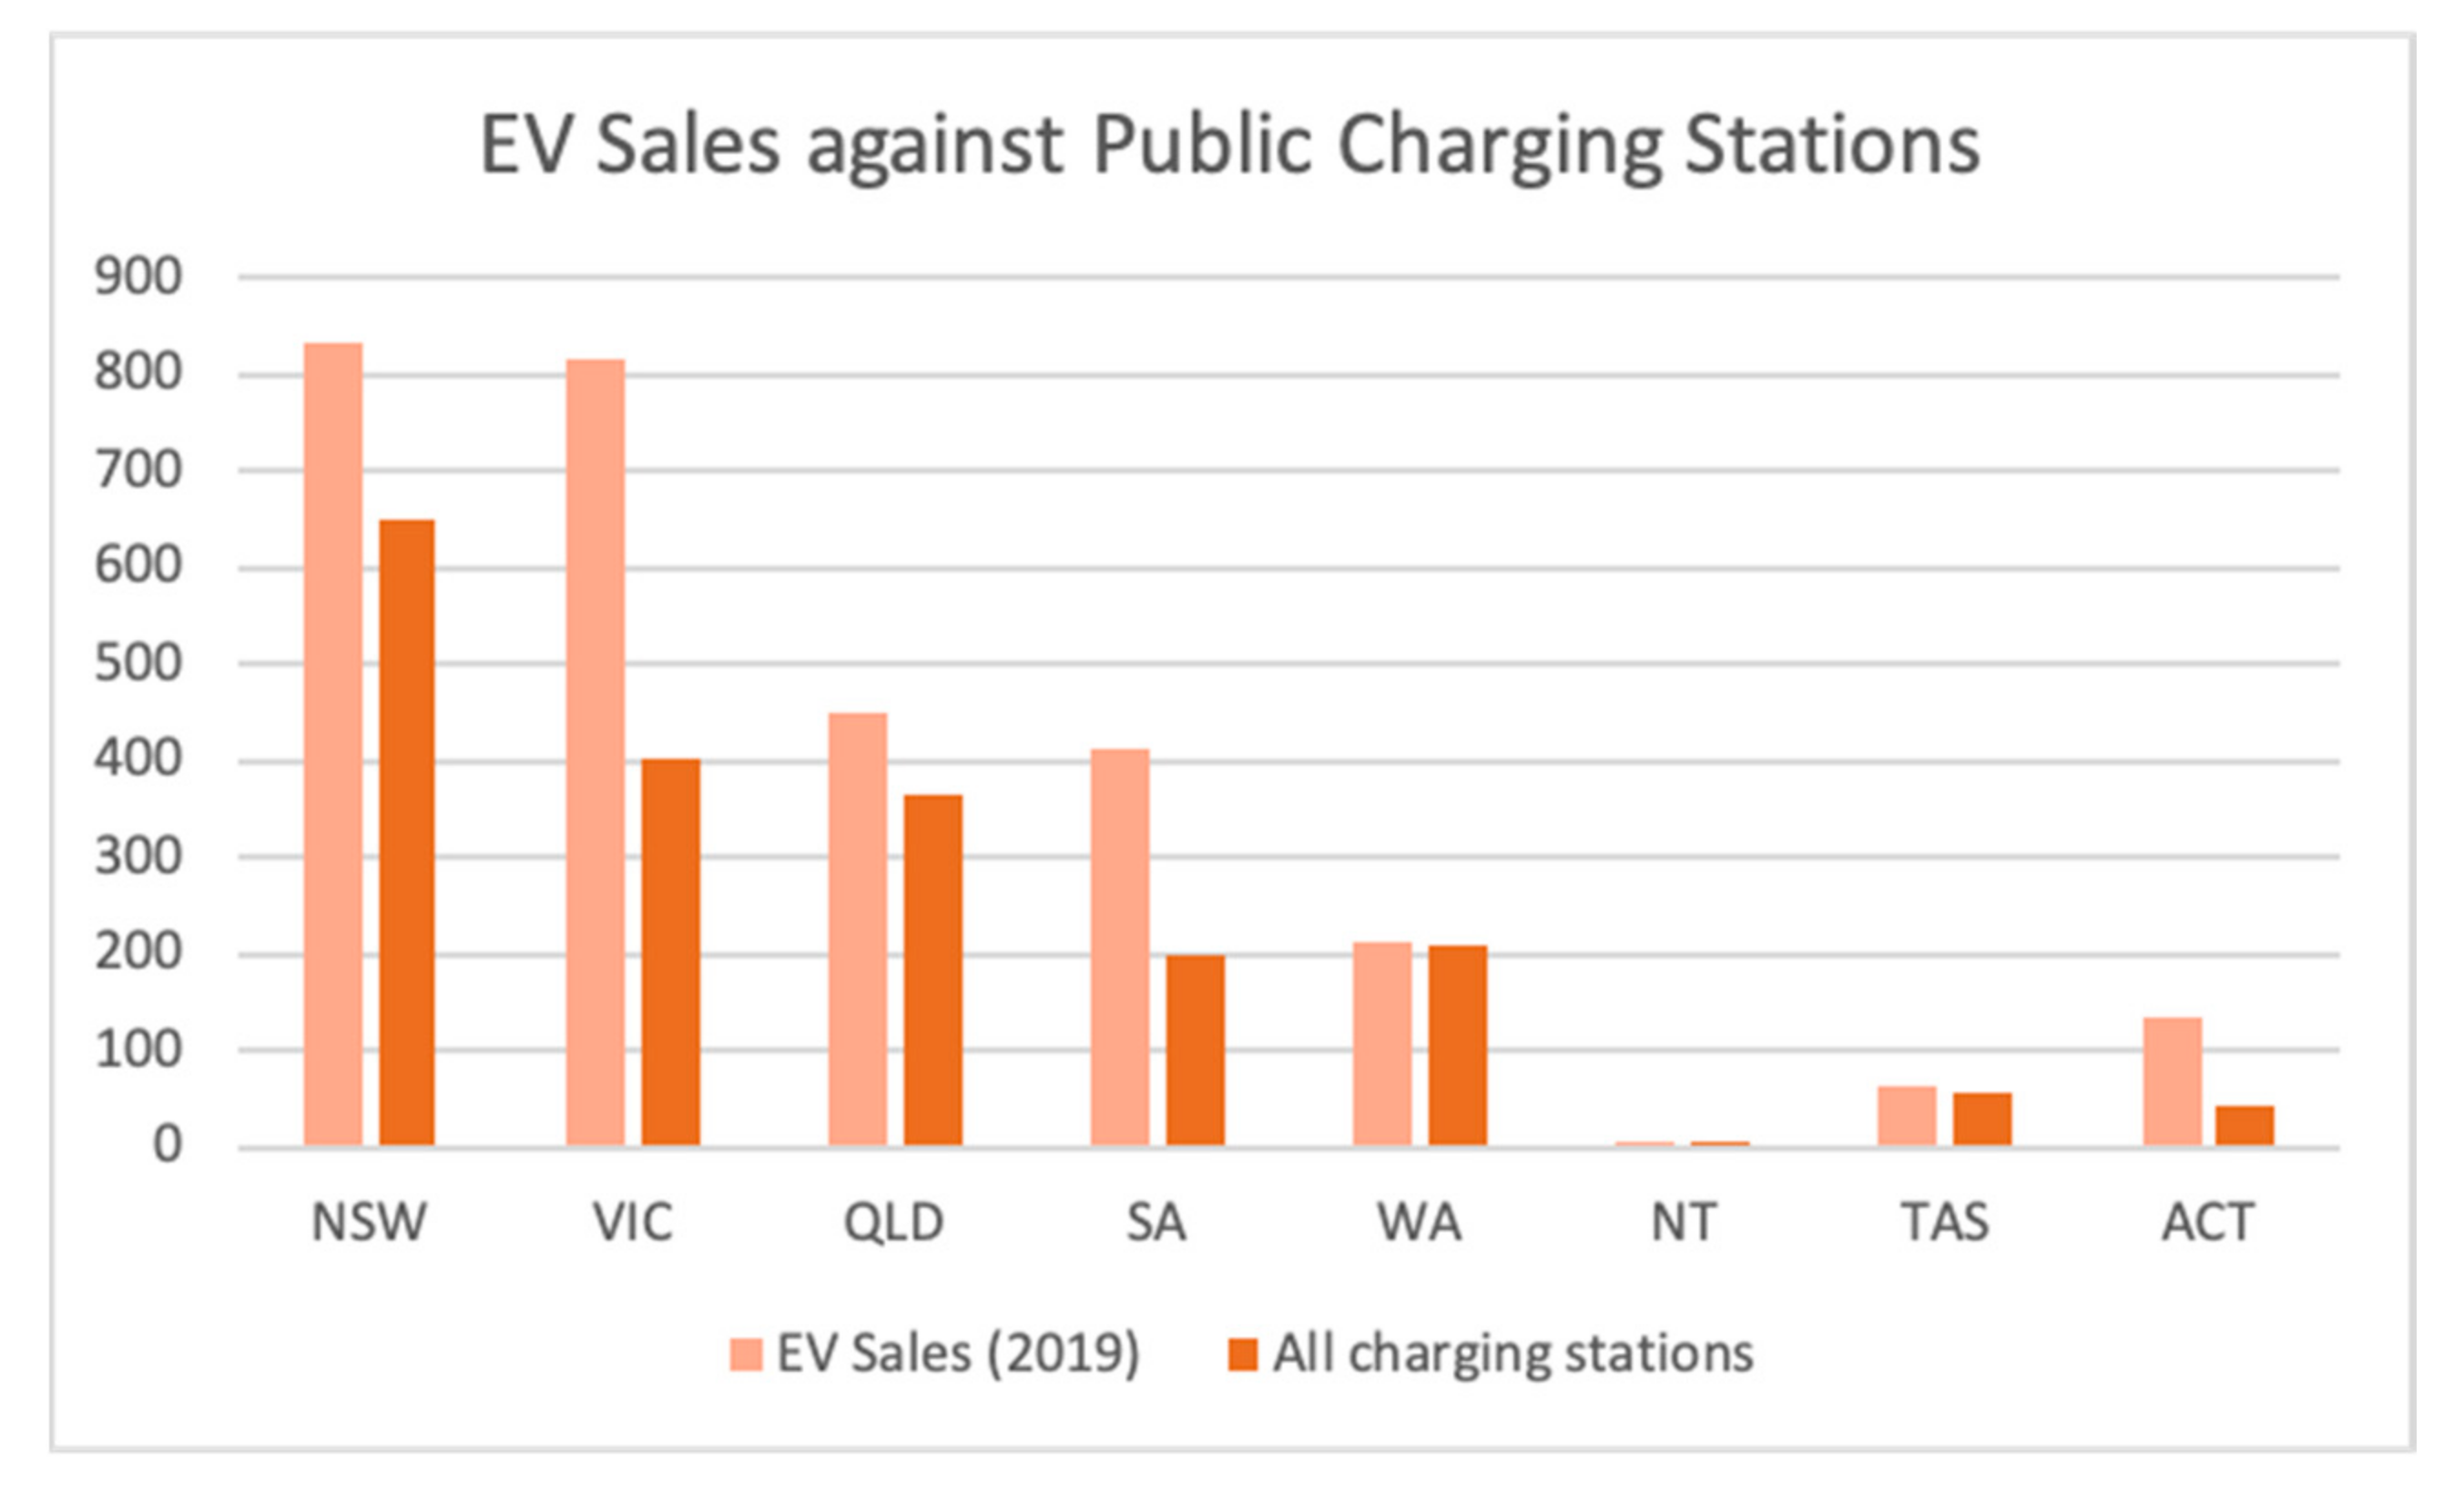
It is also important to look at the actual EV sales against charging stations to understand why population affects adoption.
Figure 7 depicts a fairly consistent trend of EV sales against the number of public charging stations. Much of the literature has argued that consumers’ intention to purchase is influenced through charging infrastructure availability [
22]. Hence, if there are more charging stations, then it is likely that there will be a greater number of EV sales.
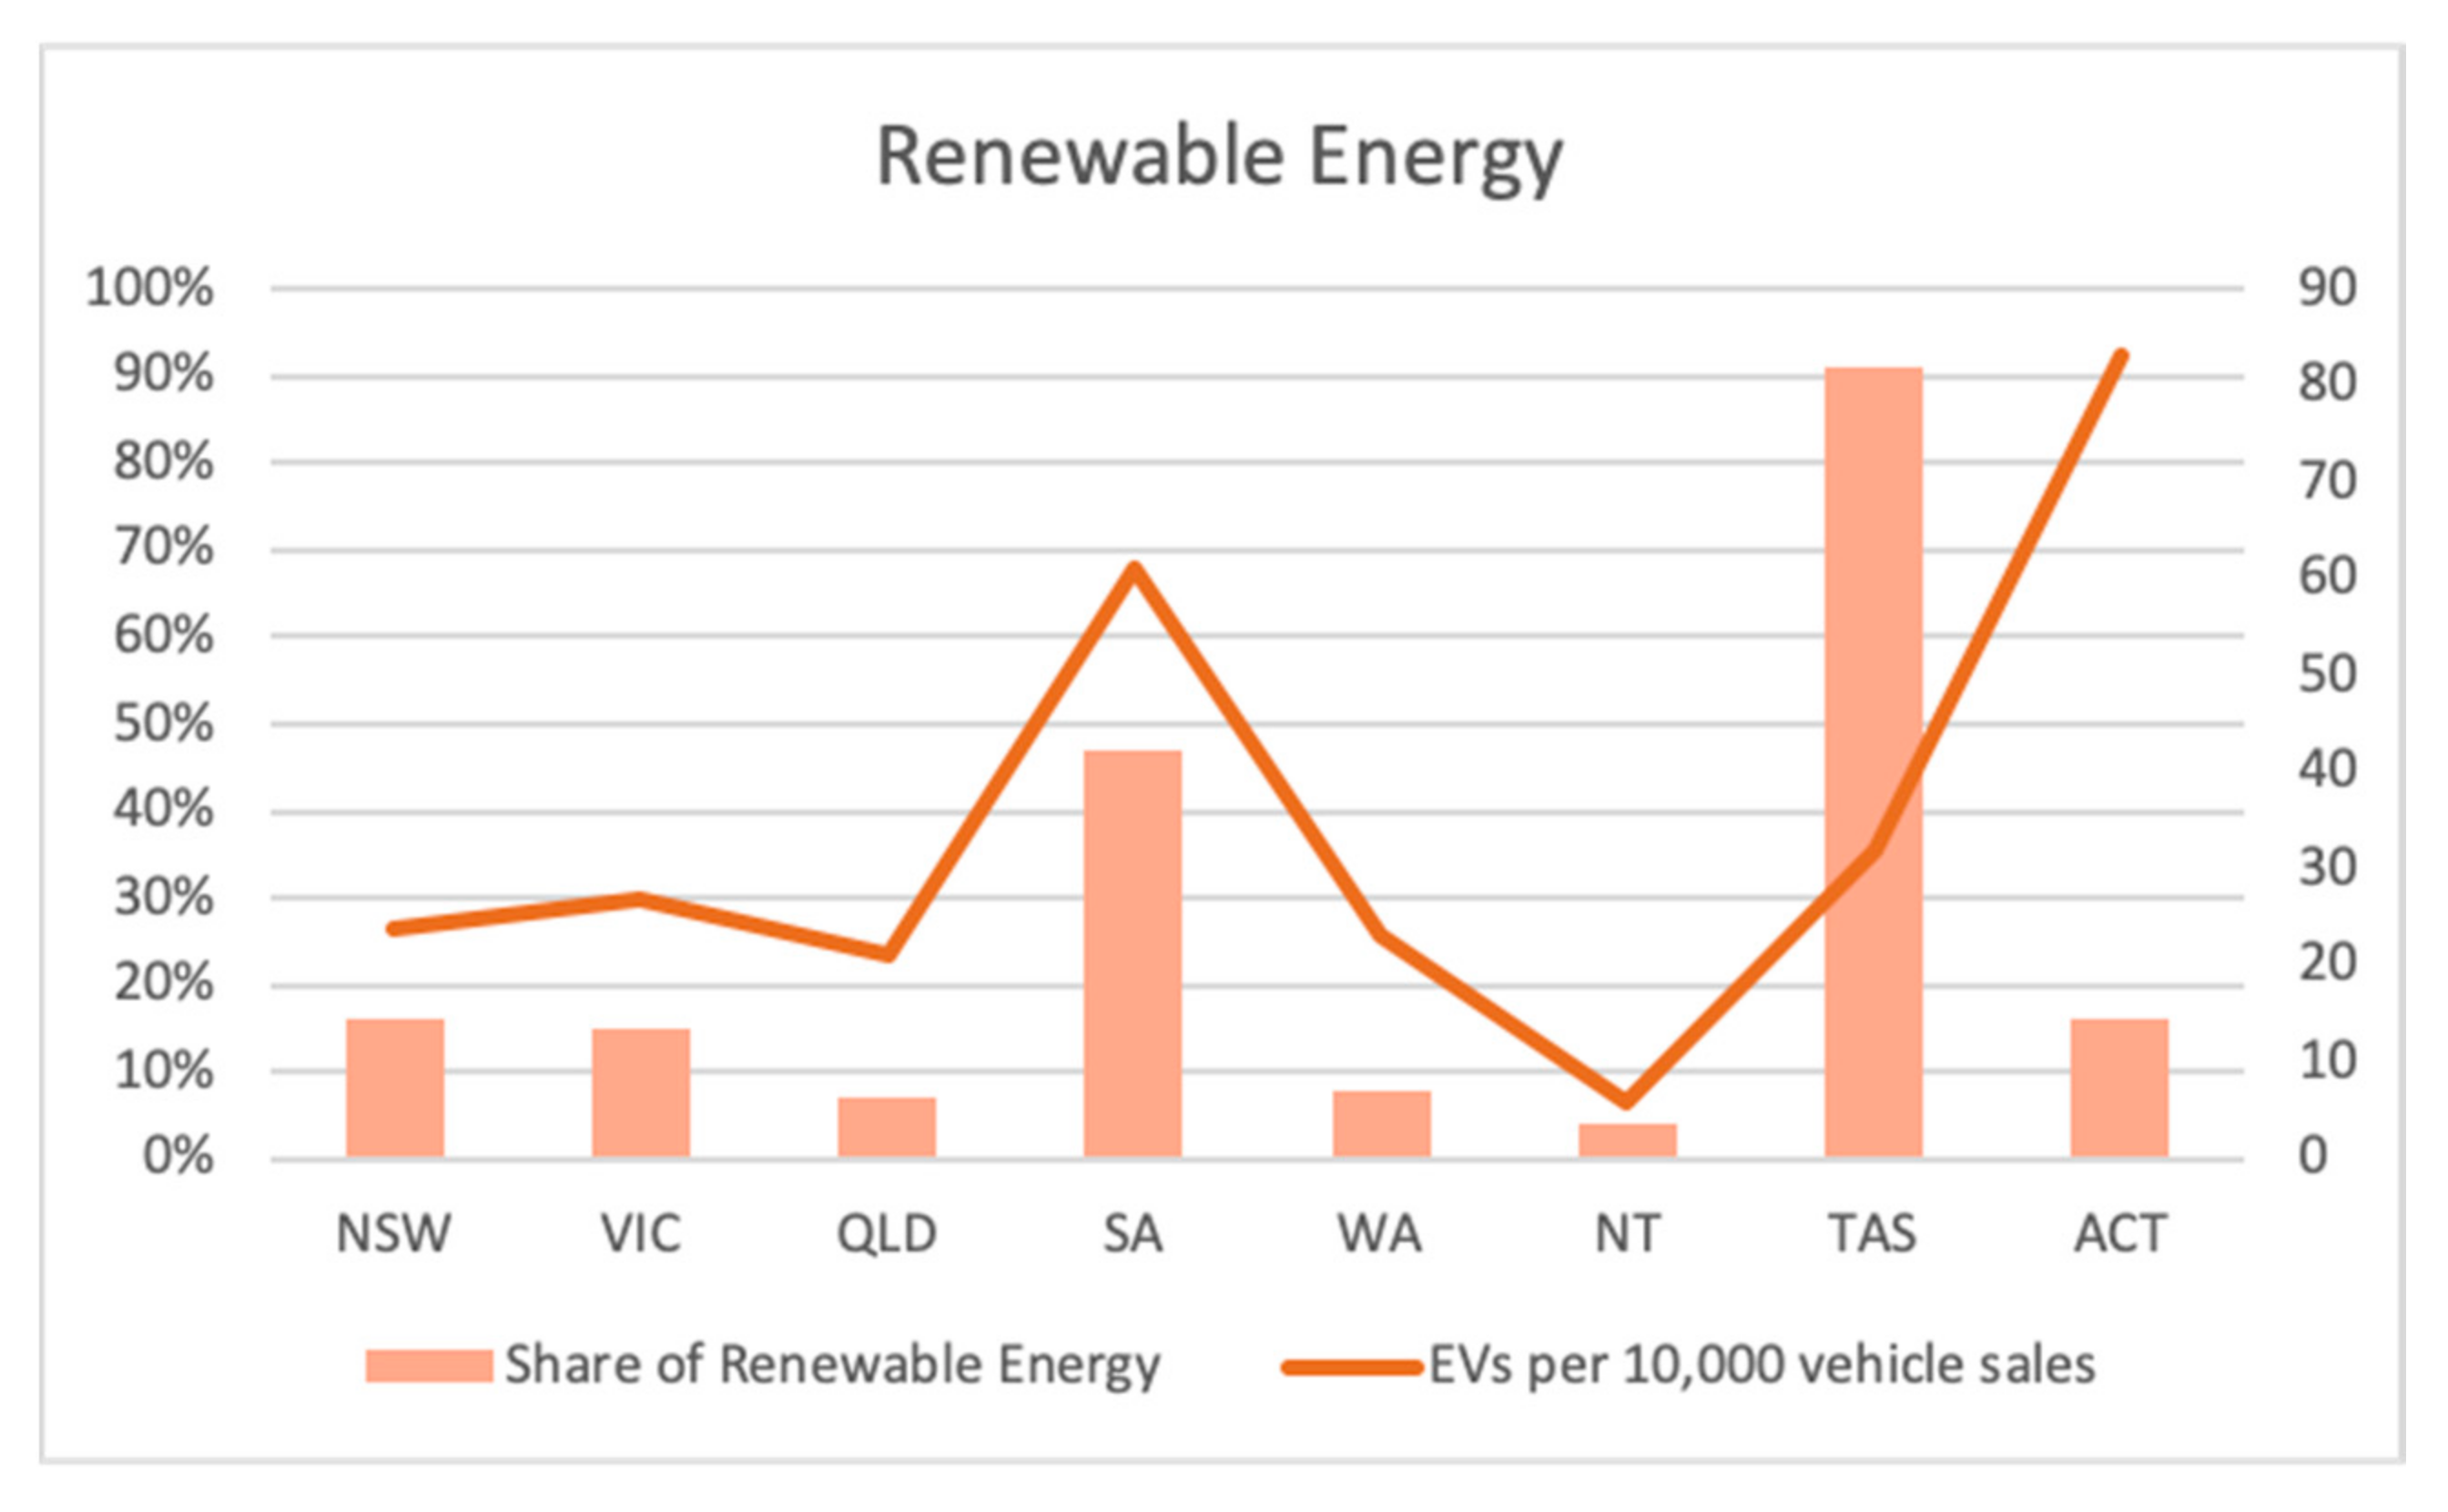
Figure 8 demonstrates the trend of renewable energy share against EV sales per 10,000 vehicle sales. The graph remains fairly consistent until the last two states—TAS and ACT. Degirmenci and Breitner’s [
49] study of 167 German drivers who drove EVs for a test drive that found that the environmental performance of EVs had a strong positive influence on the intention to adopt supports the Australian data, excluding the ACT. It should be noted that this is because this environmental performance was dependent on the electricity powering the EVs being produced from renewable energy sources [
49]. Casals et al.’s [
50] study may provide some explanation for the ACT’s anomaly, as it found three of the top five most EV-selling countries in Europe still rely on highly pollutant electricity power plant fleets.
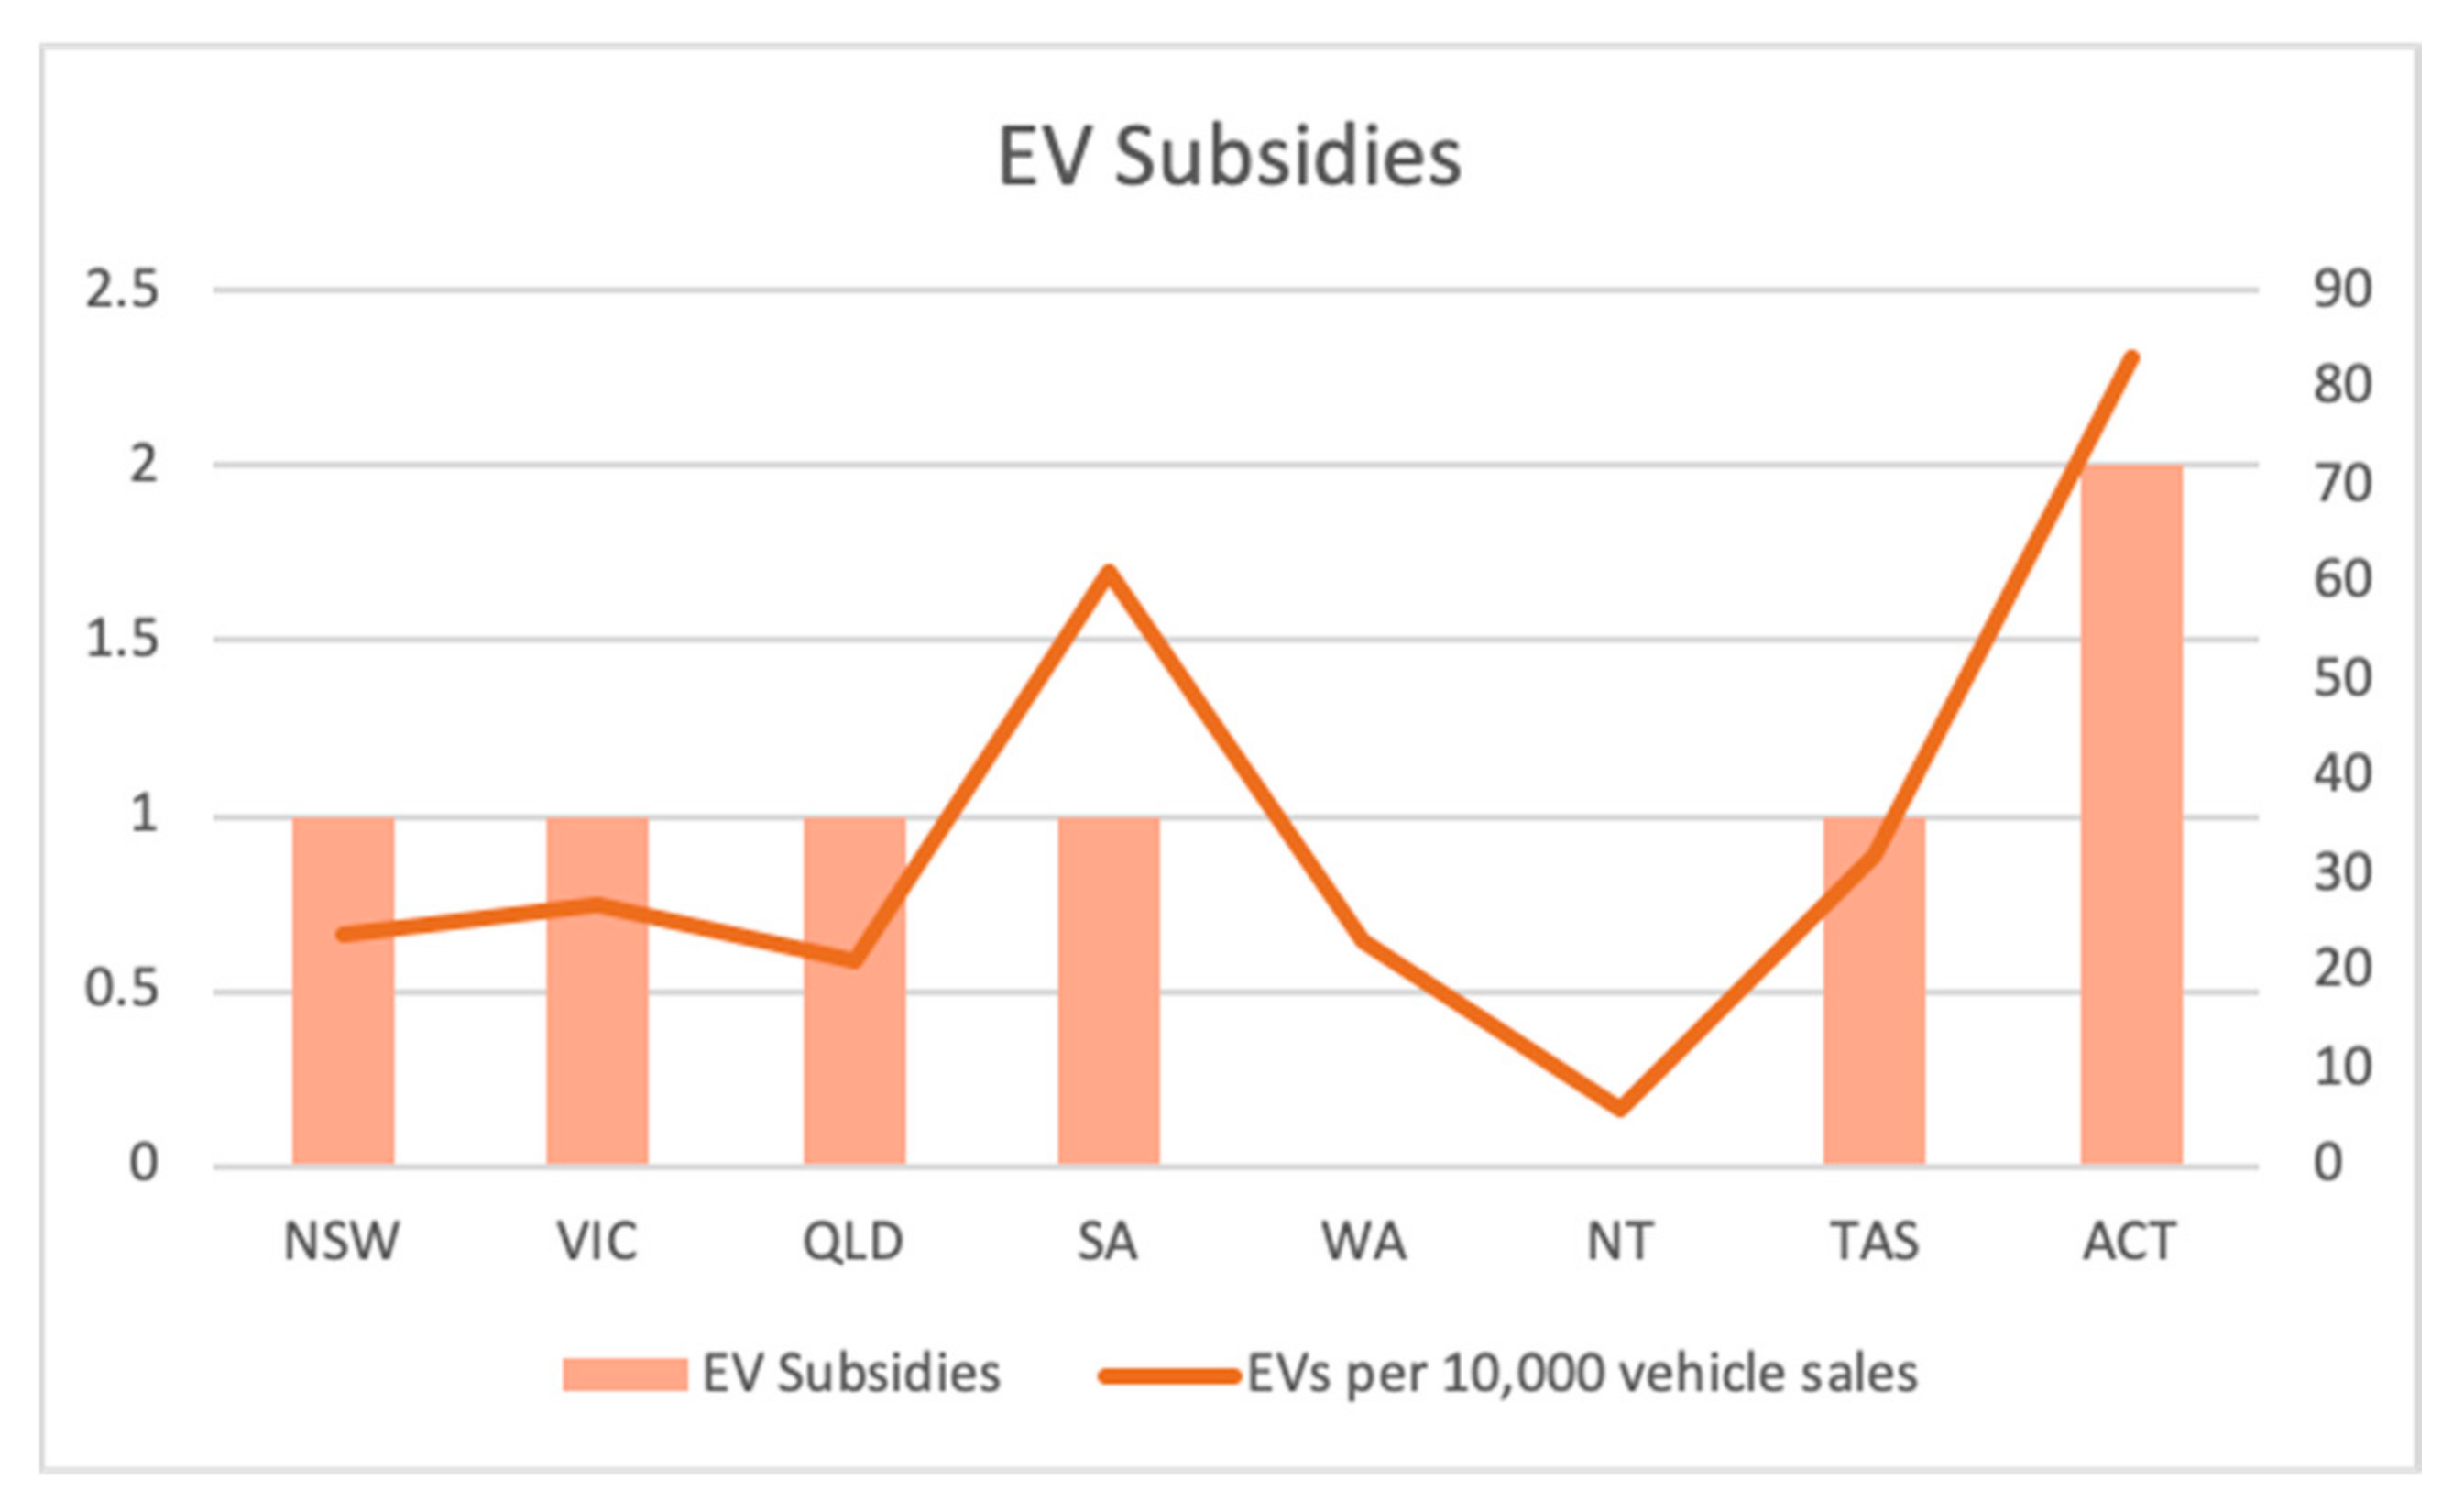
Shepard et al. [
53] suggested that the impact of subsidies is only effective in a smaller market such as Australia, as this is when these types of policies can provide ‘value for money’. This descriptive analysis has revealed that, as a nation, Australia does not offer many subsidies for EVs. This could arguably contribute to the nations slow-moving status within the EV industry. Moreover, with studies suggesting that incentives such as tax credits and fuel taxes could have little effect on EV adoption if consumers have low confidence in EV technology [
9,
58,
59], the impact of Australian subsidies may not be achieving the desired effect [
60]. This could be seen through NSW and WA having a very similar rate of EV sales per 10,000 vehicle rates despite a different number of subsidies offered in their respective states, as seen in
Figure 9. Thus, it could be argued that NSW’s offer of a concession on the motor vehicle tax has no influence over a consumer’s intention purchase, as WA offers no subsidy at all. Yet, as aforementioned, ACT offered the largest number of subsidies, thus aligning with its high rate of EVs per 10,000 vehicle sales.
Closely related to the subsidy issue, unfortunately, Australia lacks strong policies required to stimulate new electric vehicle sales. For instance, Australia has not imposed fuel efficiency standards to discourage the use of polluting cars, has not set a target date for banning sales of new petrol and diesel cars, and has not mandated all levels of government to transition of their vehicles to an electric fleet [
61].
The high upfront cost of EVs could be deemed the primary reason for income having an influence on EV adoption. As Palmer et al. [
12] found that a high adoption rate of EVs within the state of California compared to other US states was attributed to the prevalence of wealth, the high share of high-income earners in the ACT is indicative of the high rate of EV sales. The argument of lower operational costs such as the decrease or total elimination of petrol offsetting high upfront costs [
9] may provide a sound reason for a high rate of EV sales per 10,000 vehicle sales in the states of SA and TAS—the two states with the lowest share of high-income earners (
Figure 10).
Figure 11 looks at the trend of the share of university educated people against EV sales per 10,000 vehicle sales. The line is relatively constant with the exception of SA. In the context of the literature, Zhang et al. [
11] and Heidrich et al. [
14] highlighted education level as a statistical indicator of adoption rates, arguing that this factor is generally associated with environmental awareness and affordability. High levels of education generally indicate high income and are thus associated with the ability to purchase an EV. Yet the argument of education having little influence of a consumer’s intention to purchase an EV is seen in Sierzchua et al.’s [
62] study, where it is concluded that consumers that have high levels of education and are resultantly passionate about the environment only represent a small portion of the overall population within the context of a country.
After looking at the trend of these different factors compared to the rate of EV sales in each state, it is evident that the ACT is the most EV-ready state.
6. Conclusions
This paper explored the EV readiness of Australia by looking at how the critical factors of charging stations, subsidies, renewable energy share, income, and education influence EV sales. Current contemporary international literature advocates that these factors favor EV sales, and thus justifies their use within this descriptive analysis. The unit of analysis used was the eight states and territories of Australia, and factors were measured against the number of EV sales per 10,000 vehicle sales.
The literature highlighted that on average, EVs have a higher upfront purchasing cost than many ICE vehicles [
9], creating an initial barrier to adoption and providing an argument for income being an influencing factor for this adoption. Yet in some cases, such as in the Australian states of SA and TAS, this barrier might be offset by lower operational costs such as the decrease or total elimination of petrol/gas [
9]. Zhang et al. [
11] and Heidrich et al. [
14] further reinforced income and education level as statistical indicators of adoption rates in both China and the UK, respectively, finding that these factors are generally associated with environmental awareness and affordability.
Moreover, studies in Ireland and Japan found that the environmental performance and thus environmental awareness associated with EVs is often more influential in the context of adoption rather than the cost of the car [
20,
63]. This influence can also be dependent on the electricity powering the EVs being produced from renewable sources [
21]. The literature further highlighted that the driving range of EVs is often cited as a concern amongst potential purchasers in Europe, as this range is typically smaller than what an ICE vehicle can offer [
47]. Thus, it is concluded that the notion of readily available charging stations is something that consumers consider before purchasing.
In this Australian study, the number of charging stations was deemed to reflect the population size and geographical reach of each state rather than the number of EVs sold. Essentially the greater the population and the larger the capital city, the greater the number of charging stations available. However, the current number of charging stations within each Australian state/territory did not appear to be sufficient, with the largest number of charging stations being in states that have a lower rate of EV sales per 10,000 EV sales. Thus, governments in the states of NSW and VIC should consider pushing for more sales, as the infrastructure within these areas appears to be adequate.
It should be noted that in the other states, the construction of additional charging infrastructure faces the ‘chicken and egg’ problem [
22], as seen in China. The issue is that, because EVs are an infrastructure dependent vehicle, there needs to be a certain number of charging facilities available for EVs to feasibly penetrate the ICE market [
22]. Hence, investors are hesitant to develop further infrastructure if there is no demand for it. In the UK, the impacts of subsidies were argued to be greater if the market they were targeting was smaller [
53], such as the Australian market, and was thus reinforced in the analysis through the state offering the greatest number of subsides having the highest rate of EV sales per 10,000 vehicle sales. Hence, it could be concluded that subsidies may favor EV adoption in Australia, dependent on their value and when they are applied.
The results from this Australian analysis show that the ACT is the most EV-ready state, as it has the highest rate of EV purchases per 10,000 vehicle sales, at 83. This was reinforced through the state having the highest share of high-income earners at 5.08%, the highest share of university educated people at 37.1%, and through offering the greatest number (two) of subsidies to potential and current EV users. Whilst the share of renewable energy within the ACT did not reflect the strong performance of other indicators, this was attributed to the small geographical size of the area and thus the limited choice of renewable energy sources. Moreover, the number of publicly available charging stations was sufficient in the context of the population and total number of EV sales within the state.
The study findings inform policymakers, car manufacturers, the energy sector, and scholars on the critical success factors for the uptake of EVs in Australia. Nevertheless, with these findings and insights in mind, further research should be focused on a local government level [
64] to allow for a more detailed analysis of factors that are affecting the uptake of EVs in Australian cities. This will help local decision-makers and planners develop collaboratively formed and locally tailored strategies to change the perceptions towards EVs and increase their uptake [
65,
66,
67].
As the descriptive analysis method in this study is fairly straightforward in nature, it could be transferred to other countries with a similar state government framework to Australia. Alternatively, the further research suggested to be conducted on a local government scale in Australia could be conducted on this scale in other countries as well. For this transfer to be effective, countries using this descriptive analysis method should have a comparative EV uptake rate to that of Australia.
While the study at hand advocates the wider uptake of EVs, we also highlight the risks EVs pose for our cities, societies, and the environment. As stated by Hasan and Chapman [
68], ‘EVs seem very attractive at first sight. But when we look more closely, it becomes clear that they have a substantial carbon footprint and some downsides in terms of the extraction of lithium, cobalt and other metals. And they do not relieve congestion in crowded cities’. Hence, while promoting the EV revolution in Australia, authorities should also develop sound policies to mitigate the externalities caused by EVs—e.g., land-use and transport integration [
69] for travel self-containment [
70], decreased private EV ownership and increased shared EVs [
71], clean energy generation for EVs [
72], EV battery recycling [
73], sustainable EV battery development [
74], sustainable EV manufacturing [
75], sustainable development in the EV industry [
76], and changing public perceptions on EVs [
77].


