Article

Structure of Plot Systems and Economic Activity in Cities: Linking Plot Types to Retail and Food Services in London, Amsterdam and Stockholm

1
Department of Architecture and Civil Engineering, Chalmers University of Technology, SE-412 96 Gothenburg, Sweden
2
Department of Mathematical Sciences, Chalmers University of Technology, SE-412 96 Gothenburg, Sweden
*
Author to whom correspondence should be addressed.
Urban Sci. 2019, 3(3), 66; https://doi.org/10.3390/urbansci3030066
Submission received: 7 May 2019 / Revised: 4 July 2019 / Accepted: 4 July 2019 / Published: 9 July 2019

Abstract

:
Plot systems (also referred to as “property”, “parcel”, or “lot”) are generally recognised as the organisational framework of urban form that contributes to the economic performance of cities. However, studies that link the spatial form of plots to economic data are limited. The paper builds on the theory of Webster and Lai, which argues that the process of urbanisation is aligned with increased subdivision of property rights (increased division of land into plots, for example) due to the process of economic specialisation that is typical of cities. The aim of the paper is to test this theory by analysing whether there is a correlation between: (a) the shape and structure of plot systems, which are classified as types based on three plot metrics (size, compactness, and frontage index) and b) economic activity, measured as the concentration of retail and food activities per plot. The paper will use statistical analysis to relate plot types to economic activity in three European cities (London, Amsterdam, and Stockholm). The results provide empirical support for our initial hypothesis and Webster and Lai’s theory, which states that plots of smaller size, more regular shape, and smaller frontage generally correspond to a higher concentration of economic activity in cities.

1. Introduction

1.1. Background

There is a need for more in-depth studies of urban form while living in a thoroughly urbanised world, both to better understand urban processes and to be able to direct them onto sustainable trajectories. Two morphological layers of urban form are most often addressed in this respect: streets and other forms of infrastructure (distribution of accessibility in urban space) and buildings (distribution of densities). The distribution of land division is less often addressed, in the form of plots and plot systems (also referred to as “parcels”, “lots”, or “properties”). This is unfortunate, since these have a decisive role in bridging between the city as a physical entity and the city as an institutional entity; these attributes are generally recognised as the administrative framework, which spatially defines the distribution of property rights for land [1,2,3].
The distribution of property rights in cities has been recently broadly addressed in a range of works studying urban issues from the institutional economics perspective [4,5,6,7,8,9]. While many studies in this area address the theme of urban redevelopment and regeneration strategies [10,11,12,13], this paper particularly builds on the theory of spatial order of property rights and urban economy, as presented by Webster and Lai [1]. They argue that the long-term process of urbanisation is aligned with increased subdivision of property rights, due to the process of economic specialisation that is typical of cities. For urban land, this means subdividing larger plots into smaller and more regularly shaped ones (ibid., p. 92).
The aim of this paper is to test a few of the assumptions in Webster and Lai’s theory, relating to plot systems as delineations of property rights in cities. More specifically, we will test the correlation between the shape and structure of the plot systems, being classified as types that are based on three plot metrics that were defined in earlier studies (size, compactness, and frontage ratio) [14,15] and economic activity, being measured as the concentration of retail and food services per plot.

1.2. Earlier Research

Our study is positioned within the broad idea that spatial urban form can condition and influence socio-economic processes in cities, a topic that is extensively addressed in recent research on urban form, not least in the field of space syntax [16,17,18,19]. Space syntax is a set of analytical theories within urban morphology, which investigates the correlation between spatial form and social processes and it focuses on analysing the spatial configurations of street networks [16,20]. However, with a few exceptions [21,22,23], space syntax research does not generally address plot systems. However, urban morphology recognises them (along with streets and buildings) as one of the three fundamental components of urban form [24,25,26,27].
Earlier studies that have addressed the more particular correlation between urban form and economic activity have mostly focused on the role of street centrality or built density. In particular, a wide range of studies has addressed a long list of socio-economic topics [17,28,29,30,31], such as studies on land-use mix [32], mixed-use indices [33], or land values [34,35,36,37,38]. Similarly, studies of built density [39] have shown that there is a high correlation between built density and the number and diversity of economic activity in cities. Additionally, a high level of built density is often associated with high population density, which is commonly recognised as a generator of high concentrations of retail and service activities in cities [40,41,42,43,44].

1.3. Hypothesis

The impact of plot systems has been much less studied [45], despite its central role in urban morphology and theories of urban development and economic activity in cities (such as Webster and Lai’s). We take Webster and Lai’s theory as a starting point for a series of empirical examinations to remedy this, relating the shape and structure of plot systems to the distribution of economic activity.
The descriptions of the shape and structure of plot systems that we use are built on earlier studies, in which three quantifiable morphological variables have been introduced [14]. These are: size, which is self-explanatory; compactness, which concerns the regularity of plot shape; and, frontage ratio, which concerns the ratio between plot street boundary and its total perimeter. Theoretically, the first two relate to both Webster and Lai’s theory [1] and Conzen’s concept of the burgage cycle (the evolution of built space over time, bounded by the spatial and legal framework of the plot) [24]. The third variable captures the degree of connectivity between local design decisions for buildings and the global street structure of cities, as discussed by Vialard [46].
We hypothesise that all three variables contribute to the distribution of economic activity in cities and, more particularly, following Webster and Lai, that plot types of smaller size, rectangular shape, and small street frontage are associated with higher degrees of economic specialisation in cities. The notion of economic specialisation is rather broad and it includes both the number and diversity of economic activities in cities. In this paper, we narrow this down and operationalise it as the concentration of food and retail services commonly found in central urban locations and generally recognised as pedestrian-oriented [18,47,48,49,50].
Importantly, the paper is limited to the study of the spatial dimension of plot systems and it does not take into consideration such things as the impact of land-use regulations. It is fully recognised that such regulations are vital for the distribution and intensity of economic activity in cities, and hence also a central instrument of urban planning. However, our starting point is the form of plot systems and not the content of land-use regulations, even though the former may be part of the latter.

1.4. Outline of Paper

The outline of the paper is as follows. Section 2 presents the theoretical background, linking the plots to the process of economic specialisation in cities in general and pedestrian-related economic activity in particular. Section 3 presents the methodological approach of the study, supported by the theories that were introduced earlier. In Section 4, we report the results of the statistical analysis. In the conclusion and discussion sections, the results are summarised and discussed in relation to the theories and earlier findings that have been presented. The paper ends with suggestions for future research.

2. Theoretical Background: Differentiation of Plots and Economic Specialisation in Cities

2.1. Property Rights and Urban Development

There is a range of studies [1,6,7,8,9,51,52] that take an institutional view of the practical task of “governing, administrating, managing and planning cities” [1]. For example, Webster and Lai [1] do so from the broad assumption that cities are driven by “constrained spontaneity” (ibid., p. 4), where spontaneity concerns distributed individual action (typically taking the form of markets) and the constraints are constituted by formal and informal institutions. Central to their argument is property rights theory, in which any commodity, including land, has multiple attributes that, in principle, are infinitely separable, so that rights can be assigned to them (ibid., p. 7). According to this theory, the degree to which such rights are assigned partly depends on the value of the attribute in itself and partly on the cost of assigning or maintaining such rights (ibid., p. 7). The latter includes the creation of legal frameworks and the administration and the policing of these (generally referred to as “transaction costs”). Importantly, the property rights concept is understood here within the legal geography framework, where the property right is understood as the right to exclude [53]. It is implied that the critical characteristic of property is not the relationship between owner and owned, as the classical view on property rights theory presupposes [54], but the relationship between the owner and other owners in reference to things owned [53,55,56]. Further, the concept of land property as the right to exclude is essentially spatial [57]. According to Barthes, as cited by Blomley [53] “ownership depends on a certain dividing of things: to appropriate is to fragment the world, to divide it into finite objects subject to man in proportion to their very discontinuity; for we cannot separate without finally naming and classifying and, at that very moment, property is born”. In addition, the particular focus of this paper is the division of land, that is the layer of plot systems though the fragmentation of property rights can generally happen over land, building, or attributes [1].
More particularly, we see how property rights theory relates to the structure and shape of plot systems as a central management tool when it comes to the use of urban land. We may observe, as Webster and Lai, the typical tendency in cities towards an increased subdivision of land as we move towards the centre. More central locations have greater access to a larger number of people, which provides an opportunity for increased specialisation of economic activity. Therefore, these locations will face increased competition that will raise land values. This can outweigh the increased transaction costs of further separating property rights, such as a finer division of land. However, the counteractive tendency illustrates the instability of this; when cities continue to grow, plot systems in such a central location tend to change towards coarser land-division. This is because, at some point, such super-central locations may be more efficiently centrally managed (as with shopping malls), avoiding the transaction costs of a long series of land contracts. The “plot system” (representing the delineation of property rights) then reappears in a new form as a structure of sublet floor space within the shopping mall, representing cheaper transaction costs than land contracts. Although interesting to investigate, this subdivision on another level is outside the scope of this paper, which is limited to studying the subdivision of land plots.
We find Webster and Lai’s outline for an urban theory of great interest. Firstly, they pinpoint the central forces driving urban development from the perspective of institutional economics. Secondly, in direct correlation to this, they underline the importance of the concrete delineation of property rights for efficient urban governance and planning. This exemplifies the need for a deeper understanding of the role in urban processes that are played by both the structure and shape of plot systems. On the one hand, the importance of plot systems to this kind of urban process extends the institutional discussion into the field of urban morphology, demonstrating how the theory of institutional economics in cities also needs to be supported by the theory of urban form. On the other hand, it extends the practices of urban governance and planning to the practice of urban design, demonstrating how successful urban governance and planning is dependent on informed and skilful urban design. It is important to mention that particular economic processes are followed by institutional changes in Webster and Lai’s theory, which, in turn, drive changes in spatial order of cities. Hence, in this paper, we do not intend to claim that physical form of cities determines urban processes. Rather, our intention is to understand how physical form can create conditions that generate more or less probable outcomes in such processes, that is, a probabilistic relation between the two.

2.2. Economic Specialisation and Morphological Description of Plots

This theory opens the way to a series of possible studies, in which we begin by asking whether the principle of increased specialisation of economic activity, which is typically found in cities, relates to increased separation of property rights for urban land in the form of more fine-grained plot systems.
Importantly, there are two sides to specialisation of economic activity. According to Webster and Lai [1], economic specialisation is a process of concentration of spatially differentiated uses (p. 29). In other words, we see how economic specialisation implies both an increase in the number of uses and an increase in their diversity.
We intend to investigate the aspects of both specialisation in economic activity (for the case of food and retail services) in cities and its correlation to the structure and shape of plot systems, with the aim of empirically testing some of the assumptions in Webster and Lai’s theory. This paper will address the first aspect: is there a correlation between the structure and shape of plot systems in cities and the number of economic activities (in other words, their concentration)? In another paper [58], we will return to the question of whether and, in what sense, such economic activities may also be understood as diverse.
Webster and Lai [1] lay out their argument that the long-term process of urbanisation is aligned with the subdivision of property rights. They point out that land plots that emerge in cities through the process of economic specialisation are generally smaller in size and more regular in shape than rural land parcels (ibid., p. 92). In order to actually test that, we need the descriptive means to consistently capture the morphology of the plots and plot systems.
Earlier research [14,57] identified three variables for describing and measuring plot systems: plot size, plot compactness index (ratio between plot area and area of its minimum bounding rectangle), and plot frontage index (ratio between plot street frontage and its total perimeter). These three variables were selected from a set of urban morphology theories (ibid.), which address different spatial variables of plots that relate to such aspects as urban diversity [21,23], temporal evolution of urban fabric [24,46,59], and the public-private interface [27,60]. Importantly, they allow for the differences between any kinds of plots in cities to be quantified and captured, whether historical centres, post-war areas, or natural landscapes [14] (see Appendix B). We further hypothesise that all three variables can support increased economic specialisation in cities. We developed plot types, using clustering analysis, which allows for the recognition of urban patterns to test the combined effect of the three variables [61]. Subsequently, we compared the differences between these patterns in different cities and reduced the number of variables that were included in the statistical model [15,42,62].

3. Methodology

3.1. General Overview of the Methodological Steps

The general methodological steps include: (1) selecting study areas, (2) measuring the dependent variable of economic activity concentration, (3) measuring the independent variable using plot types, (4) constructing statistical models by controlling for variables of street centrality and built density, and, finally, (5) analysing whether there are any statistical differences in terms of the distribution of the dependent variable between the plot types (Table 1). Steps 1–3 were developed in earlier research [14,15,57,63] and they will be briefly described below. Steps 4–5 are the particular focus of this paper and are described below in detail.

3.2. Step 1. Study Areas: London, Amsterdam and Stockholm

Our data is collected from three Northern European cities: London, Amsterdam, and Stockholm. In earlier research, we developed extensive GIS-based models of spatial form for these cities, including street networks, building densities, and plot systems, as well as additional socio-economic data on economic activity at the fine-grained level of individual address points. Broadly speaking, these cities share socio-economic conditions, but they vary greatly in their legal systems and planning traditions. The study areas include metropolitan areas of the cities, which extend beyond mere municipal borders. For this reason, the Urban Morphological Zone (UMZ) boundaries are used, as defined by the European Environment Agency (EEA) (see Table 1).
The plot systems data is based on cadastral data for Stockholm and Amsterdam and freehold properties data for London (similar to cadastral data, this corresponds to ownership of the property, and the land it stands on) [64]. Cadastral and freehold properties both generally cover all sorts of land, including streets and water, so the plot systems applied were extracted from original cadastral/freehold data based on Hillier’s notion of “generic function” [20]. He argues that cities are spatial reconciliations between the two conflicting, generic uses: occupation and movement, where spaces primarily intended for occupational use comprise city blocks and those primarily for movement use comprise streets [20]. This means that only plots for long-term occupational functions were selected, while the plots for water or movement networks were excluded [14] (Table 1, Step1).

3.3. Step 2. Dependent Variables: Concentration of Economic Activity in Cities

The model for economic activity includes the concentration of retail and food services, because, in general, such activities are recognised as typically pedestrian-related [18,47,48,49,50]. The model is based on point data taken from Open Street Map. The concentration of economic activity is measured per plot unit and is calculated as the sum of economic activity (the count) within each plot divided by the plot area (Table 1, Step 2.2).
To check for land-use regulations, plots with zero values (no economic activity) were excluded from our analysis. so as not to include observations (plots) in which economic activity is not allowed (Table 1, Step 2.3). We understand this may also exclude cases that allow for economic activity that has not been realised; therefore, we offer only a partial check of land-use regulations.

3.4. Step 3. Independent Variables: Plot Types

Seven plot types are generated based on the three plot measures (input variables): plot size, plot compactness index, and plot frontage index, as described above (Table 1, Step 3) [15].
The three variables that were used for clustering are initially geometric and they capture the individual properties of each plot. However, they are then translated into accessibility measures (walking distance through the street network), because our focus is on capturing the quality of locations described by their dominant plot pattern and not by the individual qualities of each plot (Figure 1. For a detailed explanation of measures, see Appendix A).
Consequently, plot size is measured as the number of plots accessible from every single plot, within a 500 m walking distance, utilising the fact that, if the plots are smaller, there is normally space for more plots. The indices of plot frontage and plot compactness are also measured as accessible frontage index (APF) and accessible compactness index (APC), respectively. These capture how much street interface plots have or how compact the plots are within a 500 m walking distance from each individual plot. The chosen measuring unit is a 500 m radius; commonly recognised as the distance people are willing to walk [65].
Seven plot types (Table 1, Step 3.1) have been analytically generated while using k-means cluster analysis and based on the variables that are introduced above (for details of the method, see Berghauser Pont et al. [15]) (Figure 2, see also Appendix B). These seven types form distinct plot patterns, highlighting important similarities and differences between them. The first two types, “fine-grain compact” and “fine grain medium-compact” (PT7 and PT6, Figure 2), are distinctive for having the highest accessible number of plots in combination with the smallest accessible plot frontage index and the highest accessible plot compactness index (highest in PT7 and slightly lower in PT6). They are frequent in London and Amsterdam but are not found at all in the Stockholm.
The second group of types, “medium-grain” (PT1 and PT2 “compact” and “medium-compact” respectively, Figure 2), can generally be described as having medium accessibility to plots, relatively high accessible plot compactness index values, and low accessible plot frontage index values. PT2 has higher accessible plot compactness index values than those of PT1.
The third group of types, PT3 and PT4, is characterised by the lowest accessible plot compactness index values. These are called “large-grain non-compact” and “medium-grain non-compact” respectively.
The last plot type (PT5) is distinct from all other groups, based upon the highest accessible plot frontage index, because these plots often comprise a single block that is surrounded by streets on all sides. It is therefore called “open plots”.

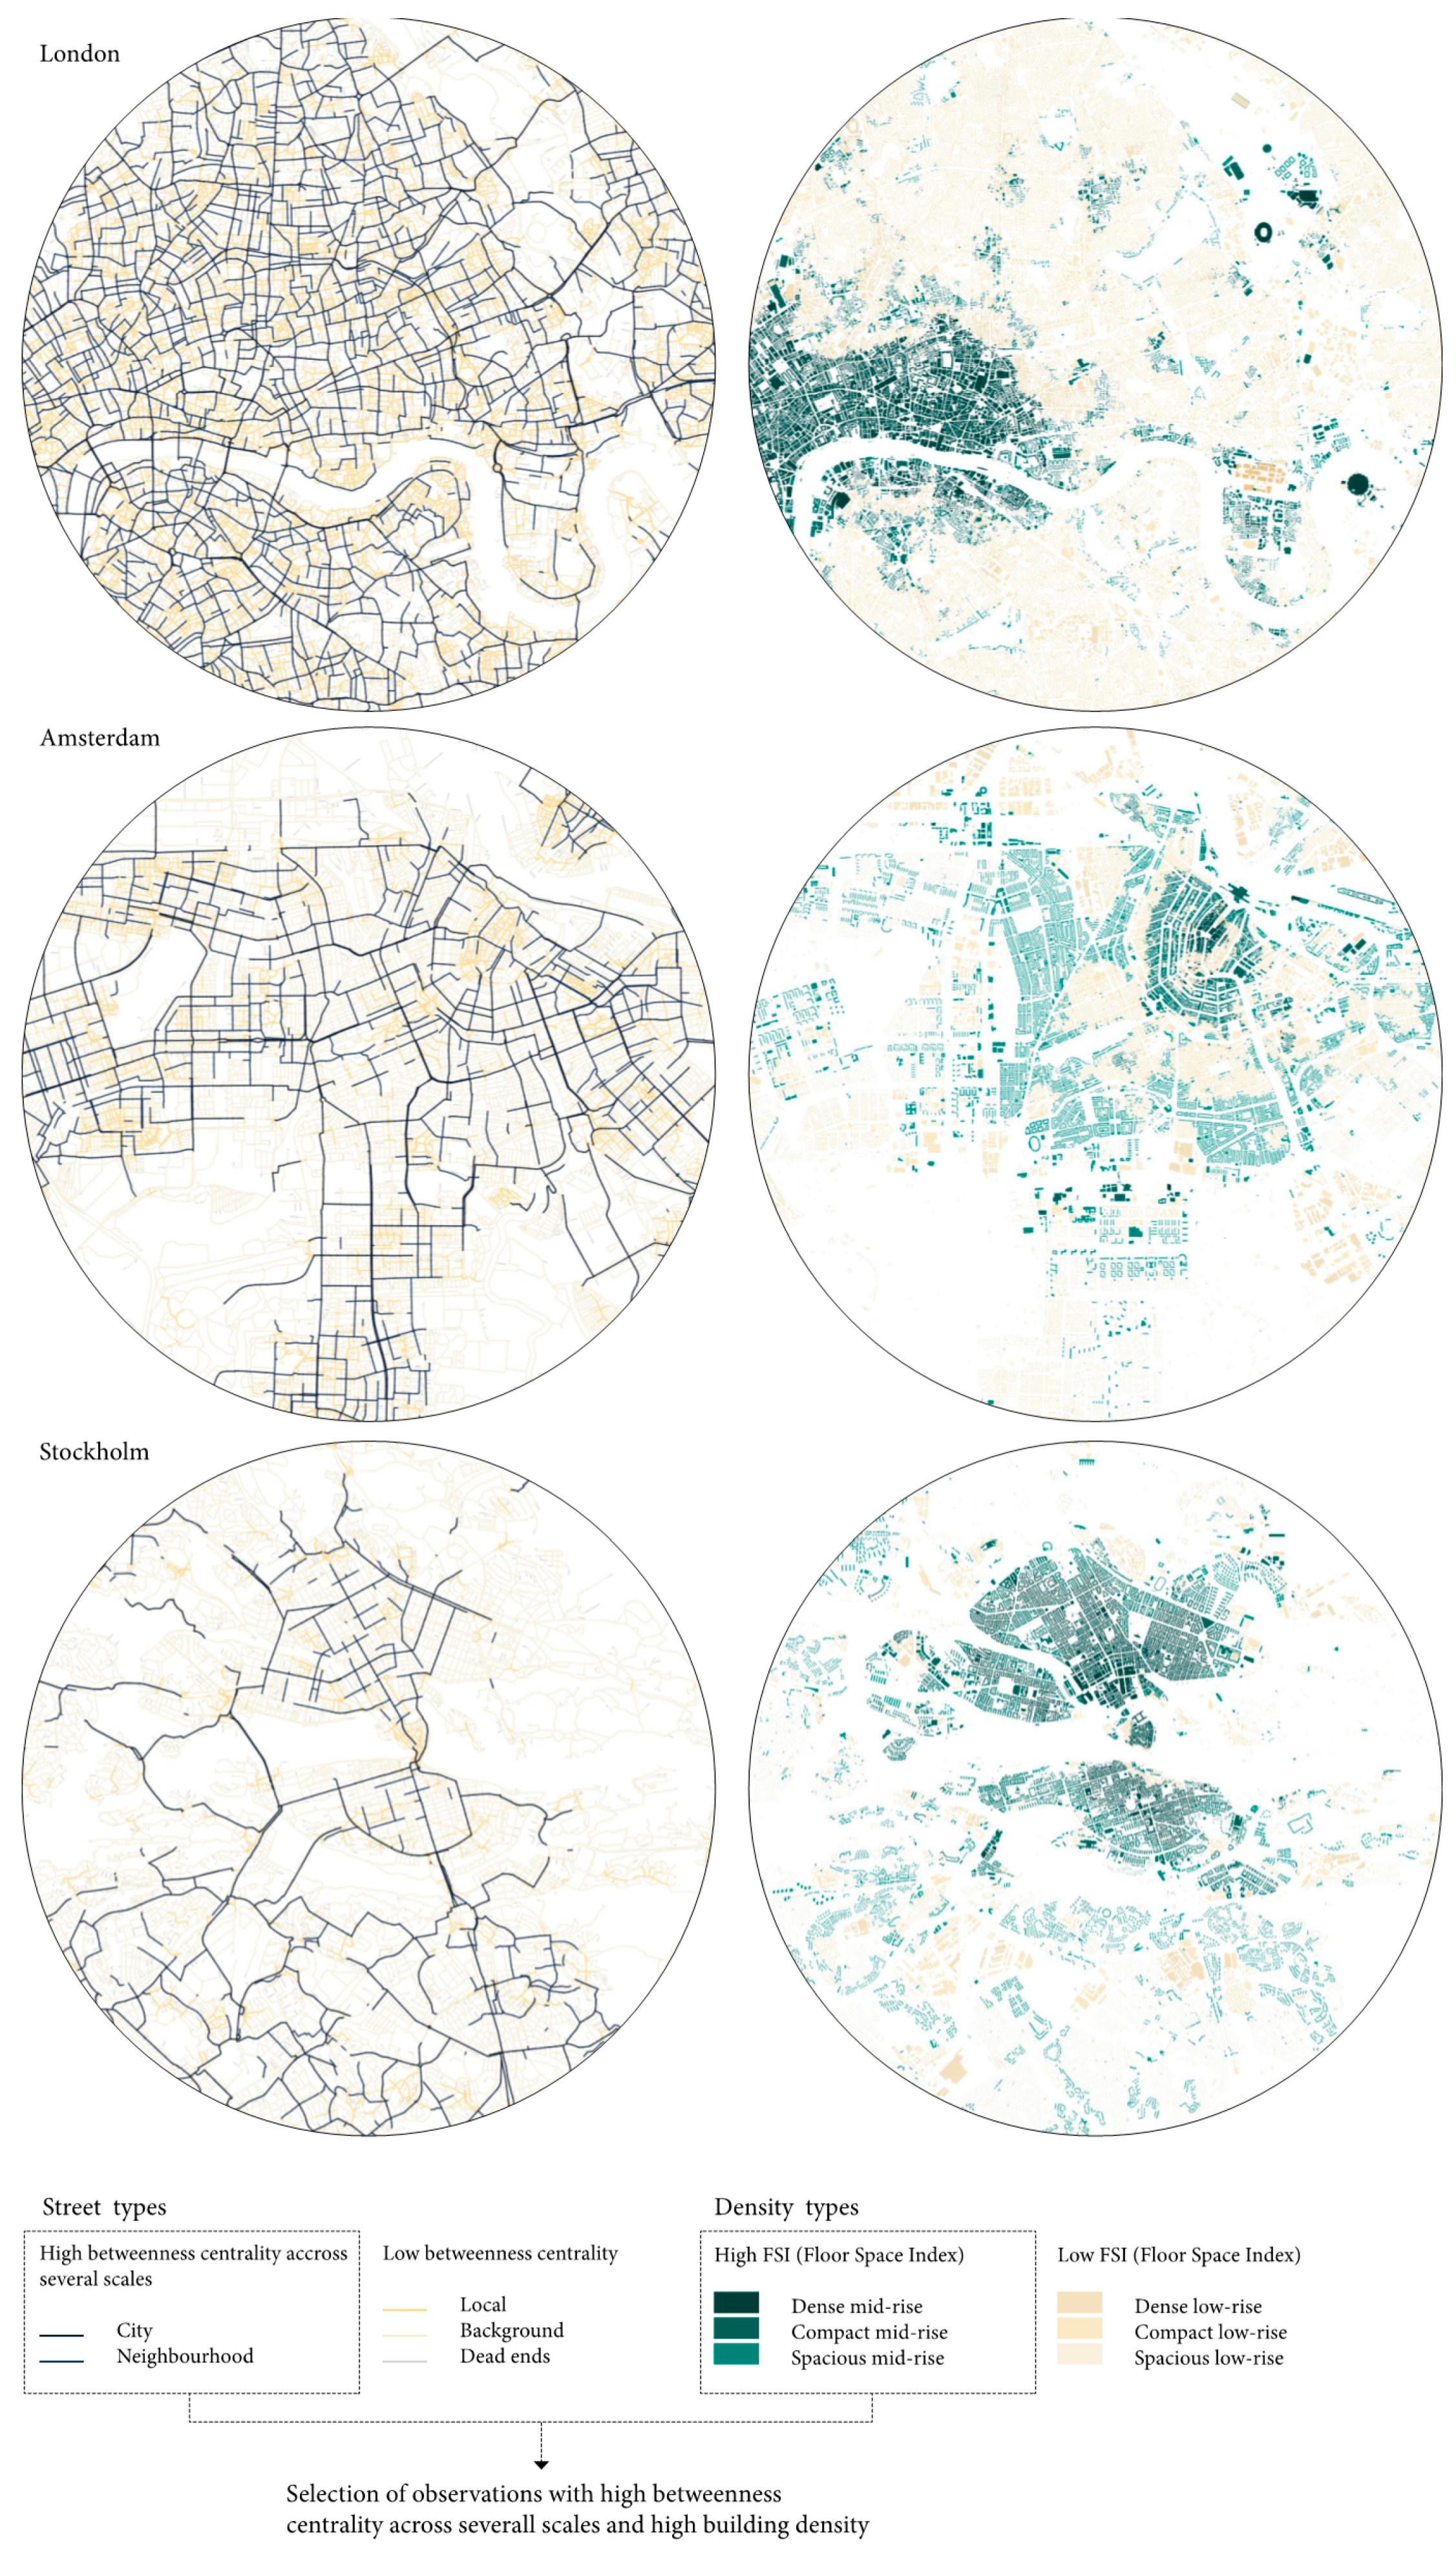
3.5. Step 4. Preparing Models to Control Variables of Street Centrality and Built Density

To control for influence of built density and street centrality, variables that are often associated with more economic activity, we select our observations from locations where these are similarly high. We use street and building types that are analytically generated in earlier research [15,63] and that have been shown to correlate with the number of economic activities [39].
Multi-scalar centrality street types were generated while using centroid-based clustering based on their individual Betweenness centrality profile through different scales [63]. The cluster analysis resulted in five centrality types, where observations from the two types (‘City’ and ‘Neighbourhood’) have been included in our analysis, having high betweenness centrality across most scales. Berghauser Pont et al. [63] developed building density types while using cluster analysis based on two input variables: Floor Space Index (FSI) and Ground Space Index (GSI) [42], measured within 500 m walking distance. The clustering generated six density types, from which observations only within three types were selected to be included in our analysis: “Dense mid-rise”, “Compact mid-rise”, and “Spacious mid-rise”, which correspond to high building density (see Table 1, Steps 4.1 and 4.2, also Appendix C [15]). Only observations that correspond to these street centrality types and build density types are included in the statistical model. By doing this, we ensure that variables of centrality and density remain constant in the selected observations, while there is still variation in the plot structure, allowing us to analyse the effects of plot structure on the variations in the concentration of economic activities. The resulting selection of observations (plots) for statistical analysis, including the concentration of economic activity, is presented in Figure 3. Figure 4 further demonstrates the variation between plot types within the selected observations.

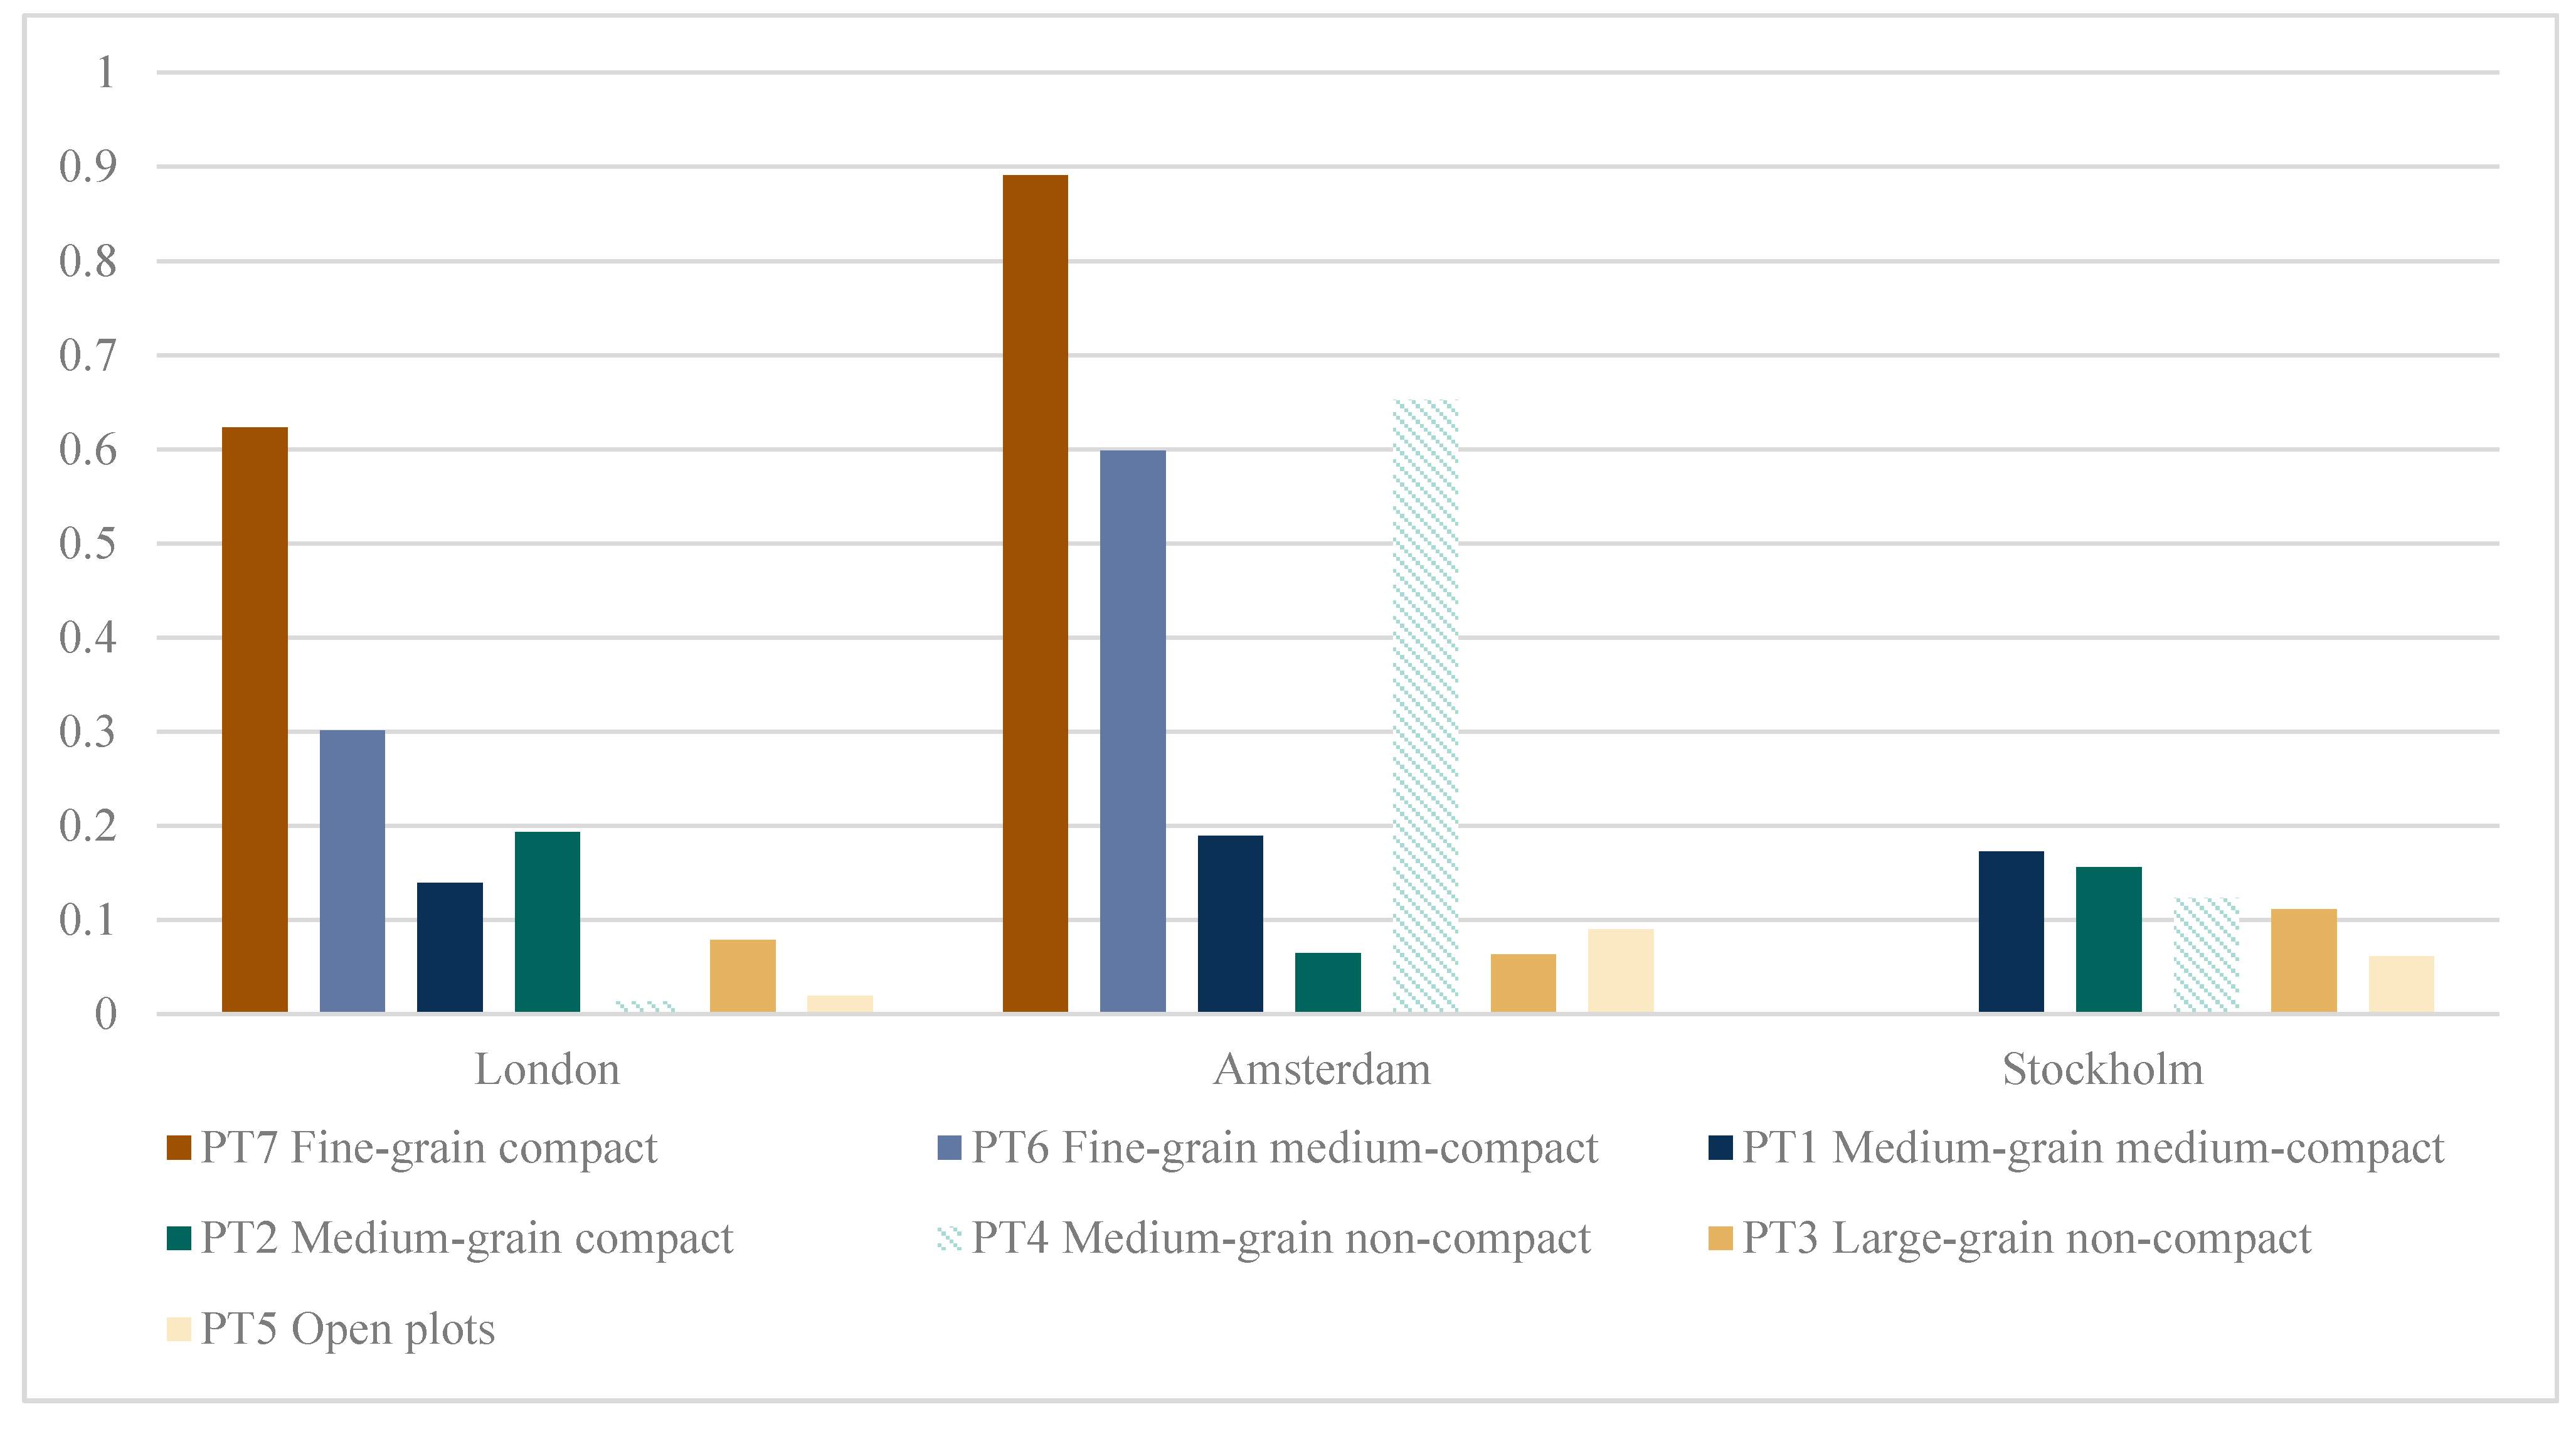
3.6. Step 5. Statistical Analysis of Differences between Plot Types in Terms of the Dependent Variable

The statistical analysis compared seven plot types, with the question at hand being whether there are any differences between plot types in terms of the distribution of economic activity. The Kruskal–Wallis H test is applied to assess that. This is commonly used as a non-parametric alternative to a one-way ANOVA analysis when the data fails the assumptions that are required for ANOVA (normality of dependent variable distribution, lack of outliers, and equal variance within each plot type) [66]. The Kruskal–Wallis H test allows for us to deal with particularities in our data (where the shape of dependent variable distributions is dissimilar across plot types) by comparing mean rank values. Mean ranks are relative values that show if the scores of the dependent variable are generally higher in one plot type when compared to another.
The analysis is separately processed for each city, to see whether there are differences or particularities of the dependent variable distribution between cities. The procedure is described as follows.
First, the test is run to assess whether the distribution of economic activity is the same across all plot types. If the distributions are identical, which is the null hypothesis for the Kruskal–Wallis H test (p > 0.05), no further analysis will be processed. If there is significant difference between them (p < 0.05), we proceed to the next step.
Next, the shape of the distributions of the dependent variable is assessed, based on a visual inspection of box plots and plotting empirical distributions of the variable (see Appendix D). The mean ranks values between the plot types are then compared.

4. Results: Differences between Plot Types in Terms of Economic Activity Concentration

A Kruskal–Wallis H test was run for each of the statistical models and it showed significant differences between the plot types, in terms of dependent variable distribution based on the null hypothesis of the Kruskal–Wallis H test (p < 0.05). Further, the shape of distributions was evaluated for the model of each city (see Appendix D) and it showed that the shape of dependent variable distribution was not similar; therefore, we proceeded with a mean rank values comparison (Figure 5).
The mean rank comparison demonstrated clear regularity, where fine-grain and more compact plots with small frontage ratios, such as PT7 and PT6 (Figure 5, brown and light-blue) in London and Amsterdam, and PT1 and PT2 (dark blue and dark-green) in Stockholm, were associated with the highest concentration of economic activity. This contrasted with large-grain and non-compact plot types, such as PT3 and PT5 (Figure 5, light-brown and beige).
The non-compact plot types are also compared with compact plot types of similar grain size; PT4 with PT2, and PT6 with PT7. Although PT4 is underrepresented in each city (less than 5% of the observations, Figure 5, dashed light green), in London and Stockholm, it is still distinctly different from PT2 (dark green). The same observation was found by comparing the performance of PT7 and PT6, in which more compact plot types of similar grain size, such as PT7, correspond to generally higher concentrations of economic activity. These findings support our hypothesis that not only size, but the degree of plot compactness contributes to the concentration of economic activity in cities.
We further compared the plot types characterised by different degrees of plot frontage ratio, but with relatively similar grain size and compactness: PT3 (Figure 5, light brown) and PT5 (Figure 5, beige), with the latter having the highest frontage ratio. In London and Stockholm, there was a distinct difference between these two types. The one with the lowest frontage ratio (PT3) was generally associated with higher concentrations of economic activity, when compared to PT5. This difference was not especially distinct in Amsterdam.
To summarise, we found a clear indication that all three measures, albeit to different degrees, contribute to higher concentrations of economic activity based on statistical analysis of the differences between the plot types, in terms of the distribution of the dependent variable of economic activity. This provides empirical support for our initial hypothesis, and Webster and Lai’s theory, that plots of smaller size, more regular shape and smaller frontage generally correspond to higher concentrations of economic activity in cities.

5. Conclusions: Importance of Plot Types for Distribution of Economic Activity in Cities

The aim of this paper has been to empirically test some of the assumptions in the theory of urban development that was presented by Webster and Lai [1]. They propose that plots of smaller size and more regular shape emerge with the process of economic specialisation in cities and, hence, contribute to higher concentrations of economic activity in cities. We analysed the correlation between morphological variables of the structure and shape of plots and the spatial distribution of the concentration of economic activity in three cities. Economic activity was measured, as the number of retail and food services per plot divided by plot area. The spatial form of plots was also described while using plot types that are based on three plot measures: plot size, plot compactness, and plot frontage ratio.
From the results of the non-parametric Kruskal–Wallis H test (which allowed us to analyse whether there was any statistical difference between the plot types in terms concentration of economic activity), important conclusions can be drawn. Firstly, plots that are characterised by small grain size, high compactness, and low frontage ratios have higher concentrations of retail and food services when compared to plots with the opposite characteristics. Secondly, it was found that more compact plot types of similar grain size type, as well as plots with higher frontage ratio and similar grain size, have higher concentrations of economic activity. These findings support the theory of Webster and Lai [1] regarding urban development, in which the distribution of property rights plays a central role.

6. Discussion: Possible Extensions of the Current Study

In this paper, our particular interest was the correlation between plot types and economic activity, as measured by retail and food services in cities. We captured economic performance by simply measuring the concentration of economic activity. This followed Webster’s theories [1], which consider reduced distance between economic activities as a critical factor of successful market co-operation. This can be extended to a more general idea of urban diversity [21,23], which proposes that smaller plots not only contribute to a more intense use of space in respect of the concentration of economic activity, but they also increase their diversity. Hence, an important extension of the current study is to measure the correlation between plot systems and urban diversity: this topic calls for further investigation and it is explored in a forthcoming paper [58].
Nevertheless, we do find empirical support for the idea that morphological descriptions of plot systems may be strongly associated with the distribution of economic activity in cities. This confirms the importance of plot systems as an important third morphological factor (besides street centrality and built density) in understanding the correlation between spatial urban form and the distribution of economic activity in cities. Again, this is important, as it means that we can better understand urban processes as well as understand how to better direct such process through urban planning and design onto more sustainable trajectories.

Author Contributions

Conceptualisation, E.B.; L.M.; M.B.P.; I.S.; Methodology, E.B.; L.M.; M.B.P.; I.S.; D.B.; Spatial and statistical analysis: E.B.; D.B.; Results validation: D.B.; Writing-original draft preparation: E.B.; Writing-review and editing: L.M.; M.B.P.; I.S.; Visualisation: E.B.; Supervision: L.M.; M.B.P.; I.S.

Funding

This research received no external funding.

Conflicts of Interest

The authors declare no conflict of interest.

Appendix A. Quantitative Measures of Plots

Following the work of Berghauser Pont and Marcus [67], plot accessibility measures are calculated using a measure of accessibility and, more specifically, the cumulative-opportunities accessibility measure [68], with the distance threshold set at 500 m walking distance.
For accessibility analysis PST (place syntax tool) is used. PST is plugin for QGIS Software and documentation are available at https://www.smog.chalmers.se/pst. PST combines the space syntax description of the urban environment with conventional descriptions of attraction.
For all three accessibility measures, the general equation for attraction reach (AR) is used, as implemented in PST:
A R ( o ; T ; D ) =   a A ( o ; D ) f ( a ; T )
where o = point of origin, a = an attraction (in this paper, attraction is plot polygon), D = distance threshold (set to 500 m in this paper), A(o;D) = the set of reachable attractions, given o and D, T = type of measurement of interest (related to attraction); or 1, if no type of measurement is defined, f(a;T) = attraction value, given T, associated with attraction a
Accessible number of plots (AP) is then calculated as follows:
A P ( o ; D ) = A R ( o ; p c ; D )
where the attraction value f(a;T) = 1 when T is plot count (pc)
Accessible plot frontage (APF) and accessible plot compactness (APC) are both indexes using the following Equations (A3) and (A4):
A P F ( o ; D ) =   A R ( o ; s f l ; D ) A R ( o ; p p l ; D )
A P C ( o ; D ) =   A R ( o ; p a ; D ) A R ( o ; p b a ; D )
where pa = plot area and pba = plot bounding area
In Equations (A2)–(A4), Area(o;D) is the area of the convex hull, defined by the end-points of all reachable line-segments within the distance threshold D (500 m) from the origin (o), as shown in the figure below.
Figure A1. Definition of the convex hull used in PST for calculating Area (o;D).
Urbansci 03 00066 g0a1

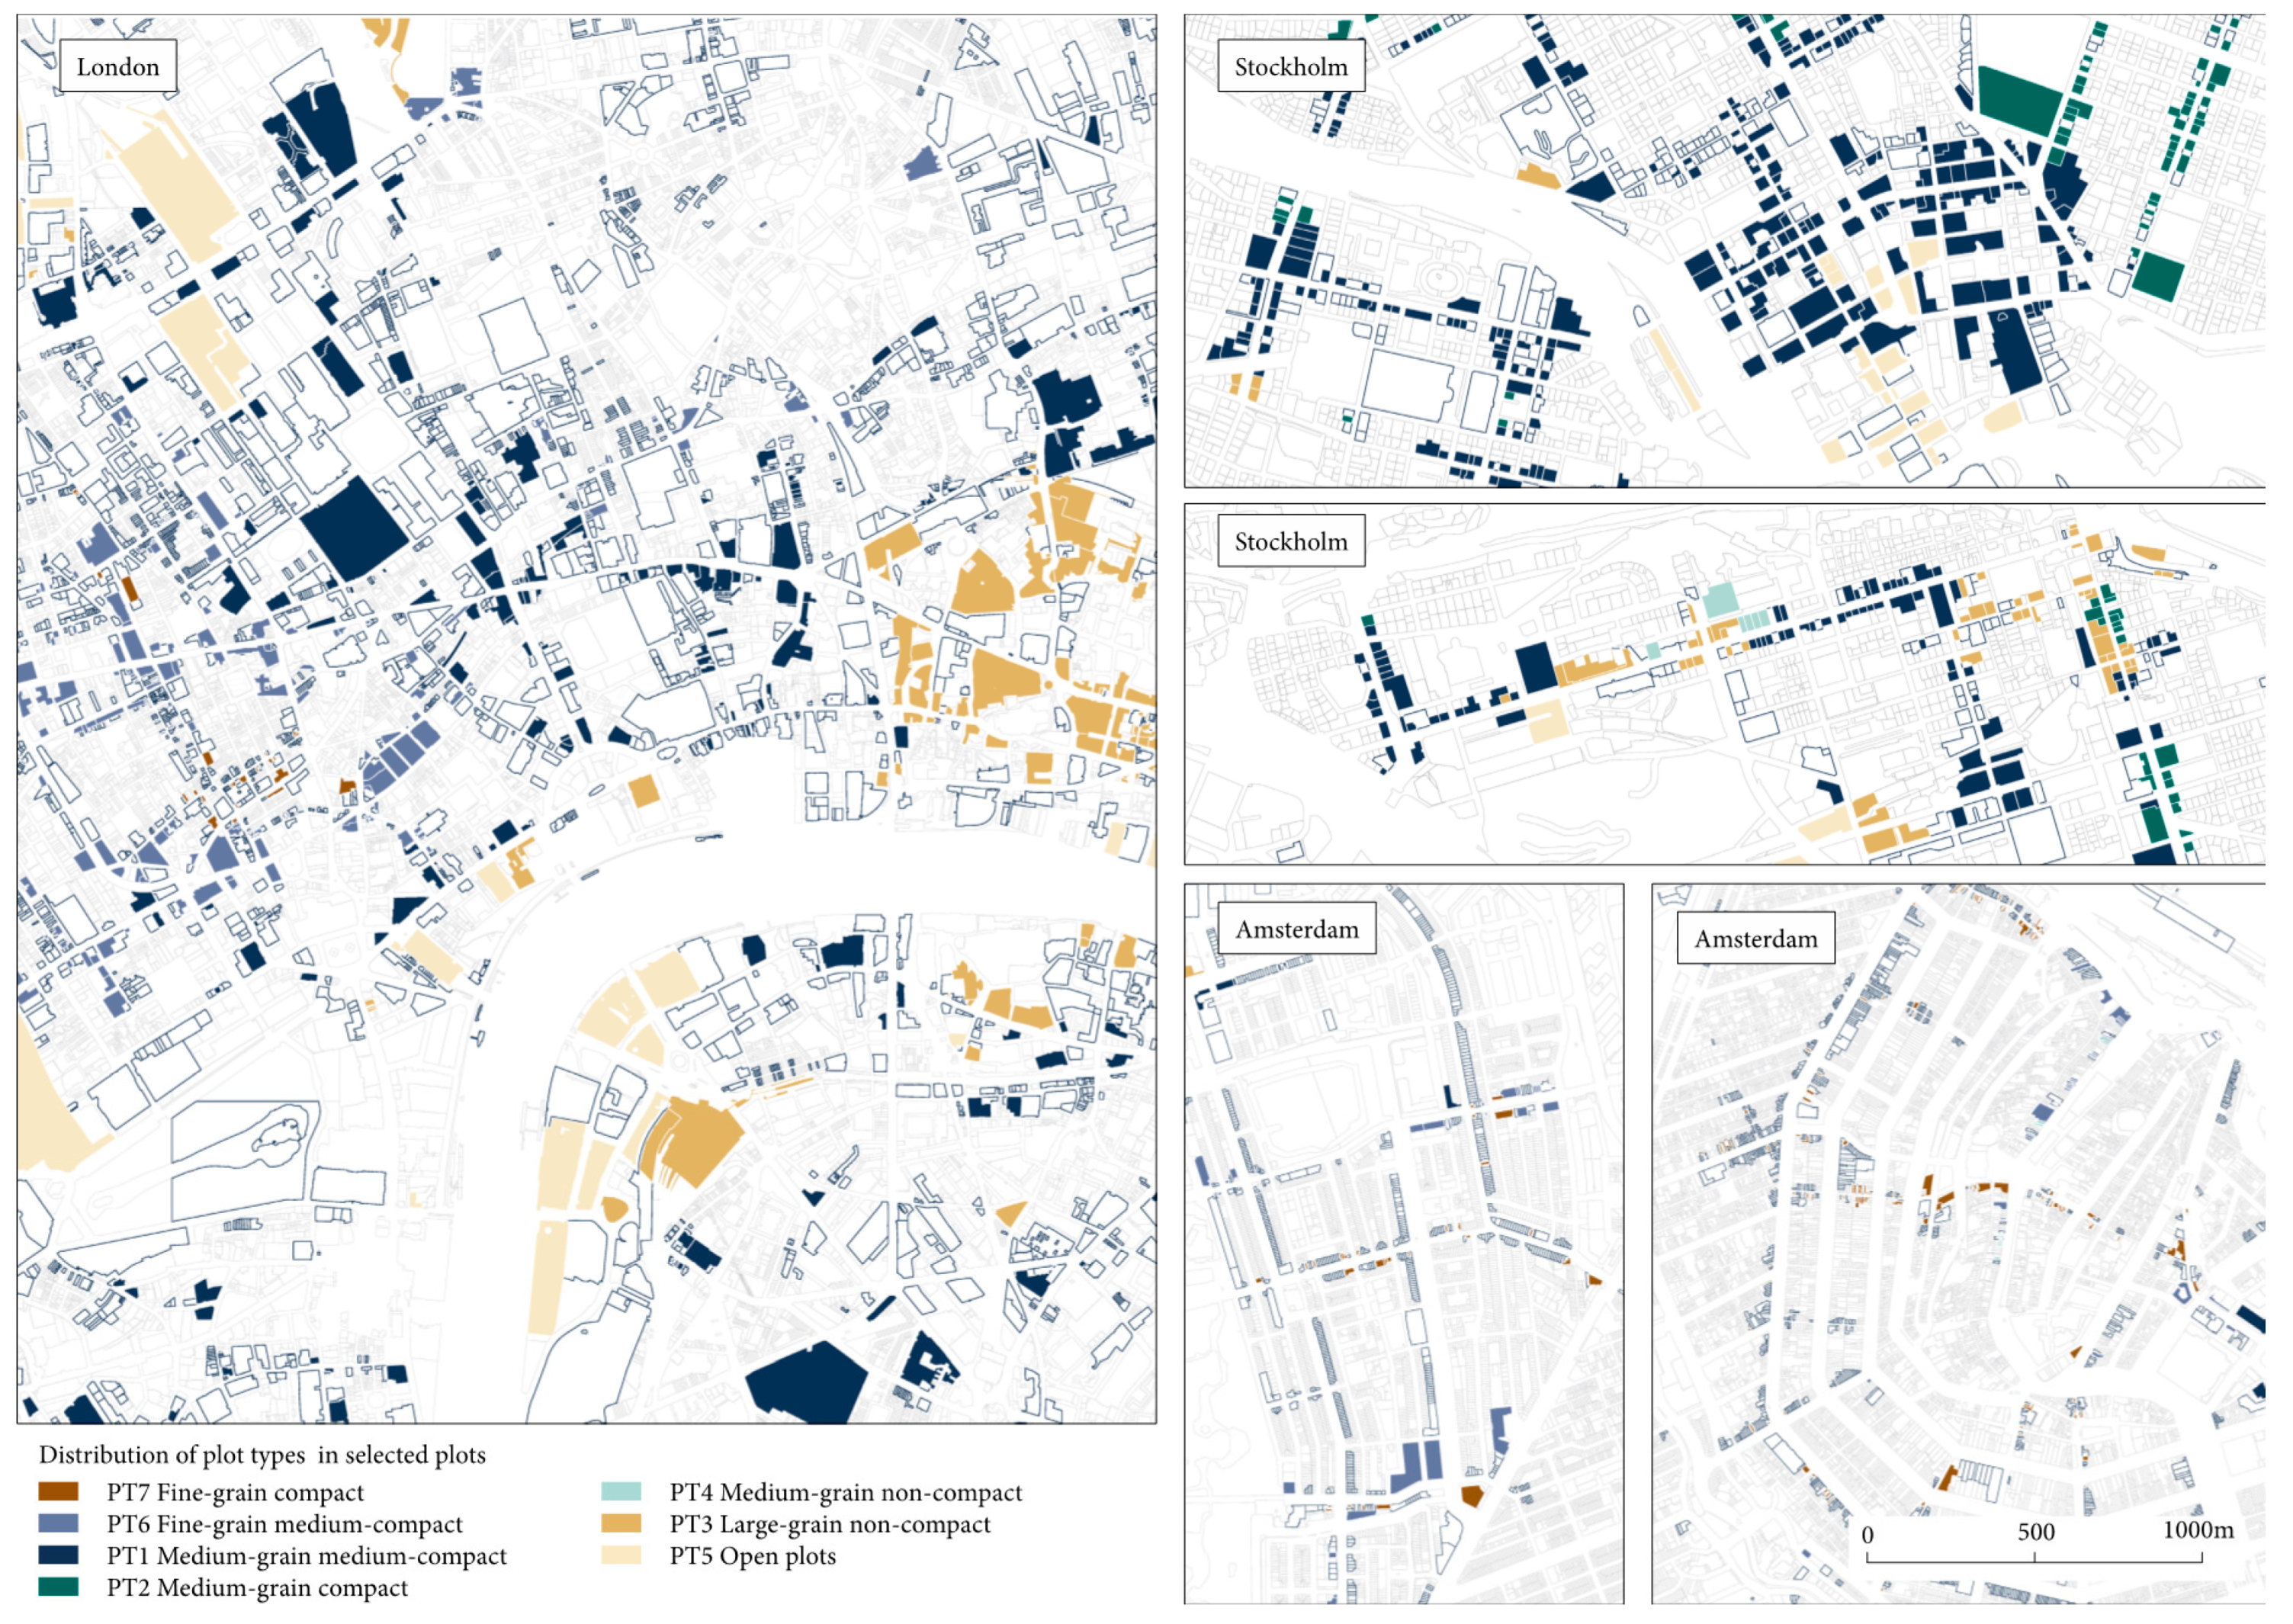
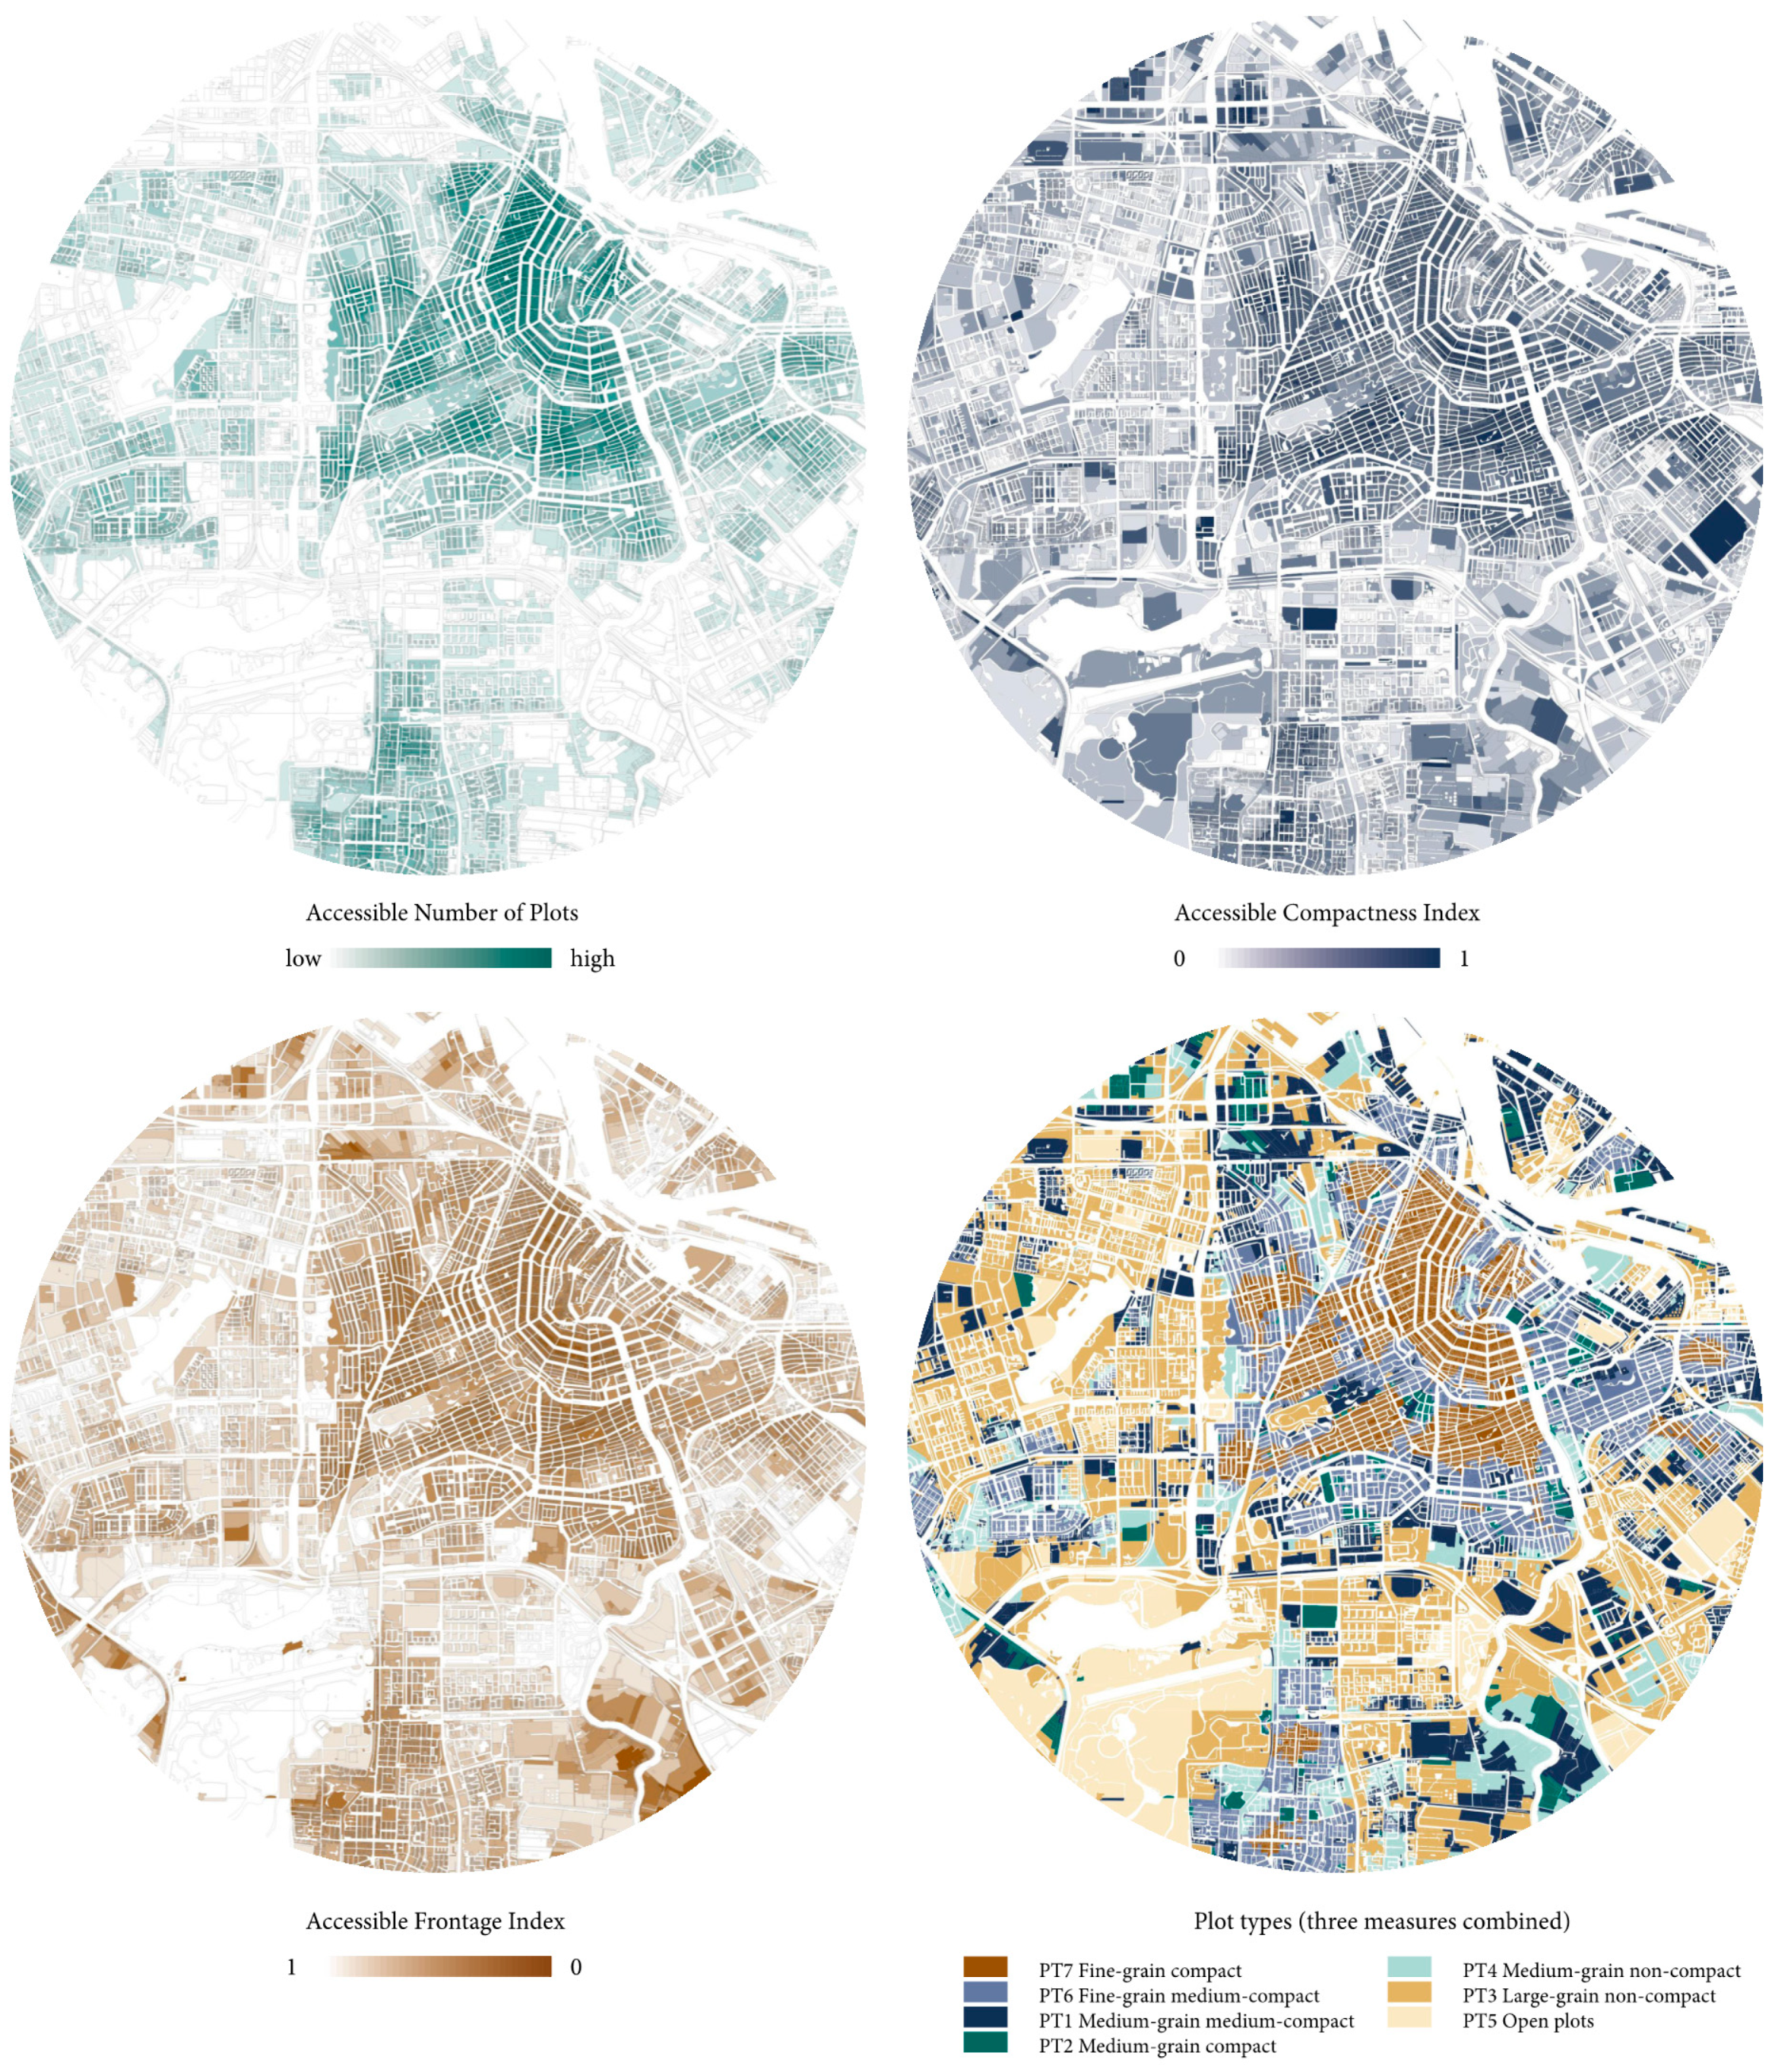
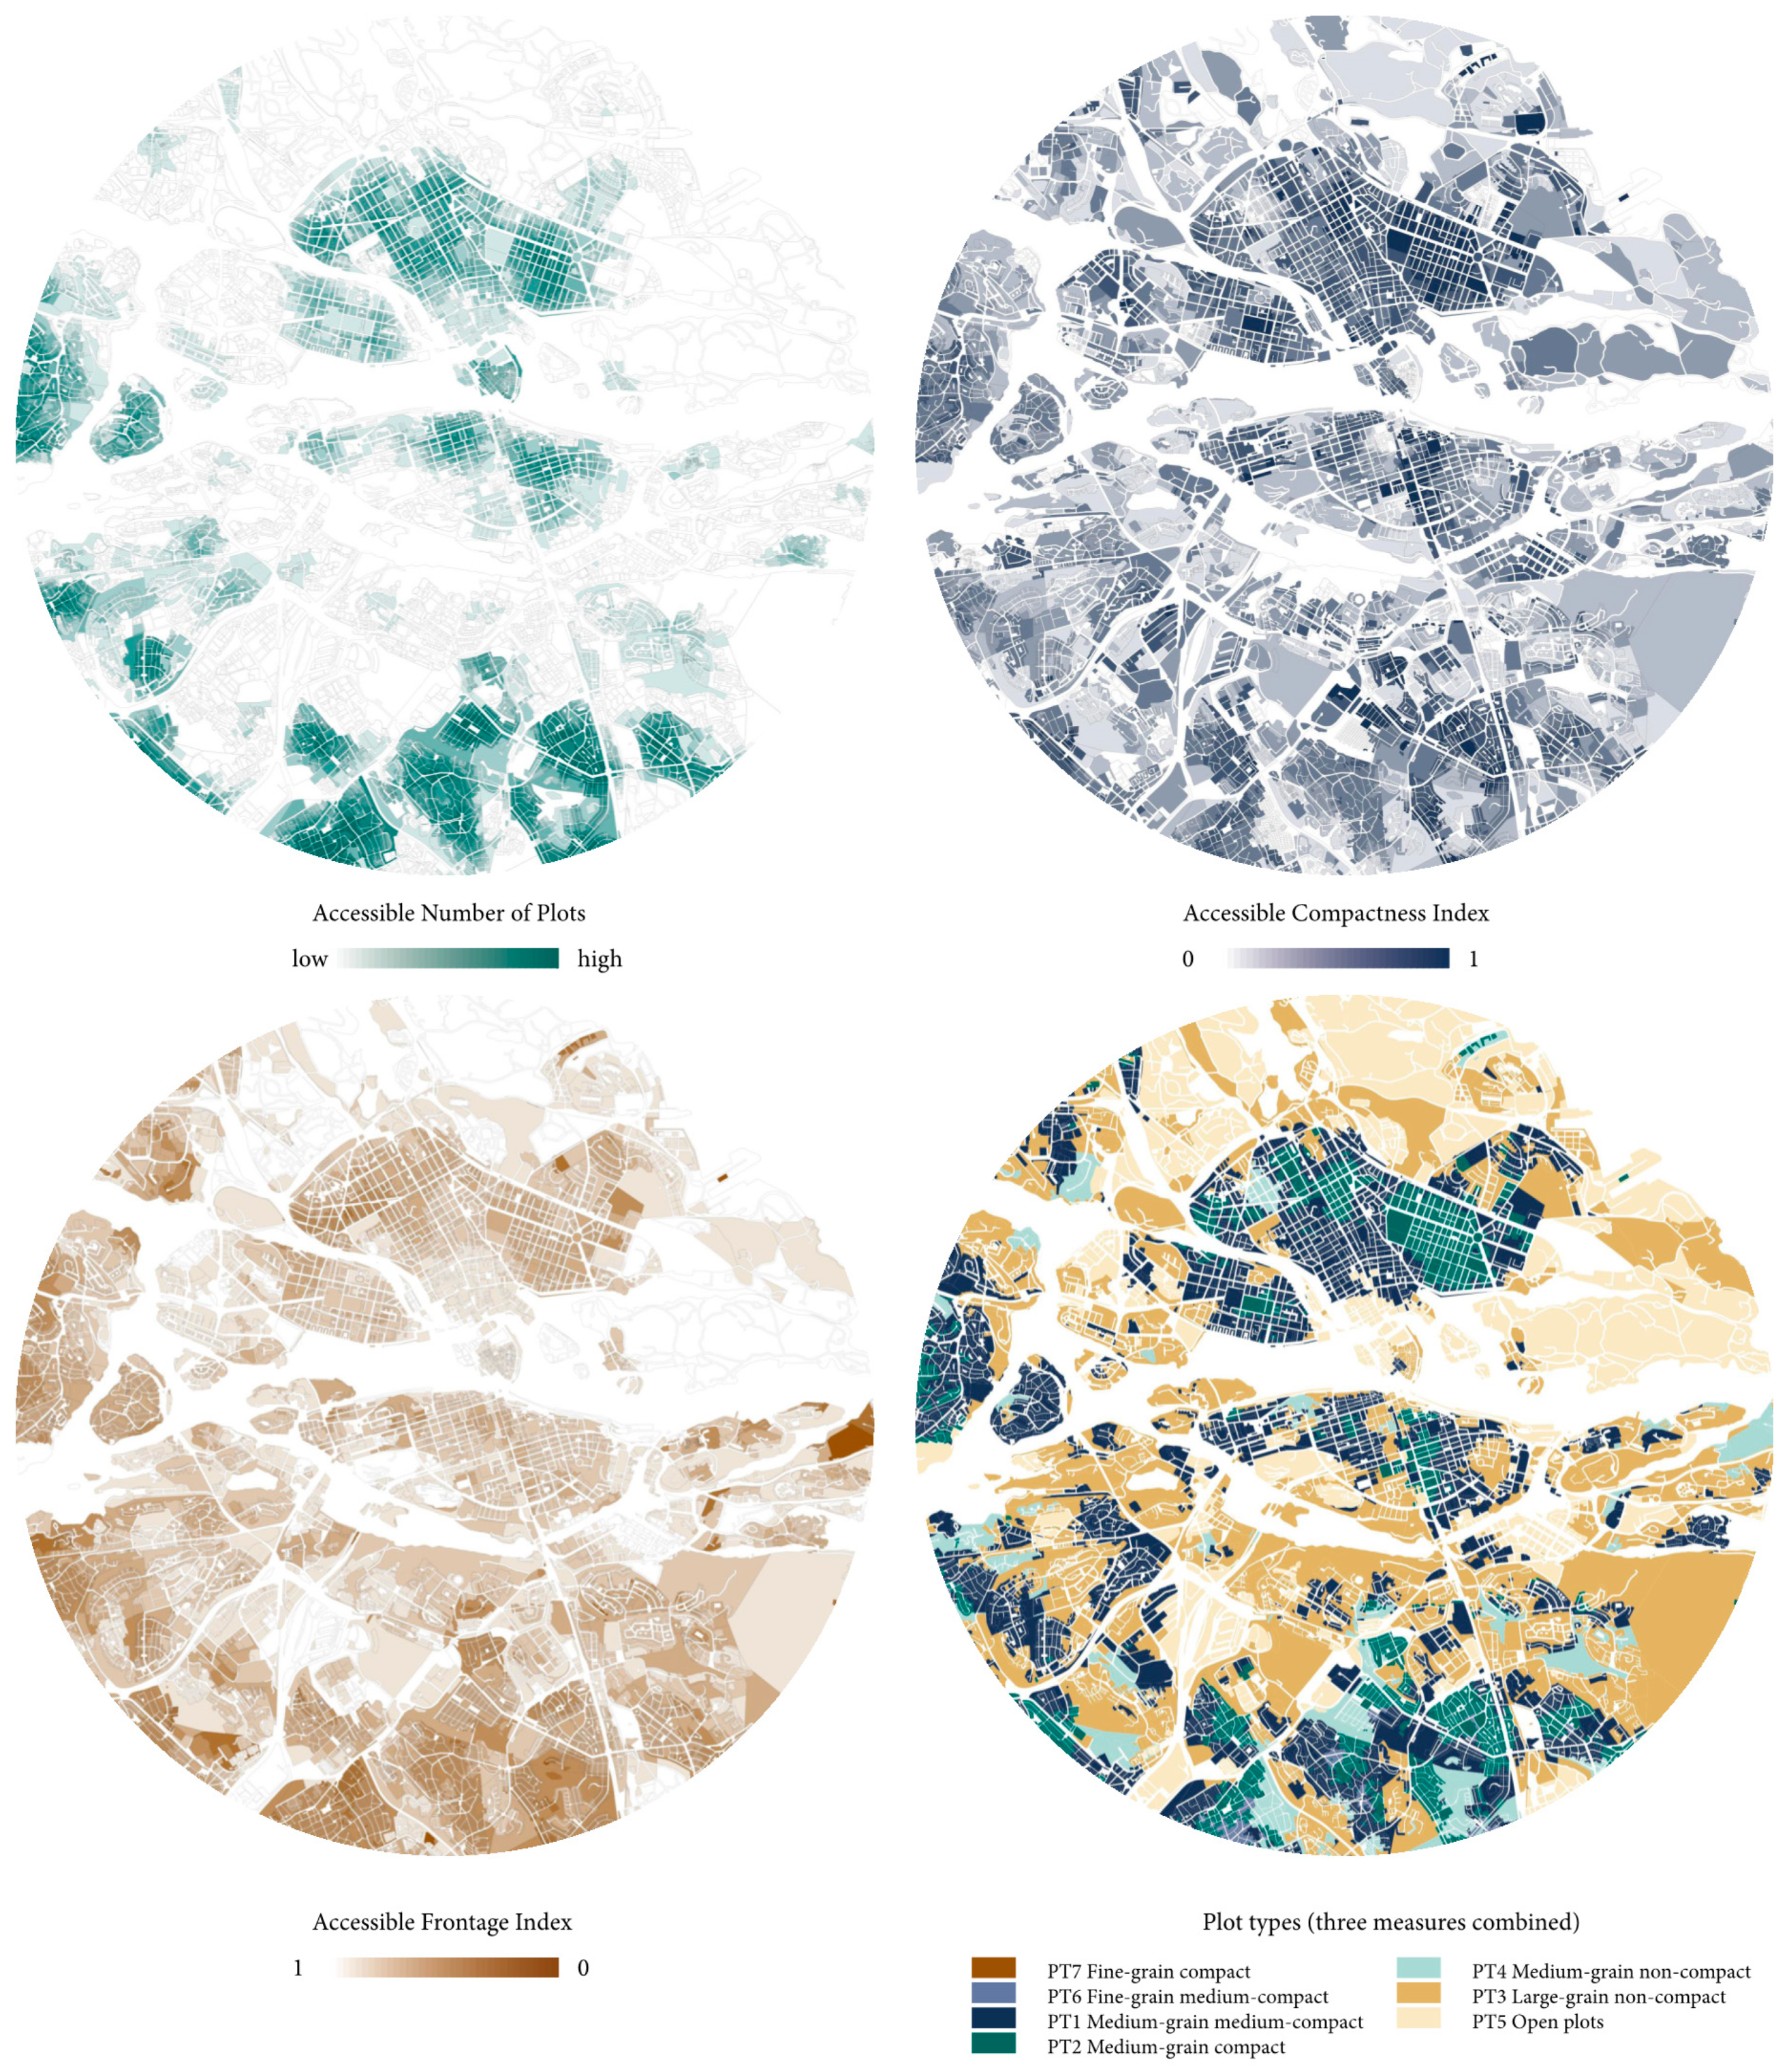
Appendix B. Distribution of Three Measures and Plot Types in London, Amsterdam and Stockholm

Figure A2. London. Overview of three plot measures (accessible number of plots, accessible compactness index, accessible frontage index) and seven plot types that combine these three measures.
Urbansci 03 00066 g0a2
Figure A3. Amsterdam. Overview of three plot measures (accessible number of plots, accessible compactness index, accessible frontage index) and seven plot types that combine these three measures.
Urbansci 03 00066 g0a3
Figure A4. Stockholm. Overview of three plot measures (accessible number of plots, accessible compactness index, accessible frontage index) and seven plot types that combine these three measures.
Urbansci 03 00066 g0a4

Appendix C. Preparing Models to Control Variables of Street Centrality and Built Density

Figure A5. London, Amsterdam and Stockholm. Overview of street centrality types (left) and built density types (right) [15,63] where observations that correspond to high betweenness centrality and high built density are selected for the statistical model in order to make sure these variables remain constant and do not influence variations in the concentration of economic activities.
Urbansci 03 00066 g0a5

Appendix D. Distribution of Dependent Variable of Economic Activity across Plot Types in Three Cities

The Kruskal-Wallis H test was chosen, to compare differences between the plot types in terms of dependent variable distribution (economic activity concentration per plot). This is a non-parametric alternative to One-Way ANOVA analysis. The reason for using this non-parametric method is that our data fails the assumption required for traditional ANOVA analysis: normality of dependent variable distribution and equal variance (shape of distributions) within each type.
The Shapiro-Wilk test of normality (p < 0.05) and assessment of Normal Q-Q plots demonstrated that our data is not normally distributed. Next, plotting distributions functions for each type within three cities (Figure A6) has shown the distributions to have a different shape within each type.
The distributions clearly get shifted to higher values for PT 1, 2 and 4 compared to PT3 and 5, and for PT6 and 7 compared to PT1, 2 and 4.
In addition to the Kruskal-Wallis H test, the Kolmogorov-Smirnov test was run so as to analyse whether the differences between plot types were significant and, hence, mean rank values of economic activities can be compared (Figure 2).
Figure A6. Distribution function of dependent variable of economic activity concentration across plot types in three cities.
Urbansci 03 00066 g0a6
For the analysis for dissimilarly shaped distribution, we can only use mean ranks comparison, as presented in the results section of the paper. Nevertheless, comparing mean ranks only demonstrates whether values of dependent variable are generally higher or lower between types. Hence, in order to see where this difference lies in absolute numbers, we may examine the median values of dependent variable across plot types (Figure A7).
Median values distribution demonstrates striking differences between the performance of the plot types, where fine-grain compact (PT7) and fine-grain medium-compact (PT6) types are associated with the highest concentration of economic activity per plot in absolute terms. Further, concentration values drop drastically when one examines the medium-grain types (PT1 and PT2) in all three cities, but specifically in Amsterdam. Finally, large-grain type (PT3) and open plots (PT5) are associated with the lowest concentrations of economic activity, though to different extents in the three cities. The analysis of median values also supports our initial hypothesis that higher concentrations of economic activity are generally aligned with plot systems of smaller size, higher accessible compactness index and lower accessible frontage ratio. Though these results cannot be used as a primary support for our hypothesis, the median values may provide a hint as to where the difference between plot types lie in this respect.
Figure A7. Summary of statistical analysis of differences between the plot types in terms of the dependent variable distribution. Bar charts show median values for each sub-model. If a particular plot type covers less than 5% of observations within the sub-model, it is shown as a dashed bar.
Urbansci 03 00066 g0a7

References

  1. Webster, C.; Lai, L.W.-C. Property Rights, Planning and Markets. Managing Spontaneous Cities; Edward Edgar Publishing Limited: Cheltenham, UK, 2003; ISBN 978-1-78195-707-3. [Google Scholar]
  2. Kropf, K. When Is a Plot Not a Plot: Problems in Representation and Interpretation; Unpublished Paper Presented to the Fourth International Seminar on Urban Form; University of Birmingham: Birmingham, UK, 1997. [Google Scholar]
  3. Kropf, K. Plots, property and behaviour. Urban Morphol. 2018, 22, 1–10. [Google Scholar]
  4. Buitelaar, E. Neither market nor government: Comparing the performance of user rights regimes. Town Plan. Rev. 2003, 74, 315–330. [Google Scholar] [CrossRef]
  5. Buitelaar, E.; Segeren, A. Urban Structures and Land. The Morphological Effects of Dealing with Property Rights. Hous. Stud. 2011, 26, 661–679. [Google Scholar] [CrossRef]
  6. Gibb, K.; Nygaard, C. Transfers, Contracts and Regulation: A New Institutional Economics Perspective on the Changing Provision of Social Housing in Britain. Hous. Stud. 2006, 21, 825–850. [Google Scholar] [CrossRef]
  7. Chung, L.L.W. The economics of land-use zoning: A literature review and analysis of the work of Coase. Town Plan. Rev. 1994, 65, 77–98. [Google Scholar] [CrossRef]
  8. Lai, L.W.C.; Hung, C.W.Y. The Inner Logic of the Coase Theorem and a Coasian Planning Research Agenda. Environ. Plan. B Plan. Des. 2008, 35, 207–226. [Google Scholar] [CrossRef]
  9. Lai, L.W.C.; Davies, S.N.G.; Chau, K.W.; Ching, K.S.T.; Chua, M.H.; Leung, H.F.; Lorne, F.T. The determination of the “true” property boundary in planned development: A Coasian analysis. Ann. Reg. Sci. 2018, 61, 579–599. [Google Scholar] [CrossRef]
  10. Adams, D.; Watkins, C. Greenfields, Brownfields, and Housing Development; Real Estate Issues; Blackwell Science: Oxford, UK, 2002; ISBN 978-0-632-06387-1. [Google Scholar]
  11. Adams, D.; Disberry, A.; Hutchison, N.; Munjoma, T. Land Policy and Urban Renaissance: The Impact of Ownership Constraints in Four British Cities. Plan. Theory Pract. 2002, 3, 195–217. [Google Scholar] [CrossRef]
  12. Hong, Y.; Needham, B. (Eds.) Analyzing Land Readjustment: Economics, Law, and Collective Action; Lincoln Institute of Land Policy: Cambridge, MA, USA, 2007; ISBN 978-1-55844-164-4. [Google Scholar]
  13. Louw, E. Land assembly for urban transformation—The case of ‘s-Hertogenbosch in The Netherlands. Land Use Policy 2008, 25, 69–80. [Google Scholar] [CrossRef]
  14. Bobkova, E.; Marcus, L.; Berghauser Pont, M. Multivariable measures of plot systems: Describing the potential link between urban diversity and spatial form based on the spatial capacity concept. In Proceedings of the 11th Space Syntax Symposium, Lisbon, Portugal, 3–7 July 2017; Volume 47, pp. 1–47. [Google Scholar]
  15. Berghauser Pont, M.; Marcus, L.; Stavroulaki, G.; Gil, J.; Serra, M.; Bobkova, E. The spatial distribution and frequency of street, plot and building types, across five cities identifying common as well as unique traits. Environ. Plan. B 2019. [Google Scholar]
  16. Hillier, B.; Hanson, J. Social Logic of Space; Cambridge University Press: Cambridge, UK, 1984. [Google Scholar]
  17. Netto, V.; Saboya, R.; Vargas, J.; Figueiredo, L.; Freitas, C.; Pinheiro, M. The Convergence of Patterns in the City: (Isolating) the Effects of Architectural Morphology on Movement and Activity. In Proceedings of the 8th Space Syntax Symposium, Santiago, Chile, 3–6 January 2012; PUC: Santiago, Chile, 2012. [Google Scholar]
  18. Scoppa, M.D.; Peponis, J. Distributed attraction: The effects of street network connectivity upon the distribution of retail frontage in the City of Buenos Aires. Environ. Plan. B 2015, 42, 354–378. [Google Scholar] [CrossRef]
  19. Cantarino, J.; Netto, V.M. Urban diversity and transformation: Public housing and the “hidden morphology of plots”. In Proceedings of the 11th Space Syntax Symposium, Lisbon, Portugal, 3–7 July 2017; Volume 53, pp. 1–53. [Google Scholar]
  20. Hillier, B. Space is the Machine: A Configurational Theory of Architecture; Cambridge University Press: Cambridge, UK, 1996; ISBN 978-0-521-56039-9. [Google Scholar]
  21. Marcus, L. Architectural Knowledge and Urban form: The Functional Performance of Architectural Urbanity. Ph.D. Thesis, KTH Royal Institute of Technology in Stockholm, Stockholm, Sweden, 2000. [Google Scholar]
  22. Marcus, L. The impact of land-division on long-term occupation—The possibility of such a thing as ‘natural occupation’. In Proceedings of the Third International Space Syntax Symposium, Atlanta, GA, USA, 7–11 May 2001; Tech: Atlanta, Georgia, 2001. [Google Scholar]
  23. Marcus, L. Spatial Capital. A proposal for an Extension of Space Syntax into a More General Urban Morphology. J. Space Syntax 2010, 1, 30–40. [Google Scholar]
  24. Conzen, M. Alnwick, Northumberland: A Study in Town-Plan Analysis; Institute of British Geographers: London, UK, 1960. [Google Scholar]
  25. Moudon, A.V. Getting to know the built landscape: Typomorphology. In Ordering Space: Types in Architecture and Design; Schneekloth, K.A., Ed.; Van Nostrand Reinhold: New York, NY, USA, 1994; pp. 289–311. [Google Scholar]
  26. Whitehead, J. British urban morphology: The Conzenian tradition. Urban Morphol. 2001, 5, 103–109. [Google Scholar]
  27. Panerai, P. (Ed.) Urban Forms: Death and Life of the Urban Block; Architectural Press: Oxford, UK, 2004; ISBN 978-0-7506-5607-8. [Google Scholar]
  28. Griffiths, S.; Vaughan, L.; Haklay, M.; Jones, C. The sustainable suburban high street: A review of themes and approaches. Geogr. Compass 2008, 2, 1155–1188. [Google Scholar] [CrossRef]
  29. Vaughan, L. Suburban Urbanities: Suburbs and the Life of the High Street; UCL Press: London, UK, 2015. [Google Scholar]
  30. Chiaradia, A.; Hillier, B.; Schwander, C.; Wedderburn, M. Spatial Centrality, Economic Vitality/Viability Compositional and Spatial Effects in Greater London. In Proceedings of the 7th International Space Syntax Symposium, Stockholm, Sweden, 8–11 June 2009; KTH: Stockholm, Sweden, 2009. [Google Scholar]
  31. Hillier, B. Centrality as process. Accounting for attraction inequalities in deformed grids. Urban Des. Int. 1999, 4, 107–127. [Google Scholar] [CrossRef]
  32. Cutini, V. Centrality and Land Use: Three Case Studies on the Configurational Hypothesis. Systèmes, Modélisation. Géostatistiques 2001, 188, 1–18. [Google Scholar]
  33. Narvaez, L.; Penn, A. The Architecture of Mixed Uses. J. Space Syntax 2016, 7, 107–136. [Google Scholar]
  34. Law, S.; Penn, A.; Karimi, K.; Shen, Y. The Economic Value of Spatial Network Accessibility for UK Cities: A Comparative Analysis Using the Hedonic Price Approach. In Proceedings of the 11th Space Syntax Symposium, Lisbon, Portugal, 3–7 July 2017; Volume 77, pp. 1–23. [Google Scholar]
  35. Narvaez, L.; Penn, A.; Griffiths, S. Spatial configuration and bid rent theory: How urban space shapes the urban economy. In Proceedings of the 9th Space Syntax Symposium, Seoul, Korea, 31 October–3 November 2013; Sejong University: Seoul, Korea, 2013. [Google Scholar]
  36. Xiao, Y.; Orford, S.; Webster, C. Urban configuration, accessibility, and property prices: A case study of Cardiff, Wales. Environment and Planning B: Planning and. Design 2015, 42, 1–22. [Google Scholar]
  37. Hillier, B. Spatial Sustainability in Cities. Organic Patterns and Sustainable Forms. In Proceedings of the 7th International Space Syntax Symposium, Stockholm, Sweden, 8–11 June 2009; KTH: Stockholm, Sweden, 2009; Volume 1, p. 20. [Google Scholar]
  38. Krafta, R.; Netto, V.; Lima, L. Urban Form Grows Critical. Eur. J. Geogr. 2011. [Google Scholar] [CrossRef]
  39. Marcus, L.; Bergauser Pont, M.; Bobkova, E. Cities as Accessible Densities and Diversities: Adding attraction variables to configurational analysis. In Proceedings of the 11th International Space Syntax Symposium, Lisbon, Portugal, 3–7 July 2017; Instituto Superior Técnico: Lisbon, Portugal, 2017. [Google Scholar]
  40. Ahlfeldt, G.; Pietrostefani, E. Demystifying Compact Urban Growth: Evidence from 300 Studies from Across the World. The New Climate Economy, 2017. Available online: https://newclimateeconomy.report/workingpapers/workingpaper/demystifying-compact-urban-growth/ (accessed on 8 July 2019).
  41. Bonfantini, B. Centri Storici: Infrastrutture per l’urbanità contemporanea. Territorio 2013, 64, 153–161. [Google Scholar]
  42. Berghauser Pont, M.; Haupt, P. Spacematrix; NAi Publishers: Rotterdam, The Netherlands, 2010; ISBN 978-90-5662-742-3. [Google Scholar]
  43. Jacobs, J. The Death and Life of Great American Cities; Random House: New York, NY, USA, 1961. [Google Scholar]
  44. Lozano, E. Density in Communities, or the Most Important Factor in Building Urbanity. In The Urban Design Reader; Larice, M., Macdonald, E., Eds.; Routledge: Abingdon, UK, 2007; pp. 312–327. [Google Scholar]
  45. Scheer, B. Towards a minimalist definition of the plot. Viewpoint. Urban Morphol. 2018, 22, 162–163. [Google Scholar]
  46. Vialard, A. Measures of the fit between street network, urban blocks and building footprints. In Proceedings of the Eighth International Space Syntax Symposium, Santiago, Chile, 3–6 January 2012; Volume 8101, pp. 8101:1–8101:7. [Google Scholar]
  47. Krafta, R. Urban convergence: Morphology and attraction. Environ. Plan. B 1996, 23, 37–48. [Google Scholar] [CrossRef]
  48. Sevtsuk, A. Path and Place: A Study of Urban Geometry and Retail Activity in Cambridge and Somerville, MA. Ph.D. Thesis, MIT Press, Cambridge, MA, USA, 2010. [Google Scholar]
  49. Sevtsuk, A. Location and Agglomeration: The Distribution of Retail and Food Businesses in Dense Urban Environments. J. Plan. Educ. Res. 2014, 34, 374–393. [Google Scholar] [CrossRef]
  50. Sevstuk, A.; Kalvo, R.; Ekmekci, O. Pedestrian accessibility in grid layouts: The role of block, plot and street dimensions. Urban Morphol. 2016, 20, 89–106. [Google Scholar]
  51. Needham, B. Planning Law and Economics: An Investigation of the Rules We Make for Using Land; RTPI Library Series; Routledge: Abingdon, UK, 2006; ISBN 978-0-415-34373-2. [Google Scholar]
  52. Zhu, J.; Sim, L.-L.; Liu, X. Place Remaking under Property Rights Regimes: A Case Study of Niucheshui, Singapore. Environ. Plan. A Econ. Space 2007, 39, 2346–2365. [Google Scholar] [CrossRef] [Green Version]
  53. Blomley, N. Property, Pluralism and the Gentrification Frontier. Can. J. Law Soc. 1997, 12, 187–218. [Google Scholar] [CrossRef] [Green Version]
  54. Alchian, A.; Demsetz, H. The Property Right Paradigm. J. Econ. Hist. 1973, 33, 16–27. [Google Scholar] [CrossRef] [Green Version]
  55. Merill, T.W. Property and the Right to Exclude. Neb. Law Rev. 1998, 77, 730–755. [Google Scholar]
  56. Babie, P. The Spatial: A Forgotten dimension of Property. Diego Law Rev. 2013, 50, 323–382. [Google Scholar]
  57. Bobkova, E.; Marcus, L.; Berghauser Pont, M. Plot systems and property rights: Morphological, juridical and economic aspects. In Proceedings of the XXIV International Seminar of Urban Form, Valencia, Spain, 27–29 September 2017. [Google Scholar]
  58. Marcus, L.; Bobkova, E. Spatial configuration of plot systems and urban diversity: Empirical support for a differentiation variable in spatial morphology. In Proceedings of the 12th Space Syntax Symposium, Beijing, China, 8–13 July 2019. [Google Scholar]
  59. Siksna, A. City centre blocks and their evolution: A comparative study of eight American and Australian CBDs. J. Urban Des. 1998, 3, 253–283. [Google Scholar] [CrossRef]
  60. Vialard, A. A Typology of Block-Faces. Ph.D. Thesis, Georgia Institute of Technology, Atlanta, GA, USA, 2013. [Google Scholar]
  61. Scheer, B.C. The epistomology of urban morphology. Urban Morphol. 2016, 20, 5–17. [Google Scholar]
  62. Serra, M. Anatomy of Emerging Metropolitan Territory: Towards an Integrated Analytical Framework for Metropolitan Morphology. Ph.D. Thesis, Universidade do Porto, Porto, Portugal, 2013. [Google Scholar]
  63. Berghauser Pont, M.; Stavroulaki, G.; Marcus, L. Development of Urban Types, based on Network Centrality and Built Density, and their Impact on Pedestrian Movement. Environ. Plan. B 2019. [Google Scholar]
  64. Paasch, J.M. Classification of Real Property Rights—A Comparative Study of Real Property Rights in Germany, Ireland, The Netherlands and Sweden; KTH Royal Institute of Technology: Stockholm, Sweden, 2011. [Google Scholar]
  65. Gehl, J. Cities for People; Island Press: Washington, DC, USA, 2010. [Google Scholar]
  66. Sheskin, D. Handbook of Parametric and Nonparametric Statistical Procedures, 3rd ed.; Chapman & Hall/CRC: Boca Raton, FL, USA, 2004; ISBN 978-1-58488-440-8. [Google Scholar]
  67. Berghauser Pont, M.; Marcus, L. Innovations in measuring density: From area and location density to accessible and perceived density. Nord. J. Archit. Res. 2014, 2, 11–31. [Google Scholar]
  68. Bhat, C.; Handy, S.; Kockelman, K.; Mahmassani, H.; Chen, Q.; Weston, L. Urban Accessibility Index: Literature Review; Center for Transportation Research—The University of Texas at Austin: Austin, TX, USA, 2000. [Google Scholar]
Figure 1. Overview of plot measures (for the detailed explanation of accessibility measures, see Appendix A).
Urbansci 03 00066 g001
Figure 2. Overview of the plot types and three scatterplots with numeric parameters of each type, based on three plot measures: accessible number of plots (AP), accessible compactness index (APC), and accessible frontage index (APF).
Urbansci 03 00066 g002
Figure 3. Concentration of economic activity within selected observations (plots).
Urbansci 03 00066 g003
Figure 4. Distribution of plot types within selected observations (plots).
Urbansci 03 00066 g004
Figure 5. Summary of statistical analysis of differences between the plot types, in terms of dependent variable distribution. The bar charts show mean rank values for each sub-model. “Mean rank” is a relative value and, in order to compare the results between cities, is rescaled to range from 0 to 1. If a particular plot type covers less than 5% of observations within the sub-model, it is shown as a dashed bar.
Urbansci 03 00066 g005
Table 1. Overview of methodological steps. Steps marked in grey were developed in earlier studies [14,15,63] and used as input for this paper.
Data Sources (Input)StepsDescriptionOutput
1. Selecting study areas: London, Amsterdam, Stockholm
Fastighet maps from Swedish Land registry in Stockholm, downloaded in 20161.1 Edit mapExclude infrastructure (roads and rail) and water including correction of clipping errors
(The study areas cover metropolitan areas of cities. For this reason, the Urban Morphological Zone (UMZ) boundaries are used, as defined by the European Environment Agency (EEA), source: http://www.eea.europa.eu/data-and-maps/data/urban-morphological-zones-2006)
Plots layer [14]
DKK database in Amsterdam, downloaded in 2016
Land Registry INSPIRE Index Polygons in London, downloaded in 2016
2. Measuring the dependent variable of economic activity
Open Street Maps, (points of interest), downloaded in 20162.1 Filter data Extracting economic activities (food and retail services) based on OSM coding (25xx; 23xx)Economic Activity concentration per plot
2.2 Measuring number of economic activities per plotSum of economic activities per plot (i.e., count) divided by plot area
2.3 Removing zero values
3. Measuring the independent variable using plot types
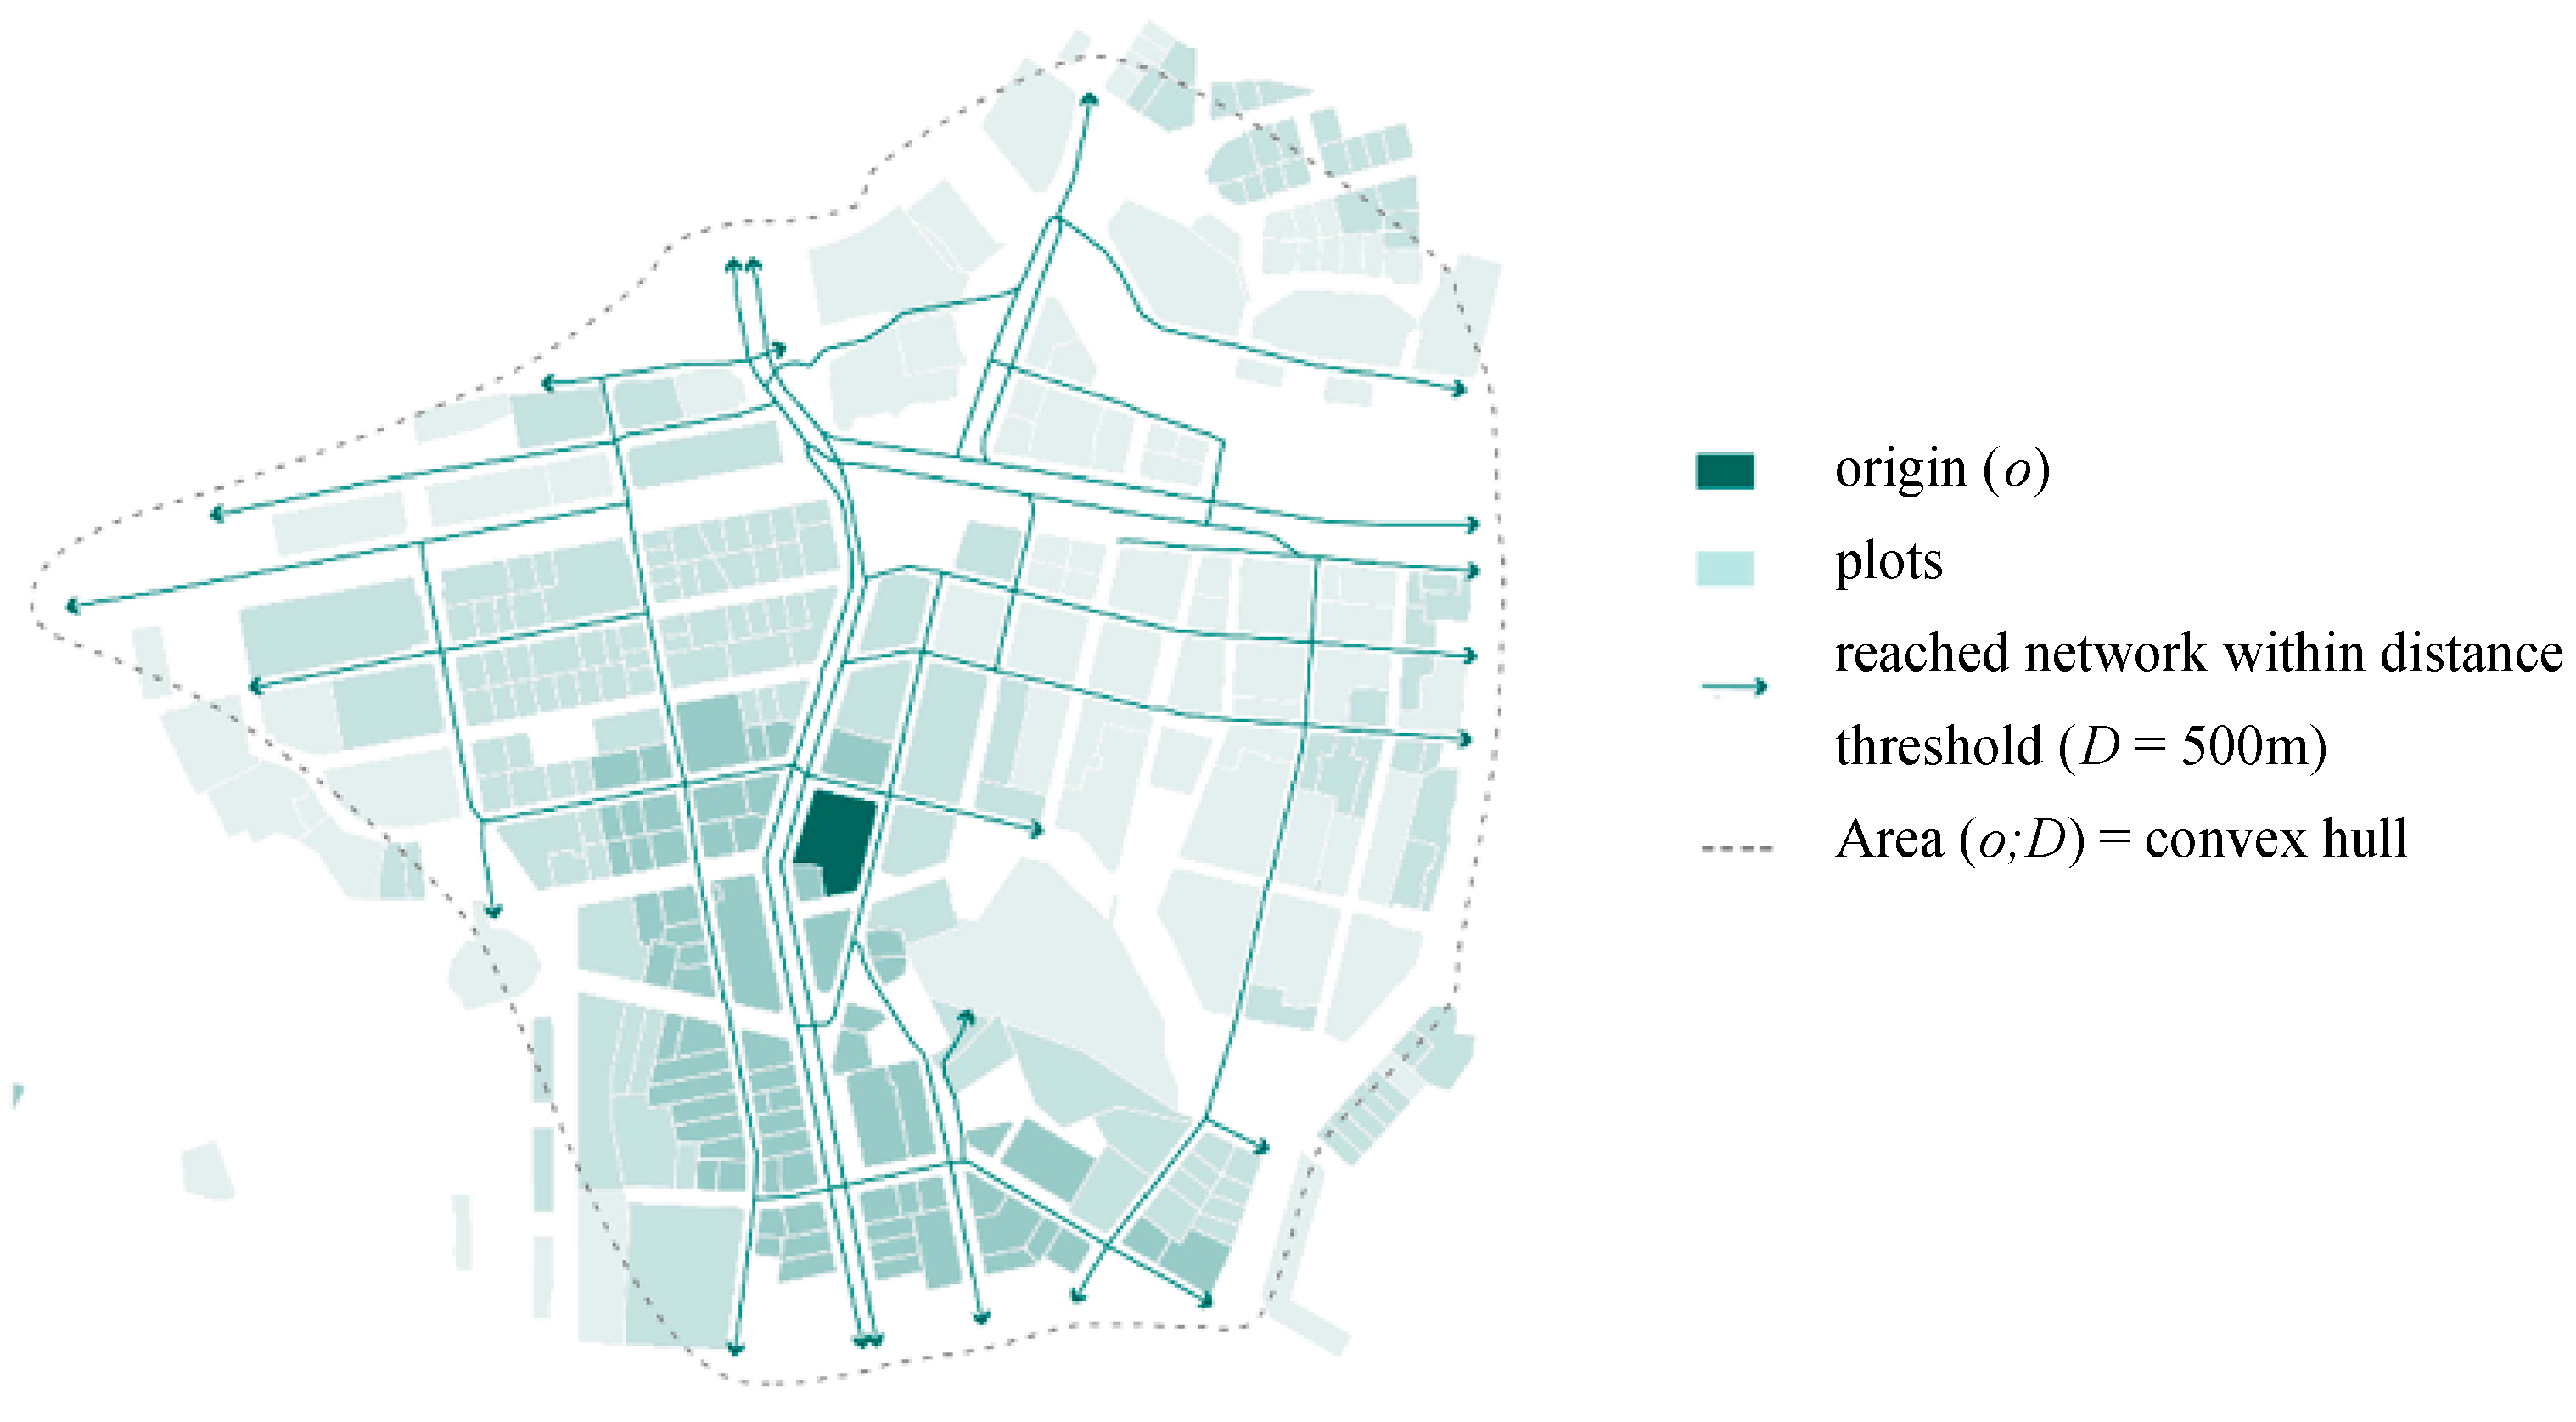
Plots layer [14] (Step 1)3.1 Plot measuresAccessible number of plots, AP(o,D); 500 m radiusSeven plot types [15]
Accessible Frontage Index, APF(o,D); 500 m radius
Accessible Compactness Index, APC(o,D); 500 m radius
3.2 Plot typesK-means cluster analysis based on three measures
4. Constructing statistical model: controlling for street centrality and building density
Multiscalar street types, generated by Berghauser Pont et al. [63]4.1 Controlling for street centralityExtracting observations corresponding to high betweenness centrality across several scales: street types “City” and “Neighbourhood”Observations corresponding to higher betweenness centrality across scales
Multivariable density types, generated by Berghauser Pont et al. [15]4.2 Controlling for densityExtracting observations corresponding to high building density (FSI): building types “Dense mid-rise”, “Compact mid-rise” and “Spacious mid-rise”Observations corresponding to higher FSI
5. Statistical analysis of differences between plot types in terms of economic activity concentration
Model of plot types and economic activity concentration within selected street and density types (Steps 2–4)5.1 Kruskal-Wallis H testStatistical analysis of differences between the plot types, in terms of dependent variable distribution (local markets)Comparison of mean rank values within and across three cities

