Ridership and the Built-Form Indicators: A Study from Ahmedabad Janmarg Bus Rapid Transit System (BRTS)


Abstract
1. Introduction
2. 5D Built-Form Indicators
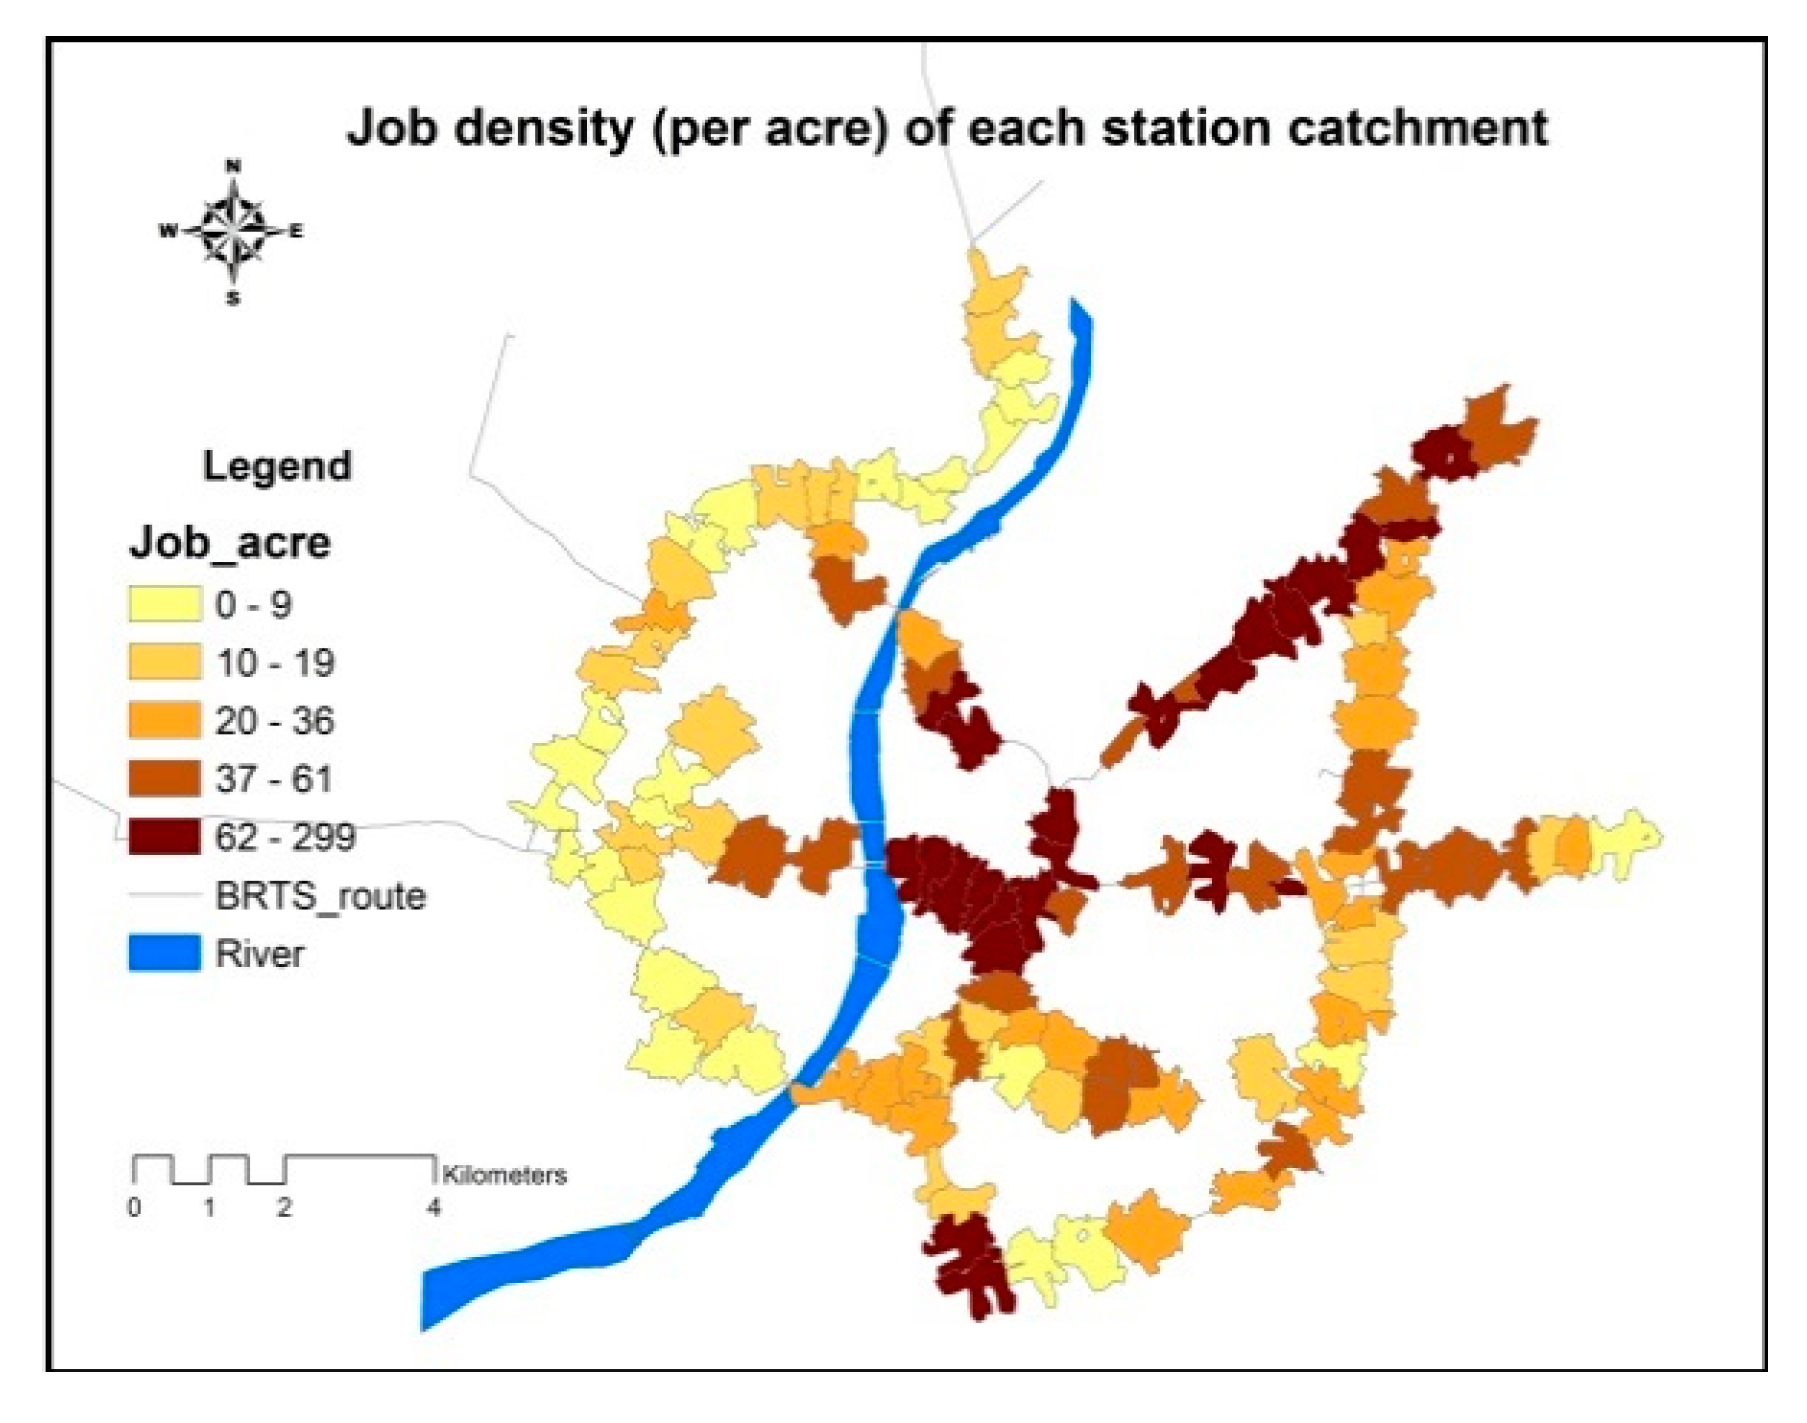
2.1. Density
2.2. Diversity
2.3. Design
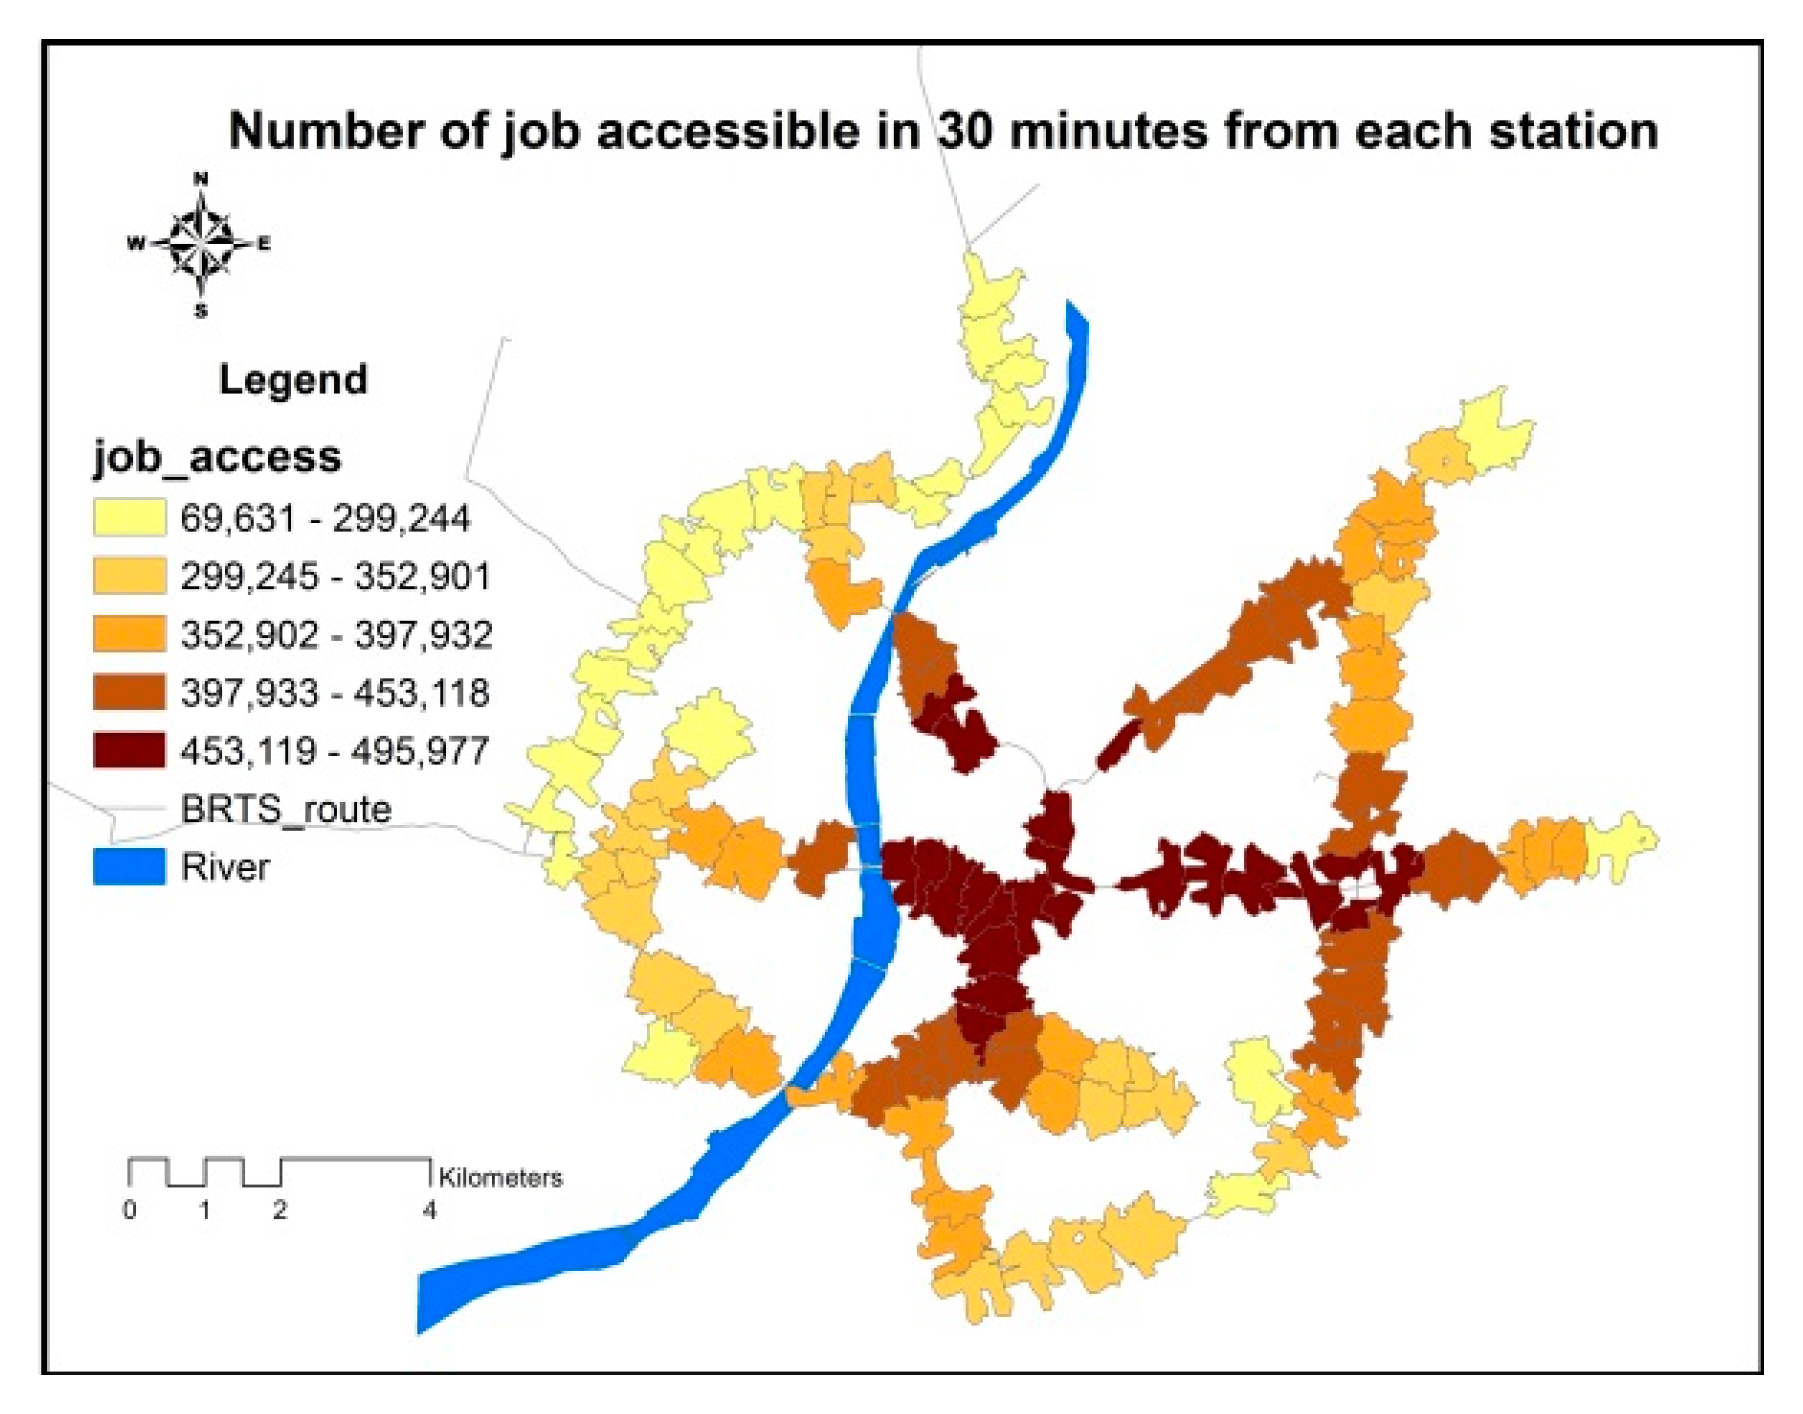
2.4. Destination Accessibility
2.5. Distance to Transit Stop
3. Prior Studies on Ridership
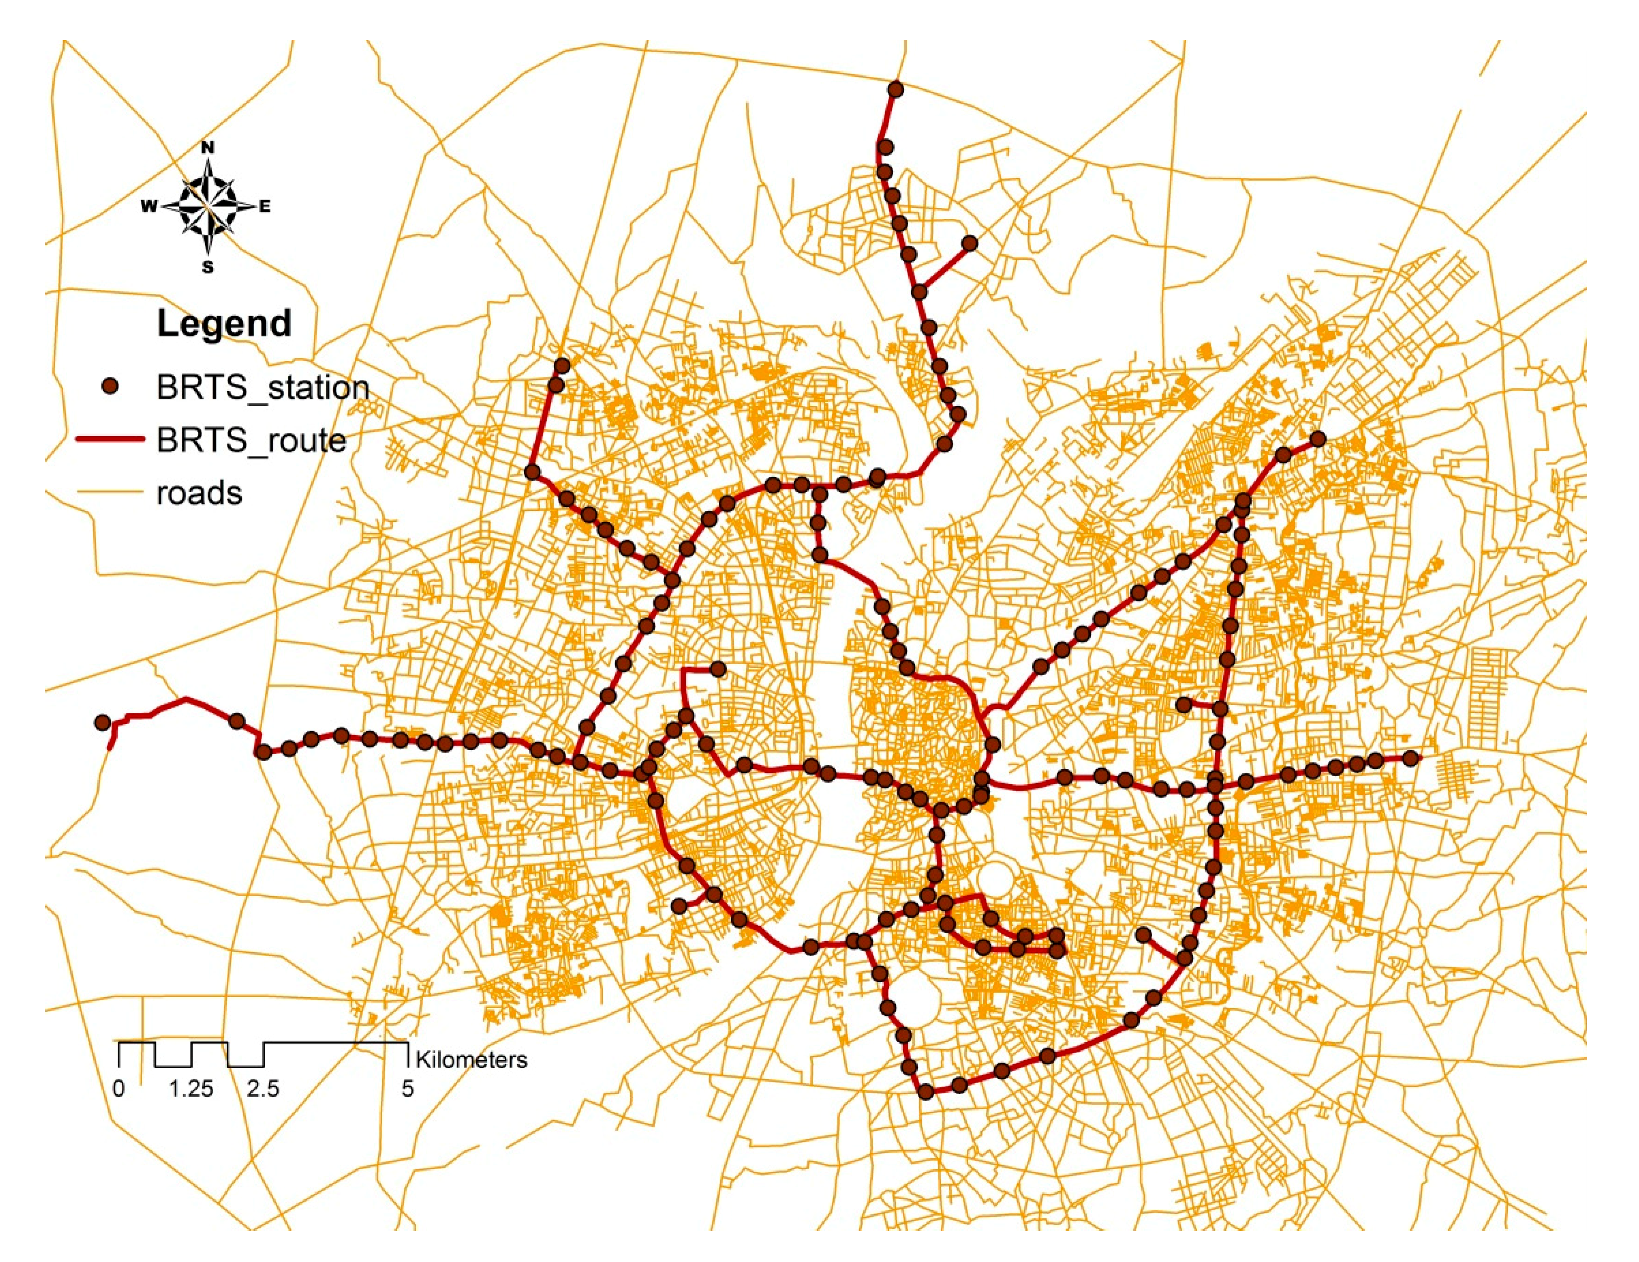
4. Study Area Profile
5. Data and Methods
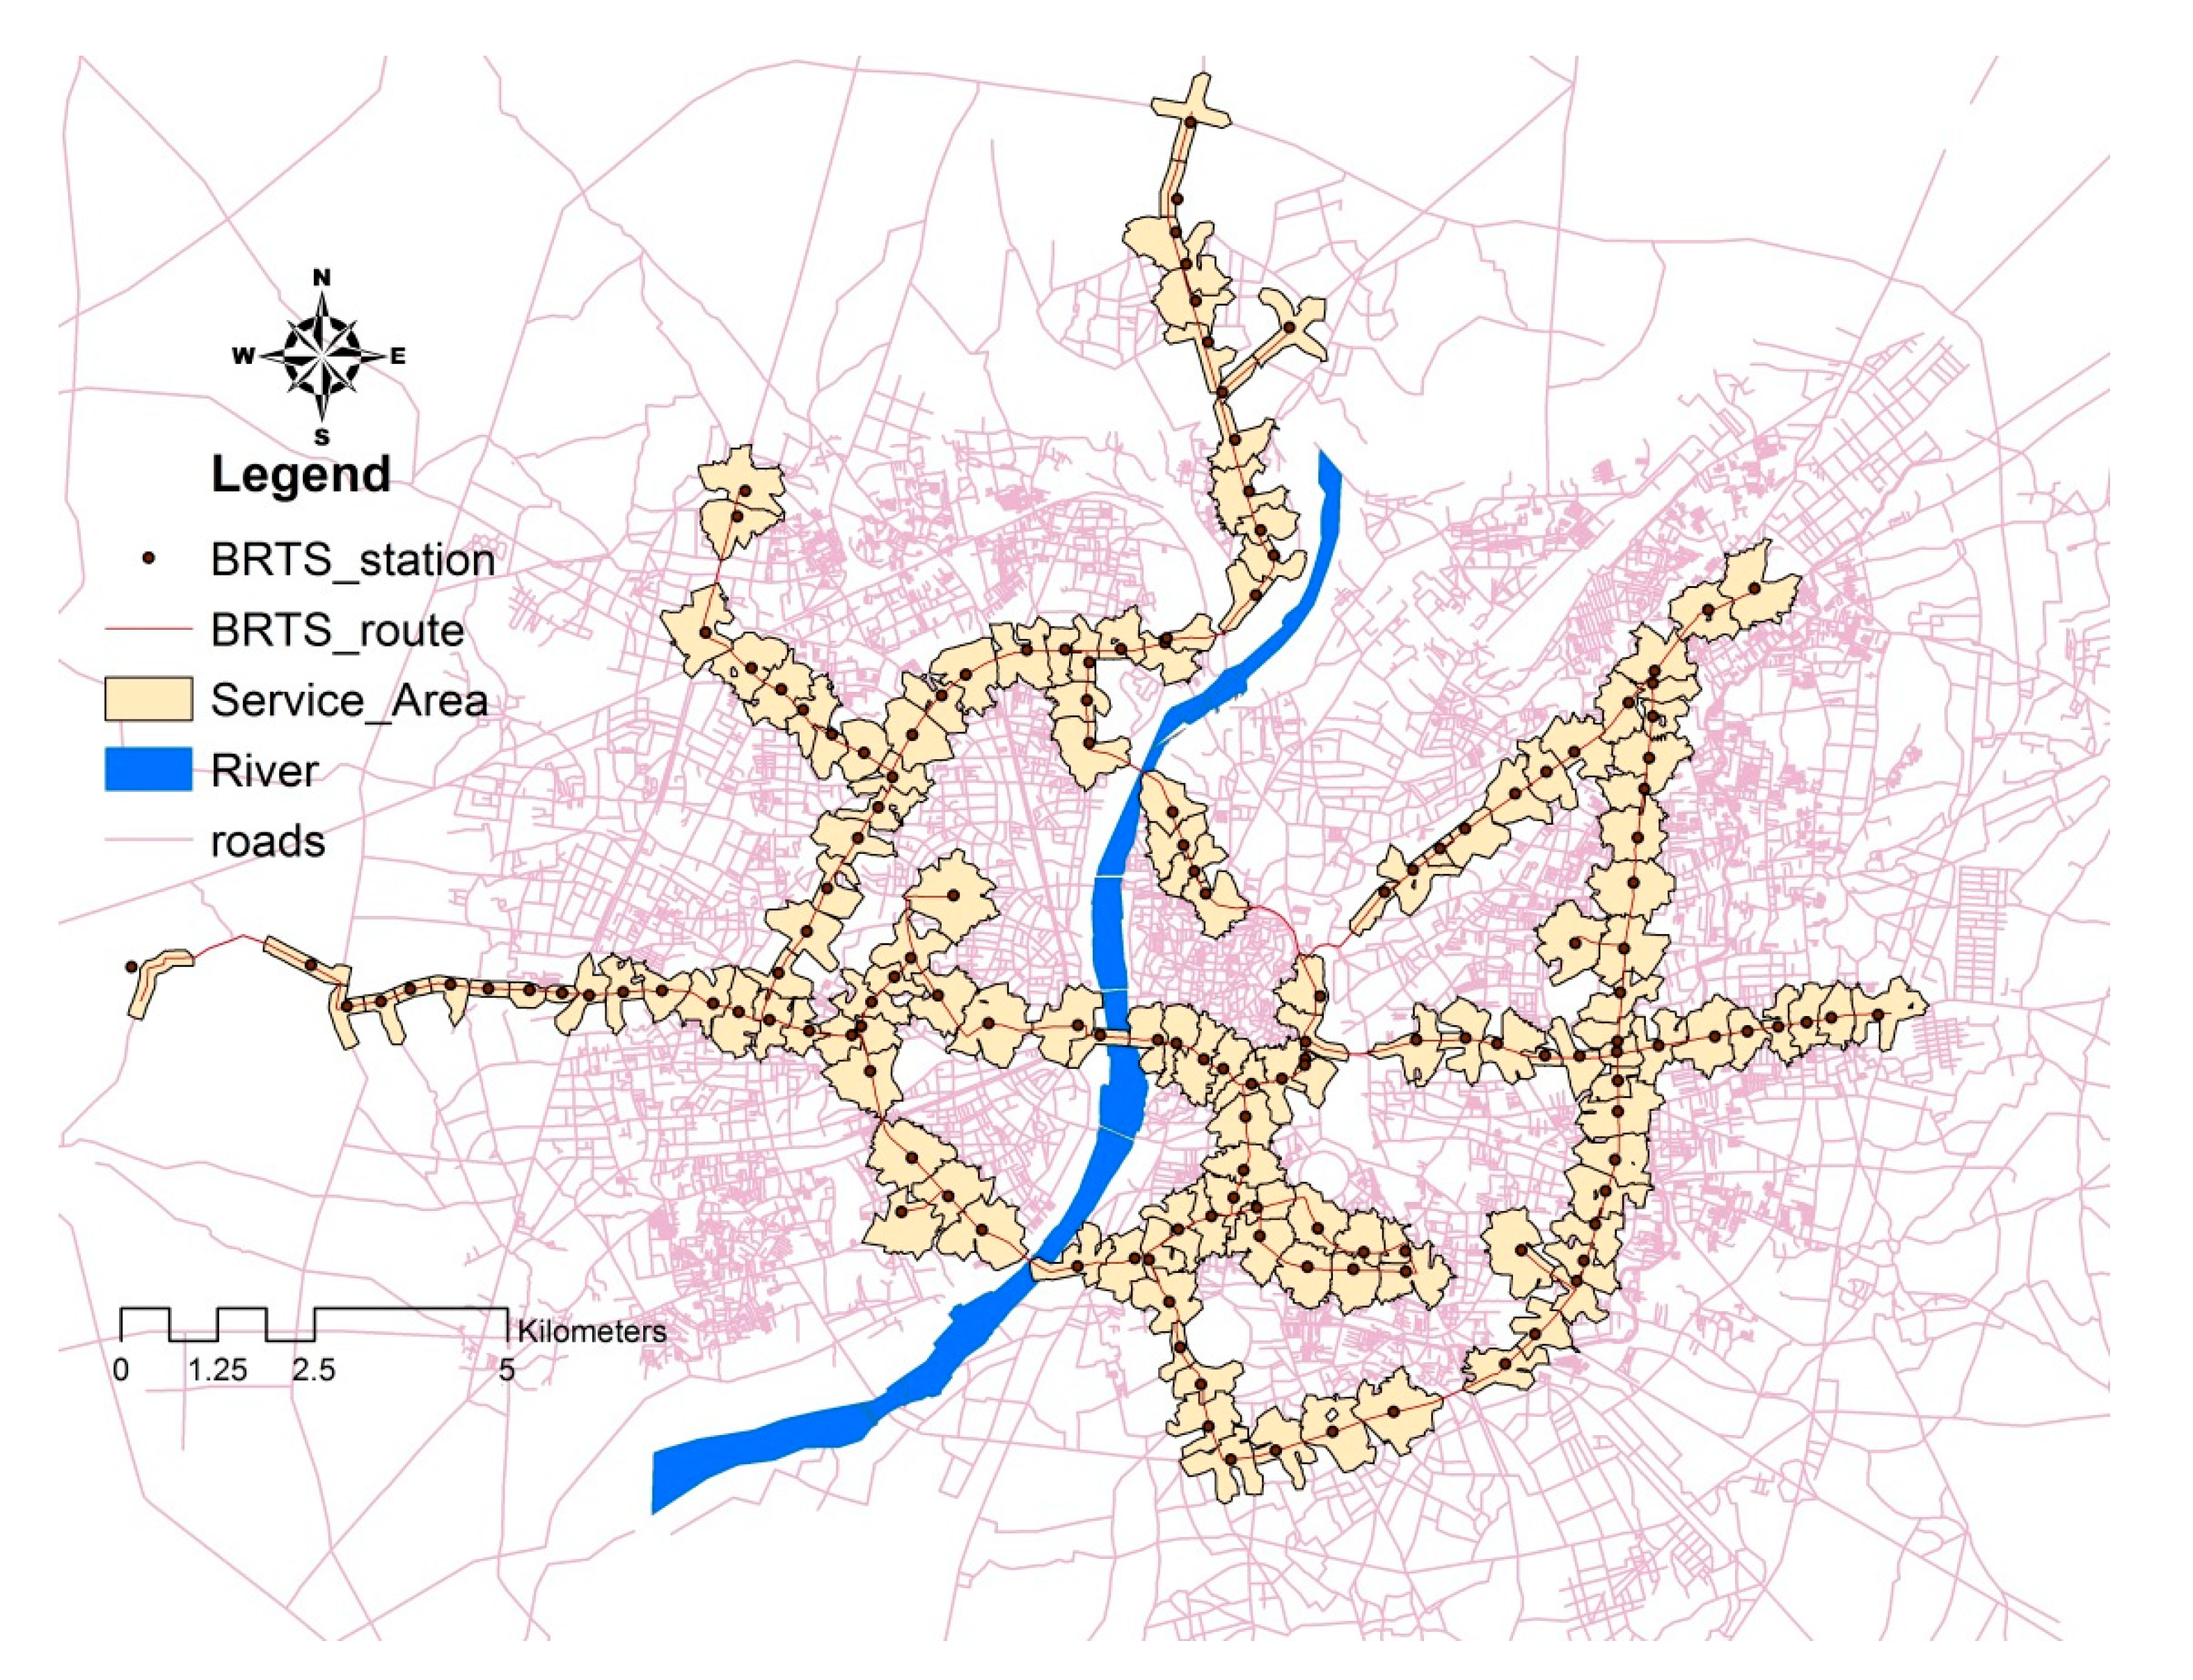
5.1. Analysis Unit
5.2. Operationalization of the Built-Form Indicators
6. Results and Discussion
7. Conclusions and Recommendations
Supplementary Materials
Author Contributions
Funding
Acknowledgments
Conflicts of Interest
References
- Deng, T.; Nelson, J.D. Bus Rapid Transit implementation in Beijing: An evaluation of performance and impacts. Res. Transp. Econ. 2013, 39, 108–113. [Google Scholar] [CrossRef]
- Deng, T.; Ma, M.; Wang, J. Evaluation of Bus Rapid Transit Implementation in China: Current Performance and Progress. J. Urban Plan. Dev. 2013, 139, 226–234. [Google Scholar] [CrossRef]
- Bajracharya, A.R.; Zuidgeest, M.H.P.; Brussel, M.; Munshi, T. Measurement and mapping of the impact of modal shift towards BRT in Ahmedabad. In Proceedings of the Better Air Quality (BAQ) Conference, Bangkok, Thailand, 12–14 November 2008. [Google Scholar]
- Shastry, S. Spatial Assessment of Transit Oriented Development in Ahmedabad, India; ITC, University of Twente: Enschede, The Netherlands, 2010; Available online: http://essay.utwente.nl/59707/1/MA_thesis_R_Shastry.pdf (accessed on 15 September 2015).
- National Institute of Urban Affairs. Urban Transport Initiatives in India—Best Practices in PPP (Ahmedabad Bus Rapid Transit System). 2011. Available online: http://www.niua.org/projects/tpt/AHMEDABAD BRTS.pdf (accessed on 25 August 2015).
- Mahadevia, D.; Joshi, R.; Datey, A. Low-Carbon Mobility in India and the Challenges of Social Inclusion: Bus Rapid Transit (BRT) Case Studies in India. UNEP Risø Centre on Energy, Climate and Sustainable Development, Technical University of Denmark. 2013. Available online: http://www.unep.org/transport/lowcarbon/Pdf’s/BRT_Casestudies_India_fullreport.pdf (accessed on 5 September 2015).
- Mahadevia, D.; Joshi, R.; Datey, A. Accessibility and Sustainability of Bus Rapid Transit in India; Climate and Sustainable Development Technical University of Denmark: Roskilde, Denmark, 2012. [Google Scholar]
- Rogat, J.; Dhar, S.; Joshi, R.; Mahadevia, D.; Mendoza, J.C. Sustainable Transport: BRT experiences from Mexico and India. Wiley Interdiscip. Rev. Energy Environ. 2015, 4, 564–574. [Google Scholar] [CrossRef]
- Tiwari, G.; Mohan, D.; Rao, K.; Mahadevia, D.; Joshi, R. City Level Indicators. 2011. Available online: http://www.unep.org/Transport/lowcarbon/newsletter_2/pdf/ANNEX 2_City_level_Indicators_4oct.pdf (accessed on 9 August 2015).
- Damor, M.N.; Kumara, S.; Hajiani, N.D. Review of Comparative study on ridership for urban mass transit systems: A case study of Ahmedabad BRTS. Int. J. Eng. Tech. Res. (IJETR) 2014, 2, 12–14. [Google Scholar]
- Ahmedabad Municipal Corporation. Bus Rapid Transit System Plan: Phase—II Detailed Project Report. Ahmedabad, 2008. Available online: http://www.ahmedabadbrts.org/web/images/Ahmedabad BRTS Phase-2 DPR_April 2008.pdf (accessed on 30 November 2015).
- Ahmedabad Municipal Corporation. Executive Summary Phase 1. Ahmedabad. Available online: http://www.ahmedabadbrts.org/web/images/Executive Summary_ABRTS Phase-1.pdf (accessed on 10 October 2015).
- Ahmedabad Municipal Corporation. Executive Summary Phase 2. Ahmedabad, 2008. Available online: http://www.ahmedabadbrts.org/web/images/Executive Summary_ABRTS Phase-2.pdf (accessed on 15 October 2015).
- Mineta Transportation Institute. Increasing Transit Ridership: Lessons from the Most Successful Transit Systems in the 1990’s; Mineta Transportation Institute: San Jose, CA, USA, 2002. [Google Scholar]
- Transit Cooperative Reseach Program. Elements Needed to Create High Ridership Transit System; Transportation Research Board: Washington, DC, USA, 2007. [Google Scholar]
- Cervero, R.; Murakami, J.; Miller, M. Direct Ridership Model of Bus Rapid Transit in Los Angeles County, California. Transp. Res. Rec. J. Transp. Res. Board 2010, 2145, 1–7. [Google Scholar] [CrossRef]
- Ma, Y.-S.; Chen, X. Geographical and Statistical Analysis on the Relationship Between Land-Use Mixture and Home—Based Trip Making and More: Case of Richmond, Virginia. J. Urban Reg. Anal. 2013, 1, 5–44. [Google Scholar]
- Stopher, P.R. Development of a route level patronage forecasting method. Transportation 1992, 19, 201–220. [Google Scholar] [CrossRef]
- Peng, Z.; Dueker, K.J.; Strathman, J.G.; Hopper, J. A simultaneous route-level transit patronage mode: Demand, supply, and interroute relationship. Transportation 1997, 24, 159–181. [Google Scholar] [CrossRef]
- Cervero, R.; Kockelman, K. Travel demand and the 3Ds: Density, diversity, and design. Transp. Res. Part D Transp. Environ. 1997, 2, 199–219. [Google Scholar] [CrossRef]
- Ewing, R.; Cervero, R. Travel and the Built Environment: A Synthesis. Transp. Res. Rec. 2001, 1780, 87–114. [Google Scholar] [CrossRef]
- Campoli, J.; MacLean, A. Visualizing Density: A Catalog Illustrating the Density of Residential Neighborhoods; Lincoln Institute of Land Policy: Cambridge, MA, USA, 2002. [Google Scholar]
- Kuzmyak, R.J.; Pratt, R.H. Land Use and Site Design: Traveler Response to Transport System Changes; Transit Cooperative Research Program Report 95; Transportation Research Board: Washington, DC, USA, 2003. [Google Scholar]
- Kitamura, R.; Mokhtarian, P.L.; Laidet, L. A micro-analysis of land use and travel in five neighborhoods in the San Francisco Bay Area. Transportation 1997, 24, 125–158. [Google Scholar] [CrossRef]
- Schwanen, T.; Dieleman, F.M.; Dijst, M. The impact of metropolitan structure on commute behavior in the Netherlands: A multilevel approach. Growth Chang. 2004, 35, 304–333. [Google Scholar] [CrossRef]
- Stead, D. Relationships between land use, socioeconomic factors and travel patterns in Britain. Environ. Plan. B 2001, 28, 499–528. [Google Scholar] [CrossRef]
- Cervero, R. Ridership Impacts of Transit Focused Development in California; University of California: Berkeley, CA, USA, 1993. [Google Scholar]
- Parsons Brinckerhoff Quade & Douglas Inc. Transit and Urban Form; Transportation Research Board, National Academy Press: Washington, DC, USA, 1996. [Google Scholar]
- Munshi, T. Built Form, Travel Behaviour and Low Carbon Develpment in Ahmedabad, India; Urban Planning and Management, ITC, University of Twente: Enschede, The Netherlands, 2013. [Google Scholar]
- Gao, S.; Mokhtarian, P.L.; Johnston, R.A. Exploring the connections among job accessibility, employment, income, and auto ownership using structural equation modeling. Ann. Reg. Sci. 2008, 42, 341–356. [Google Scholar] [CrossRef]
- Lambin, E.F.; Meyfroidt, P. Global land use change, economic globalization, and the looming land scarcity. Proc. Natl. Acad. Sci. USA 2011, 108, 3465–3472. [Google Scholar] [CrossRef] [PubMed]
- Boarnet, M.G. A Broader Context for Land Use and Travel Behavior, and a Research Agenda. J. Am. Plan. Assoc. 2011, 77, 197–213. [Google Scholar] [CrossRef]
- Frank, L.D.; Pivo, G. Impacts of mixed use and density on utilization of three modes of travel: Single occupant vehicle, transit, and walking. Transp. Res. Rec. J. Transp. Res. Board 1994, 1466, 44–52. [Google Scholar] [CrossRef]
- Litman, T.; Steele, R. Land Use Impacts on Transport How Land Use Factors Affect Travel Behavior. Behav. Sci. Transp. Transp. Policy 2012, 14, 269–274. [Google Scholar]
- Dill, J. Measuring Network Connectivity for Bicycling and Walking. School of Urban Studies and Planning, Portland State University, 2004. Available online: http://reconnectingamerica.org/assets/Uploads/TRB2004-001550.pdf (accessed on 15 December 2015).
- Handy, S.; Paterson, R.G.; Butler, K. Planning for Street Connectivity: Getting from Here to There; Planning Advisory Service, American Planning Association: Chicago, IL, USA, 2004. [Google Scholar]
- Ewing, R.; Cervero, R. Travel and the built environment: A meta-analysis. J. Am. Plan. Assoc. 2010, 76, 265–294. [Google Scholar] [CrossRef]
- Rodrigue, J.P.; Comtois, C.; Slack, B. The Geography of Transport Systems. London, 2006. Available online: https://people.hofstra.edu/geotrans/eng/gallery/Geography of Transport Systems_1ed.pdf (accessed on 10 January 2016).
- Owens, A.; Levinson, D. Access to Destinations: Annual Accessibility Measure for the Twin Cities Metropolitan Area; University of Minnesota: Minneapolis, MN, USA, 2012. [Google Scholar]
- Cervero, R. Accessible Cities and Regions: A Framework for Sustainable Transport and Urbanism in the 21st Century; UC Berkeley Centre for Future Urban Transport, Institute of Transportation studies, University of California: Berkeley, CA, USA, 2005; Available online: http://repositories.cdlib.org/its/future urban transport/vwp-2005-3 (accessed on 20 January 2016).
- Hensher, D.A.; Golob, T.F. Bus rapid transit systems: A comparative assessment. Transportation 2008, 35, 501–518. [Google Scholar] [CrossRef]
- Hensher, D.A.; Li, Z.; Mulley, C. Drivers of bus rapid transit systems—Influences on patronage and service frequency. Res. Transp. Econ. 2014, 48, 159–165. [Google Scholar] [CrossRef]
- Estupiñán, N.; Rodríguez, D.A. The relationship between urban form and station boardings for Bogotá’s BRT. Transp. Res. Part A Policy Pract. 2008, 42, 296–306. [Google Scholar] [CrossRef]
- Kuby, M.; Barranda, A.; Upchurch, C. Factors influencing light-rail station boardings in the United States. Transp. Res. Part A Policy Pract. 2004, 38, 223–247. [Google Scholar] [CrossRef]
- Durning, M.; Townsend, C. Direct Ridership Model of Rail Rapid Transit Systems in Canada. Transp. Res. Rec. J. Transp. Res. Board 2015, 2537, 96–102. [Google Scholar] [CrossRef]
- Currie, G.; Delbosc, A. Exploring Comparative Ridership Drivers of Bus Rapid Transit and Light Rail Transit Routes. J. Public Transp. 2013, 16, 47–65. [Google Scholar] [CrossRef]
- Vergel-Tovar, E.; Rodriguez, D. The ridership performance of the built environment for BRT systems: Evidence from Latin America. J. Transp. Geogr. 2018, 1–13. [Google Scholar] [CrossRef]
- GIDB. Bus Rapid Transit System; CEPT University: Ahmedabad, India, 2005. [Google Scholar]
- Khanna, S. Where Are The Actual Gainers of the BRTS, Ahmedabad?” A Study into the Spatial and Social Distribution of Benefits of Transport Development Project; ITC, University of Twente: Enschede, The Netherlands, 2009. [Google Scholar]
- Bajracharya, A.R. The Impact of Modal Shift on the Transport Ecological Footprint, A Case Study of the Proposed Bus Rapid Transit System in Ahmedabad, India; ITC, University of Twente: Enschede, The Netherlands, 2008; Available online: http://www.itc.nl/library/papers_2008/msc/upm/bajracharya.pdf (accessed on 30 September 2015).
- Hsiao, S.; Lu, J.; Sterling, J.; Weatherford, M. Use of geographic information system for analysis of transit pedestrian access. Transp. Res. Rec. 1997, 1604, 50–59. [Google Scholar] [CrossRef]
- Levinson, H.S.; Brown-West, O. Estimating bus ridership. Transp. Res. Rec. 1984, 994, 8–12. [Google Scholar]
- Neilson, G.; Fowler, W. Relation between transit ridership and walking distances in a low-density Florida retirement area. Highw. Res. Rec. 1972, 403, 26–34. [Google Scholar]
- Zhao, F.; Chow, L.-F.; Li, M.-T.; Ubaka, I.; Gan, A. Forecasting transit walk accessibility: Regression model alternative to buffer method. Transp. Res. Rec. 2003, 1835, 34–41. [Google Scholar] [CrossRef]
- Kimpel, T.J.; Dueker, K.J.; El-Geneidy, A.M. Using GIS to Measure the Effect of Overlapping Service Areas on Passenger Boardings at Bus Stops. Urisa J. 2007, 19, 5–11. [Google Scholar]
- Guerra, E.; Cervero, R.; Tischler, D. The Half-Mile Circle: Does It Best Represent Transit Station Catchments? University of California: Berkeley, CA, USA, 2011. [Google Scholar]
- Cervero, R. Linking urban transport and land use in developing countries. J. Transp. Land Use 2013, 6, 7–24. [Google Scholar] [CrossRef]
- Center for Transit-Oriented Development. Transit Corridors and TOD. Available online: http://ctod.org/pdfs/tod203.pdf (accessed on 10 December 2015).
- MYBYK-BikeShare. Available online: http://www.mybyk.in/ (accessed on 7 February 2016).


| Study Source | Dependent Variable (unit) | Independent Variable | Sample Size | |
|---|---|---|---|---|
| Built-Form Variable | Qualitative Variable (Dummy) | |||
| (Estupiñán & Rodríguez, 2008) [43] | Daily boarding per station | Land-use index, density, road density, sum of intersection | Station characteristics and perception about safety, clean, pedestrian friendly, bike friendly as extracted from the user | 68 stations of Bogota Bus Rapid Transit (BRT) |
| (Kuby, Barranda, & Upchurch, 2004) [44] | Average weekday boarding | Number of employment and population within walking distance, station spacing | Station and city-wide dummy variable | 268 light-rail stations in nine US cities |
| (Cervero et al., 2010) [16] | Average daily boarding | Population density, distance to nearest BRT stop | Service and station dummy attributes | 69 stations of the BRT in Los Angeles |
| (Durning & Townsend, 2015) [45] | Average daily boarding | Population density, intersection density, commercial site density, 3 land-use variables | Parking space, bus connection, transfer station | 342 rail stations in Canada |
| (Currie & Delbosc, 2013) [46] | Boardings/Veh-Km (BVK) | Residential density, employment density, stop spacing %, accessible %, segregated right-of-way | Integrated fares, capacity (category) | 101 service routes (BRT, Light Rail Transit (LRT) and Streetcar) |
| GIS Data File | Type | Purpose | Source |
|---|---|---|---|
| Population (at TAZ 1 level) | Polygon (spatial and non-spatial) | To determine the population density for each station catchment | (Khanna, 2009) [49] |
| Job (block) | Square block (polygon) | To measure the job density for each station catchment | (Munshi, 2013) [29] |
| roads | polyline | To create the station catchment following the network distance and to determine the road connectivity | (Munshi, 2013) [29] |
| Land use | polygon | Provides information regarding different land uses which will be used for diversity measure | (Bajracharya, 2008) [50] |
| BRTS route | polyline | Job accessibility by Bus Rapid Transit System (BRTS) following this route will be measured | Ahmedabad Janmarg Limited, 2015 |
| BRTS station | Point | Information regarding station location from which the catchment will be determined | Ahmedabad Janmarg Limited, 2015 |
| Total monthly boarding (July, 2015) | Excel format (non-spatial data) | This data will be used as a dependent variable in the regression analysis | Ahmedabad Janmarg Limited, 2015 |
| 5D (Built Form Indicators) | Popular Measures |
|---|---|
| Density | Population density, Job density |
| Diversity | Entropy index, Dissimilarity index |
| Design | Intersection density, Street density, Link-node ratio (Beta Index/Street Connectivity Index) |
| Destination accessibility | Job accessibility by Bus Rapid Transit System (BRTS) (gravity-based measure) |
| Distance to station | Distance from nearest station (a proxy for catchment size of the stop) |
| Indicators | Variable | Min | Max | Mean | STDEV | Skewness |
|---|---|---|---|---|---|---|
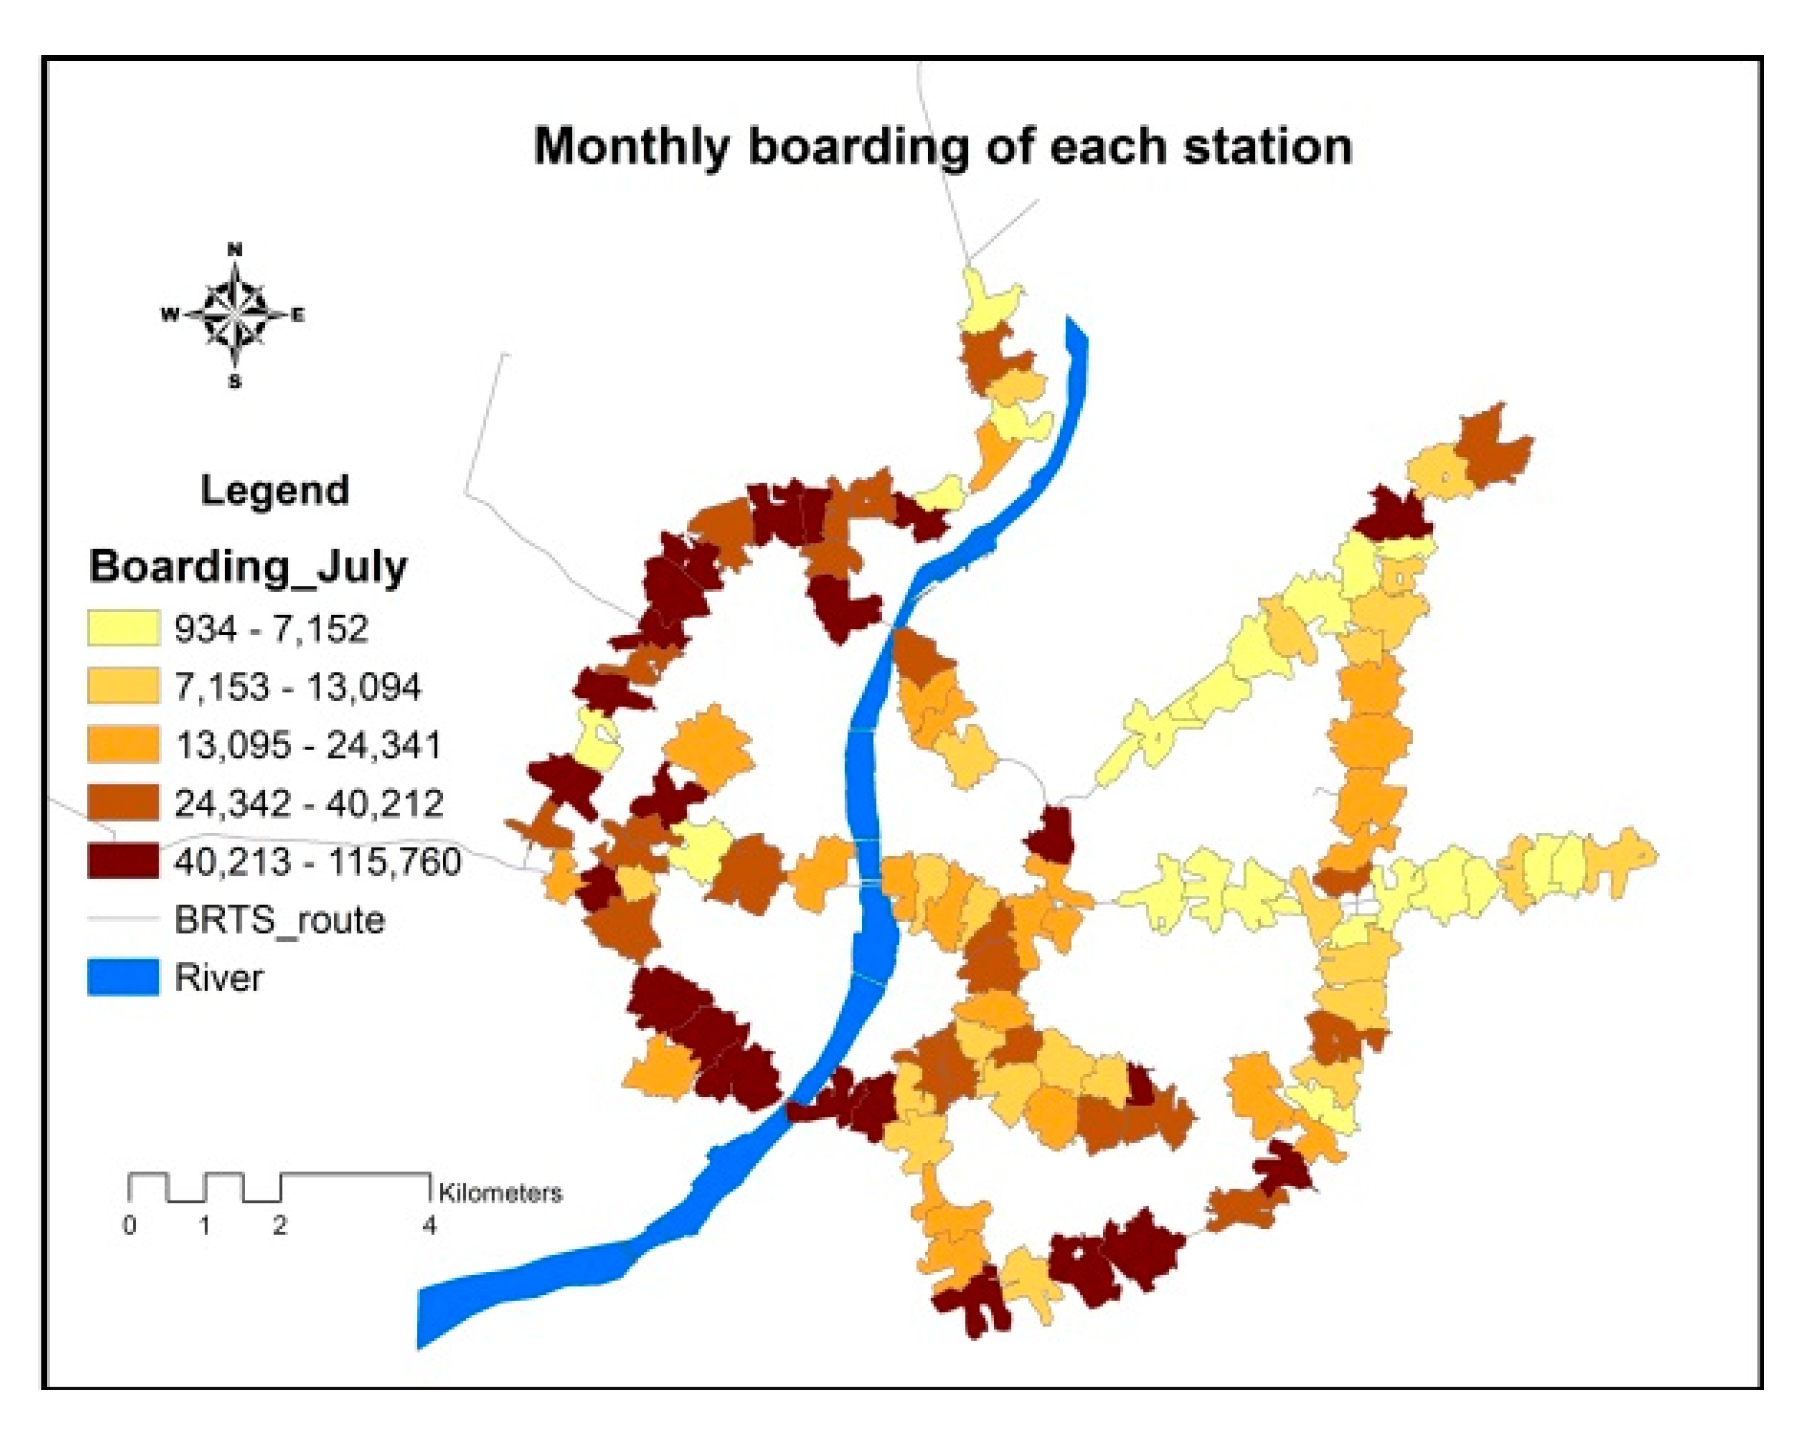
| Ridership | Boarding (July 2015) | 934 | 115,760 | 24,876 | 23,929 | 1.882 |
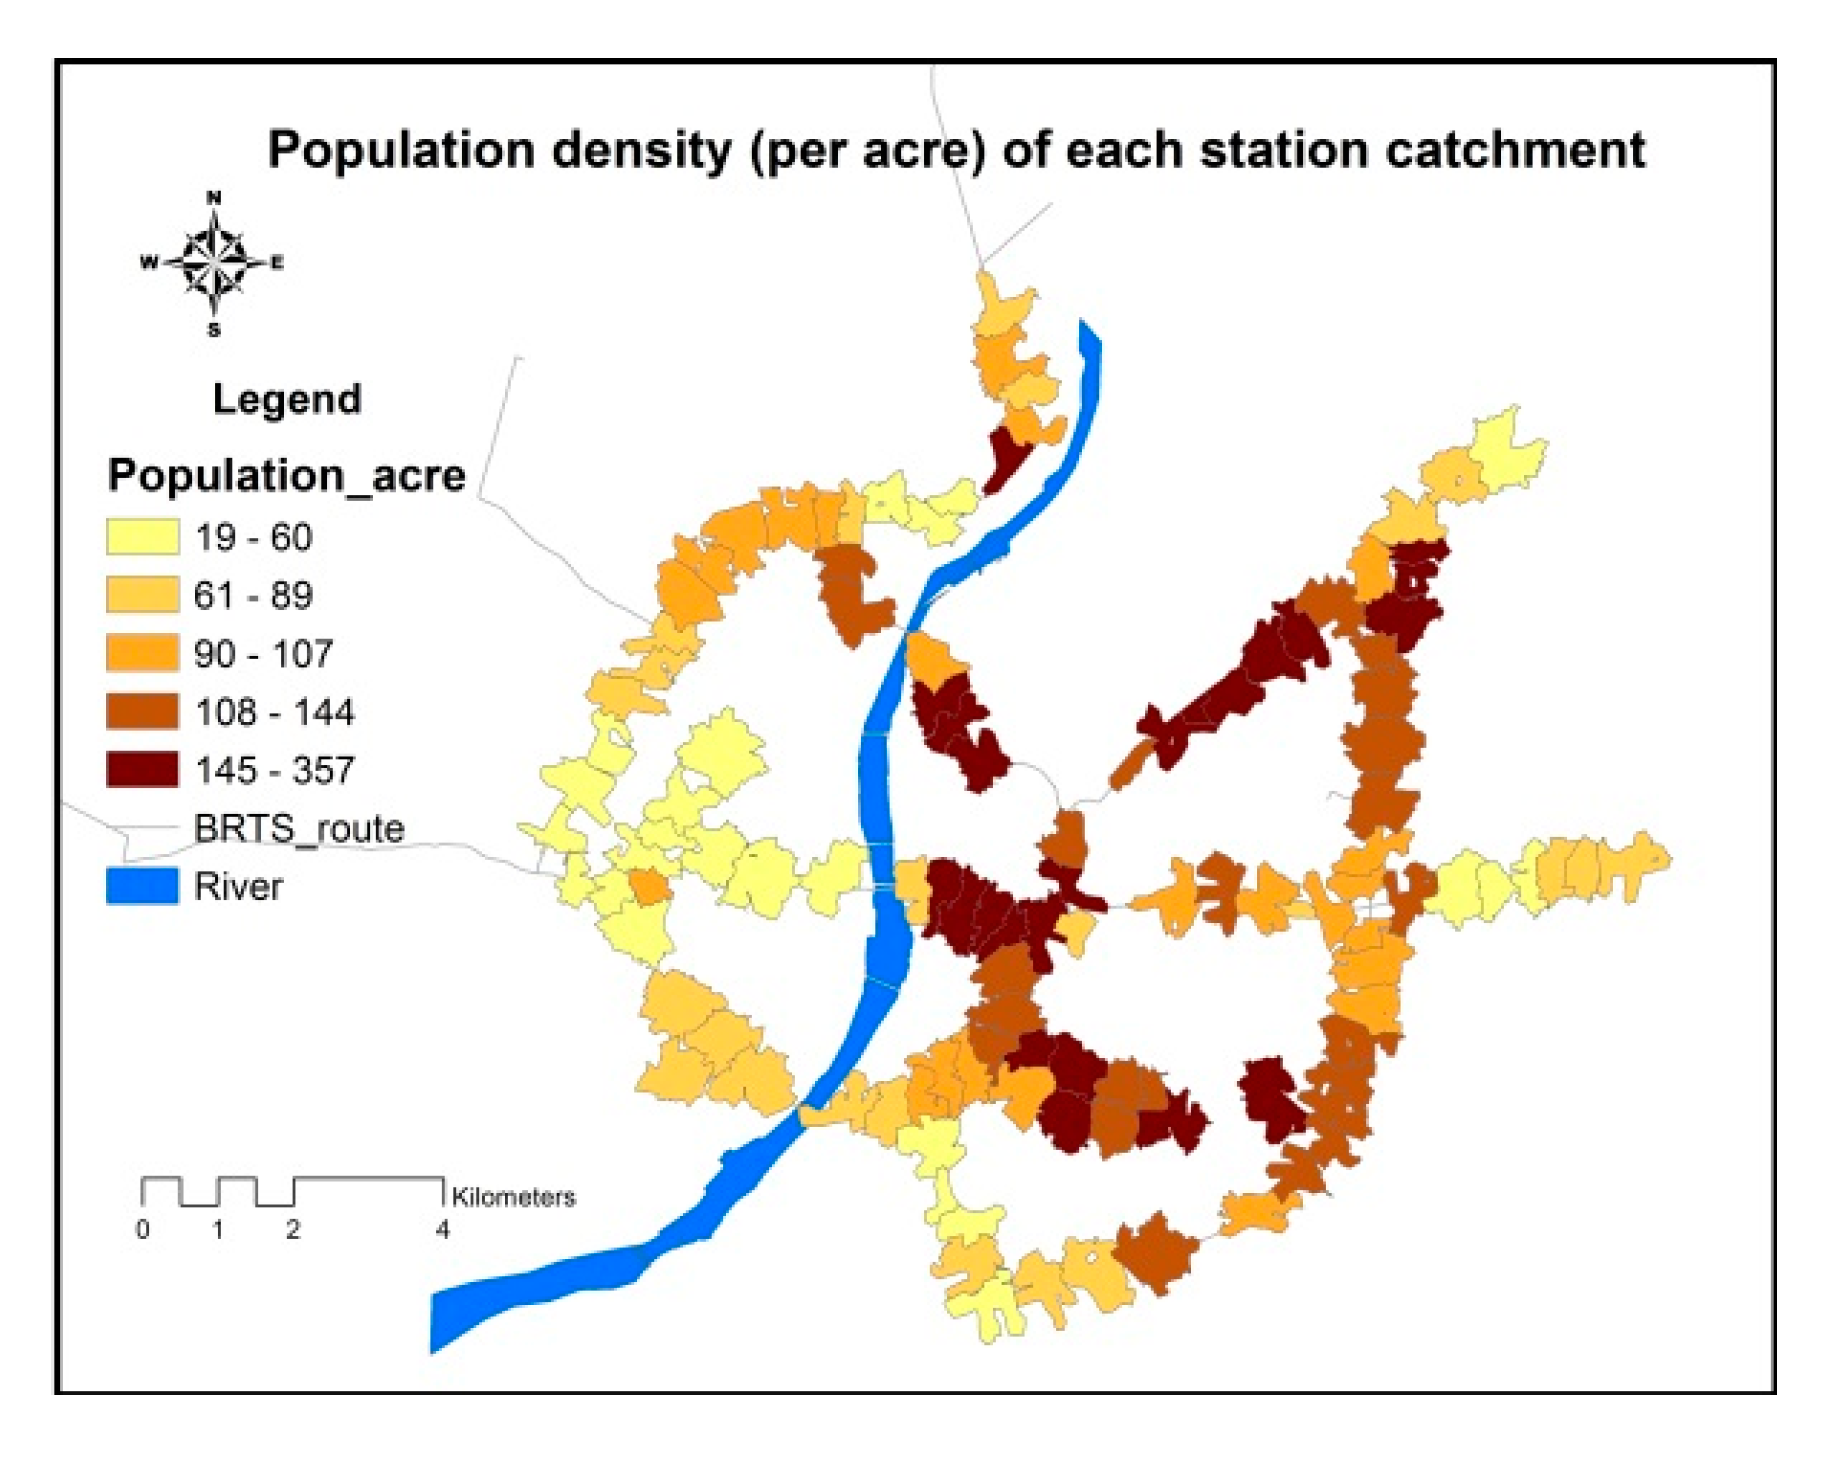
| Density | Population_acre | 19 | 357 | 108 | 59 | 1.495 |
| Job_acre | 0.37 | 298.83 | 46.33 | 59.05 | 2.55 | |
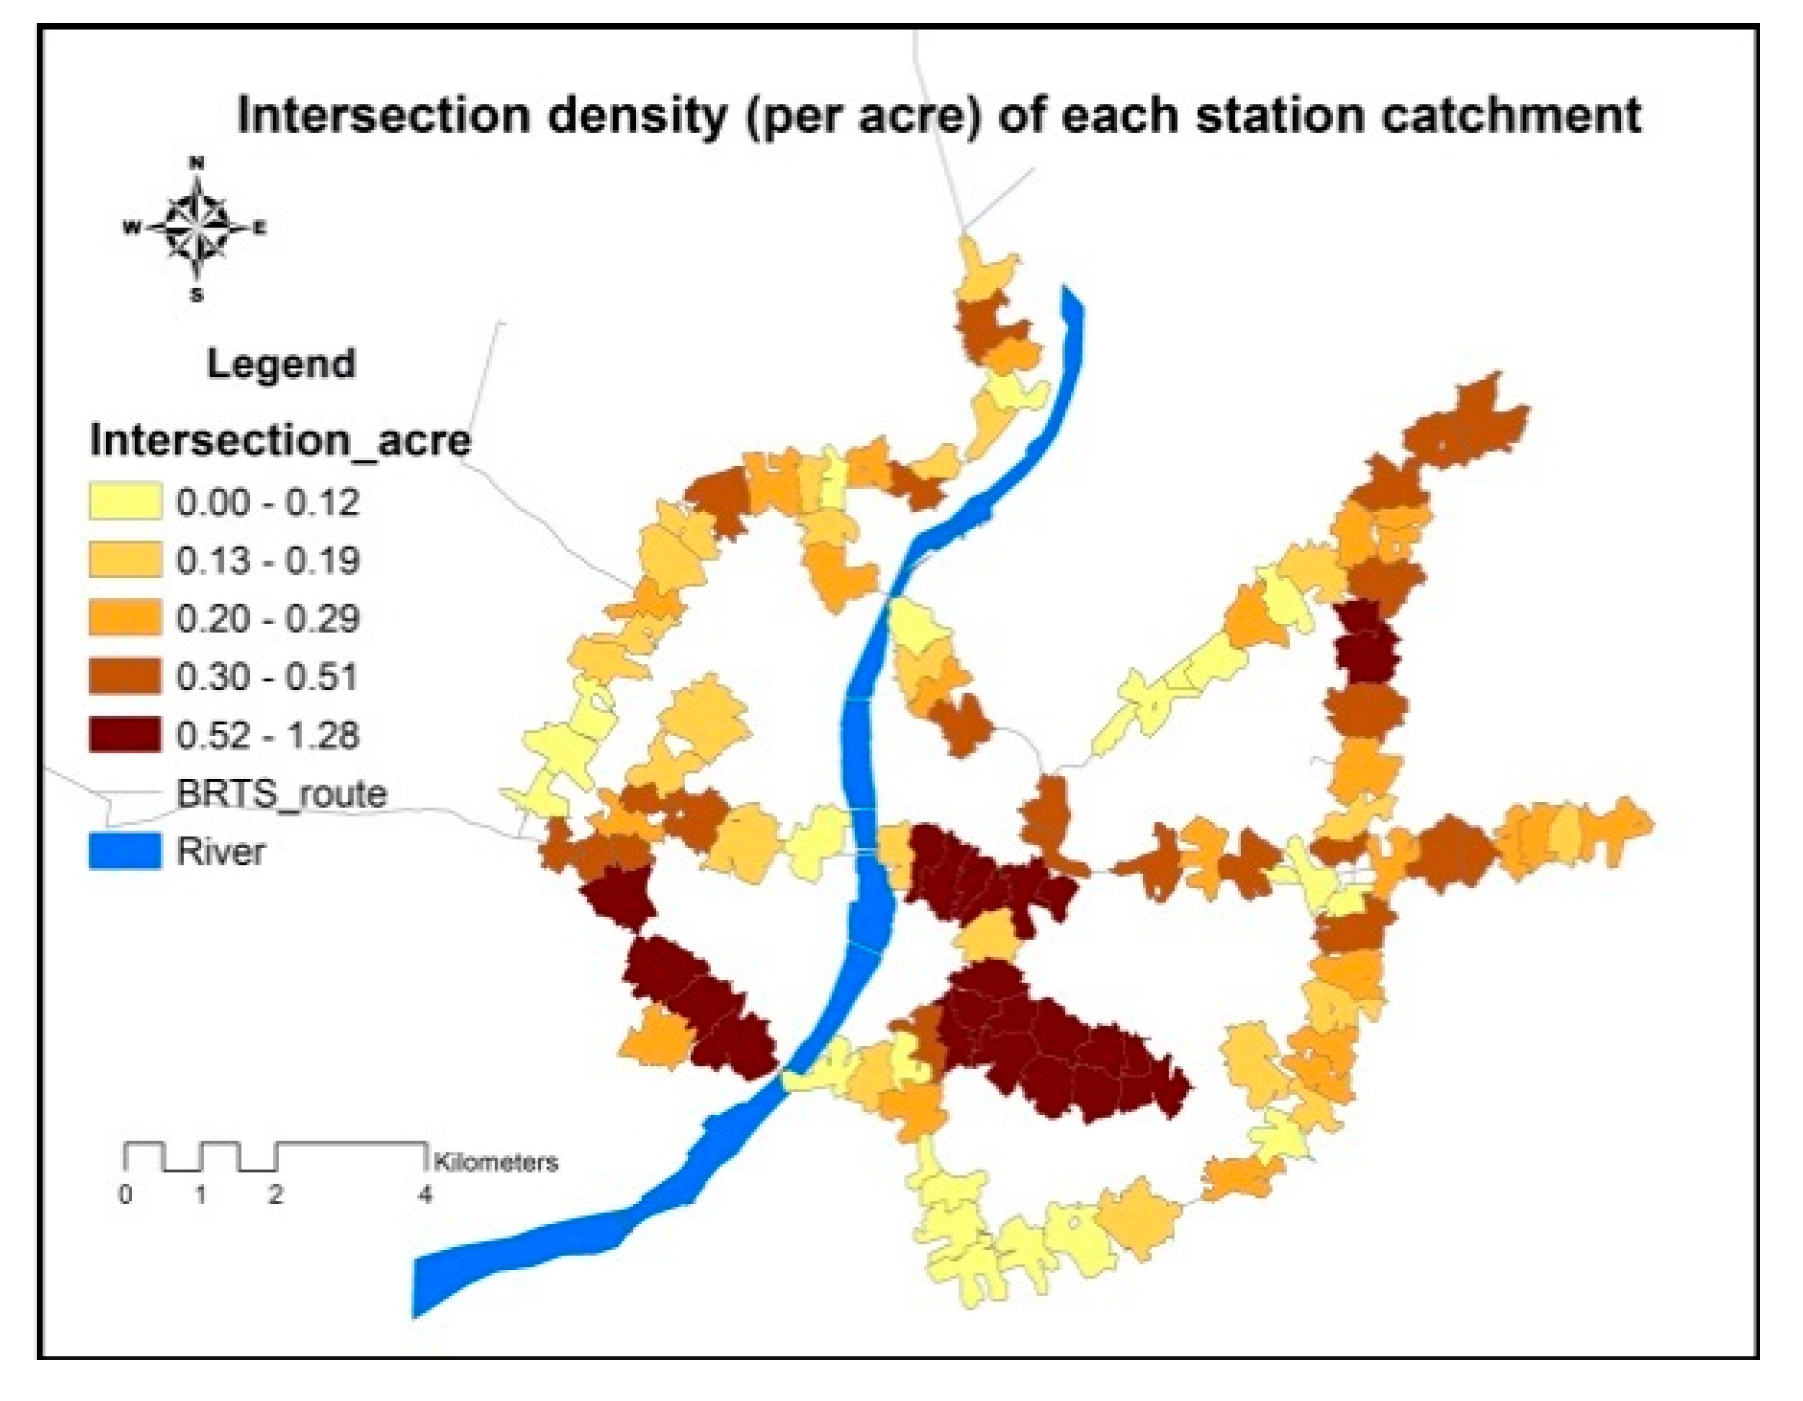
| Design | Intersection_acre | 0.00 | 1.28 | 0.30 | 0.23 | 1.377 |
| Destination | Job Accessibility by Bus Rapid Transit System (BRTS) | 69,631 | 495,977 | 362,698 | 100,545 | −0.969 |
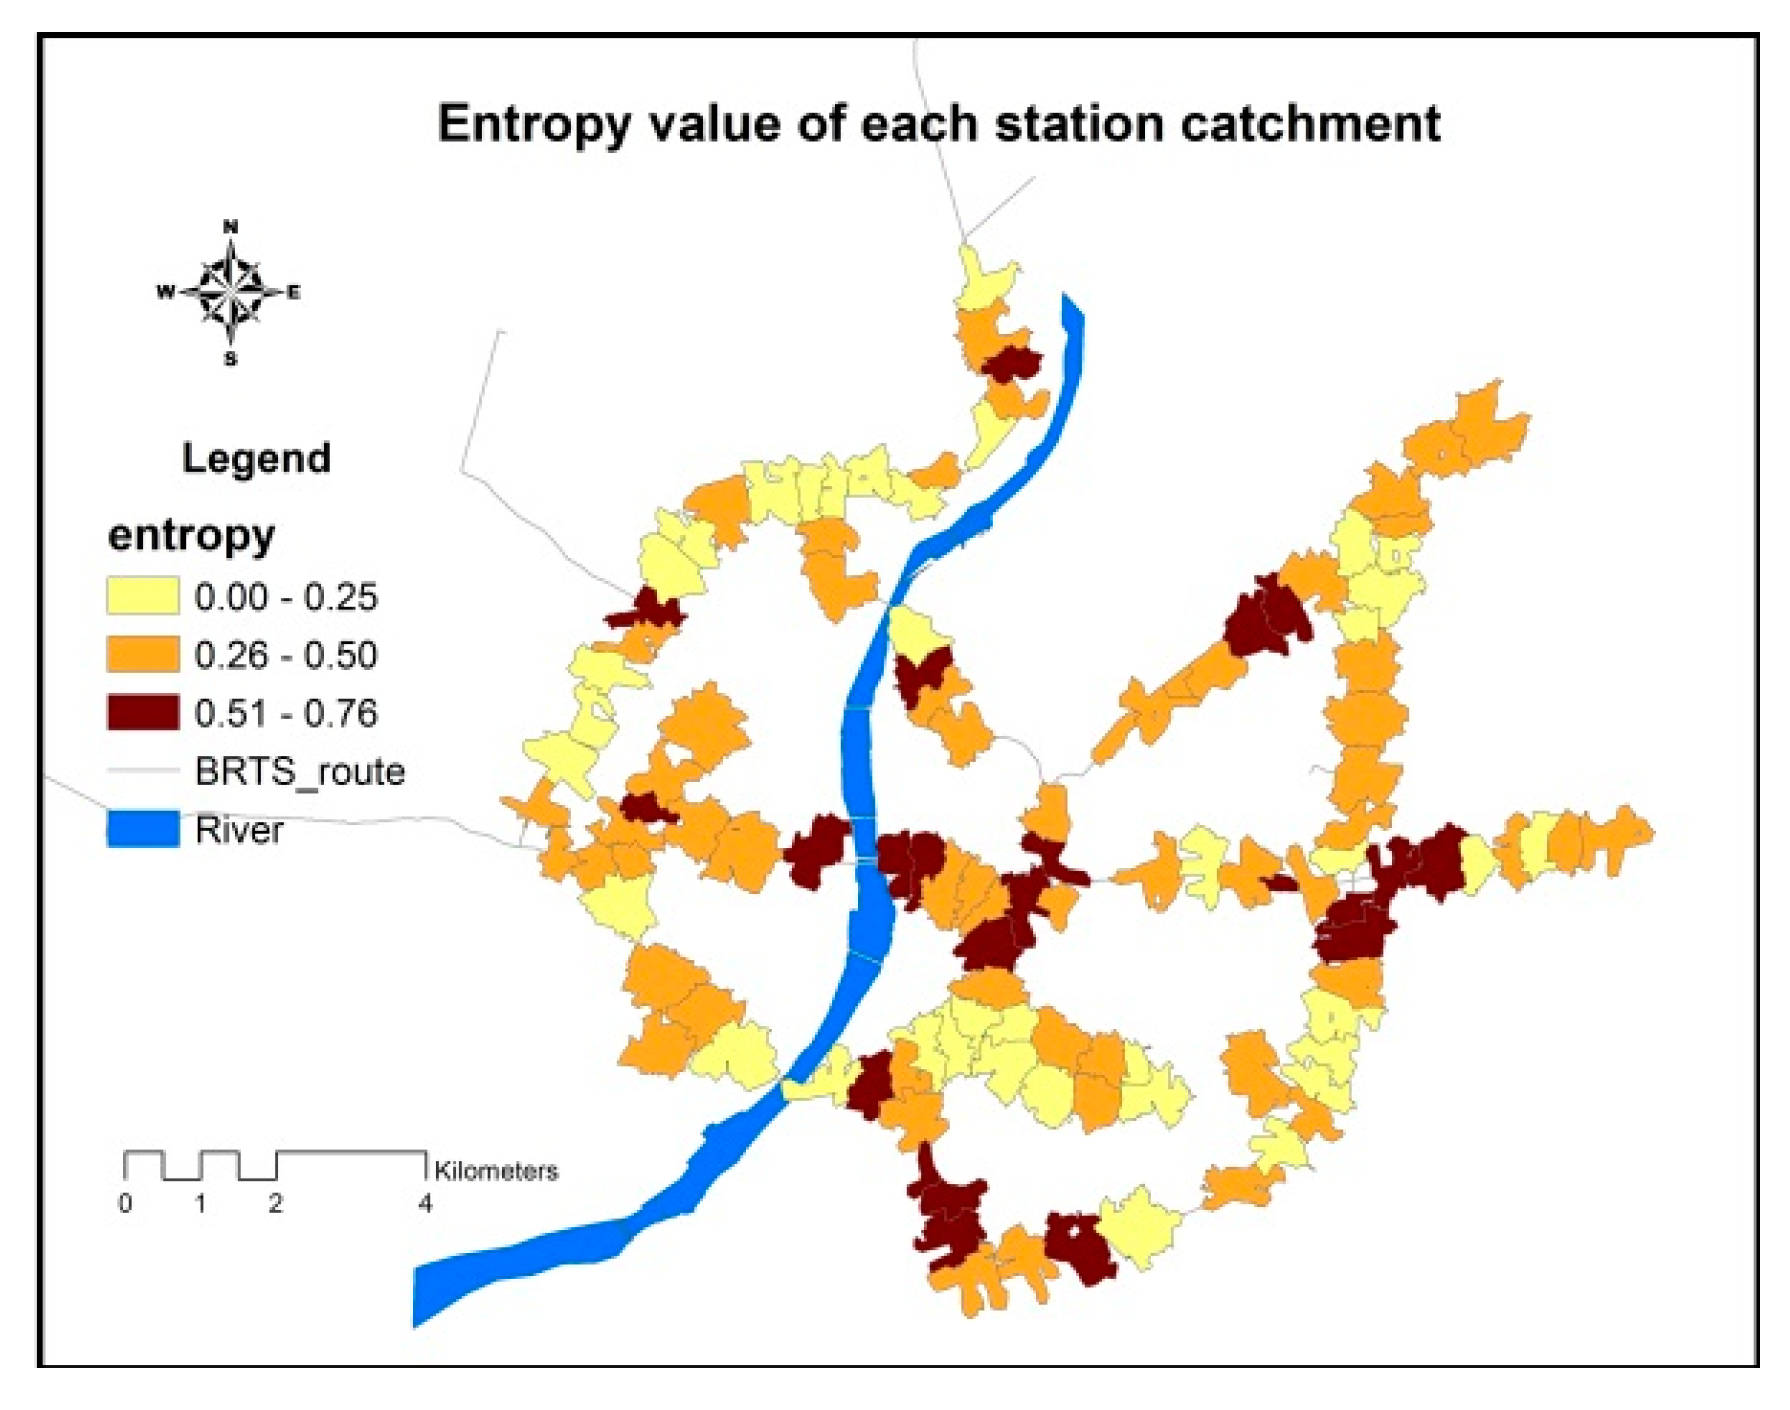
| Diversity | Entropy | 0.00 | 0.76 | 0.35 | 0.18 | 0.072 |
| Variable | Boarding_July | Population_Acre | Job_Acre | Job_Access | Entropy | Intersection_Acre |
|---|---|---|---|---|---|---|
| Boarding_July | 1 | −0.233 * | −0.105 | −0.301 ** | −0.224 * | 0.007 |
| Population_acre | 1 | 0.484 ** | 0.318 ** | −0.014 | 0.269 ** | |
| Job_acre | 1 | 0.515 ** | 0.370 ** | 0.222 * | ||
| Job_access | 1 | 0.288 ** | 0.219 * | |||
| Entropy | 1 | −0.150 | ||||
| Intersection_acre | 1 |
| Model | Unstandardized Coefficients | Standardized Coefficients | t-Value | Sig. | |
|---|---|---|---|---|---|
| B | Std. Error | Beta | |||
| (Constant) | 66,420.65 | 9547.36 | 6.96 | 0.00 | |
| population_acre | −114.66 | 41.91 | −0.28 | −2.74 | 0.01 |
| Job_acre | 102.59 | 47.81 | 0.25 | 2.15 | 0.03 |
| Intersection_acre | 5859.81 | 9888.08 | 0.06 | 0.59 | 0.55 |
| Entropy | −31,027.51 | 13,429.97 | −0.23 | −2.31 | 0.02 |
| Job_access | −0.07 | 0.02 | −0.29 | −2.78 | 0.01 |
© 2018 by the authors. Licensee MDPI, Basel, Switzerland. This article is an open access article distributed under the terms and conditions of the Creative Commons Attribution (CC BY) license (http://creativecommons.org/licenses/by/4.0/).
Share and Cite
Islam, M.R.; Brussel, M.; Grigolon, A.; Munshi, T. Ridership and the Built-Form Indicators: A Study from Ahmedabad Janmarg Bus Rapid Transit System (BRTS). Urban Sci. 2018, 2, 95. https://doi.org/10.3390/urbansci2040095
Islam MR, Brussel M, Grigolon A, Munshi T. Ridership and the Built-Form Indicators: A Study from Ahmedabad Janmarg Bus Rapid Transit System (BRTS). Urban Science. 2018; 2(4):95. https://doi.org/10.3390/urbansci2040095
Chicago/Turabian StyleIslam, Md Rabiul, Mark Brussel, Anna Grigolon, and Talat Munshi. 2018. "Ridership and the Built-Form Indicators: A Study from Ahmedabad Janmarg Bus Rapid Transit System (BRTS)" Urban Science 2, no. 4: 95. https://doi.org/10.3390/urbansci2040095
APA StyleIslam, M. R., Brussel, M., Grigolon, A., & Munshi, T. (2018). Ridership and the Built-Form Indicators: A Study from Ahmedabad Janmarg Bus Rapid Transit System (BRTS). Urban Science, 2(4), 95. https://doi.org/10.3390/urbansci2040095