Assessing Vulnerability to Heat: A Geospatial Analysis for the City of Philadelphia


1
MES, MPH, University of Pennsylvania, Philadelphia, PA 19104, USA
2
School of Medicine, University of Pennsylvania, 3620 Hamilton Walk, Philadelphia, PA 19104, USA
3
Mailman School of Public Health, Columbia University, 722 West 168th Street, New York, NY 10032, USA
*
Author to whom correspondence should be addressed.
Urban Sci. 2018, 2(2), 38; https://doi.org/10.3390/urbansci2020038
Submission received: 4 March 2018
/
Revised: 11 April 2018
/
Accepted: 19 April 2018
/
Published: 20 April 2018
Abstract
:Urban heat island (UHI) effect is an increasingly prominent health and environmental hazard that is linked to urbanization and climate change. Greening reduces the negative impacts of UHI; trees specifically are the most effective in ambient temperature reduction. This paper investigates vulnerability to heat in the Philadelphia, Pennsylvania and identifies where street trees can be planted as a public intervention. We used geospatial information systems (GIS) software to map a validated Heat Vulnerability Index to identify vulnerability at the block level. Using a high-low geospatial cluster analysis, we assessed where the City of Philadelphia can most effectively plant street trees to address UHI. This information was then aggregated to the neighborhood level for more effective citizen communication and policymaking. We identified that 26 of 48 (54%) neighborhoods that were vulnerable to heat also lacked street trees. Of 158 Philadelphia neighborhoods, 63 (40%) contained block groups of high vulnerability to either heat or street tree infrastructure. Neighborhoods that were ranked highest in both classifications were identified in two adjacent West Philadelphia neighborhoods. Planting street trees is a public service a city can potentially reduce the negative health impacts of UHI. GIS can be used to identify and recommend street tree plantings to reduce urban heat.
1. Introduction
Urban heat island (UHI) effect, which is a phenomenon that has been documented since the 1980s, has become increasingly more prominent as the world urbanizes and warms due to climate change [1,2,3,4]. UHI refers to the disproportionate rise in temperatures in urban areas due to the retention of heat by impervious surfaces, buildings, and roof surfaces. Average city temperatures during warm weather months are typically between 1–3 degrees Fahrenheit, or approximately 1 degree Celcius, warmer than rural areas, and can rise even more during extreme heat events [5,6]. When a city experiences a high-heat day, residents use more energy to run their air conditioning systems. UHI proves to be unique to tropical and subtropical cities, including American cities, like Philadelphia, which this study will explore, since the surrounding rural areas lack impervious surfaces that increase urban ambient temperatures and may have more greening that allows evapotranspiration and nighttime cooling to reduce the UHI effect [3,4,7,8]. Urban areas also tend to have less greenspace and foliage, both of which assist in promoting evapotranspiration, decreasing heat retention, and facilitating air movement, which leads to higher ambient temperatures as compared to rural areas [7,9,10]. It is important to note in desert areas, the urban ambient temperature tends to be lower than the surrounding desert, resulting in an effect that si called the oasis effect [11,12,13].
Heat-related mortality is not only the most prominent weather-related cause of mortality, but it is also one of the primary health concerns that is expected to increase with climate change [14]. Between 1980 and 2013, the city of Philadelphia saw a three-fold increase in “extreme heat events”, defined as three or more consecutive days where the 24-h daily mean temperature rose above a certain historical average high for July and August—in Philadelphia’s case, 81 degrees Fahrenheit or 27 degrees Celcius [6]. Keeping cities cool proves especially important as more people migrate to urban areas. By the year 2050, it is expected that more than two-thirds of the world’s population will live in urban areas, further highlighting urban-specific health issues as an important focus area for policymakers and healthcare officials. It is predicted that the effects of UHI will worsen as the Earth experiences the increased effects of climate change. Severe weather days are expected to increase in frequency and intensity, including extreme heat days. Additionally, overall average daily temperatures are also expected to rise, which can compound the effects of heat on individuals’ health [8]. Cities with large disparities in green infrastructure, wealth, and building quality will face heightened challenges
Negative health outcomes that have been attributed to UHI include dehydration, heat cramps, heat exhaustion, asthma and other pulmonary problems, exacerbated cardiovascular issues, non-fatal heat stroke, and heat-related mortality [15,16,17,18]. Yet, it may be difficult for public health practitioners and researchers to identify all of the associated health outcomes, since individuals that are suffering from heat-related symptoms may visit a variety of health facilities (e.g., hospital, emergency care or walk-in clinic, local physician), if they receive medical attention at all. Heat stroke and heat-related health impacts of UHI effect are not only under- and misdiagnosed in the United States, but are also disproportionally impact poor, minority, and vulnerable populations, including children, pregnant women, and older adults [19,20]. Health impacts that are related to UHI are also often overlooked due to the difficulty in classifying and recognizing their connection specifically to UHI effect [21]. Since medical diagnoses do not directly relate these health outcomes to heat or UHI effect, individual cities may be unable to accurately picture the impact of UHI on their residents.
Although it may be hard to classify the extent of UHI effects in individual cities, environmental specialists and public health practitioners can still implement initiatives to mitigate the effects. Because few studies address identifying heat vulnerability, especially at the city, neighborhood, and block scales, this study is important in establishing an approach to identify vulnerability and suggest intervention. By creating a roadmap, practitioners in the city of Philadelphia can more effectively and readily employ strategies to mitigate UHI. One method for achieving long-term urban sustainability and effectively eliminating the urban heat island effect is for a city to undergo a strategic greening plan. Ample greenspace and street trees can mitigate ambient temperatures, manage storm water runoff, and to improve air quality [22,23,24,25,26]. Greenspace has been positively linked to the reduction in temperatures in urban areas by a variety of researchers [26,27,28]. All types of vegetation, including grass, bushes, and trees, as well as water bodies contribute to cooling. Greening can reduce air temperatures by 44 °F, with street trees specifically providing the greatest cooling potential per unit area [26]. On a sunny day, the evapotranspiration of a tree cools with a power that is equal to 20–30 kW, which is comparable to that of more than 10 air-conditioning units [25]. Because streets make up such a large portion of urban form, the cooling effect of trees in streets can significantly impact the UHI effect, energy consumption, and air pollution [28]. A 10% increase in tree cover can reduce heating and cooling costs by an estimated $50 to $90 per dwelling unit as a result of increased shade, lower summertime air temperatures, and reduced neighborhood wind speeds once the trees mature. This can result in an estimated $402 in net present value of the services each tree provides [27]. Additionally, shading by street trees can provide a Sun Protection Factor (SPF) of 6 to 10, reducing exposure to ultraviolet (UV) radiation by 83% to 90% [29].
Despite the well-documented effects of street trees and greening practices for reducing the effects of UHI, many cities lack a systematic plan, funding, or support for implementation. We aimed to address this opportunity for the city of Philadelphia. The geographic area that is analyzed represents the entire city and county of Philadelphia, which is a city that experiences high heat and humidity during the summers. Philadelphia has a population of over 1.56 million, according to the 2016 Unites States (U.S.) Census; 13.6% of residents are Hispanic or Latino, and 44.2% of residents are black [30]. Like similar cities across the U.S., many blocks in the poorest neighborhoods of Philadelphia do not have a single tree or green patch. In 2008, at the baseline for the Greenworks plan, the city of Philadelphia’s comprehensive sustainability plan, there were 10,300 acres of greenspace. In the 2014 progress report, the city only had 10,457 acres of greenspace (a 1% increase over seven years). Although Philadelphia recently announced its policy that all public libraries could serve as cooling stations on hot days, the city still needs more long-term greening interventions to address the inequities that stem from heat vulnerability. Planting street trees is a public initiative that can effectively mitigate the health and environmental impacts of the UHI effect and must target areas most in need.
We aimed to provide the City of Philadelphia with a targeted systematic plan for planting street trees in neighborhoods at the highest risk for UHI health impacts. The nuances of health variation at the neighborhood level are well documented and demonstrate the importance of this micro-level analysis for effective health interventions [19,31,32,33,34,35,36,37,38]. Recently published articles have validated several methods of analysis to determine heat vulnerability from previously published indexes [9,20,37,39,40]. One analysis addressed heat vulnerability in London, but it did not make any recommendations for interventions to mitigate to UHI [6]. Another analysis from 2016 used such indices to determine vulnerability in Pittsburgh and estimated cooling station capacity, but did not address interventions for the long-term eradication of UHI [9]. This study proves to be the one of few studies to date that addresses the social determinants of heat vulnerability, specifically at a scale smaller than the city level. Though many studies address urban heat island effect in a variety of ways, such as through remote sensing and ambient temperatures, this study contributes to this body of research by using data from the U.S. Census, which is readily available to all U.S. cities, and delineates a publicly available intervention to address the long-term mitigation of UHI. Additionally, because urban ambient temperatures vary at the micro-scale, addressing block-level and neighborhood-level analyses represents a valuable contribution to the current literature. No known analysis of this type has been conducted in Philadelphia to help the city address its vulnerability to high heat issues, despite a history of extreme heat events and call for identifying and addressing urban ambient temperatures [32]. Additionally, a recent study used remote sensing technologies to specifically identify ambient temperatures, but to our knowledge, no methods have been used to address Philadelphia’s specific greening needs [41]. Using geospatial analysis and mapping techniques to identify clusters of increased vulnerability, we performed a city-wide and in-depth neighborhood analysis to visualize the locations of the greatest vulnerability across Philadelphia. This geospatial analysis provides a tool for strategically implementing street tree planting by the City of Philadelphia, thus maximizing potential for better use of resources, and effectively identifying those areas that are in the greatest need.
2. Methods
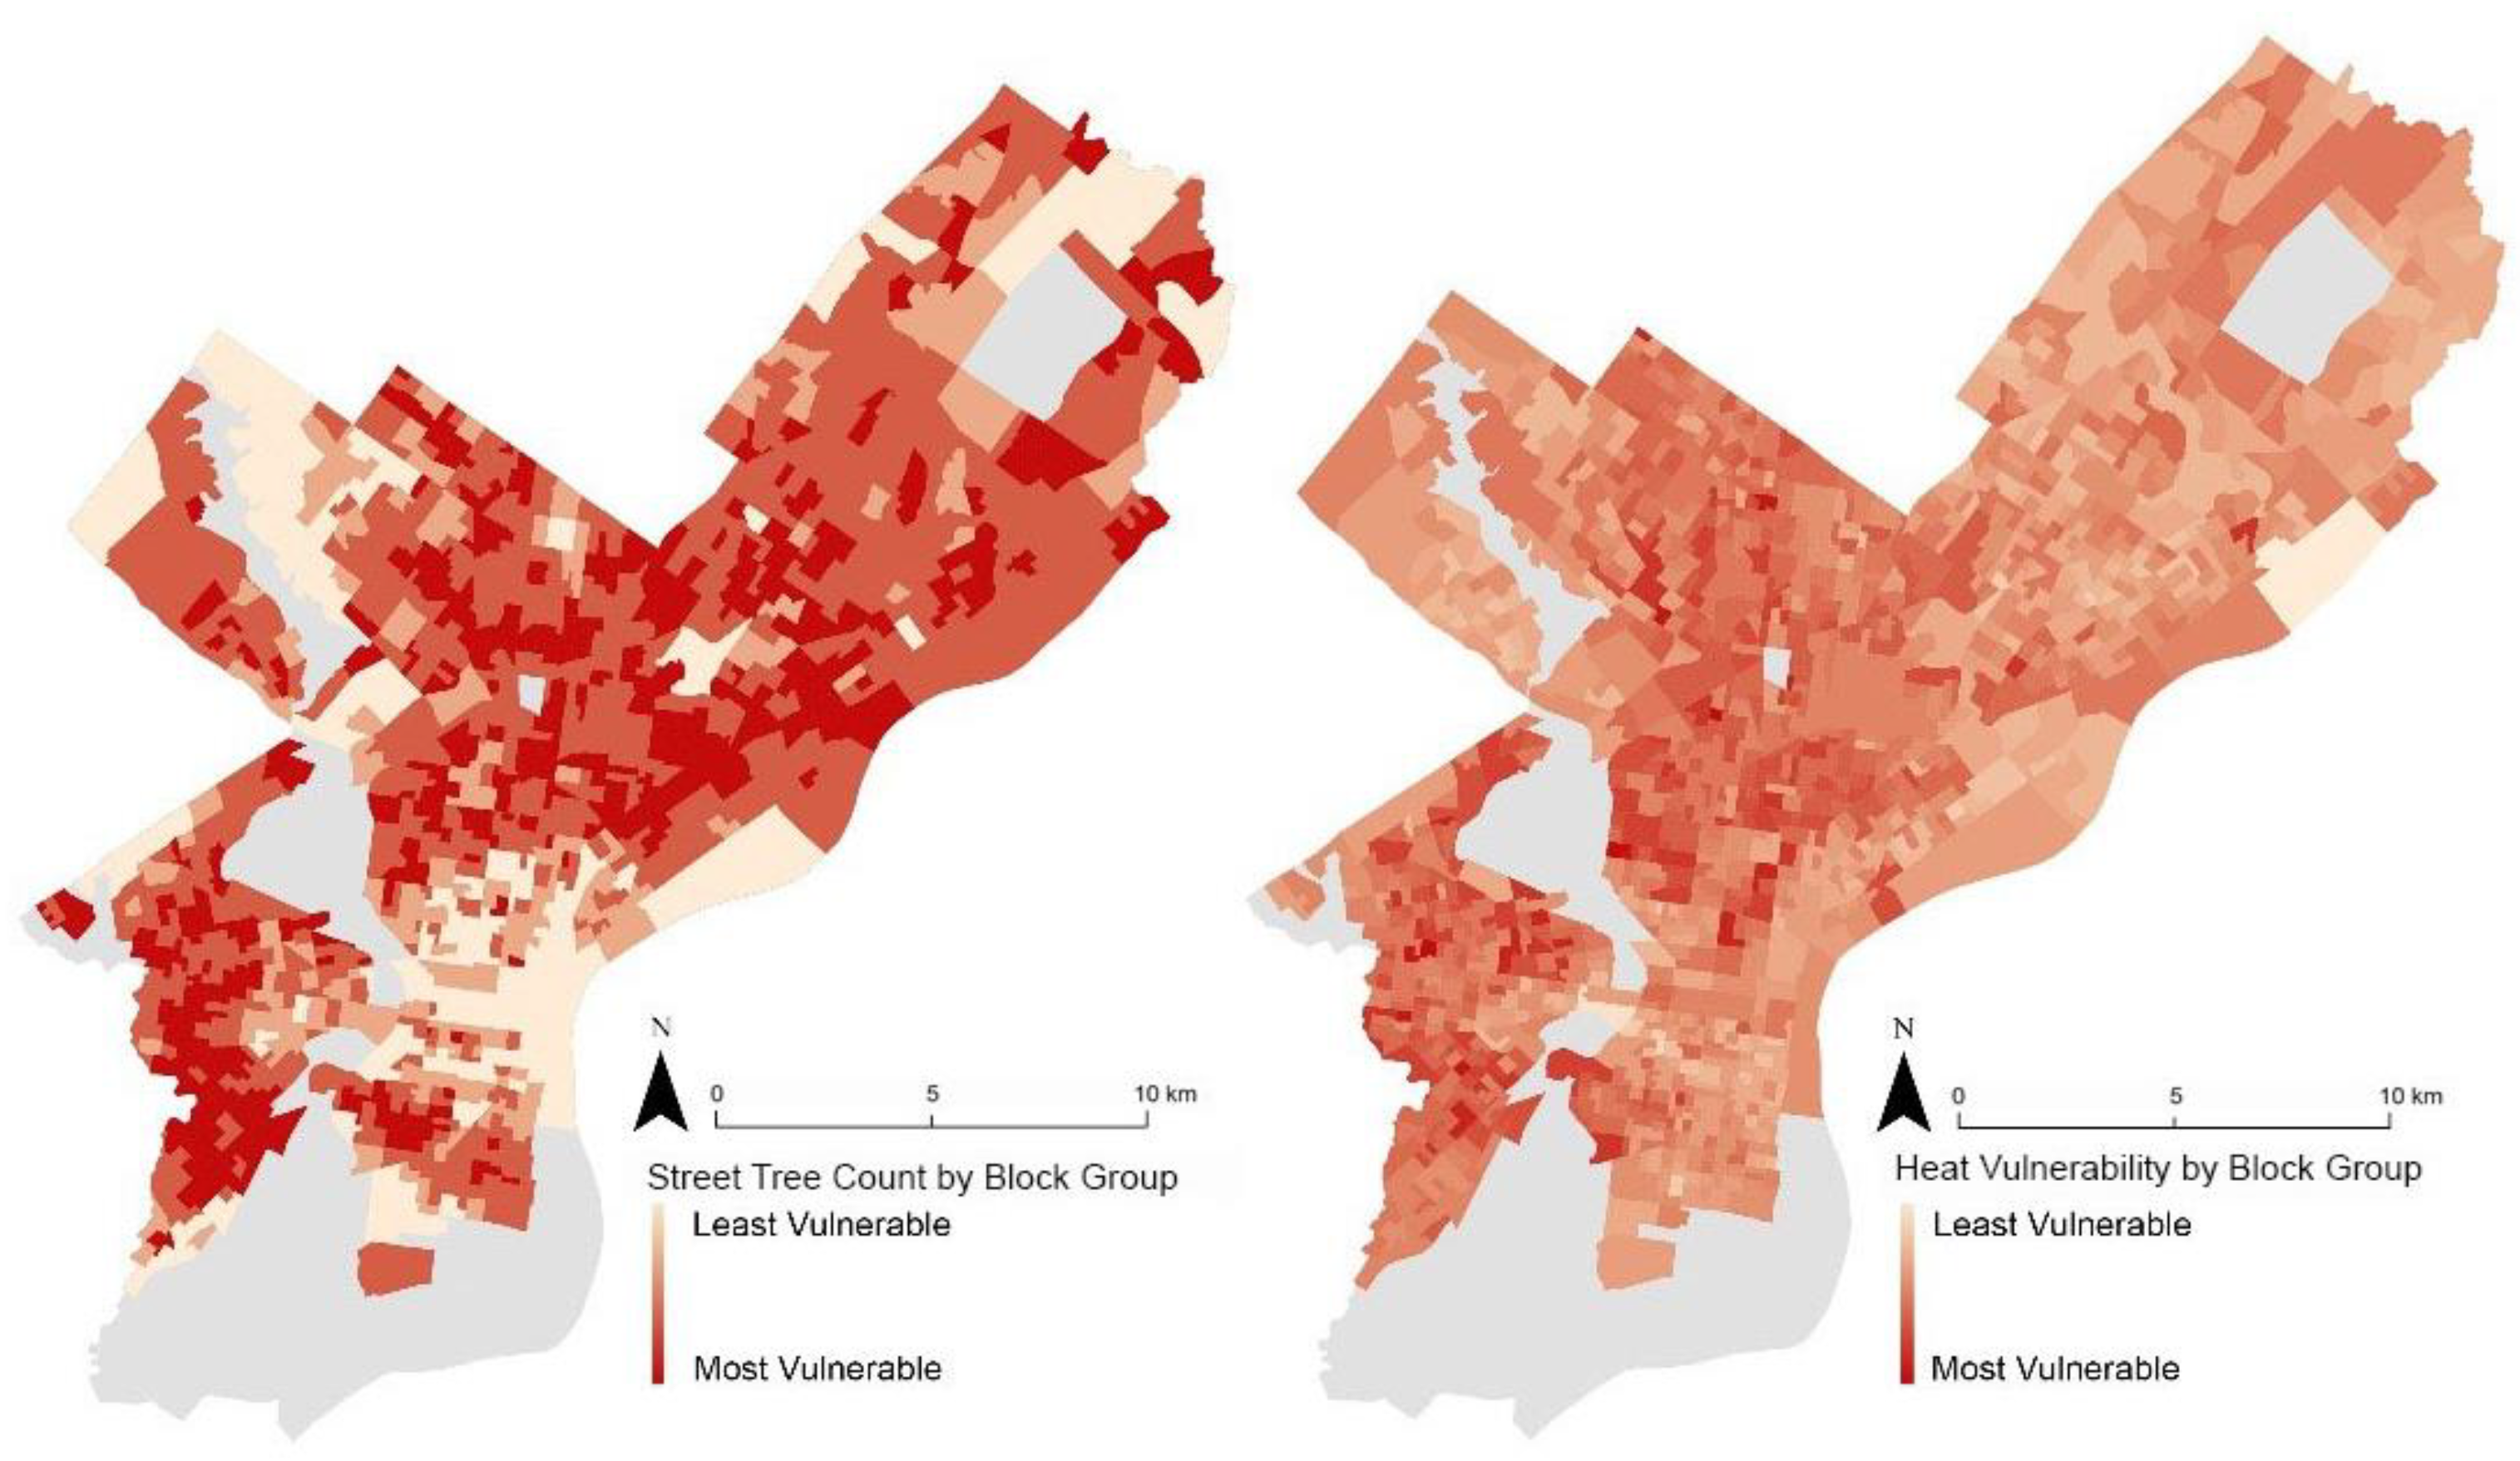
Our analysis utilized previously validated socio-economic heat vulnerability indices (HVIs) to identify the neighborhoods in Philadelphia that were the most vulnerable to heat-related health impacts at the time of the investigation [17,19,32]. The Heat Vulnerability Index (HVI), which was modeled after Reid et al., 2009, “Mapping Community Determinants of Heat Vulnerability”, aggregated the following indicators from data collected in the 2015 American Community Survey to determine vulnerability by block group in Philadelphia (see Figure 1): age (65 years and older), race (all not-white), socioeconomic status (poverty rate), educational attainment (less than high school), and living alone. These indicators were taken directly from the previously validated index and represent demographics of high risk populations, which include older adults, minority and low-SES pollutions, those will lower educational attainment, and those living alone. These indicators were determined to be statistically significant predictors of populations that are vulnerable to heat, which may result directly or indirectly from physical characteristics (such as age), lack of understanding of safe responses to high heat events, or lack of access to tools to successfully prevent a heat-related health event. Though Reid et al. also incorporated land cover, diabetes prevalence, and the use of air conditioning, such data could not be obtained at the block scale and were consequently not included in the study. Following the model of previous research, for each indicator, we first determined the percent by block group (e.g., percent of residents with below high school education level or percent non-white residents). Once that was obtained, the standard deviation for each indicator was used to stratify the data and to assign a value to each block group, ranging from one to five (See Figure 2). Once each indicator was assigned a score demonstrating lower than average, average, or above average vulnerability based on the standard deviation stratification, the values were summarized so that each block group had a cumulative score with the lowest possible value being five and the highest possible score being twenty-five; this cumulative vulnerability scoring system was based on the scoring system that was used by Reid et al. (See Figure 2). This created a comprehensive map of the city of Philadelphia, demonstrating vulnerability at the smallest level of granularity, as defined by the U.S. Census. Using data that identified the geographic location of all street trees in the city of Philadelphia, which were made publicly available by the Department of Parks and Recreation. Tree count by block group was identified, stratified, and assigned a value equivalent to the HVI to demonstrate areas of the most and least street trees and make further comparisons. This identified the prevalence of street trees by block group, and later by neighborhood, to determine which neighborhoods lacked this specific piece of green infrastructure that contributes to the mitigation of UHI.
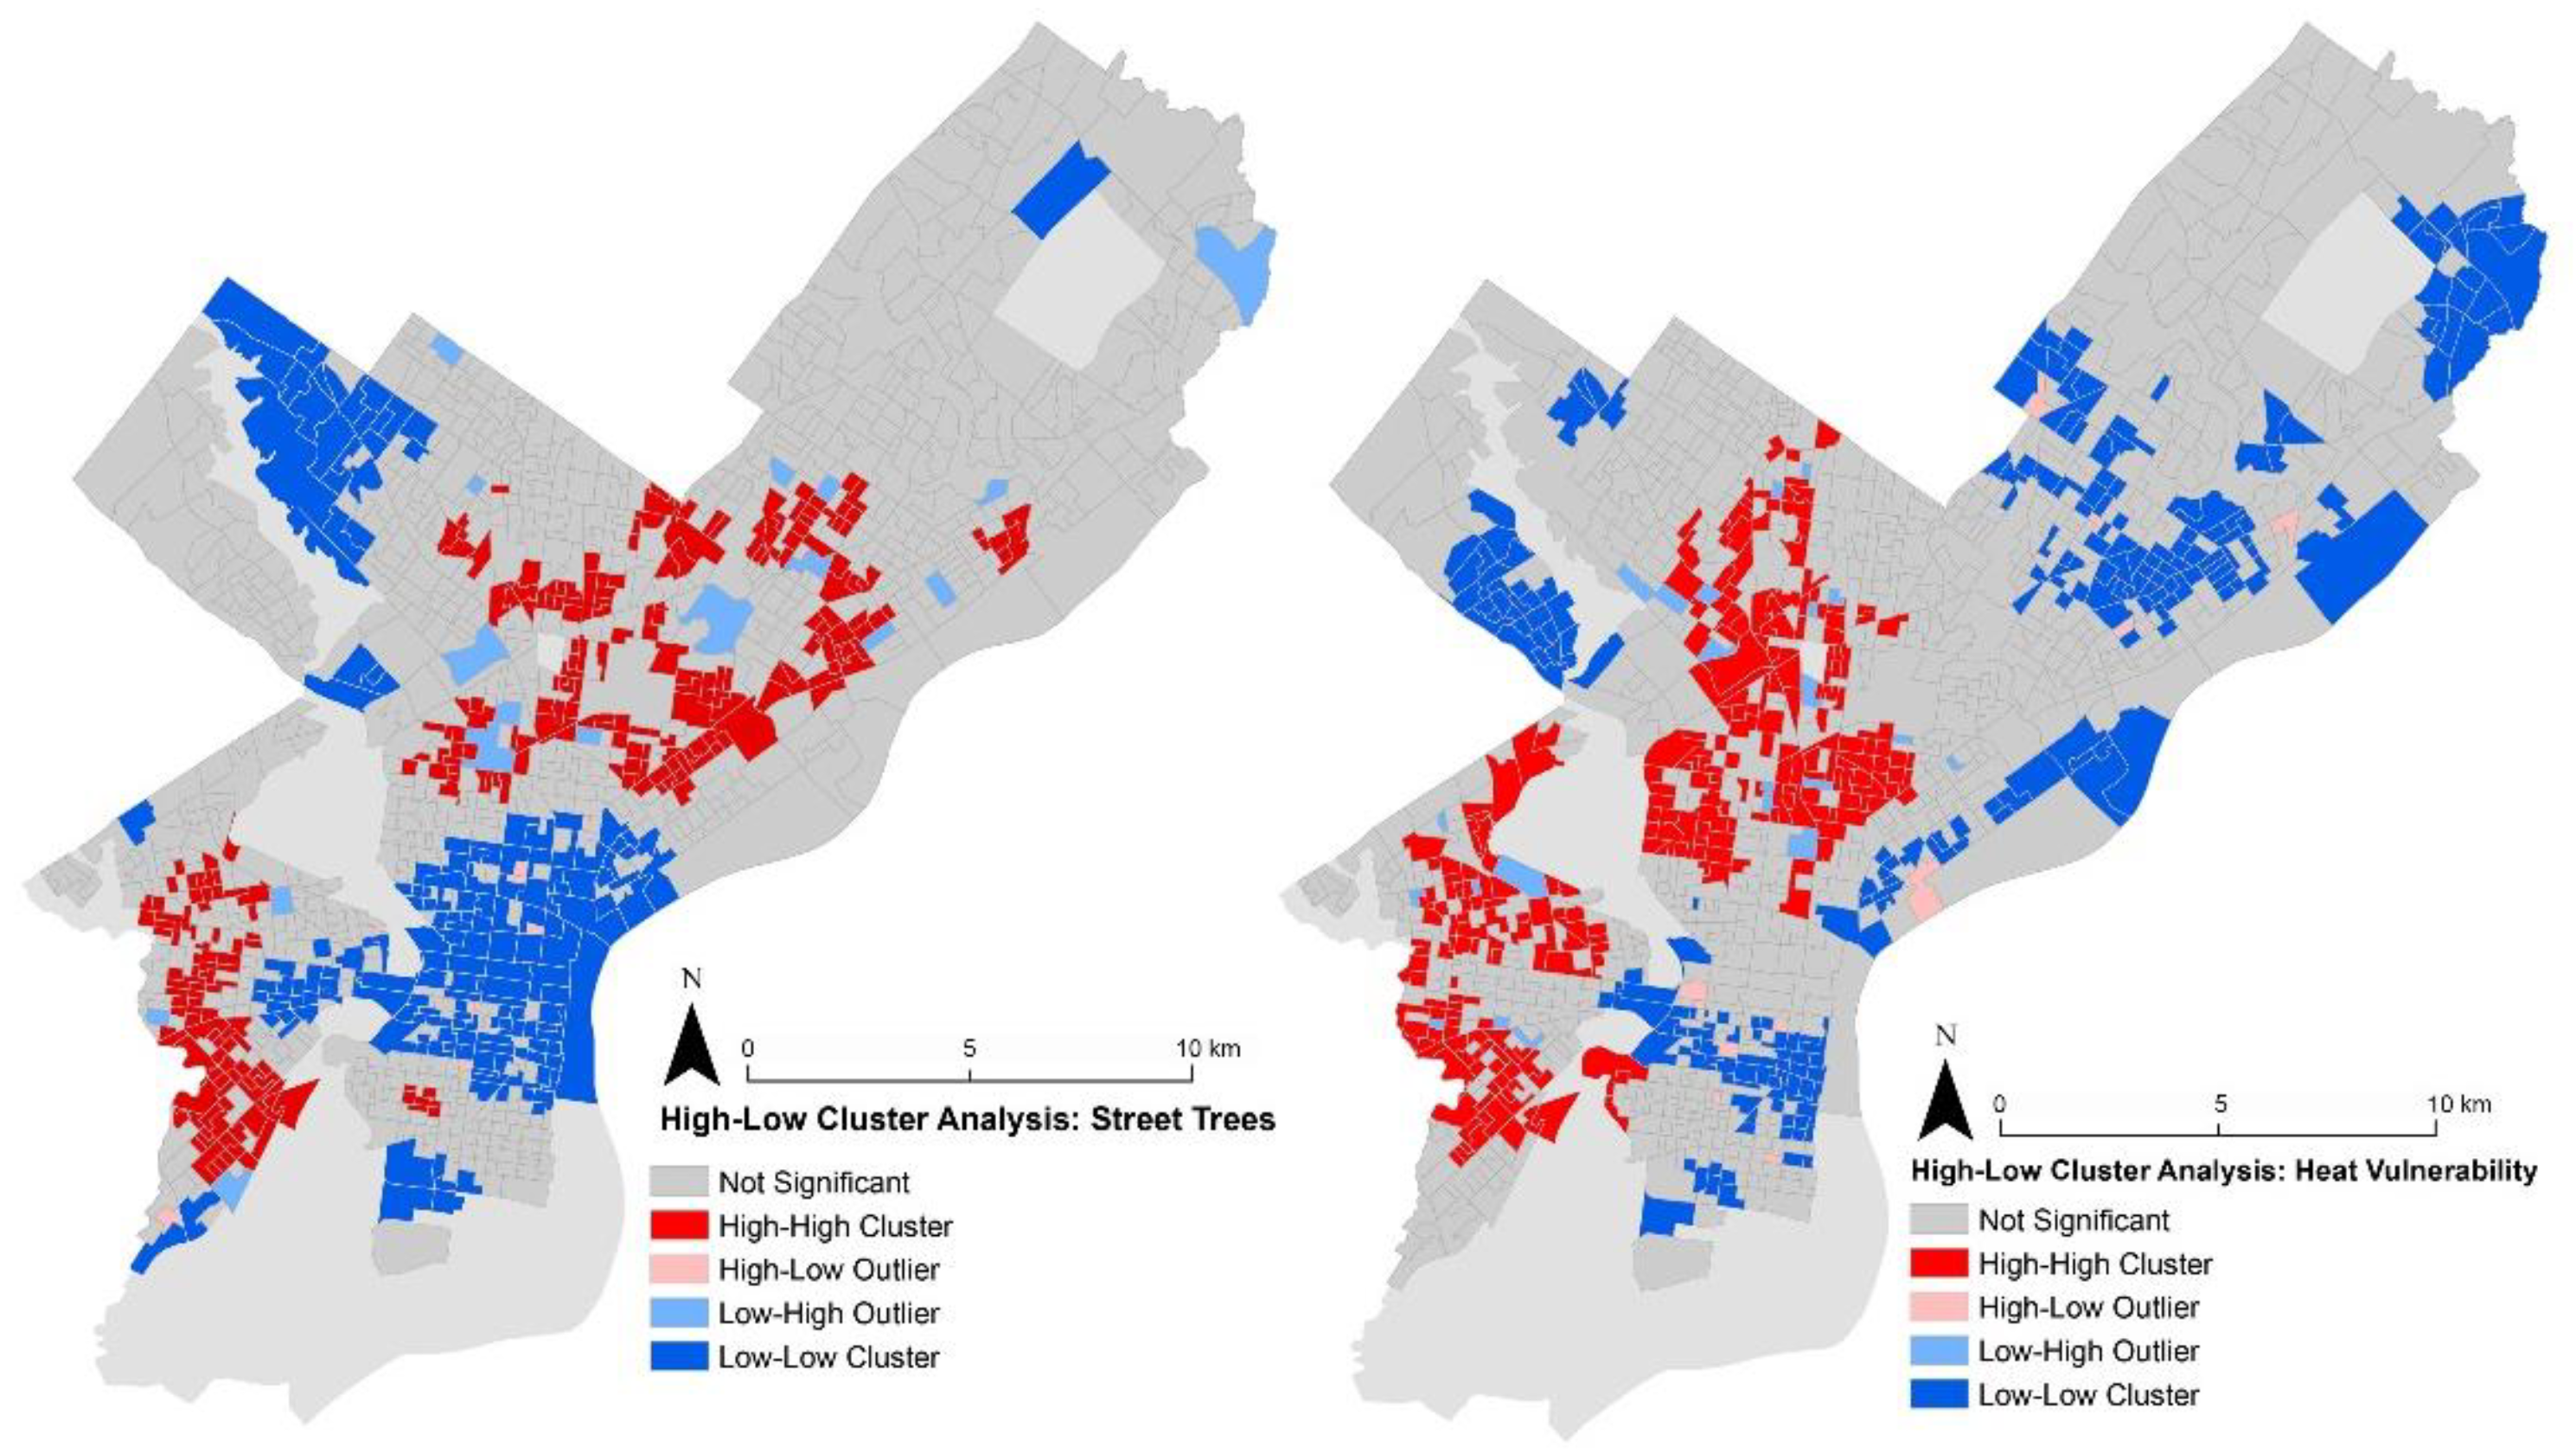
Following this initial step to determine heat vulnerability and tree infrastructure by block group, we conducted a spatial cluster and outlier analysis, Anselin Moran’s I, to identify “hotspot areas” for heat vulnerability and areas most in need of intervention, by statistically assessing whether the apparent similarity (a spatial clustering of either high or low values) or dissimilarity (a spatial outlier) is more pronounced than one would expect in a random distribution (see Figure 3). This technique allowed for us to identify block groups that were significantly more vulnerable to heat and heat-related health outcomes, and were located within neighborhoods that were also significantly more vulnerable to heat as compared to the whole city. This analysis resulted in the identification of four categories: high-high, high-low, low-high, and low-low vulnerability. A description of each output is as follows (Table 1):
These block groups were aggregated to the neighborhood level using neighborhood divisions that were given by the City of Philadelphia through the open data platform PASDA (Pennsylvania Spatial Data Access). The neighborhoods were ranked along a continuum of risk, with those having the greatest number of high risk blocks being designated as the highest risk neighborhoods for heat vulnerability (See Figure 4).
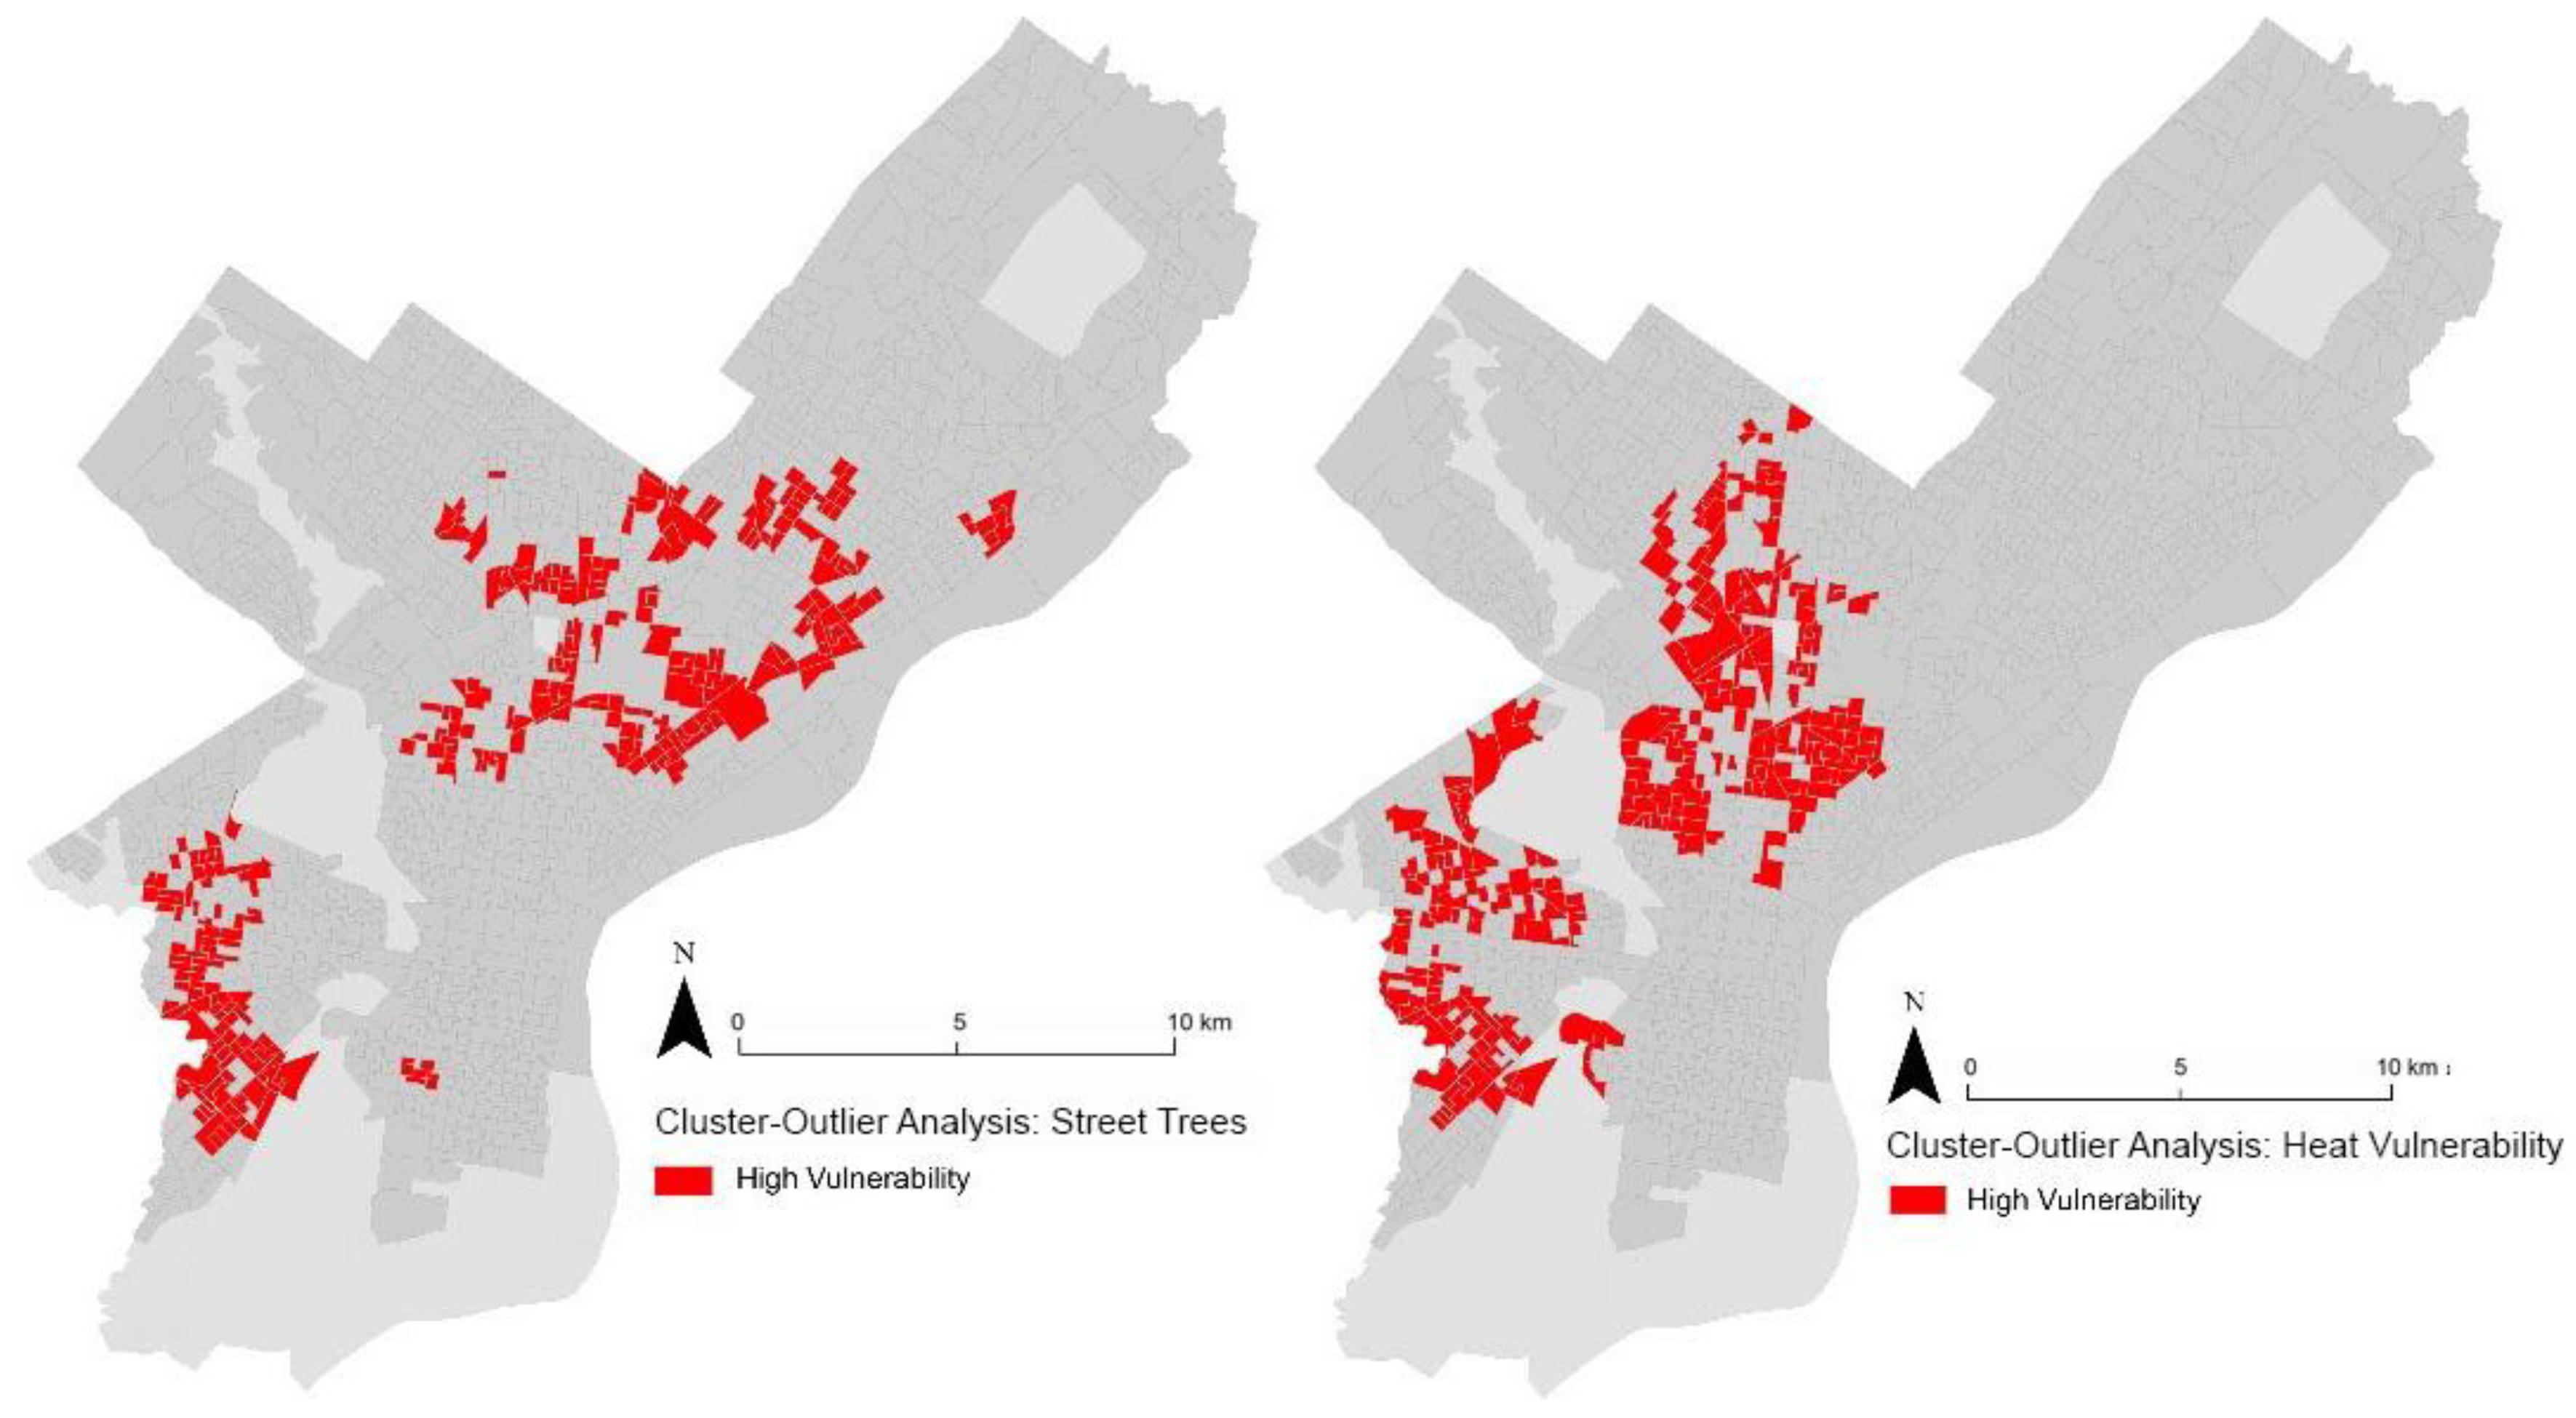
To determine the prevalence of street trees, we obtained the GPS coordinates of all street trees from the City of Philadelphia. Using the same procedures as with the HVI analysis, we counted the number of street trees per block group and used standard deviations to stratify the data into five categories, indicating significantly less or more street trees, and assigned a value accordingly. Anselin Moran’s I was again used to identify “hotspot areas” for street tree prevalence to demonstrate clusters of blocks with significantly less street tree infrastructure than other block groups. These blocks represent parts of the city of Philadelphia that should be further investigated for street tree planting, which is a tool that can faciliate the mitigation of urban ambient heat, among other usages. These block groups were also aggregated to the neighborhood level using neighborhood divisions given by the City of Philadelphia through the open data platform, Pennsylvania Spatial Data Access (PASDA). The neighborhoods were ranked along a continuum of risk, with those having the greatest number of high risk blocks being designated as the highest risk neighborhoods for heat vulnerability (See Figure 4).
3. Results
Out of 1323 block groups that were analyzed, 258 block groups were identified as high risk for heat vulnerability and 272 were identified as high risk for street tree vulnerability based on the high-low cluster analysis (See Figure 4). These 1323 block groups were geographically assigned to 158 Philadelphia neighborhoods. In cases where Census block groups crossed neighborhood boundaries, we assigned each to the neighborhood that contained the majority of the area in the block group, as determined by the position of the block group’s geographic centroid.
To determine heat vulnerability, the count of high vulnerability block groups that are residing within a neighborhood were added together, assigning a value for each neighborhood. Neighborhood values for heat vulnerability ranged from 0 to 18, based on the number of high vulnerability block groups residing within the neighborhood, meaning that the most vulnerable neighborhood contained 18 block groups of statistically defined high vulnerability. To determine tree infrastructure vulnerability, the count of street trees was obtained for each neighborhood. Neighborhood values for street tree vulnerability ranged from 0 to 21, based on the number of high vulnerability block groups residing within the neighborhood. The neighborhood with the fewest street trees contained 21 block groups of “high vulnerability” blocks, meaning that these blocks had significantly fewer trees as compared to the rest of Philadelphia. Combined neighborhood scores ranged from 0 to 37 (See Figure 5). Based on a high-low cluster analysis, 48 out of 158 (30%) neighborhoods in Philadelphia have at least one neighborhood being considered high-risk for heat vulnerability, while 40 out of 158 (25%) neighborhoods have at least one neighborhood that is considered high risk for street tree vulnerability. In total, 63 of 158 (40%) neighborhoods contain block groups of high vulnerability to either heat or street tree infrastructure.
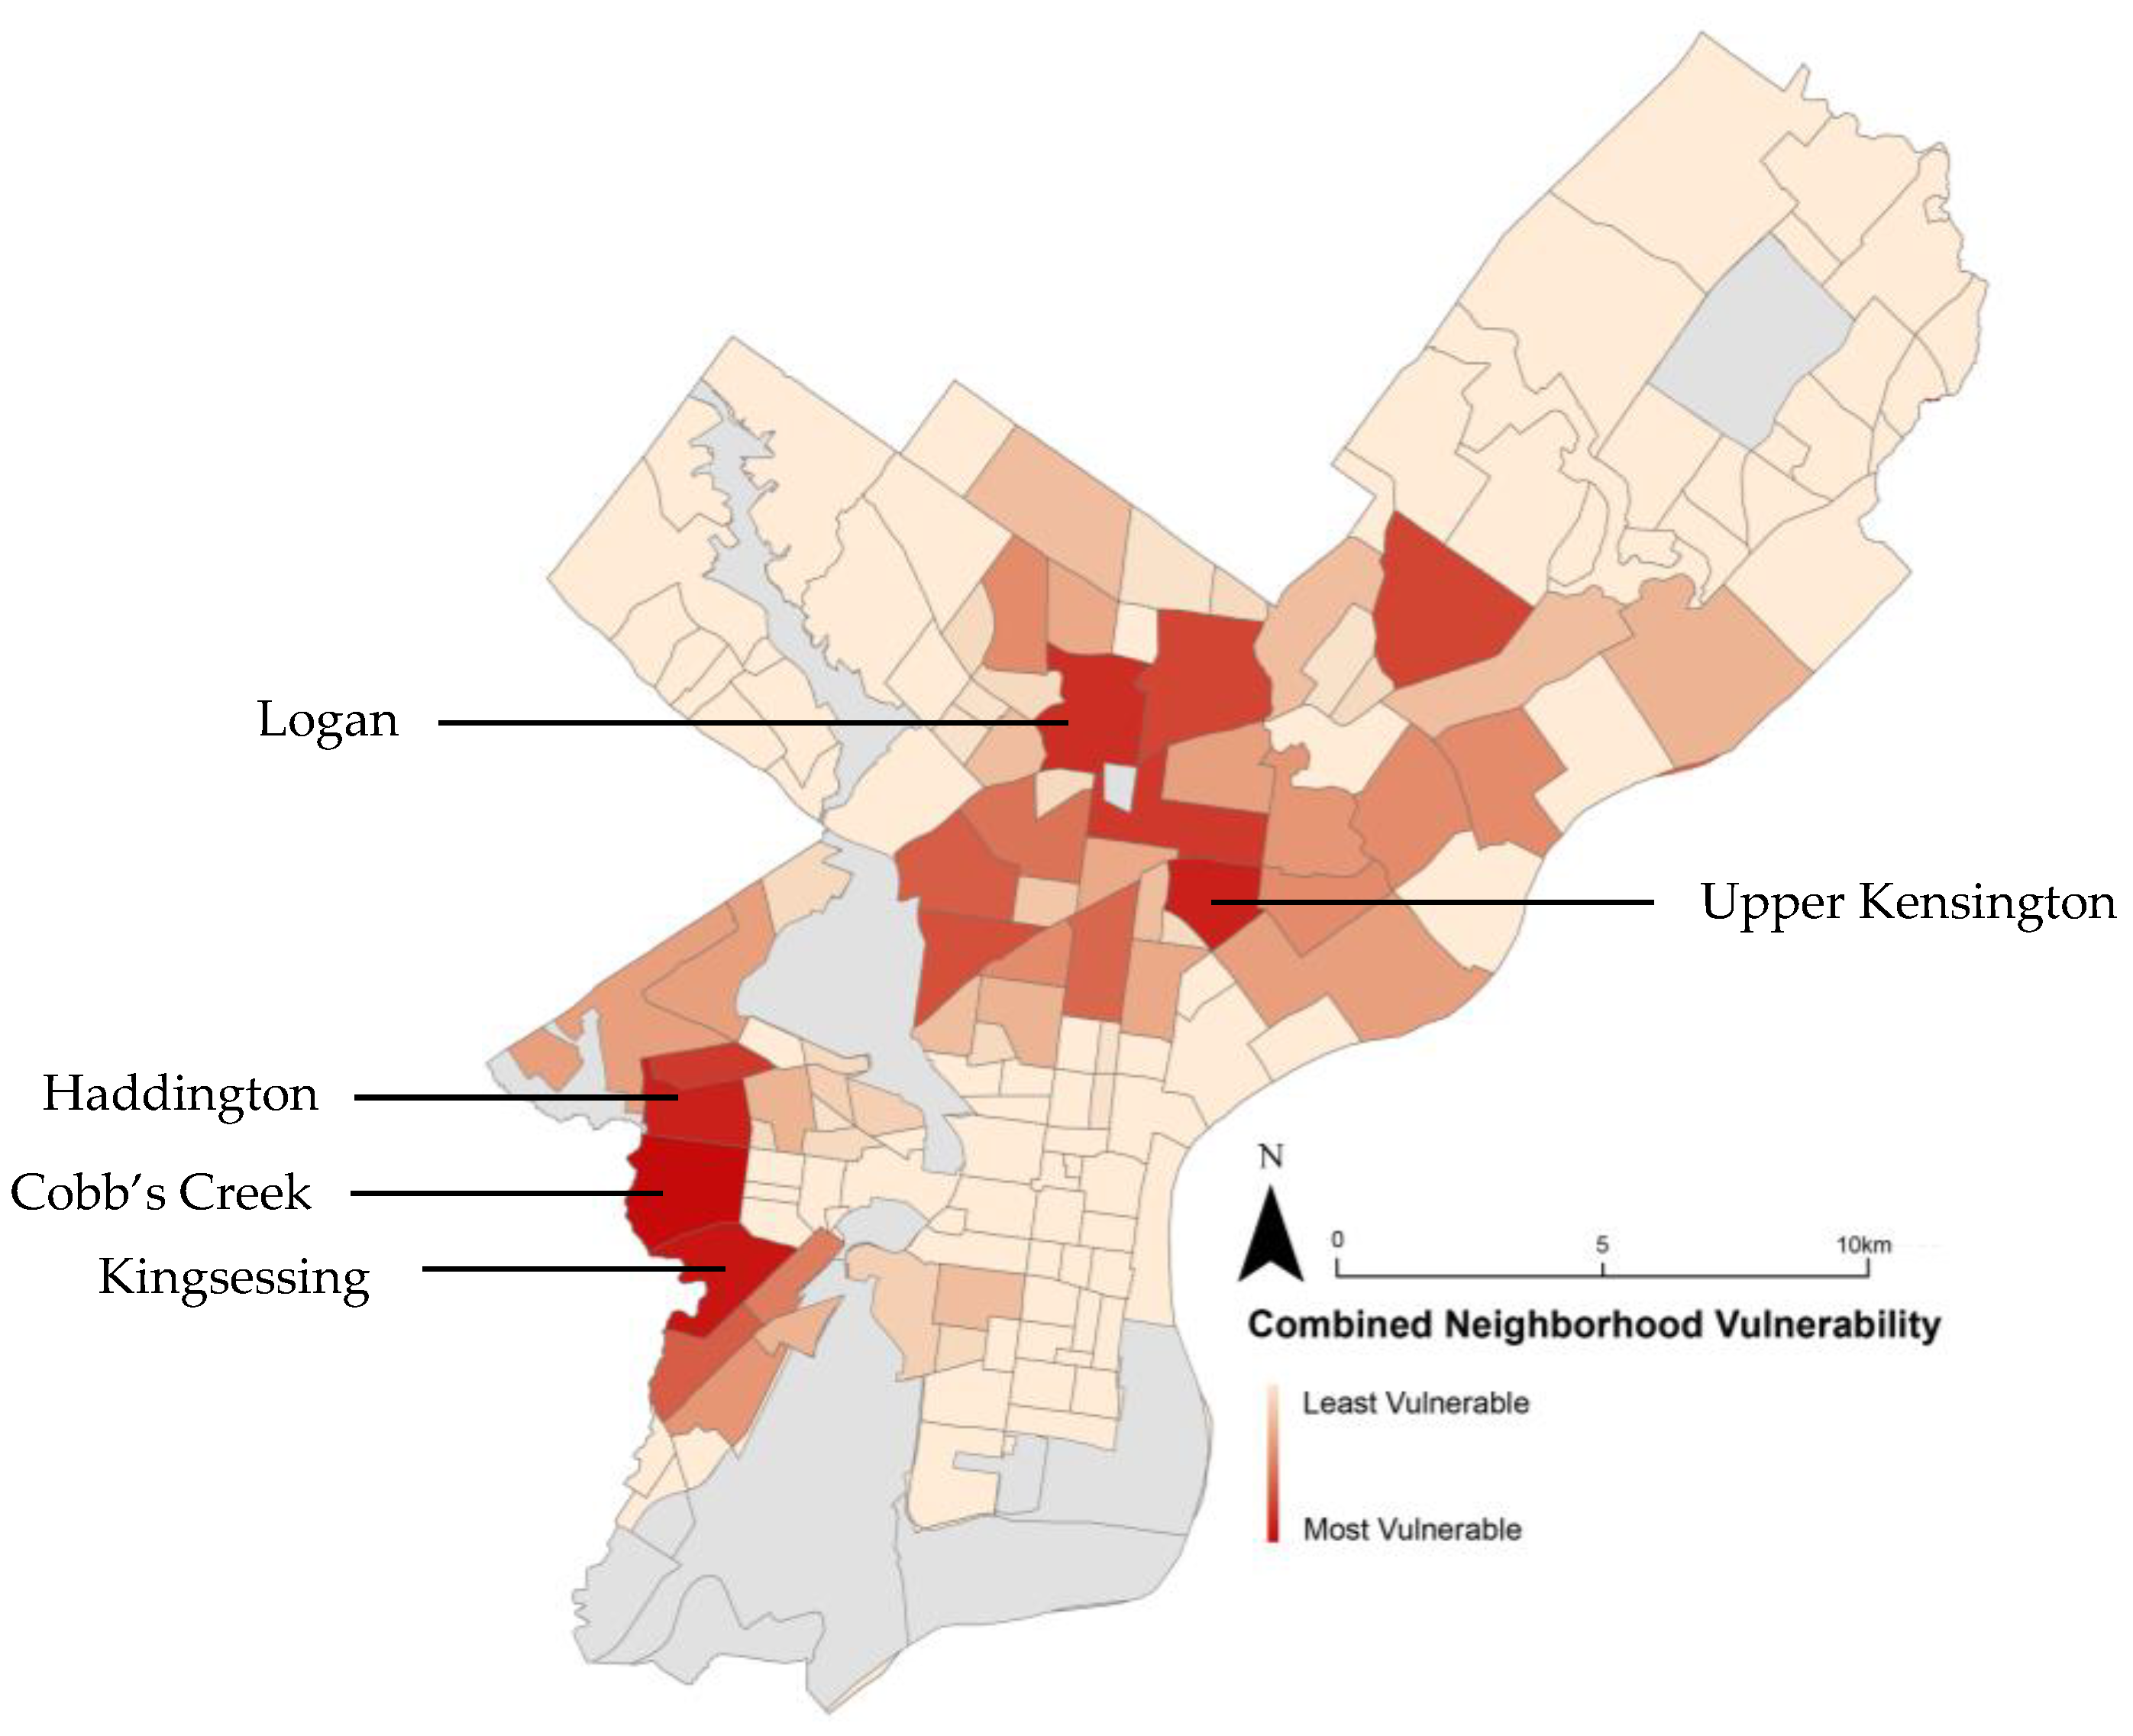
As expected, vulnerable neighborhoods tended to cluster together. As seen in Pittsburgh, in the only other study to apply a heat vulnerability index at the city level, we found the most vulnerable blocks in Philadelphia to be located in adjacent neighborhoods, but at a much higher prevalence of vulnerability than in Pittsburgh [9]. Both West and North Philadelphia experience higher vulnerability to heat and generally lack tree infrastructure as compared to other parts of the city. The five most vulnerable neighborhoods in Philadelphia based on the heat vulnerability index were identified as Kingsessing, Logan, Cobb’s Creek, Strawberry Mansion, and Upper Kensington (See Figure 5). The five most vulnerable neighborhoods lacking street trees were identified as Kingsessing, Cobb’s Creek, Oxford Circle, Wissinoming, and Olney (See Figure 5). The neighborhoods that ranked the highest in combining both indices were identified as Kingsessing and Cobb’s Creek, two adjacent neighborhoods in West Philadelphia (See Figure 6).
4. Discussion
This analysis identified neighborhoods in Philadelphia that may be at greatest risk for UHI effect due to increased heat vulnerability and a lack of street trees for cooling. So noted, these neighborhoods are optimal locations for street tree plantings and heat-related interventions. The findings from this analysis can also facilitate more effective decision- and policy-making by the City of Philadelphia. With a basis on demographic data to identify vulnerability, HVI can also be updated to assess those that are most vulnerable to UHI effect at any point in time. However, because little epidemiological data on UHI-related health impacts exists, this analysis cannot confirm a causal relationship between HVI and heat vulnerability. Street tree data is an effective proxy for environmental factors that are contributing to cooling, but it is not exclusive as it does not account for all trees; other forms of greenspace and built environment infrastructures also contribute. Accordingly, this measure can drive municipal street tree-planting programs, but falls short in recommending other interventions that aid in cooling. Finally, while robust, the method to exclusively assign block groups to a single neighborhood reduces precision in the final neighborhood results.
This type of analysis opens the door for assessing other key built environment indicators that can facilitate cooling, such as parks, urban gardens, other types of greenspace, cool roofs, and cooling stations or spray grounds. However, this study is not without limitations. Assessing vulnerability does not demonstrate a causal relationship between heat events and health outcomes, or the impact of street trees as an intervention to reduce the overall ambient temperature. The street tree data, which were publically available through the City of Philadelphia, may not have comprehensively reflected the number of trees in the city, nor did it specify the type of tree or the amount of cover that it provides. Thus, the presence of trees alone may not prove to be the strongest indicator for reduced risk. The heat vulnerability index, which was modeled after Reid et al., “Social Determinants of Heat Vulnerability”, did not include three components of the original index. Because data about Philadelphia land cover, diabetes prevalence, and use of air conditioning were not collected, or available at the right scale in some instances, these variables were not included in the study. Lastly, this study does not assert that simply planting street trees will effective reduce vulnerability to urban ambient heat, but rather is one piece of a complex urban puzzle that contributes to city cooling. More research must be done to assess vulnerability at the most granular level possible, factoring in more elements that relate to UHI to improve on the work of this study. Despite these limitations, this method presents a versatile tool that can be used to assess heat vulnerability on a variety of scales in different cities that are dealing with the UHI effect. By interchanging data on different types of green infrastructure, or other cooling techniques, like cool roofs, further studies can bolster the repository of tools for practitioners to combat urban ambient heat. Further, the addition of temperature data can strengthen the analysis and deepen the effectiveness of future studies.
5. Conclusions
As previous research has demonstrated, the UHI effect disproportionately impacts vulnerable populations in cities, and as these trends continue, green infrastructure will be one critical piece of urban interventions to reduce ambient temperatures. Though much research has been done on urban heat island through remote sensing and other scientific technologies, less research on demographic vulnerability to heat at the city, neighborhood, and block scales has been conducted. Although street trees have been proven to effectively reduce ambient temperatures and mitigate the impacts of UHI, city municipalities often do not strategically plan interventions to increase this resource. This study provides tangible research that allows for practitioners to more effectively target street tree interventions to those communities who need it most and demonstrates Philadelphia’s vulnerability to heat at the block and neighborhood level, as well as street tree infrastructure, as a toolkit for the city to address UHI and plant more street trees.
Acknowledgments
This research was completed as part of a graduate thesis. No funding was received in support of this work.
Author Contributions
Laura Barron and Charles Branas conceived and designed the experiments; Laura Barron performed the experiments and data analysis. Laura Barron and Dominique Ruggieri wrote the manuscript.
Conflicts of Interest
The authors declare no conflict of interest.
References
- Arnfield, A.J. Two decades of urban climate research: A review of turbulence, exchanges of energy and water, and the urban heat island. Int. J. Climatol. 2003, 23, 1–26. [Google Scholar] [CrossRef]
- Clarke, J.F. Some effects of the urban structure on heat mortality. Environ. Res. 1972, 5, 93–104. Available online: https://www.sciencedirect.com/science/article/pii/0013935172900230 (accessed on 4 February 2017). [CrossRef]
- Karl, T.R.; Jones, P.D. Urban bias in area-averaged surface air temperature trends. Bull. Am. Meteorol. Soc. 1989, 70, 265–270. Available online: https://journals.ametsoc.org/doi/abs/10.1175/1520-0477%281989%29070%3C0265%3AUBIAAS%3E2.0.CO%3B2 (accessed on 1 February 2017). [CrossRef]
- Oke, T.R. The energetic basis of the urban heat island. Q. J. R. Meteorol. Soc. 1982, 108, 1–24. Available online: http://onlinelibrary.wiley.com/doi/10.1002/qj.49710845502/full (accessed on 4 February 2017). [CrossRef]
- Reid, C.E.; Mann, J.K.; Alfasso, R.; English, P.B.; King, G.C.; Lincoln, R.A.; Margolis, H.G.; Rubado, D.J.; Sabato, J.E.; West, N.L.; et al. Evaluation of a heat vulnerability index on abnormally hot days: An environmental public health tracking study. Environ. Health Perspect. 2012, 120, 715. Available online: https://www.ncbi.nlm.nih.gov/pmc/articles/PMC3346770/ (accessed on 30 January 2017). [CrossRef] [PubMed]
- Weber, S.; Sadoff, N.; Zell, E.; de Sherbinin, A. Policy-relevant indicators for mapping the vulnerability of urban populations to extreme heat events: A case study of Philadelphia. Appl. Geogr. 2015, 63, 231–243. Available online: https://www.sciencedirect.com/science/article/pii/S014362281500171X (accessed on 16 March 2018). [CrossRef]
- Cartalis, C.; Synodinou, A.; Proedrou, M.; Tsangrassoulis, A.; Santamouris, M. Modifications in energy demand in urban areas as a result of climate changes: An assessment for the southeast Mediterranean region. Energy Convers. Manag. 2001, 42, 1647–1656. Available online: https://www.sciencedirect.com/science/article/pii/S0196890400001564 (accessed on 30 January 2017). [CrossRef]
- Luber, G.; McGeehin, M. Climate change and extreme heat events. Am. J. Prev. Med. 2008, 35, 429–435. Available online: http://www.ajpmonline.org/article/S0749-3797(08)00686-7/abstract (accessed on 4 February 2017). [CrossRef] [PubMed]
- Bradford, K.; Abrahams, L.; Hegglin, M.; Klima, K. A heat vulnerability index and adaptation solutions for Pittsburgh, Pennsylvania. Environ. Sci. Technol. 2015, 49, 11303–11311. Available online: https://pubs.acs.org/doi/abs/10.1021/acs.est.5b03127 (accessed on 30 January 2017). [CrossRef] [PubMed]
- Goward, S.N. Thermal behavior of urban landscapes and the urban heat island. Phys. Geogr. 1981, 2, 19–33. Available online: http://www.tandfonline.com/doi/abs/10.1080/02723646.1981.10642202 (accessed on 1 February 2017).
- Fan, C.; Myint, S.W.; Kaplan, S.; Middel, A.; Zheng, B.; Rahman, A.; Huang, H.P.; Brazel, A.; Blumberg, D.G. Understanding the Impact of Urbanization on Surface Urban Heat Islands—A Longitudinal Analysis of the Oasis Effect in Subtropical Desert Cities. Remote Sens. 2017, 9, 672. Available online: https://www.mdpi.com/2072-4292/9/7/672/htm (accessed on 26 February 2018). [CrossRef]
- Lazzarini, M.; Marpu, P.R.; Ghedira, H. Temperature-land cover interactions: The inversion of urban heat island phenomenon in desert city areas. Remote Sens. Environ. 2013, 130, 136–152. Available online: https://www.sciencedirect.com/science/article/pii/S0034425712004312 (accessed on 26 February 2018). [CrossRef]
- Rahman, M.T.; Aldosary, A.S.; Mortoja, M.G. Modeling future land cover changes and their effects on the land surface temperatures in the Saudi Arabian eastern coastal city of Dammam. Land 2017, 6, 36. Available online: https://www.mdpi.com/2073-445X/6/2/36/htm (accessed on 26 February 2018). [CrossRef]
- Johnson, D.P.; Wilson, J.S. The socio-spatial dynamics of extreme urban heat events: The case of heat-related deaths in Philadelphia. Appl. Geogr. 2009, 29, 419–434. Available online: https://www.sciencedirect.com/science/article/pii/S0143622808000763 (accessed on 4 February 2017). [CrossRef]
- Balbus, J.M.; Malina, C. Identifying vulnerable subpopulations for climate change health effects in the United States. J. Occup. Environ. Med. 2009, 51, 33–37. [Google Scholar] [CrossRef] [PubMed]
- Bennett, J.E.; Blangiardo, M.; Fecht, D.; Elliott, P.; Ezzati, M. Vulnerability to the mortality effects of warm temperature in the districts of England and Wales. Nat. Clim. Chang. 2014, 4, 269–273. [Google Scholar] [CrossRef]
- Cutter, S.L.; Boruff, B.J.; Shirley, W.L. Social vulnerability to environmental hazards. Soc. Sci. Q. 2003, 84, 242–261. Available online: http://onlinelibrary.wiley.com/doi/10.1111/1540-6237.8402002/full (accessed on 1 February 2017). [CrossRef]
- Kovats, R.S.; Hajat, S. Heat stress and public health: A critical review. Annu. Rev. Public Health 2008, 29, 41–55. Available online: https://www.annualreviews.org/doi/abs/10.1146/annurev.publhealth.29.020907.090843#abstractSection (accessed on 1 February 2017). [CrossRef] [PubMed]
- Harlan, S.L.; Brazel, A.J.; Prashad, L.; Stefanov, W.L.; Larsen, L. Neighborhood microclimates and vulnerability to heat stress. Soc. Sci. Med. 2006, 63, 2847–2863. Available online: https://www.sciencedirect.com/science/article/pii/S027795360600373X?via%3Dihub (accessed on 30 January 2017). [CrossRef] [PubMed]
- Reid, C.E.; O’Neill, M.S.; Gronlund, C.J.; Brines, S.J.; Brown, D.G.; Diez-Roux, A.V.; Schwartz, J. Mapping community determinants of heat vulnerability. Environ. Health Perspect. 2009, 117, 1730. Available online: https://www.ncbi.nlm.nih.gov/pmc/articles/PMC2801183/ (accessed on 30 January 2017). [CrossRef] [PubMed] [Green Version]
- McGeehin, M.A.; Mirabelli, M. The potential impacts of climate variability and change on temperature-related morbidity and mortality in the United States. Environ. Health Perspect. 2001, 109 (Suppl. 2), 185. Available online: https://www.ncbi.nlm.nih.gov/pmc/articles/PMC1240665/ (accessed on 1 February 2017). [CrossRef] [PubMed]
- Ballinas, M.; Barradas, V.L. The urban tree as a tool to mitigate the urban heat island in Mexico city: A simple phenomenological model. J. Environ. Qual. 2016, 45, 157–166. [Google Scholar] [CrossRef] [PubMed]
- Bowler, D.E.; Buyung-Ali, L.; Knight, T.M.; Pullin, A.S. Urban greening to cool towns and cities: A systematic review of the empirical evidence. Landsc. Urban Plan. 2010, 97, 147–155. [Google Scholar] [CrossRef]
- Jenerette, G.D.; Harlan, S.L.; Stefanov, W.L.; Martin, C.A. Ecosystem services and urban heat riskscape moderation: Water, green spaces, and social inequality in Phoenix, USA. Ecol. Appl. 2011, 21, 2637–2651. Available online: http://onlinelibrary.wiley.com/doi/10.1890/10-1493.1/full (accessed on 4 February 2017). [CrossRef] [PubMed]
- Kleerekoper, L.; Van Esch, M.; Salcedo, T.B. How to make a city climate-proof, addressing the urban heat island effect. Resour. Conserv. Recycl. 2012, 64, 30–38. Available online: https://www.sciencedirect.com/science/article/pii/S0921344911001303 (accessed on 1 February 2017). [CrossRef]
- Rosenzweig, C.; Solecki, W.; Slosberg, R. Mitigating New York City’s heat island with urban forestry, living roofs, and light surfaces. Bull. Am. Meterol. Soc. 2009, 90, 1297–1313. Available online: https://journals.ametsoc.org/doi/abs/10.1175/2009BAMS2308.1 (accessed on 4 February 2017). [CrossRef]
- McPherson, E.G.; Nowak, D.; Heisler, G.; Grimmond, S.; Souch, C.; Grant, R.; Rowntree, R. Quantifying urban forest structure, function, and value: The Chicago Urban Forest Climate Project. Urban Ecosyst. 1997, 1, 49–61. Available online: https://link.springer.com/article/10.1023/A:1014350822458 (accessed on 1 February 2017). [CrossRef]
- Shashua-Bar, L.; Hoffman, M.E. Vegetation as a climatic component in the design of an urban street: An empirical model for predicting the cooling effect of urban green areas with trees. Energy Build. 2000, 31, 221–235. Available online: https://www.sciencedirect.com/science/article/pii/S0378778899000183 (accessed on 1 February 2017). [CrossRef]
- Synnefa, A.; Dandou, A.; Santamouris, M.; Tombrou, M.; Soulakellis, N. An energy efficient solution to mitigate heat islands and reduce cooling energy loads. In Proceedings of the International Conference of Sustainable Buildings, Singapore, 15–17 March 2007. [Google Scholar]
- US Census Bureau. Available online: https://www.census.gov/quickfacts/fact/table/philadelphiacountypennsylvania/PST040217 (accessed on 28 February 2018).
- Diez Roux, A.V. Investigating neighborhood and area effects on health. Am. J. Public Health 2001, 91, 1783–1789. Available online: http://ajph.aphapublications.org/doi/abs/10.2105/AJPH.91.11.1783 (accessed on 1 February 2017). [CrossRef] [PubMed]
- Hondula, D.M.; Davis, R.E.; Leisten, M.J.; Saha, M.V.; Veazey, L.M.; Wegner, C.R. Fine-scale spatial variability of heat-related mortality in Philadelphia County, USA, from 1983–2008: A case-series analysis. Environ. Health 2012, 11, 16. Available online: https://ehjournal.biomedcentral.com/articles/10.1186/1476-069X-11-16 (accessed on 1 February 2017). [CrossRef] [PubMed]
- Tomlinson, C.J.; Chapman, L.; Thornes, J.E.; Baker, C.J. Including the urban heat island in spatial heat health risk assessment strategies: A case study for Birmingham, UK. Int. J. Health Geogr. 2011, 10, 42. Available online: https://ij-healthgeographics.biomedcentral.com/articles/10.1186/1476-072X-10-42 (accessed on 30 January 2017). [CrossRef] [PubMed] [Green Version]
- Rinner, C.; Patychuk, D.; Bassil, K.; Nasr, S.; Gower, S.; Campbell, M. The role of maps in neighborhood-level heat vulnerability assessment for the city of Toronto. Cartogr. Geogr. Inf. Sci. 2010, 37, 31–44. Available online: http://www.tandfonline.com/doi/abs/10.1559/152304010790588089 (accessed on 4 February 2017). [CrossRef]
- Sarajevs, V. Health Benefits of Street Trees; The Research Agency of the Forestry Commission: Bristol, UK, 2011. Available online: https://www.forestry.gov.uk/pdf/Health_Benefits_of_Street_Trees_29June2011.pdf/$FILE/Health_Benefits_of_Street_Trees_29June2011.pdf (accessed on 4 February 2017).
- Taha, H. Urban climates and heat islands: Albedo, evapotranspiration, and anthropogenic heat. Energy Build. 1997, 25, 99–103. Available online: https://www.sciencedirect.com/science/article/pii/S0378778896009991 (accessed on 4 February 2017). [CrossRef]
- Wolf, T.; McGregor, G. The development of a heat wave vulnerability index for London, United Kingdom. Weather Clim. Extrem. 2013, 1, 59–68. Available online: https://www.sciencedirect.com/science/article/pii/S2212094713000054 (accessed on 30 January 2017). [CrossRef] [Green Version]
- Harlan, S.L.; Declet-Barreto, J.H.; Stefanov, W.L.; Petitti, D.B. Neighborhood effects on heat deaths: Social and environmental predictors of vulnerability in Maricopa County, Arizona. Environ. Health Perspect. (Online) 2013, 121, 197. Available online: https://www.ncbi.nlm.nih.gov/pmc/articles/PMC3569676/ (accessed on 30 February 2017). [CrossRef]
- Bao, J.; Li, X.; Yu, C. The construction and validation of the heat vulnerability index, a review. International J. Environ. Res. Public Health 2015, 12, 7220–7234. [Google Scholar] [CrossRef] [PubMed]
- Maier, G.; Grundstein, A.; Jang, W.; Li, C.; Naeher, L.P.; Shepherd, M. Assessing the performance of a vulnerability index during oppressive heat across Georgia, United States. Weather Clim. Soc. 2014, 6, 253–263. Available online: https://journals.ametsoc.org/doi/abs/10.1175/WCAS-D-13-00037.1 (accessed on 4 February 2017). [CrossRef]
- Wong, N.H.; Chen, Y. Tropical Urban Heat Islands: Climate, Buildings and Greenery; Routledge: New York, NY, USA, 2008. [Google Scholar]
Figure 1.
Map of Philadelphia by block group.

Figure 2.
Vulnerability by block group for street trees (left) and heat (right). Vulnerability scales from 1 to 25 with lightest colors representing least vulnerable and darkest colors representing most vulnerable as compared to other block groups in the study area. Note: the light gray area represents areas of no data.

Figure 3.
High-low cluster analysis, or Anselin Moran’s I, demonstrating the four types of vulnerability for street trees (left) and heat (right). Note: the light gray area represents areas of no data.
Figure 3.
High-low cluster analysis, or Anselin Moran’s I, demonstrating the four types of vulnerability for street trees (left) and heat (right). Note: the light gray area represents areas of no data.

Figure 4.
High vulnerability block groups as determined by Anselin Moran’s I (high-low cluster) analysis for street trees (left) and heat (right). These blocks represent areas of highest heat vulnerability and lowest numbers of street trees (or street tree vulnerability). Note: the light gray area represents areas of no data.

Figure 5.
Vulnerability for street trees (left) and heat (right) by neighborhood. Vulnerability scales from 1 to 25 with lightest colors representing least vulnerable and darkest colors representing most vulnerable as compared to other block groups in the study area. Note: the light gray area represents areas of no data.
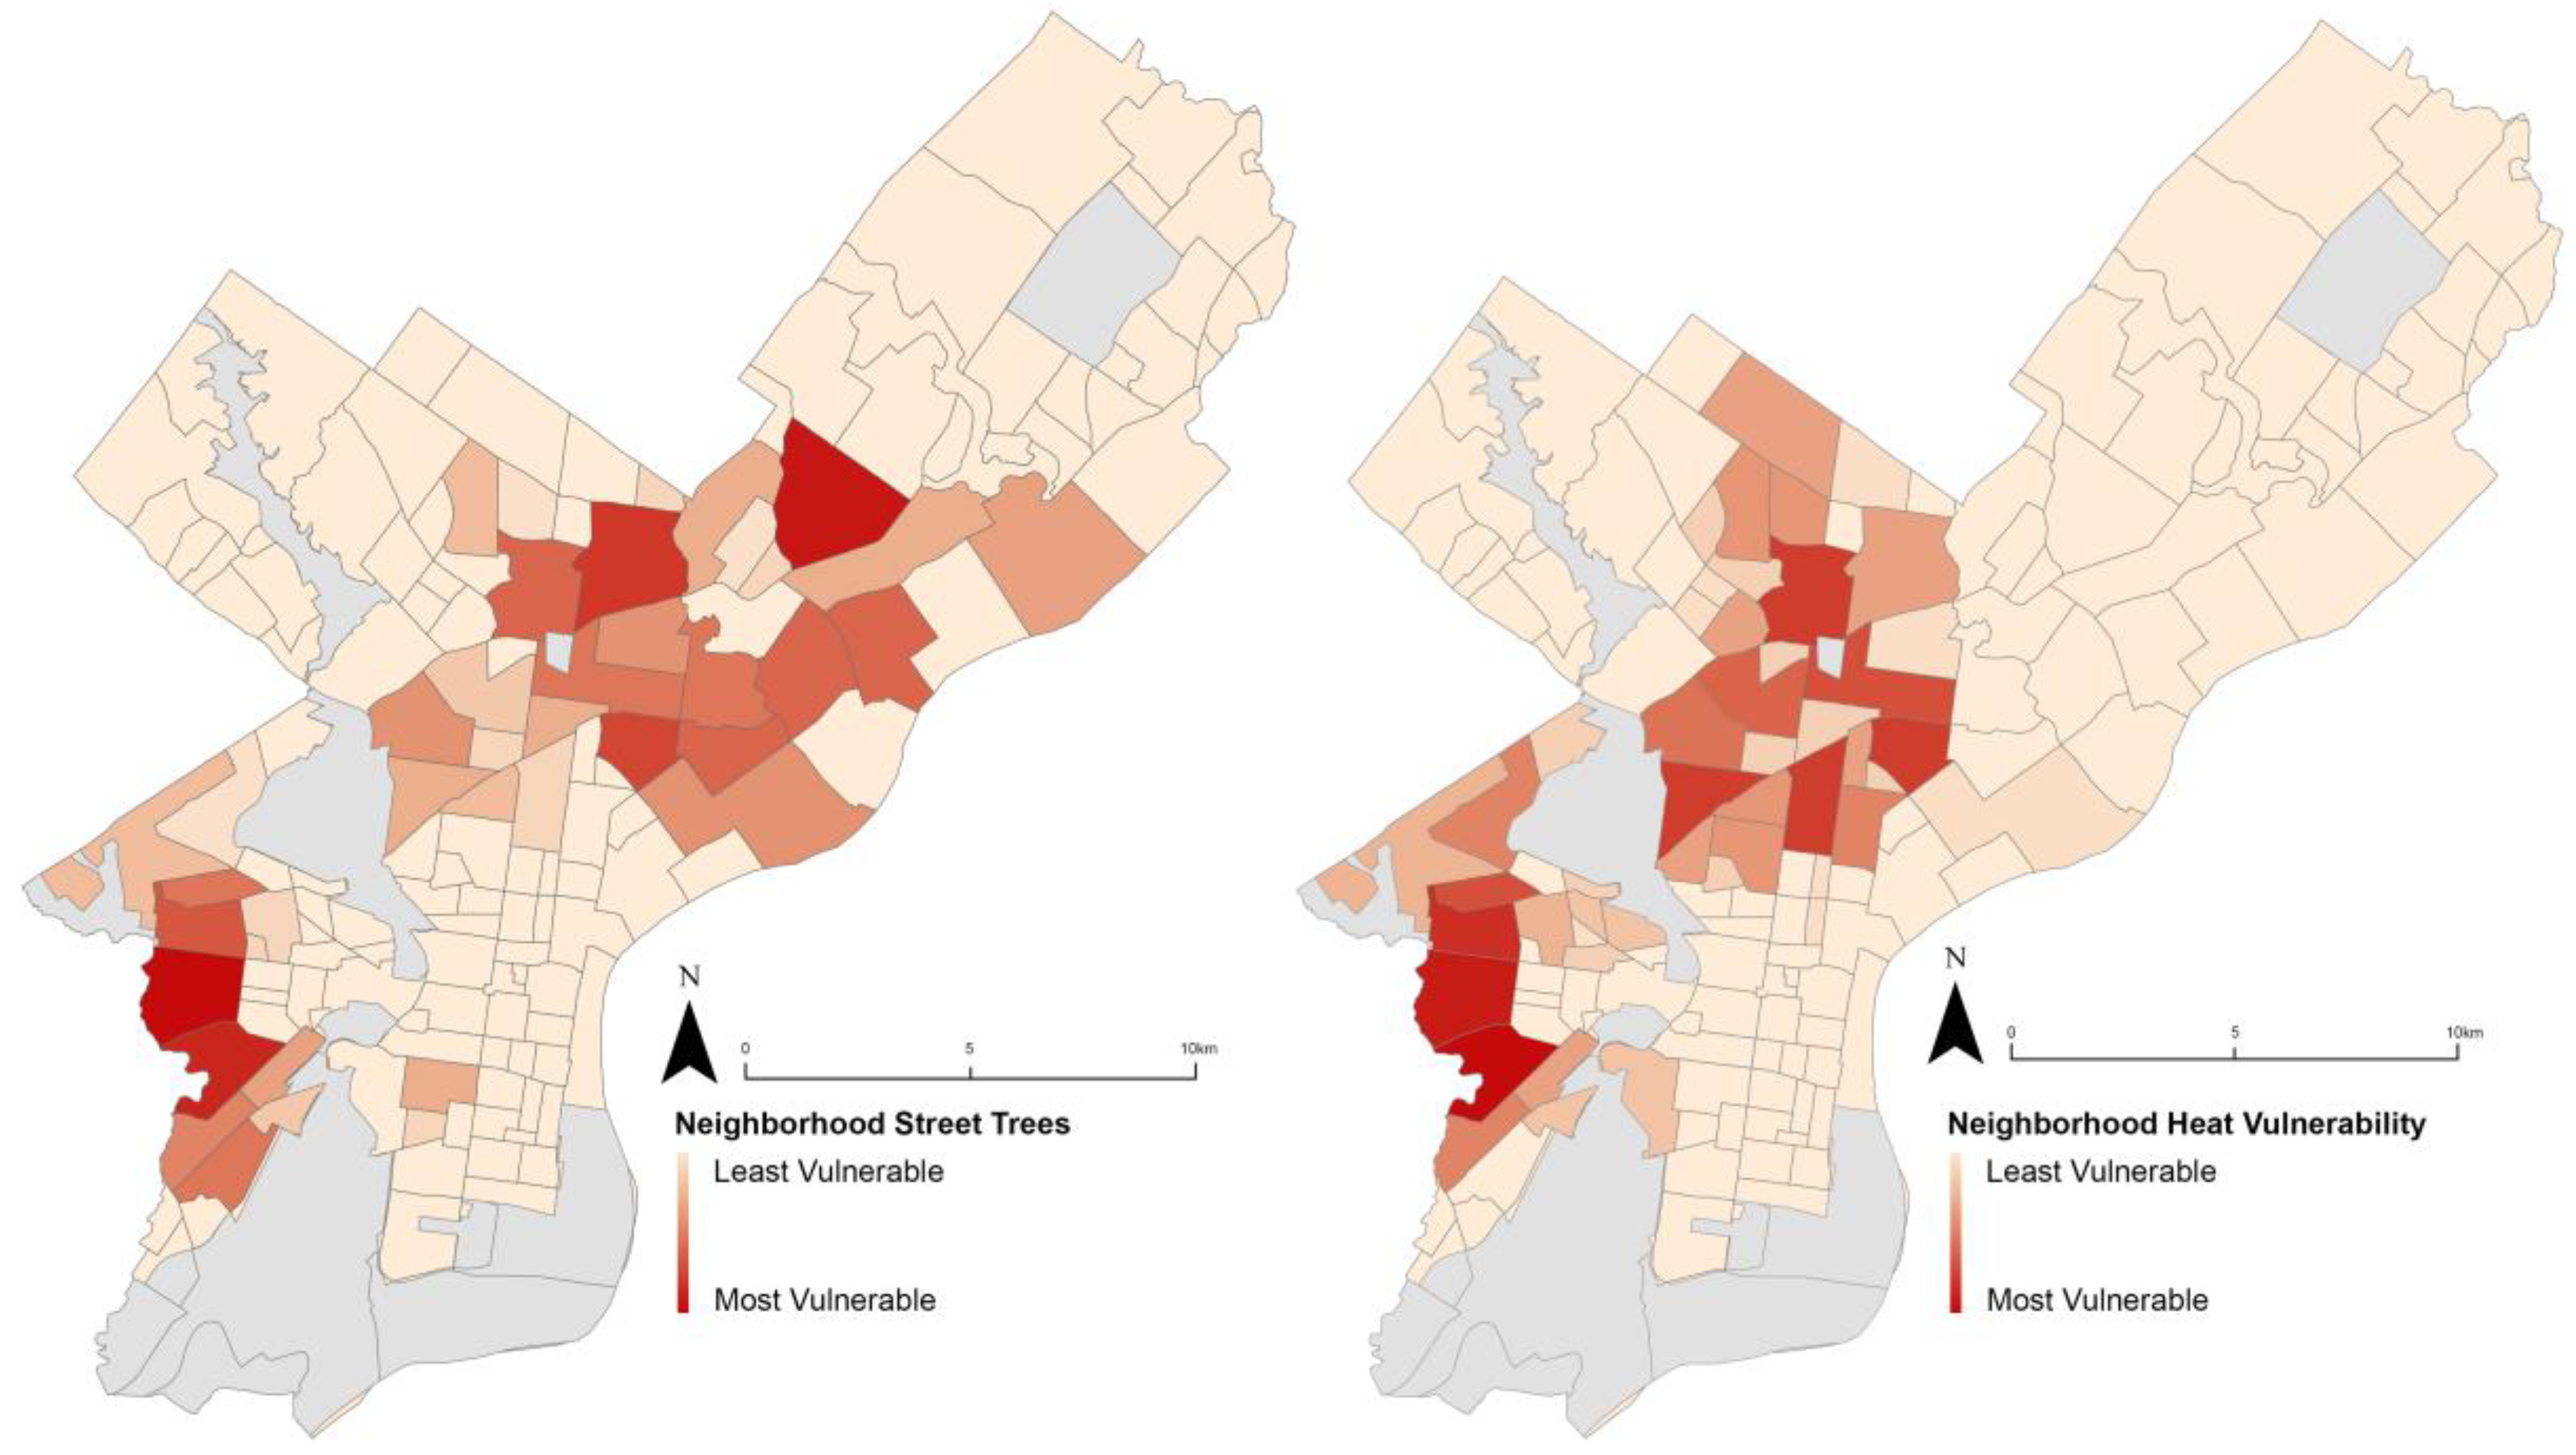
Figure 6.
Cumulative vulnerability for heat and street trees by neighborhood. This represents the scores for both heat vulnerability and lack of street trees. Vulnerability scales from 1 to 25 with lightest colors representing least vulnerable and darkest colors representing most vulnerable as compared to other block groups in the study area. Note: the light gray area represents areas of no data.

Table 1.
Spatial Cluster and Outlier Analysis, or Anselin Moran’s I, outputs and descriptions.
| Output Type | Output Description |
|---|---|
| Low-low vulnerability | The block is significantly lower in vulnerability than all other blocks, the neighborhood is significantly lower in vulnerability than all other neighborhoods. |
| Low-high vulnerability | The block is significantly lower in vulnerability than all other blocks, the neighborhood is significantly higher in vulnerability than all other neighborhoods. |
| High-low vulnerability | The block is significantly higher in vulnerability than all other blocks, the neighborhood is significantly lower in vulnerability than all other neighborhoods. |
| High-high vulnerability | The block is significantly higher in vulnerability than all other blocks, the neighborhood is significantly higher in vulnerability than all other neighborhoods. |
© 2018 by the authors. Licensee MDPI, Basel, Switzerland. This article is an open access article distributed under the terms and conditions of the Creative Commons Attribution (CC BY) license (http://creativecommons.org/licenses/by/4.0/).
Share and Cite
MDPI and ACS Style
Barron, L.; Ruggieri, D.; Branas, C. Assessing Vulnerability to Heat: A Geospatial Analysis for the City of Philadelphia. Urban Sci. 2018, 2, 38. https://doi.org/10.3390/urbansci2020038
AMA Style
Barron L, Ruggieri D, Branas C. Assessing Vulnerability to Heat: A Geospatial Analysis for the City of Philadelphia. Urban Science. 2018; 2(2):38. https://doi.org/10.3390/urbansci2020038
Chicago/Turabian StyleBarron, Laura, Dominique Ruggieri, and Charles Branas. 2018. "Assessing Vulnerability to Heat: A Geospatial Analysis for the City of Philadelphia" Urban Science 2, no. 2: 38. https://doi.org/10.3390/urbansci2020038