The Relationship between the Neighborhood Built Environment and Active Transportation among Adults: A Systematic Literature Review


Abstract
1. Introduction
2. Materials and Methods
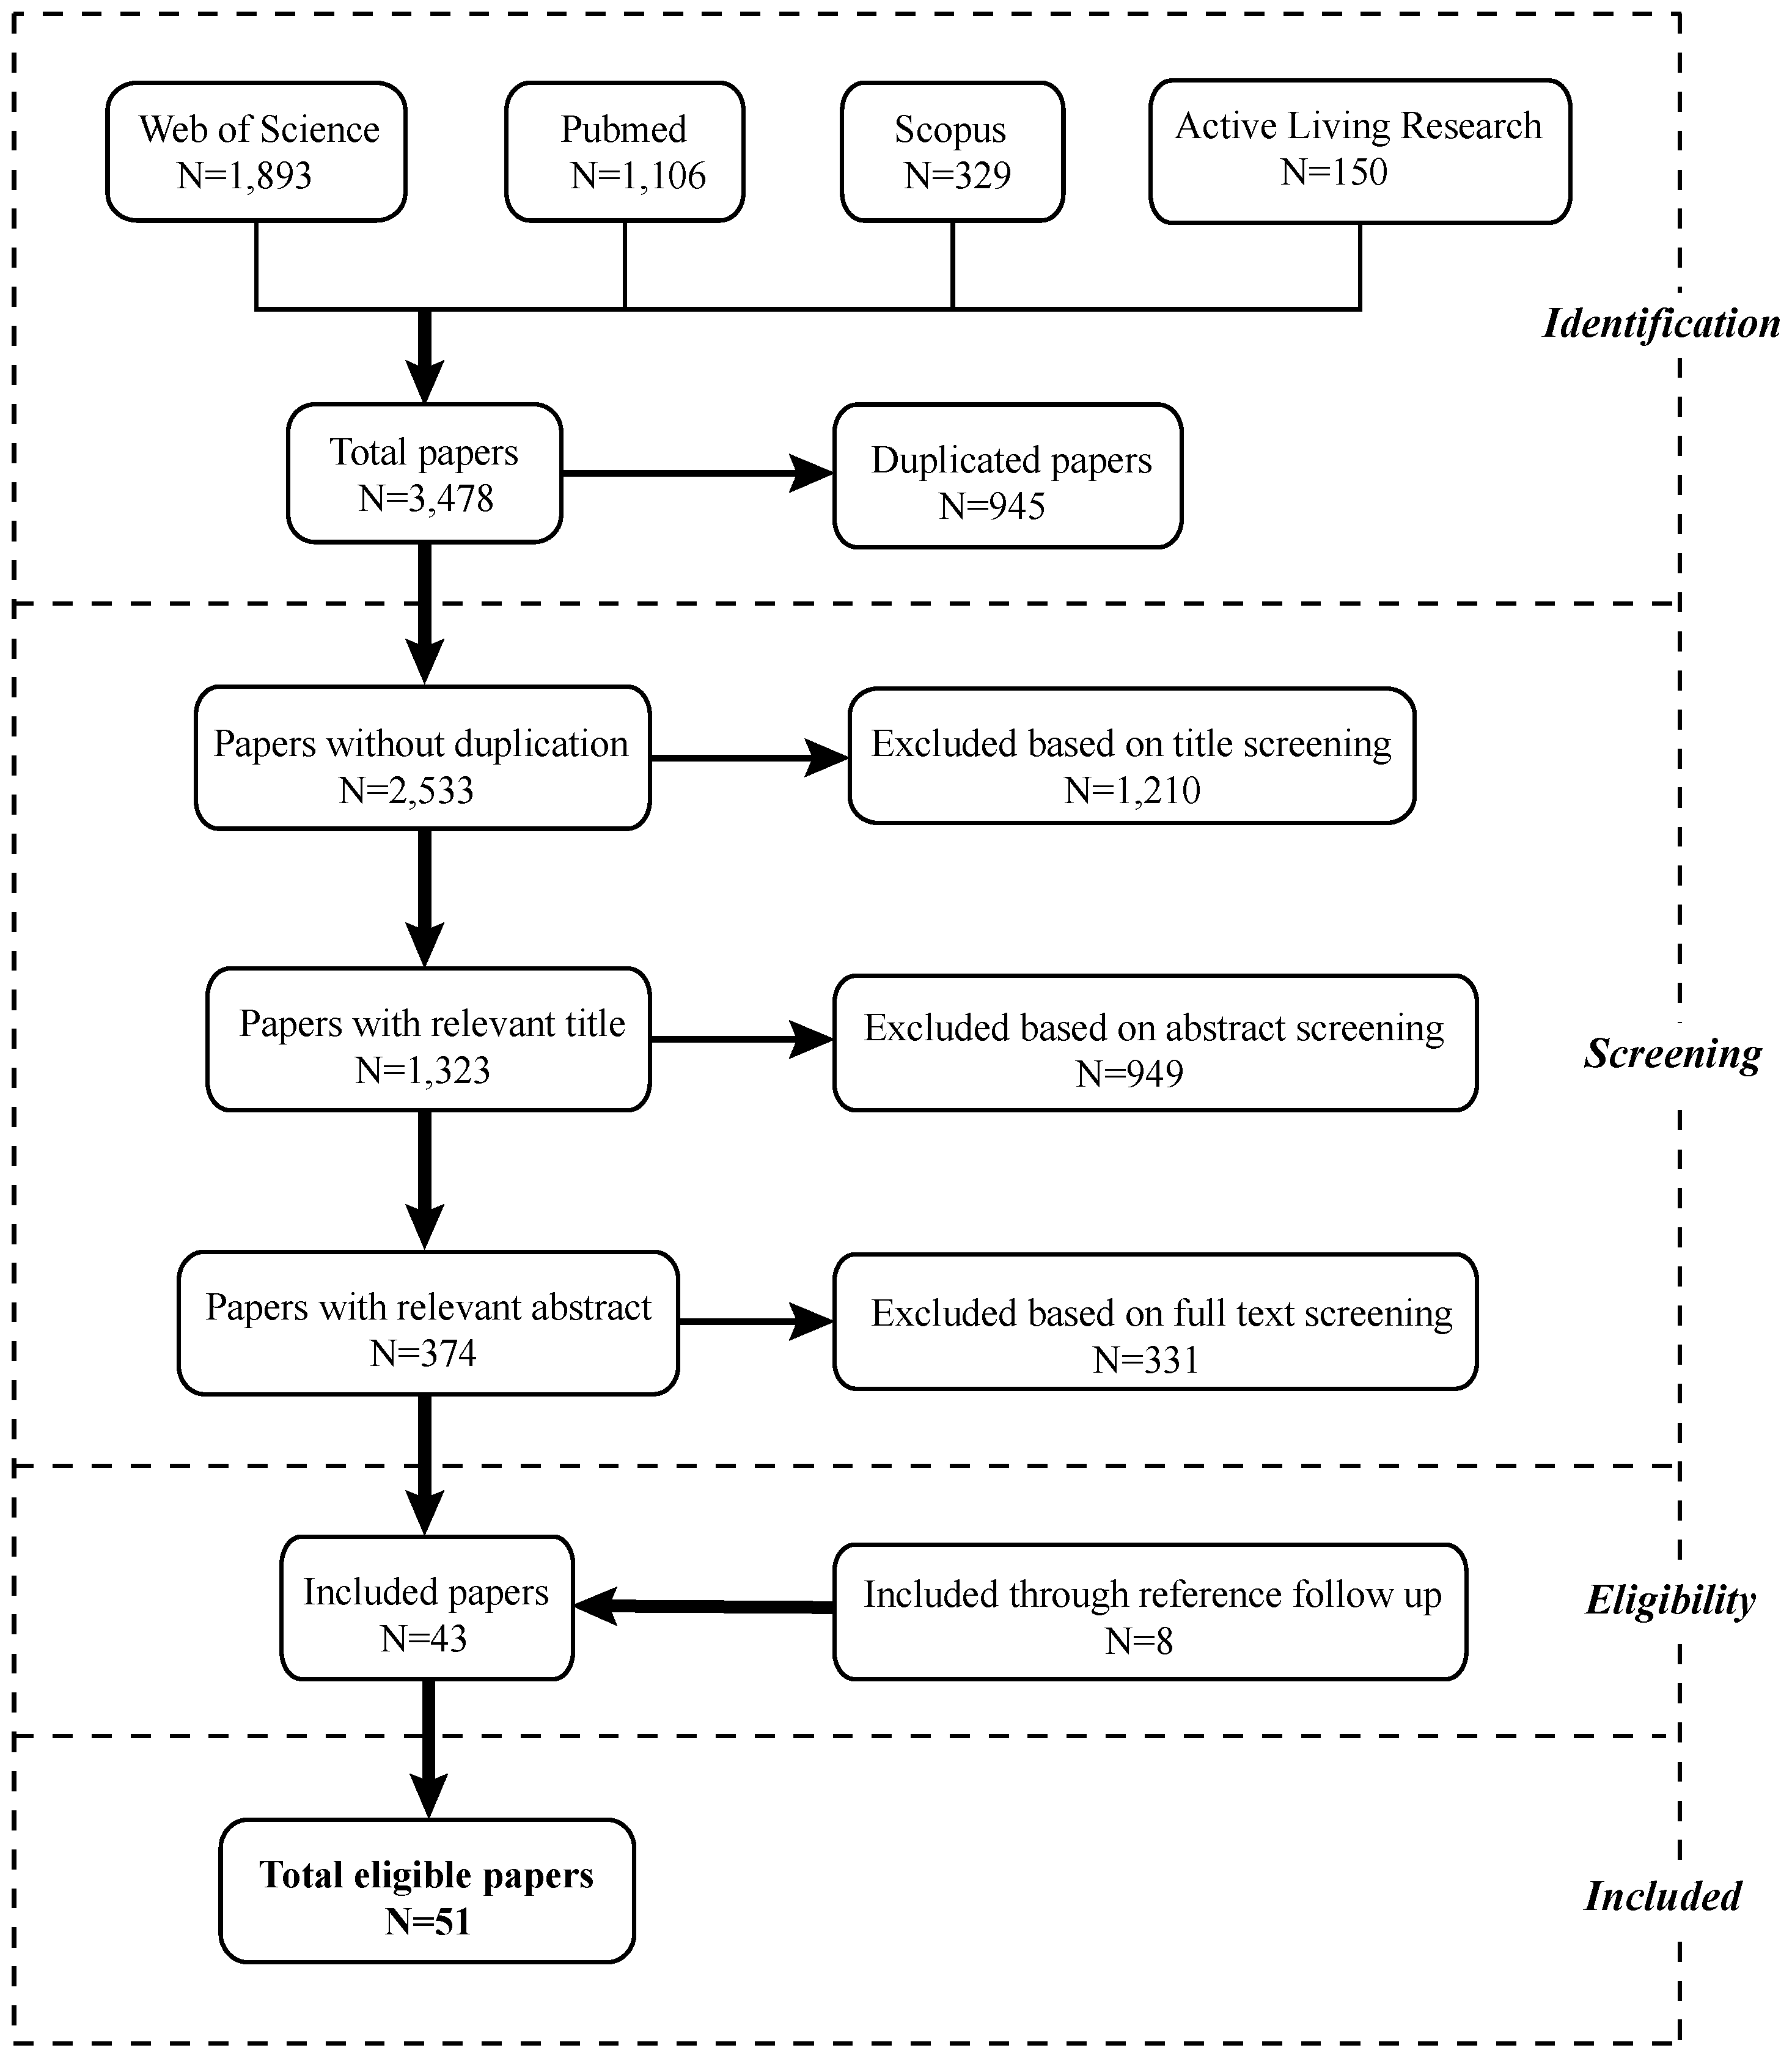
2.1. Search Strategy and Inclusion/Exclusion Criteria
- Objective measurement of the urban neighborhood environment.
- Transport-related physical activity measured with self-reported methods. Self-reported methods are most frequently used in obtaining physical activity data [16]. Therefore, we only focused on studies using self-reported physical activity data and excluded studies using objectively measured physical activity data.
- Mean age of study respondents of between 18 and 65 years old. Studies that solely focused on older adults (>65 years old) were excluded because older adults might have declined mobility [24], which might lead to a different relationship between built environment and AT.
- Quantitative studies with cross-sectional or longitudinal data.
2.2. Data Extraction
2.3. Coding of Evidence
2.4. Quality Assessment Criteria
3. Results
3.1. Study Characteristics
3.2. Results of Quality Assessment
3.3. Relationship between Neighborhood Built Environment and AT
3.3.1. Walking for Transport
3.3.2. Cycling for Transport
3.3.3. General AT
3.3.4. Inconsistent Results from Studies with Different Designs
4. Discussion
4.1. Summary of Evidence
4.1.1. Comparison of Results between Walking and Cycling for Transport
4.1.2. Comparison with Existing Literature Reviews
4.2. Differences in the Results of Studies with Different Designs
4.2.1. Study Location
4.2.2. Study Quality
4.2.3. Analyzed Geographic Unit and Different Measurements of AT
4.3. Limitation and Implications for Future Research
4.3.1. Limitation of the Included Studies
4.3.2. Limitation of the Systematic Review
4.3.3. Implication for Future Research
5. Conclusions
Acknowledgments
Author Contributions
Conflicts of Interest
References
- World Health Organization. Physical Activity. Fact Sheet Updated February 2017. Available online: http://www.who.int/mediacentre/factsheets/fs385/en/ (accessed on 17 June 2017).
- Rabl, A.; de Nazelle, A. Benefits of shift from car to active transport. Transp. Policy 2012, 19, 121–131. [Google Scholar] [CrossRef]
- Berglund, E.; Lytsy, P.; Westerling, R. Active traveling and its associations with self-rated health, BMI and physical activity: A comparative study in the adult Swedish population. Int. J. Environ. Res. Public Health 2016, 13, 455. [Google Scholar] [CrossRef] [PubMed]
- Litman, T. Active Transportation Policy Issues. Available online: http://www.vtpi.org/act_tran.pdf (accessed on 12 December 2016).
- Sallis, J.F.; Frank, L.D.; Saelens, B.E.; Kraft, M.K. Active transportation and physical activity: Opportunities for collaboration on transportation and public health research. Transp. Res. Part A Policy Pract. 2004, 38, 249–268. [Google Scholar] [CrossRef]
- Mueller, N.; Rojas-Rueda, D.; Cole-Hunter, T.; de Nazelle, A.; Dons, E.; Gerike, R.; Götschi, T.; Int Panis, L.; Kahlmeier, S.; Nieuwenhuijsen, M. Health impact assessment of active transportation: A systematic review. Prev. Med. 2015, 76, 103–114. [Google Scholar] [CrossRef]
- De Hartog, J.J.; Boogaard, H.; Nijland, H.; Hoek, G. Do the health benefits of cycling outweigh the risks? Environ. Health Perspect. 2010, 118, 1109–1116. [Google Scholar] [CrossRef] [PubMed]
- Schauder, S.A.; Foley, M.C. The relationship between active transportation and health. J. Transp. Health 2015, 2, 343–349. [Google Scholar] [CrossRef]
- Tajalli, M.; Hajbabaie, A. On the relationships between commuting mode choice and public health. J. Transp. Health 2017, 4, 267–277. [Google Scholar] [CrossRef]
- Oja, P.; Vuori, I.; Paronen, O. Daily walking and cycling to work: Their utility as health-enhancing physical activity. Patient Educ. Couns. 1998, 33, S87–S94. [Google Scholar] [CrossRef]
- Marshall, W.E.; Piatkowski, D.P.; Garrick, N.W. Community design, street networks, and public health. J. Transp. Health 2014, 1, 326–340. [Google Scholar] [CrossRef]
- Brownson, R.C.; Hoehner, C.M.; Day, K.; Forsyth, A.; Sallis, J.F. Measuring the built environment for physical activity: State of science. Am. J. Prev. Med. 2009, 36, S99–S123. [Google Scholar] [CrossRef]
- Pont, K.; Ziviani, J.; Wadley, D.; Bennett, S.; Abbott, R. Environmental correlates of children’s active transportation: A systematic literature review. Health Place 2009, 15, 849–862. [Google Scholar] [CrossRef] [PubMed]
- Ewing, R.; Cervero, R. Travel and the built environment: A meta-analysis. J. Am. Plan. Assoc. 2010, 76, 265–294. [Google Scholar] [CrossRef]
- Grasser, G.; van Dyck, D.; Titze, S.; Stronegger, W. Objectively measured walkability and active transport and weight-related outcomes in adults: A systematic review. Int. J. Public Health 2013, 58, 615–625. [Google Scholar] [CrossRef] [PubMed]
- McCormack, G.R.; Shiell, A. In search of causality: A systematic review of the relationship between the built environment and physical activity among adults. Int. J. Behav. Nutr. Phys. Act. 2011, 8, 125. [Google Scholar] [CrossRef] [PubMed]
- Saelens, B.E.; Handy, S.L. Built environment correlates of walking: A review. Med. Sci. Sports Exerc. 2010, 40, S550–S566. [Google Scholar] [CrossRef] [PubMed]
- Saelens, B.E.; Sallis, J.F.; Frank, L.D. Environmental correlates of walking and cycling: Findings from the transportation, urban design, and planning literatures. Ann. Behav. Med. 2003, 25, 80–91. [Google Scholar] [CrossRef] [PubMed]
- Zapata-Diomedi, B.; Veerman, J.L. The association between built environment features and physical activity in the Australian context: A synthesis of the literature. BMC Public Health 2016, 16, 484. [Google Scholar] [CrossRef]
- Van Holle, V.; Deforche, B.; van Cauwenberg, J.; Goubert, L.; Maes, L.; van de Weghe, N.; de Bourdeaudhuij, I. Relationship between the physical environment and different domains of physical activity in European adults: A systematic review. BMC Public Health 2012, 12, 807. [Google Scholar] [CrossRef] [PubMed]
- Ding, D.; Gebel, K. Built environment, physical activity, and obesity: What have we learned from reviewing the literature? Health Place 2012, 18, 100–105. [Google Scholar] [CrossRef] [PubMed]
- Liberati, A.; Altman, D.G.; Tetzlaff, J.; Mulrow, C.; Gøtzsche, P.C.; Ioannidis, J.P.A.; Clarke, M.; Devereaux, P.J.; Kleijnen, J.; Moher, D. The PRISMA statement for reporting systematic reviews and meta-analyses of studies that evaluate health care interventions: Explanation and elaboration. PLoS Med. 2009, 6, e1000100. [Google Scholar] [CrossRef] [PubMed]
- Gebel, K.; Ding, D.; Foster, C.; Bauman, A.E.; Sallis, J.F. Improving current practice in reviews of the built environment and physical activity. Sports Med. 2015, 45, 297–302. [Google Scholar] [CrossRef]
- Rantakokko, M.; Mänty, M.; Rantanen, T. Mobility decline in old age. Exerc. Sport Sci. Rev. 2013, 41, 19–25. [Google Scholar] [CrossRef] [PubMed]
- McCormack, G.R.; Shiell, A.; Giles-Corti, B.; Begg, S.; Veerman, J.L.; Geelhoed, E.; Amarasinghe, A.; Emery, J.H. The association between sidewalk length and walking for different purposes in established neighborhoods. Int. J. Behav. Nutr. Phys. Act. 2012, 9, 92. [Google Scholar] [CrossRef] [PubMed]
- Knuiman, M.W.; Christian, H.E.; Divitini, M.L.; Foster, S.A.; Bull, F.C.; Badland, H.M.; Giles-Corti, B. A longitudinal analysis of the influence of the neighborhood built environment on walking for transportation: The RESIDE study. Am. J. Epidemiol. 2014, 180, 453–461. [Google Scholar] [CrossRef] [PubMed]
- Kamruzzaman, M.; Washington, S.; Baker, D.; Brown, W.; Giles-Corti, B.; Turrell, G. Built environment impacts on walking for transport in Brisbane, Australia. Transportation 2016, 43, 53–77. [Google Scholar] [CrossRef]
- Wasfi, R.A.; Dasgupta, K.; Eluru, N.; Ross, N.A. Exposure to walkable neighbourhoods in urban areas increases utilitarian walking: Longitudinal study of Canadians. J. Transp. Health 2016, 3, 440–447. [Google Scholar] [CrossRef]
- Miles, R.; Panton, L.B.; Jang, M.; Haymes, E.M. Residential context, walking and obesity: Two African-American neighborhoods compared. Health Place 2008, 14, 275–286. [Google Scholar] [CrossRef] [PubMed]
- Lee, C.; Moudon, A.V. Correlates of walking for transportation or recreation purposes. J. Phys. Act. Health 2006, 3, S77–S98. [Google Scholar] [CrossRef] [PubMed]
- Handy, S.; Cao, X.; Mokhtarian, P.L. Self-selection in the relationship between the built environment and walking: Empirical evidence from Northern California. J. Am. Plan. Assoc. 2006, 72, 55–74. [Google Scholar] [CrossRef]
- Pikora, T.J.; Giles-Corti, B.; Knuiman, M.W.; Bull, F.C.; Jamrozik, K.; Donovan, R.J. Neighborhood environmental factors correlated with walking near home: Using SPACES. Med. Sci. Sports Exerc. 2006, 38, 708–714. [Google Scholar] [CrossRef] [PubMed]
- Forsyth, A.; Oakes, J.M.; Schmitz, K.H.; Hearst, M. Does residential density increase walking and other physical activity? Urban Stud. 2007, 44, 679–697. [Google Scholar] [CrossRef]
- Rodríguez, D.A.; Evenson, K.R.; Diez Roux, A.V.; Brines, S.J. Land use, residential density, and walking: The multi-ethnic study of atherosclerosis. Am. J. Prev. Med. 2009, 37, 397–404. [Google Scholar] [CrossRef] [PubMed]
- Sundquist, K.; Eriksson, U.; Kawakami, N.; Skog, L.; Ohlsson, H.; Arvidsson, D. Neighborhood walkability, physical activity, and walking behavior: The Swedish Neighborhood and Physical Activity (SNAP) study. Soc. Sci. Med. 2011, 72, 1266–1273. [Google Scholar] [CrossRef] [PubMed]
- Carlson, C.; Aytur, S.; Gardner, K.; Rogers, S. Complexity in built environment, health, and destination walking: A neighborhood-scale analysis. J. Urban Health 2012, 89, 270–284. [Google Scholar] [CrossRef] [PubMed]
- Karusisi, N.; Thomas, F.; Méline, J.; Brondeel, R.; Chaix, B. Environmental conditions around itineraries to destinations as correlates of walking for transportation among Adults: The RECORD cohort study. PLoS ONE 2014, 9, e88929. [Google Scholar] [CrossRef] [PubMed]
- Sung, H.; Lee, S.; Jung, S. Identifying the relationship between the objectively measured built environment and walking activity in the high-density and transit-oriented city, Seoul, Korea. Environ. Plan. B Plan. Des. 2014, 41, 637–660. [Google Scholar] [CrossRef]
- Jack, E.; McCormack, G.R. The associations between objectively-determined and self-reported urban form characteristics and neighborhood-based walking in adults. Int. J. Behav. Nutr. Phys. Act. 2014, 11, 71. [Google Scholar] [CrossRef] [PubMed]
- Reyer, M.; Fina, S.; Siedentop, S.; Schlicht, W. Walkability is only part of the story: Walking for transportation in Stuttgart, Germany. Int. J. Environ. Res. Public Health 2014, 11, 5849–5865. [Google Scholar] [CrossRef] [PubMed]
- Thielman, J.; Rosella, L.; Copes, R.; Lebenbaum, M.; Manson, H. Neighborhood walkability: Differential associations with self-reported transport walking and leisure-time physical activity in Canadian towns and cities of all sizes. Prev. Med. 2015, 77, 174–180. [Google Scholar] [CrossRef] [PubMed]
- Owen, N.; Cerin, E.; Leslie, E.; DuToit, L.; Coffee, N.; Frank, L.D.; Bauman, A.E.; Hugo, G.; Saelens, B.E.; Sallis, J.F. Neighborhood walkability and the walking behavior of Australian adults. Am. J. Prev. Med. 2007, 33, 387–395. [Google Scholar] [CrossRef] [PubMed]
- Tilt, J.H.; Unfried, T.M.; Roca, B. Using objective and subjective measures of neighborhood greenness and accessible destinations for understanding walking trips and BMI in Seattle, Washington. Am. J. Health Promot. 2007, 21, 371–379. [Google Scholar] [CrossRef] [PubMed]
- Saelens, B.E.; Sallis, J.F.; Frank, L.D.; Cain, K.L.; Conway, T.L.; Chapman, J.E.; Slymen, D.J.; Kerr, J. Neighborhood environment and psychosocial correlates of adults’ physical activity. Med. Sci. Sports Exerc. 2012, 44, 637–646. [Google Scholar] [CrossRef] [PubMed]
- Riva, M.; Gauvin, L.; Apparicio, P.; Brodeur, J.M. Disentangling the relative influence of built and socioeconomic environments on walking: The contribution of areas homogenous along exposures of interest. Soc. Sci. Med. 2009, 69, 1296–1305. [Google Scholar] [CrossRef]
- Turrell, G.; Haynes, M.; Wilson, L.A.; Giles-Corti, B. Can the built environment reduce health inequalities? A study of neighbourhood socioeconomic disadvantage and walking for transport. Health Place 2013, 19, 89–98. [Google Scholar] [CrossRef] [PubMed]
- Wineman, J.D.; Marans, R.W.; Schulz, A.J.; van der Westhuizen, D.L.; Mentz, G.B.; Max, P. Designing healthy neighborhoods: Contributions of the built environment to physical activity in Detroit. J. Plan. Educ. Res. 2014, 34, 180–189. [Google Scholar] [CrossRef]
- Oliver, L.; Schuurman, N.; Hall, A.; Hayes, M. Assessing the influence of the built environment on physical activity for utility and recreation in suburban metro Vancouver. BMC Public Health 2011, 11, 959. [Google Scholar] [CrossRef] [PubMed]
- Koohsari, M.J.; Sugiyama, T.; Shibata, A.; Ishii, K.; Liao, Y.; Hanibuchi, T.; Owen, N.; Oka, K. Associations of street layout with walking and sedentary behaviors in an urban and a rural area of Japan. Health Place 2017, 45, 64–69. [Google Scholar] [CrossRef] [PubMed]
- Larrañaga, A.M.; Rizzi, L.I.; Arellana, J.; Strambi, O.; Cybis, H.B.B. The influence of built environment and travel attitudes on walking: A case study of Porto Alegre, Brazil. Int. J. Sustain. Transp. 2016, 10, 332–342. [Google Scholar] [CrossRef]
- Kelley, E.A.; Kandula, N.R.; Kanaya, A.M.; Yen, I.H. Neighborhood walkability and walking for transport among South Asians in the MASALA study. J. Phys. Act. Health 2016, 13, 514–519. [Google Scholar] [CrossRef] [PubMed]
- Koohsari, M.J.; Owen, N.; Cole, R.; Mavoa, S.; Oka, K.; Hanibuchi, T.; Sugiyama, T. Built environmental factors and adults’ travel behaviors: Role of street layout and local destinations. Prev. Med. 2017, 96, 124–128. [Google Scholar] [CrossRef] [PubMed]
- Dill, J.; Voros, K. Factors affecting bicycling demand: Initial survey findings from the Portland, Oregon, Region. Transp. Res. Rec. 2007, 2031, 9–17. [Google Scholar] [CrossRef]
- Owen, N.; de Bourdeaudhuij, I.; Sugiyama, T.; Leslie, E.; Cerin, E.; van Dyck, D.; Bauman, A. Bicycle use for transport in an Australian and a Belgian city: Associations with built-environment attributes. J. Urban Health 2010, 87, 189–198. [Google Scholar] [CrossRef] [PubMed]
- Rybarczyk, G.; Wu, C. Examining the impact of urban morphology on bicycle mode choice. Environ. Plan. B Plan. Des. 2014, 41, 272–288. [Google Scholar] [CrossRef]
- Zhao, P. The impact of the built environment on bicycle commuting: Evidence from Beijing. Urban Stud. 2014, 51, 1019–1037. [Google Scholar] [CrossRef]
- Foster, C.E.; Panter, J.R.; Wareham, N.J. Assessing the impact of road traffic on cycling for leisure and cycling to work. Int. J. Behav. Nutr. Phys. Act. 2011, 8, 61. [Google Scholar] [CrossRef] [PubMed]
- Ma, L.; Dill, J. Associations between the objective and perceived built environment and bicycling for transportation. J. Transp. Health 2015, 2, 248–255. [Google Scholar] [CrossRef]
- Heesch, K.C.; Giles-Corti, B.; Turrell, G. Cycling for transport and recreation: Associations with the socio-economic, natural and built environment. Health Place 2015, 36, 152–161. [Google Scholar] [CrossRef]
- Zahabi, S.A.H.; Chang, A.; Miranda-Moreno, L.F.; Patterson, Z. Exploring the link between the neighborhood typologies, bicycle infrastructure and commuting cycling over time and the potential impact on commuter GHG emissions. Transp. Res. Part D Transp. Environ. 2016, 47, 89–103. [Google Scholar] [CrossRef]
- Braun, L.M.; Rodriguez, D.A.; Cole-Hunter, T.; Ambros, A.; Donaire-Gonzalez, D.; Jerrett, M.; Mendez, M.A.; Nieuwenhuijsen, M.J.; de Nazelle, A. Short-term planning and policy interventions to promote cycling in urban centers: Findings from a commute mode choice analysis in Barcelona, Spain. Transp. Res. Part A Policy Pract. 2016, 89, 164–183. [Google Scholar] [CrossRef]
- Mertens, L.; Compernolle, S.; Deforche, B.; Mackenbach, J.D.; Lakerveld, J.; Brug, J.; Roda, C.; Feuillet, T.; Oppert, J.-M.; Glonti, K.; et al. Built environmental correlates of cycling for transport across Europe. Health Place 2017, 44, 35–42. [Google Scholar] [CrossRef] [PubMed]
- Kondo, K.; Lee, J.S.; Kawakubo, K.; Kataoka, Y.; Asami, Y.; Mori, K.; Umezaki, M.; Yamauchi, T.; Takagi, H.; Sunagawa, H.; et al. Association between daily physical activity and neighborhood environments. Environ. Health Prev. Med. 2009, 14, 196–206. [Google Scholar] [CrossRef] [PubMed]
- Cervero, R.; Sarmiento, O.L.; Jacoby, E.; Gomez, L.F.; Neiman, A. Influences of built environments on walking and cycling: Lessons from Bogotá. Int. J. Sustain. Transp. 2009, 3, 203–226. [Google Scholar] [CrossRef]
- Van Dyck, D.; Deforche, B.; Cardon, G.; de Bourdeaudhuij, I. Neighbourhood walkability and its particular importance for adults with a preference for passive transport. Health Place 2009, 15, 496–504. [Google Scholar] [CrossRef] [PubMed]
- Van Dyck, D.; Cardon, G.; Deforche, B.; Sallis, J.F.; Owen, N.; de Bourdeaudhuij, I. Neighborhood SES and walkability are related to physical activity behavior in Belgian adults. Prev. Med. 2010, 50, S74–S79. [Google Scholar] [CrossRef] [PubMed]
- Fan, J.X.; Wen, M.; Kowaleski-Jones, L. An ecological analysis of environmental correlates of active commuting in urban U.S. Health Place 2014, 30, 242–250. [Google Scholar] [CrossRef] [PubMed]
- Munshi, T. Built environment and mode choice relationship for commute travel in the city of Rajkot, India. Transp. Res. Part D Transp. Environ. 2016, 44, 239–253. [Google Scholar] [CrossRef]
- Christiansen, L.B.; Cerin, E.; Badland, H.; Kerr, J.; Davey, R.; Troelsen, J.; van Dyck, D.; Mitáš, J.; Schofield, G.; Sugiyama, T.; et al. International comparisons of the associations between objective measures of the built environment and transport-related walking and cycling: IPEN adult study. J. Transp. Health 2016, 3, 467–478. [Google Scholar] [CrossRef] [PubMed]
- Witten, K.; Blakely, T.; Bagheri, N.; Badland, H.; Ivory, V.; Pearce, J.; Mavoa, S.; Hinckson, E.; Schofield, G. Neighborhood built environment and transport and leisure physical activity: Findings using objective exposure and outcome measures in New Zealand. Environ. Health Perspect. 2012, 120, 971–977. [Google Scholar] [CrossRef] [PubMed]
- Frank, L.D.; Sallis, J.F.; Conway, T.L.; Chapman, J.E.; Saelens, B.E.; Bachman, W. Many Pathways from Land Use to Health: Associations between Neighborhood Walkability and Active Transportation, Body Mass Index, and Air Quality. J. Am. Plan. Assoc. 2006, 72, 75–87. [Google Scholar] [CrossRef]
- Hoehner, C.M.; Brennan Ramirez, L.K.; Elliott, M.B.; Handy, S.L.; Brownson, R.C. Perceived and objective environmental measures and physical activity among urban adults. Am. J. Prev. Med. 2005, 28, 105–116. [Google Scholar] [CrossRef] [PubMed]
- De Sa, E.; Ardern, C.I. Associations between the built environment, total, recreational, and transit-related physical activity. BMC Public Health 2014, 14, 693. [Google Scholar] [CrossRef] [PubMed]
- Mäki-Opas, T.E.; Borodulin, K.; Valkeinen, H.; Stenholm, S.; Kunst, A.E.; Abel, T.; Härkänen, T.; Kopperoinen, L.; Itkonen, P.; Prättälä, R.; et al. The contribution of travel-related urban zones, cycling and pedestrian networks and green space to commuting physical activity among adults—A cross-sectional population-based study using geographical information systems. BMC Public Health 2016, 16, 760. [Google Scholar] [CrossRef] [PubMed]
- Feng, J. The built environment and active travel: Evidence from Nanjing, China. Int. J. Environ. Res. Public Health 2016, 13, 301. [Google Scholar] [CrossRef] [PubMed]
- EPHPP. Quality Assessment Tool for Quantitative Studies Dictionary. Available online: http://www.ephpp.ca/PDF/QADictionary_dec2009.pdf (accessed on 12 December 2016).
- Thomas, H. Quality Assessment Tool for Quantitative Studies. Available online: http://www.ephpp.ca/PDF/Quality Assessment Tool_2010_2.pdf (accessed on 12 December 2016).
- Armijo-Olivo, S.; Stiles, C.R.; Hagen, N.A.; Biondo, P.D.; Cummings, G.G. Assessment of study quality for systematic reviews: A comparison of the Cochrane Collaboration Risk of Bias Tool and the Effective Public Health Practice Project Quality Assessment Tool: Methodological Research. J. Eval. Clin. Pract. 2012, 18, 12–18. [Google Scholar] [CrossRef] [PubMed]
- Craig, C.L.; Marshall, A.L.; Sjöström, M.; Bauman, A.E.; Booth, M.L.; Ainsworth, B.E.; Pratt, M.; Ekelund, U.; Yngve, A.; Sallis, J.F.; et al. International physical activity questionnaire: 12-Country reliability and validity. Med. Sci. Sports Exerc. 2003, 35, 1381–1395. [Google Scholar] [CrossRef] [PubMed]
- Cerin, E.; Nathan, A.; van Cauwenberg, J.; Barnett, D.W.; Barnett, A. The neighbourhood physical environment and active travel in older adults: A systematic review and meta-analysis. Int. J. Behav. Nutr. Phys. Act. 2017, 14, 15. [Google Scholar] [CrossRef]
- Fraser, S.D.S.; Lock, K. Cycling for transport and public health: A systematic review of the effect of the environment on cycling. Eur. J. Public Health 2011, 21, 738–743. [Google Scholar] [CrossRef] [PubMed]
- Pucher, J.; Buehler, R. Making cycling irresistible: Lessons from the Netherlands, Denmark and Germany. Transp. Rev. 2008, 28, 495–528. [Google Scholar] [CrossRef]
- Stewart, G.; Anokye, N.K.; Pokhrel, S. What interventions increase commuter cycling? A systematic review. BMJ Open 2015, 5, e007945. [Google Scholar] [CrossRef] [PubMed]
- Moudon, A.V.; Lee, C.; Cheadle, A.D.; Collier, C.W.; Johnson, D.; Schmid, T.L.; Weather, R.D. Cycling and the built environment, a US perspective. Transp. Res. Part D Transp. Environ. 2005, 10, 245–261. [Google Scholar] [CrossRef]


| Built Environment Factor | Relevant Items or Examples Used in Included Articles |
|---|---|
| Residential density | Population density; dwelling density |
| Land use mix | Land use diversity |
| Street connectivity | Intersection density; street crossing density |
| Retail land use | Retail area ratio; commercial land use; commercial intensity; density of services |
| Walkability | Walkability score; walkability index; Walk Score; active living potential |
| Street integration | The extent of access to a street segment or set of streets from other street segments or other parts of the city |
| Sidewalk | The presence or length of sidewalk; sidewalk/pedestrian network |
| Bicycle lane | The presence or density or length of bicycle lane; the proximity to bicycle lane; bicycle network connectivity |
| Access to destinations | The presence or number of a range of destinations; the proximity/access to shop, services, restaurant, bus stop/railway station, school, work, church, etc. |
| Traffic volume/speed | Traffic volume; traffic speed |
| Hilliness | Hill; slope |
| Neighborhood aesthetics | Presence of trees; green canopy coverage; greenness; green space; streetscape; the number of parks; park land use |
| Type of results | Description | Code |
|---|---|---|
| Not able to get a summary result | 0–4 studies reach a conclusion for the built environment factor; | - |
| 0–40% of studies reach a conclusion in the same direction; | ||
| 41–50% of studies reach a conclusion in the same direction and ≥25% in the opposite direction | ||
| Possible relationship | 41–50% of studies reach a conclusion in the same direction and <25% in the opposite direction | P; O; N |
| Convincing relationship | 51–100% of studies reach a conclusion in the same direction | P; O; N |
| Component | Explanation | Score |
|---|---|---|
| Response rate | The overall response rate of the questionnaire survey of physical activity |
|
| Representativeness | Whether the study sample could represent the target population |
|
| Outcome measures | Whether the study used a valid questionnaire |
|
| Confounding factors | Whether the study controlled for socioeconomic factors and self-selection factors |
|
| Final grade | The final result of the quality assessment after summing up the scores above |
|
| Author, (Year), Reference | Location, Sample Size | Mean Age/Age Range (Years) | Objective Measures of Built Environment | Travel Mode | Analyzed Geographic Unit |
|---|---|---|---|---|---|
| McCormack et al. (2012) [25] | Australia, 1681 | 40.2 | GIS-based measures | 1 | 1.6-km road network buffer around home address |
| Knuiman et al. (2014) [26] | Australia, 1703 (baseline d) | 39.9 | GIS-based measures | 1 | 1.6-km road network buffer around home address |
| Kamruzzaman et al. (2016) [27] | Australia, 3612 (baseline) | 40–70 | Archival datasets e | 1 | 1-km circular buffer around home address |
| Wasfi et al. (2016) [28] | Canada, 2976 (baseline) | 18–55 | Walk Score metric | 1 | Walk Score based on residential location |
| Miles et al. (2008) [29] | USA, 72 | 40; 44 | GIS-based measures; direct observations | 1 | 402-m, 805-m, 1609-m of the center of the neighborhoods |
| Lee and Moudon (2006) [30] | USA, 438 | ≥18 | GIS-based measures | 1 | Land use and infrastructure: 1-km around home address; access to destination: 3-km around home address; density: parcel level and 1-km around home address |
| Handy et al. (2006) [31] | USA, 1672 | 43.3; 54.7 | GIS-based measures | 1 | 400-m, 800-m, 1600-m street network buffer around home address |
| Pikora et al. (2006) [32] | Australia, 1678 | 18–59 | SPACES c instrument | 1 | 400-m radius buffer around home address |
| Forsyth et al. (2007) [33] | USA, 715 | 44/49 | GIS-based measures | 1 | 805 × 805 m2; 0.2-km, 0.4-km, 0.8-km, 1.6-km street network and straight-line buffer around home address |
| Rodríguez et al. (2009) [34] | USA, 5529 | 45–84 | GIS-based measures | 1 | 200-m radius buffer around home address |
| Sundquist et al. (2011) [35] | Sweden, 2269 | 20–66 | GIS-based measures | 1 | Neighborhood based on administrative area |
| Carlson et al. (2012) [36] | USA, 679 | 52 | Built environment metrics | 1 | Neighborhood based on administrative area |
| Karusisi et al. (2014) [37] | France, 7290 | 30–79 | GIS-based measures | 1 | 500-m street network radius buffer around home and workplace |
| Sung et al. (2014) [38] | Korea, 1826 | 39.6 | GIS-based measures | 1 | 250-m, 500-m, 1000-m, 1500-m circular buffers around home |
| Jack and McCormack (2014) [39] | Canada, 1875 | ≥18 | GIS-based measures | 1 | 1.6-km street network buffer around home address |
| Reyer et al. (2014) [40] | Germany, 1871 | 54.1 | GIS-based measures; Walk Score metric | 1 | Walk Score: 500-m area around home address |
| Thielman et al. (2015) [41] | Canada, 151,318 | >12 | Walk Score metric | 1 | Walk Score values were assigned to postal codes and a single postal code can include multiple respondents |
| Owen et al. (2007) [42] | Australia, 2650 | 20–65 | GIS-based measures | 1 | Census Collectors’ Districts |
| Tilt et al. (2007) [43] | USA, 529 | ≥18 | GIS-based measures | 1 | 0.4-mi street networks buffer of residential parcels |
| Saelens et al. (2012) [44] | USA, 2199 | 45.2 | GIS-based measures | 1 | 1-km street network buffer around home address |
| Riva et al. (2009) [45] | Canada, 2716 | ≥45 | GIS-based measures | 1 | Dissemination area-level: stable geographic units composed of one or more neighboring street blocks, with a population of 400–700 persons |
| Turrell et al. (2013) [46] | Australia, 10,711 | 40–65 | Archival datasets | 1 | Census Collectors’ Districts |
| Wineman et al. (2014) [47] | USA, 460 | 50.9 | GIS-based measures | 1 | Street connectivity and integration: 0.5-mi radius from survey participant’s residential block; density and land use mix: 0.25-mi, 0.5-mi radius |
| Oliver et al. (2011) [48] | Canada, 1602 | 47 | GIS-based measures | 1 | 1-km road network buffer around each respondent’s postal code |
| Koohsari et al. (2017) [49] | Japan, 569 | 55.8 | GIS-based measures | 1 | Intersection density: 800-m radius buffer around home address; Street integration: 1-km radius buffer |
| Larrañaga et al. (2016) [50] | Brazil, 442 household | 43 | GIS-based measures | 1 | 500-m buffer from the geometric center of the census tract of residence |
| Kelley et al. (2016) [51] | USA, 906 | 55 | Walk Score metric | 1 | Walk Scores base on home address |
| Koohsari et al. (2017) [52] | Australia, 16,345 | 46.6 | Archival datasets; Walk Score metric | 1 | Statistical Area 1 (the smallest geographic unit in Australia) |
| Dill and Voros (2007) [53] | USA, 566 | ≥18 | GIS-based measures | 2 | 0.25-mi buffer around home address |
| Owen et al. (2010) [54] | Australia, 1940 | 45.4 | GIS-based measures | 2 | Census Collectors’ Districts |
| Rybarczyk and Wu (2014) [55] | USA, 6210 | 18–74 | GIS-based measures | 2 | 3-km straight-line buffers around home address |
| Zhao (2014) [56] | China, 613 | 48.1; 43.7 | Archival datasets | 2 | 3.5-km radius from the centroid of a community |
| Foster et al. (2011) [57] | UK, 13,927 | 41–80 | GIS-based measures | 2 | 0.5-km, 1-km, 2-km, 3.2-km buffers around home address |
| Ma and Dill (2015) [58] | USA, 616 | 51.3 | GIS-based measures | 2 | 0.5-mi circular and network buffers around home address |
| Heesch et al. (2015) [59] | Australia, 10,328 | 40–65 | GIS-based measures | 2 | Neighborhood suburbs (a median of 3.9 km2 in size) |
| Zahabi et al. (2016) [60] | Canada, 21,188 (baseline); | ≥15 | GIS-based measures | 2 | 500-m grid cell level |
| Braun et al. (2016) [61] | Spain, 765 | 18–65 | GIS-based measures | 2 | 400-m circular buffer around home address |
| Mertens et al. (2017) [62] | Five countries a, 3904 | 45.5 | SPOTLIGHT Virtual Audit Tool | 2 | In Hungary: 1 km2 areas in greater Budapest; in other countries: neighborhoods based on local administrative boundaries |
| Kondo et al. (2009) [63] | Japan, 156 | 51.0; 53.8 | GIS-based measures | 3 | 500-m radius buffer around home address |
| Cervero et al. (2009) [64] | Colombia, 1285 | ≥18 | GIS-based measures | 3 | 500-m straight-line radius around the sampled neighborhoods; and 1000-m straight-line beyond the perimeters of sampled neighborhoods |
| Van Dyck et al. (2009) [65] | Belgium, 120 | 43 | Field observations, geographical map data | 3 | 800-m radius buffer around home address |
| Van Dyck et al. (2010) [66] | Belgium, 1166 | 42.7 | GIS-based measures | 3 | Neighborhood based on statistical sectors |
| Fan et al. (2014) [67] | USA, 39,660 census tracts | 37.7 | GIS-based measures | 3 | Census tract (between 1200 and 8000 residents) |
| Munshi (2016) [68] | India, 2050 | 38; 39; 40; 44 | Archival datasets | 3 | 100-m equal size grid cell level |
| Christiansen et al. (2016) [69] | Ten countries b, 12,181 | 18–66 | GIS-based measures | 3 | 500-m and 1-km street-network buffer around home address |
| Witten et al. (2012) [70] | New Zealand, 2033 | 20–65 | GIS-based measures and SPACES c instrument | 4 | Accessibility: 800-m along street network of a meshblock centroid; other variables: at the meshblock level |
| Frank et al. (2006) [71] | USA, 1228 | 44 | Archival datasets | 4 | 1-km street network buffer around home address |
| Hoehner et al. (2005) [72] | USA, 1053 | 18–96 | Environmental audits | 4 | 400-m buffer around home address |
| de Sa and Ardern (2014) [73] | Canada, 1158 | 47.9 | GIS-based measures | 4 | 500-m radius buffer around home address |
| Mäki-Opas et al. (2016) [74] | Finland, 2098 | 30–64 | GIS-based measures | 4 | The pedestrian and cycling network within 500-m buffer around home address |
| Feng (2016) [75] | China, 5051 | ≥20 | Archival datasets | 4 | 1-km radius circle buffer around the center of each traffic analysis zone |
| Author, (Year), Reference | Response Rate | Representativeness | Outcome Measures | Confounding Factors | Global Rating | |
|---|---|---|---|---|---|---|
| McCormack et al. (2012) [25] | 2 | 0 | 2 | 2 | 6 | Strong |
| Knuiman et al. (2014) [26] | 2 | 0 | 2 | 2 | 6 | Strong |
| Kamruzzaman et al. (2016) [27] | 2 | 2 | 2 | 2 | 8 | Strong |
| Wasfi et al. (2016) [28] | 2 | 2 | 1 | 2 | 7 | Strong |
| Miles et al. (2008) [29] | 0 | 2 | 2 | 1 | 5 | Moderate |
| Lee and Moudon (2006) [30] | 2 | 1 | 2 | 2 | 7 | Strong |
| Handy et al. (2006) [31] | 2 | 1 | 0 | 2 | 5 | Moderate |
| Pikora et al. (2006) [32] | 2 | 0 | 0 | 2 | 4 | Moderate |
| Forsyth et al. (2007) [33] | 0 | 1 | 2 | 1 | 4 | Moderate |
| Rodríguez et al. (2009) [34] | 2 | 0 | 2 | 1 | 5 | Moderate |
| Sundquist et al. (2011) [35] | 2 | 1 | 2 | 1 | 6 | Strong |
| Carlson et al. (2012) [36] | 2 | 1 | 1 | 1 | 5 | Moderate |
| Karusisi et al. (2014) [37] | 2 | 1 | 0 | 1 | 4 | Moderate |
| Sung et al. (2014) [38] | 0 | 1 | 1 | 1 | 3 | Weak |
| Jack and McCormack (2014) [39] | 2 | 0 | 2 | 2 | 6 | Strong |
| Reyer et al. (2014) [40] | 0 | 1 | 1 | 1 | 3 | Weak |
| Thielman et al. (2015) [41] | 2 | 2 | 1 | 1 | 6 | Strong |
| Owen et al. (2007) [42] | 1 | 1 | 2 | 2 | 6 | Strong |
| Tilt et al. (2007) [43] | 1 | 1 | 1 | 1 | 4 | Moderate |
| Saelens et al. (2012) [44] | 2 | 0 | 2 | 2 | 6 | Strong |
| Riva et al. (2009) [45] | 2 | 2 | 2 | 1 | 7 | Strong |
| Turrell et al. (2013) [46] | 2 | 2 | 0 | 1 | 5 | Moderate |
| Wineman et al. (2014) [47] | 2 | 1 | 2 | 1 | 6 | Strong |
| Oliver et al. (2011) [48] | 2 | 0 | 0 | 1 | 3 | Weak |
| Koohsari et al. (2017) [49] | 2 | 1 | 2 | 1 | 6 | Strong |
| Larrañaga et al. (2016) [50] | 2 | 1 | 0 | 2 | 5 | Moderate |
| Kelley et al. (2016) [51] | 2 | 2 | 0 | 1 | 5 | Moderate |
| Koohsari et al. (2017) [52] | 2 | 1 | 1 | 1 | 5 | Moderate |
| Dill and Voros (2007) [53] | 2 | 0 | 0 | 2 | 4 | Moderate |
| Owen et al. (2010) [54] | 1 | 0 | 2 | 1 | 4 | Moderate |
| Rybarczyk and Wu (2014) [55] | 0 | 1 | 1 | 1 | 3 | Weak |
| Zhao (2014) [56] | 0 | 2 | 0 | 1 | 3 | Weak |
| Foster et al. (2011) [57] | 0 | 2 | 1 | 1 | 4 | Moderate |
| Ma and Dill (2015) [58] | 2 | 1 | 0 | 2 | 5 | Moderate |
| Heesch et al. (2015) [59] | 2 | 2 | 0 | 2 | 6 | Strong |
| Zahabi et al. (2016) [60] | 0 | 1 | 1 | 2 | 4 | Moderate |
| Braun et al. (2016) [61] | 2 | 1 | 0 | 1 | 4 | Moderate |
| Mertens et al. (2017) [62] | 1 | 0 | 2 | 1 | 4 | Moderate |
| Kondo et al. (2009) [63] | 2 | 0 | 2 | 1 | 5 | Moderate |
| Cervero et al. (2009) [64] | 2 | 2 | 2 | 1 | 7 | Strong |
| Van Dyck et al. (2009) [65] | 2 | 1 | 2 | 2 | 7 | Strong |
| Van Dyck et al. (2010) [66] | 2 | 1 | 2 | 1 | 6 | Strong |
| Fan et al. (2014) [67] | 0 | 1 | 1 | 1 | 3 | Weak |
| Munshi (2016) [68] | 0 | 1 | 0 | 2 | 3 | Weak |
| Christiansen et al. (2016) [69] | 0 | 1 | 2 | 1 | 4 | Moderate |
| Witten et al. (2012) [70] | 2 | 1 | 2 | 2 | 7 | Strong |
| Frank et al. (2006) [71] | 2 | 1 | 2 | 1 | 6 | Strong |
| Hoehner et al. (2005) [72] | 2 | 1 | 2 | 1 | 6 | Strong |
| De Sa and Ardern (2014) [73] | 2 | 2 | 1 | 1 | 6 | Strong |
| Mäki-Opas et al. (2016) [74] | 2 | 2 | 2 | 1 | 7 | Strong |
| Feng (2016) [75] | 0 | 1 | 1 | 1 | 3 | Weak |
| Built Environment Factors | Positive Relationship | Not Related | Negative Relationship | Overall Results | |
|---|---|---|---|---|---|
| A | B | ||||
| Residential density | [27] [29] [30] [33] [34] [50] [67] * [68] * | [26] [30] [30] [63] [64] | [30] [47] | 8/15 | P |
| Land use mix | [26] [38] * [38] * [46] [48] * [68] * [69] | [48] * [64] | 7/9 | P | |
| Street connectivity | [26] [27] [27] [36] [44] [46] [49] [50] [64] [67] * | [37] [63] [64] | 10/13 | P | |
| Retail land use | [34] [38] * [44] [48] * [50] | 5/5 | P | ||
| Walkability | [25] [28] [32] [35] [39] [39] [40] * [40] * [41] [42] [45] [51] m [52] [65] [66] | [25] [42] [51] f | 15/18 | P | |
| Street integration | [47] [52] | [49] | 2/3 | - | |
| Sidewalk | [25] [25] [32] [36] | [30] [63] | 4/6 | P | |
| Access to destinations | [26] [29] [30] [31] [32] [37] [38] * [38] * [43] [64] | [64] | [67] * | 10/12 | P |
| Traffic volume/speed | [30] [32] | 2/2 | - | ||
| Hilliness | [30] [50] [64] | 3/3 | - | ||
| Neighborhood aesthetics | [48] * | [30] [32] [43] | [67] * | 3/5 | O |
| Built Environment Factors | Positive Relationship | Not Related | Negative Relationship | Overall Results | |
|---|---|---|---|---|---|
| A | B | ||||
| Residential density | [68] * | [56] * [61] [63] | 3/4 | - | |
| Land use mix | [56] * [63] f [69] | [63] m | 3/4 | - | |
| Street connectivity | [53] [55] * [56] * [60] [67] * [69] | [63] | 6/7 | P | |
| Retail land use | [61] | 1/1 | - | ||
| Walkability | [54] [66] | [65] | 2/3 | - | |
| Sidewalk | [63] | 1/1 | - | ||
| Bicycle lane | [56] * [58] [58] [60] [61] [62] | [53] [61] [64] | 6/9 | P | |
| Access to destinations | [58] [59] | [56] * [58] [61] [67] * | 4/6 | N | |
| Traffic volume/speed | [57] | [62] | 1/2 | - | |
| Hilliness | [64] | 1/1 | - | ||
| Neighborhood aesthetics | [62] | [69] | [55] * [62] [67] * | 3/5 | N |
| Built Environment Factors | Positive Relationship | Not Related | Negative Relationship | Overall Results | |
|---|---|---|---|---|---|
| A | B | ||||
| Residential density | [70] [73] | 2/2 | - | ||
| Land use mix | [75] * | 1/1 | - | ||
| Street connectivity | [70] [75] * | 2/2 | - | ||
| Walkability | [71] | 1/1 | - | ||
| Sidewalk | [74] [75] * | 2/2 | - | ||
| Bicycle lane | [74] [75] * | 2/2 | - | ||
| Access to destinations | [70] [72] | 2/2 | - | ||
| Neighborhood aesthetics | [75] * | [73] | [72] [74] | 2/4 | - |
| Built Environment Factors | Reference | Result |
|---|---|---|
| Residential density | [30] |
|
| Land use mix | [48] |
|
| Street connectivity | [64] |
|
| Walkability | [25] |
|
| [42] |
| |
| Bicycle lane | [61] |
|
| Access to destinations | [58] |
|
| [64] |
| |
| Neighborhood aesthetics | [62] |
|
© 2017 by the authors. Licensee MDPI, Basel, Switzerland. This article is an open access article distributed under the terms and conditions of the Creative Commons Attribution (CC BY) license (http://creativecommons.org/licenses/by/4.0/).
Share and Cite
Wang, L.; Wen, C. The Relationship between the Neighborhood Built Environment and Active Transportation among Adults: A Systematic Literature Review. Urban Sci. 2017, 1, 29. https://doi.org/10.3390/urbansci1030029
Wang L, Wen C. The Relationship between the Neighborhood Built Environment and Active Transportation among Adults: A Systematic Literature Review. Urban Science. 2017; 1(3):29. https://doi.org/10.3390/urbansci1030029
Chicago/Turabian StyleWang, Luqi, and Chen Wen. 2017. "The Relationship between the Neighborhood Built Environment and Active Transportation among Adults: A Systematic Literature Review" Urban Science 1, no. 3: 29. https://doi.org/10.3390/urbansci1030029
APA StyleWang, L., & Wen, C. (2017). The Relationship between the Neighborhood Built Environment and Active Transportation among Adults: A Systematic Literature Review. Urban Science, 1(3), 29. https://doi.org/10.3390/urbansci1030029