Article

The Urban Heat Island Effect in the City of Valencia: A Case Study for Hot Summer Days

1
Centre for Climate Change (C3), Department of Geography, Universitat Rovira i Virgili, 43480 Vilaseca (Tarragona), Spain
2
Global Change Unit, Image Processing Laboratory, Parc Científic Universitat de Valencia, 46980 Paterna, Spain
*
Author to whom correspondence should be addressed.
Urban Sci. 2017, 1(1), 9; https://doi.org/10.3390/urbansci1010009
Submission received: 21 December 2016 / Revised: 2 February 2017 / Accepted: 8 February 2017 / Published: 16 February 2017
(This article belongs to the Special Issue Urban Thermal Environment under Global Warming Pressure)

Abstract

:
Extreme heat poses significant risks to the world’s growing urban population, and the heat stress to human health is likely to escalate with the anthropogenically increased temperatures projected by climate models. Thus, the additional heat from the urban heat island (UHI) effect needs to be quantified, including the spatial pattern. This study focuses on the city of Valencia (Spain), investigating the intensity and spatial pattern of UHI during three consecutive hot summer days accompanying a heat record. For the analysis, long-term in situ measurements and remote sensing data were combined. The UHI effect was evaluated using two approaches: (a) based on air temperature (AT) time-series from two meteorological stations and (b) using land surface temperature (LST) images from MODIS products by NASA with 1 km resolution. The strongest nighttime UHI estimated from AT was 2.3 °C, while the most intense surface UHI calculated as the difference between the LST of urban and rural regions (defined by NDVI) was 2.6 °C—both measured during the night after the record hot day. To assess the human thermal comfort in the city the Discomfort Index was applied. With the increasing number of tropical nights, the mitigation of nighttime UHI is a pressing issue that should be taken into consideration in climate-resilient urban planning.

1. Introduction

Cities are hotspots of climate change due to the increasing frequency and intensity of extreme heat and the rapidly growing urban population, which are mutually reinforcing trends [1]. The well-documented phenomenon of the urban heat island (UHI) effect refers to cities being warmer than their rural surroundings because of the built environment absorbing, retaining, and/or producing more heat than the natural landscape it replaces [2]. The UHI intensity is greatest at night, and it may disappear by day or the city may be cooler than the rural environments [3]. The effect has been mainly described in large cities and towns with high concentration of populations, nevertheless, even rural-villages—small built-up urban areas—can have considerably higher temperatures than their surroundings as a recent study showed [4].
Increasing urban heat presents a significant health risk for the growing population of cities [5] and the related heat stress is likely to escalate with the increased future temperatures projected by climate models [6]. As urban heat islands pose an additional risk to urban inhabitants [7], spatial heat risk assessments are carried out worldwide to identify the most vulnerable segments of the urban population [8,9,10]. Excessive heat negatively influences not only human health [11]—including increasing mortality rates due to heat stress [12] and more frequent insomnia events during hot nights [13]—but it has an impact on the labour productivity [14] and the urban metabolism as well [15,16]. As evidence suggests [17,18] there are upper limits to human adaptation to temperature. It is, therefore, important to measure the consequences of increased temperature, and provide precise information to urban planners to reduce heat risk in the city [19,20,21]. Identifying the additional heat risk components and understanding the causes of intra-urban variability of the thermal environment [22] is a first step in improving urban planning and development. As [23] pointed out, urban climate knowledge is much needed all along the urban planning process, and climatologists should meet the planners’ demand-driven needs by providing them with good arguments, suitable methods and tools.
The UHI is traditionally defined as the difference between the air temperature (AT) within the city and the AT of its surroundings, measured in the urban canopy layer (at standard screen height 1–2 m above ground and below the city’s mean roof height) [24]. The phenomenon can also be studied via land surface temperatures (LST) due to the increased spatial coverage that satellite remote sensing techniques can provide in comparison to weather station data [25]. When the urban heat island effect is estimated from LST measurements it is called surface UHI (sUHI), and usually has a different magnitude than the UHI. This human-induced modification of the local climate is principally caused by alterations to the energy balance influenced by variations of landuse, surface properties (e.g., surface roughness, albedo, emissivity) and geometry of the urban area [2,8]. The heating-cooling systems of buildings, as well as the vehicles in traffic also promote warmer thermal environment in cities [26]. The cumulative effect of these factors can result in a maximum air UHI of significant magnitude as large as 7 °C in London [27] or 8 °C in New York [28]. UHI research was carried out in more than 17 cities over the Iberian Peninsula in the 1990s [29] finding a maximum intensity of 8–9 °C in Madrid [30], 8 °C in Barcelona [31], and 5 °C in Zaragoza [32].
The present work combines both methods, thermal remote sensing techniques and in situ meteorological observations, to measure the urban heat island over the city of Valencia. As the Valencian summer is characterized by humid heat that makes hot weather less comfortable, it is important to understand the evolution of UHI that imposes even higher heat stress on the urban environment. An early study on the heat island effect of Valencia [33] examined the phenomenon in relation to human comfort in the city in the late 1980s, to express the need for more environmentally-conscious urban planning. A measurement campaign carried out in the same year found significantly higher temperatures in the inner city—based on AT transect measurements by car (+3 °C) and LST values from NOAA satellite thermal images (+4.5 °C)—during two winter nights [34]. Furthermore, a recent work [35] provides useful insights into the landuse changes in the metropolitan area of Valencia during the last 3 decades that shows a rapid expansion of the urban areas, leading to an increase of ca. 8000 ha of artificial surfaces.
Realising the growing demand on urban climate and spatial thermal comfort information for climate change adaptation planning in Valencia, our aim is to analyse the intensity, spatial extent and evolution of the UHI during hot summer days. As the positive temperature contrast between the city and its surroundings tend to be the largest after sunset, and strong UHI nights impose more severe heat stress on the human body [11,13], the main focus of the paper is the nighttime UHI. In order to evaluate the urban climatological context, long-term historical data were also analysed. Furthermore, to facilitate the involvement of UHI in urban adaptation strategies the more favorable and less pleasant parts of the city are identified using the Discomfort Index [36]. Finally, the study aims at providing recommendations to advance integrated climate-resilient urban planning.

2. Materials and Methods
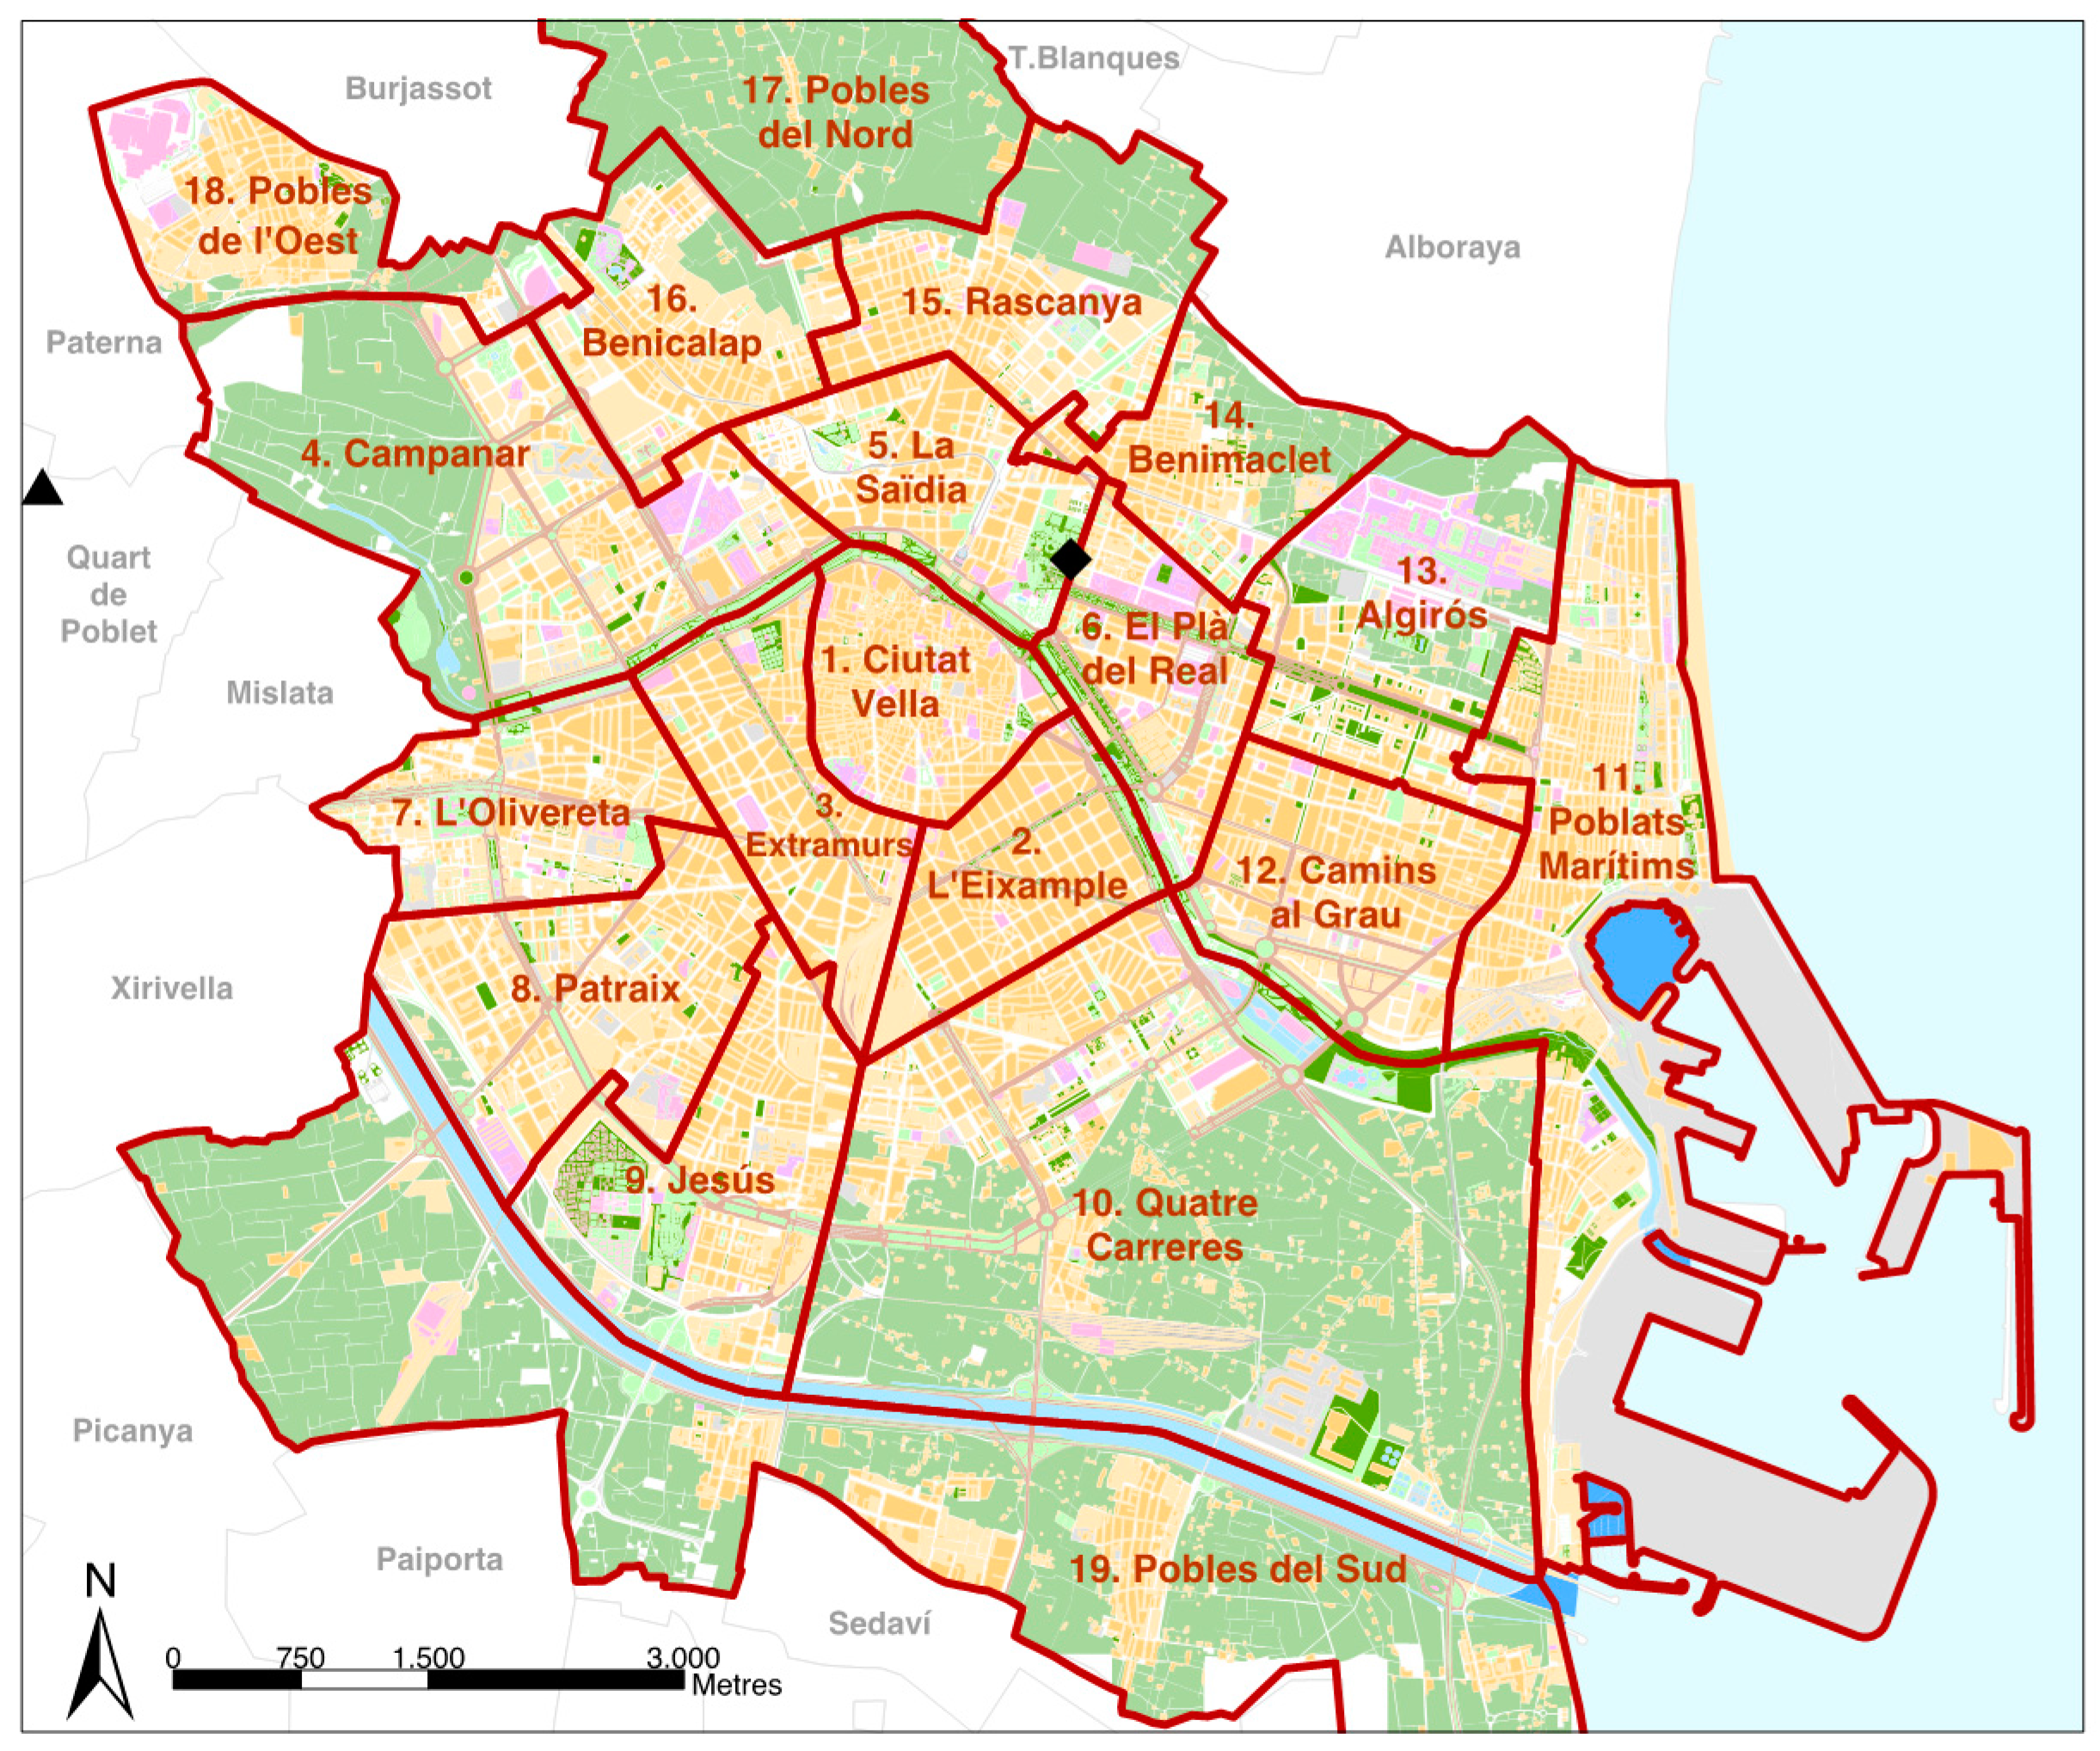
2.1. Study Area

The metropolitan area of Valencia is the third largest conurbation in Spain. The city of Valencia has 787,266 inhabitants, distributed over an area of 137.5 km2, with a population density of around 7966 inhabitants/km2 (Figure 1) [37]. The city is located on the Spanish Mediterranean coast on a small alluvial plain formed during the Quaternary by the carriage of the Turia River. The flat relief has a maximum E-W increase in height of 40 m from the sea to the beginning of alluvial fan [34]. The geographical area of the city can be characterized by sub-arid Mediterranean climate with “hot dry-summers” (Csa according to the updated Köppen-Geiger climate classification [38]). The dominant local wind flows perpendicular to the shoreline (E-W) and shows a typical daily periodicity of a sea-breeze. Sunshine duration is 2660 h per year, with an average above 10 h per day in July [39].
The city is distributed into 19 districts with very different characteristics regarding both the building density and height, as well as green areas. The continuous urban surface extends over 36.3 km2, while green surfaces cover more than 4.5 km2, to which gardens contribute with 2.5 km2, urban parks with 0.6 km2 and the Turia riverbed with 1.2 km2 [40]. Valencia went through a star-shaped growth in the last few decades as it has spread over the surrounding farmland and has absorbed several small towns and villages nearby (e.g., Campanar—District 4). Thus, the type of urban area greatly varies throughout the city, from the ancient central nucleus (Ciutat Vella—District 1) which is densely urbanized (only small urban parks can be found here), to the outskirts of the city where a few farmland areas still remain within the city borders [34]. This unique farmland called “Huerta” is a socio-cultural heritage that organically connects the traditional agriculture to the urban metabolism. During the urban expansion in the second part of the 20th century the “Huerta” was reduced to a belt around the city consisting of small farms and vegetable gardens with dispersed habitat dedicated to crops, mainly green vegetables [34,40].

2.2. Climatological Data

The study area of Valencia has only one long-term weather station (Viveros, AEMet ref. 8416, N 39°28′50″ W 0°21′59″; 11 m) within the city limits despite its size, and another one in the suburbs (Airport, AEMet ref. 8414A, N 39°29′06″ W 0°28′29″; 56 m) that could provide reliable and sufficiently long data for the study. For the Viveros station the data were obtained from the SDATS homogenized dataset, provided by the Centre for Climate Change [41], and for the Airport station the data were retrieved from the AEMet (Agencia Estatal de Meteorología) database [39]. The Viveros station is located ca. 1 km from the old city centre, at the side of a green park and next to a main road and high built residences. The airport is ca. 10 km away from downtown, in the outskirts of Valencia, at the edge of a small town which is a medium dense built-up area. The instruments are placed in the open field over bare soil, with few asphalt surfaces nearby (ca. 200 m). The Airport station is significantly further away from the sea than the urban station, which can lead to higher temperatures especially in the mornings and early afternoon, as the sea breeze front only reaches a few km inland. Air temperature measurements at both stations are taken at 2 m in standard Stevenson shelter. Daily maximum and minimum temperature (Tmax, Tmin) data series of Viveros cover more than a century (1906–2014), while the Airport extends between 1966 and 2014. As the latter station is not included in the SDATS dataset, thorough quality control and homogenisation procedures were carried out using best practice software RClimDex-extraQC [42] and HOMER (HOMogEnization software in R) [43] before analysing the time series. Furthermore, in order to evaluate the meteorological conditions during the studied 3-day period in August 2014, hourly temperature (AT), relative humidity (RH) as well as wind speed and wind direction data were involved into analyses from both stations, provided by the AEMet. For the long-term evaluation of the nighttime heat conditions in Valencia, the annual number of tropical nights (Tmin > 20 °C) defined by the ETCCDI (Expert Team on Climate Change Detection and Indices) [44] was calculated.

2.3. Remote-Sensing Data
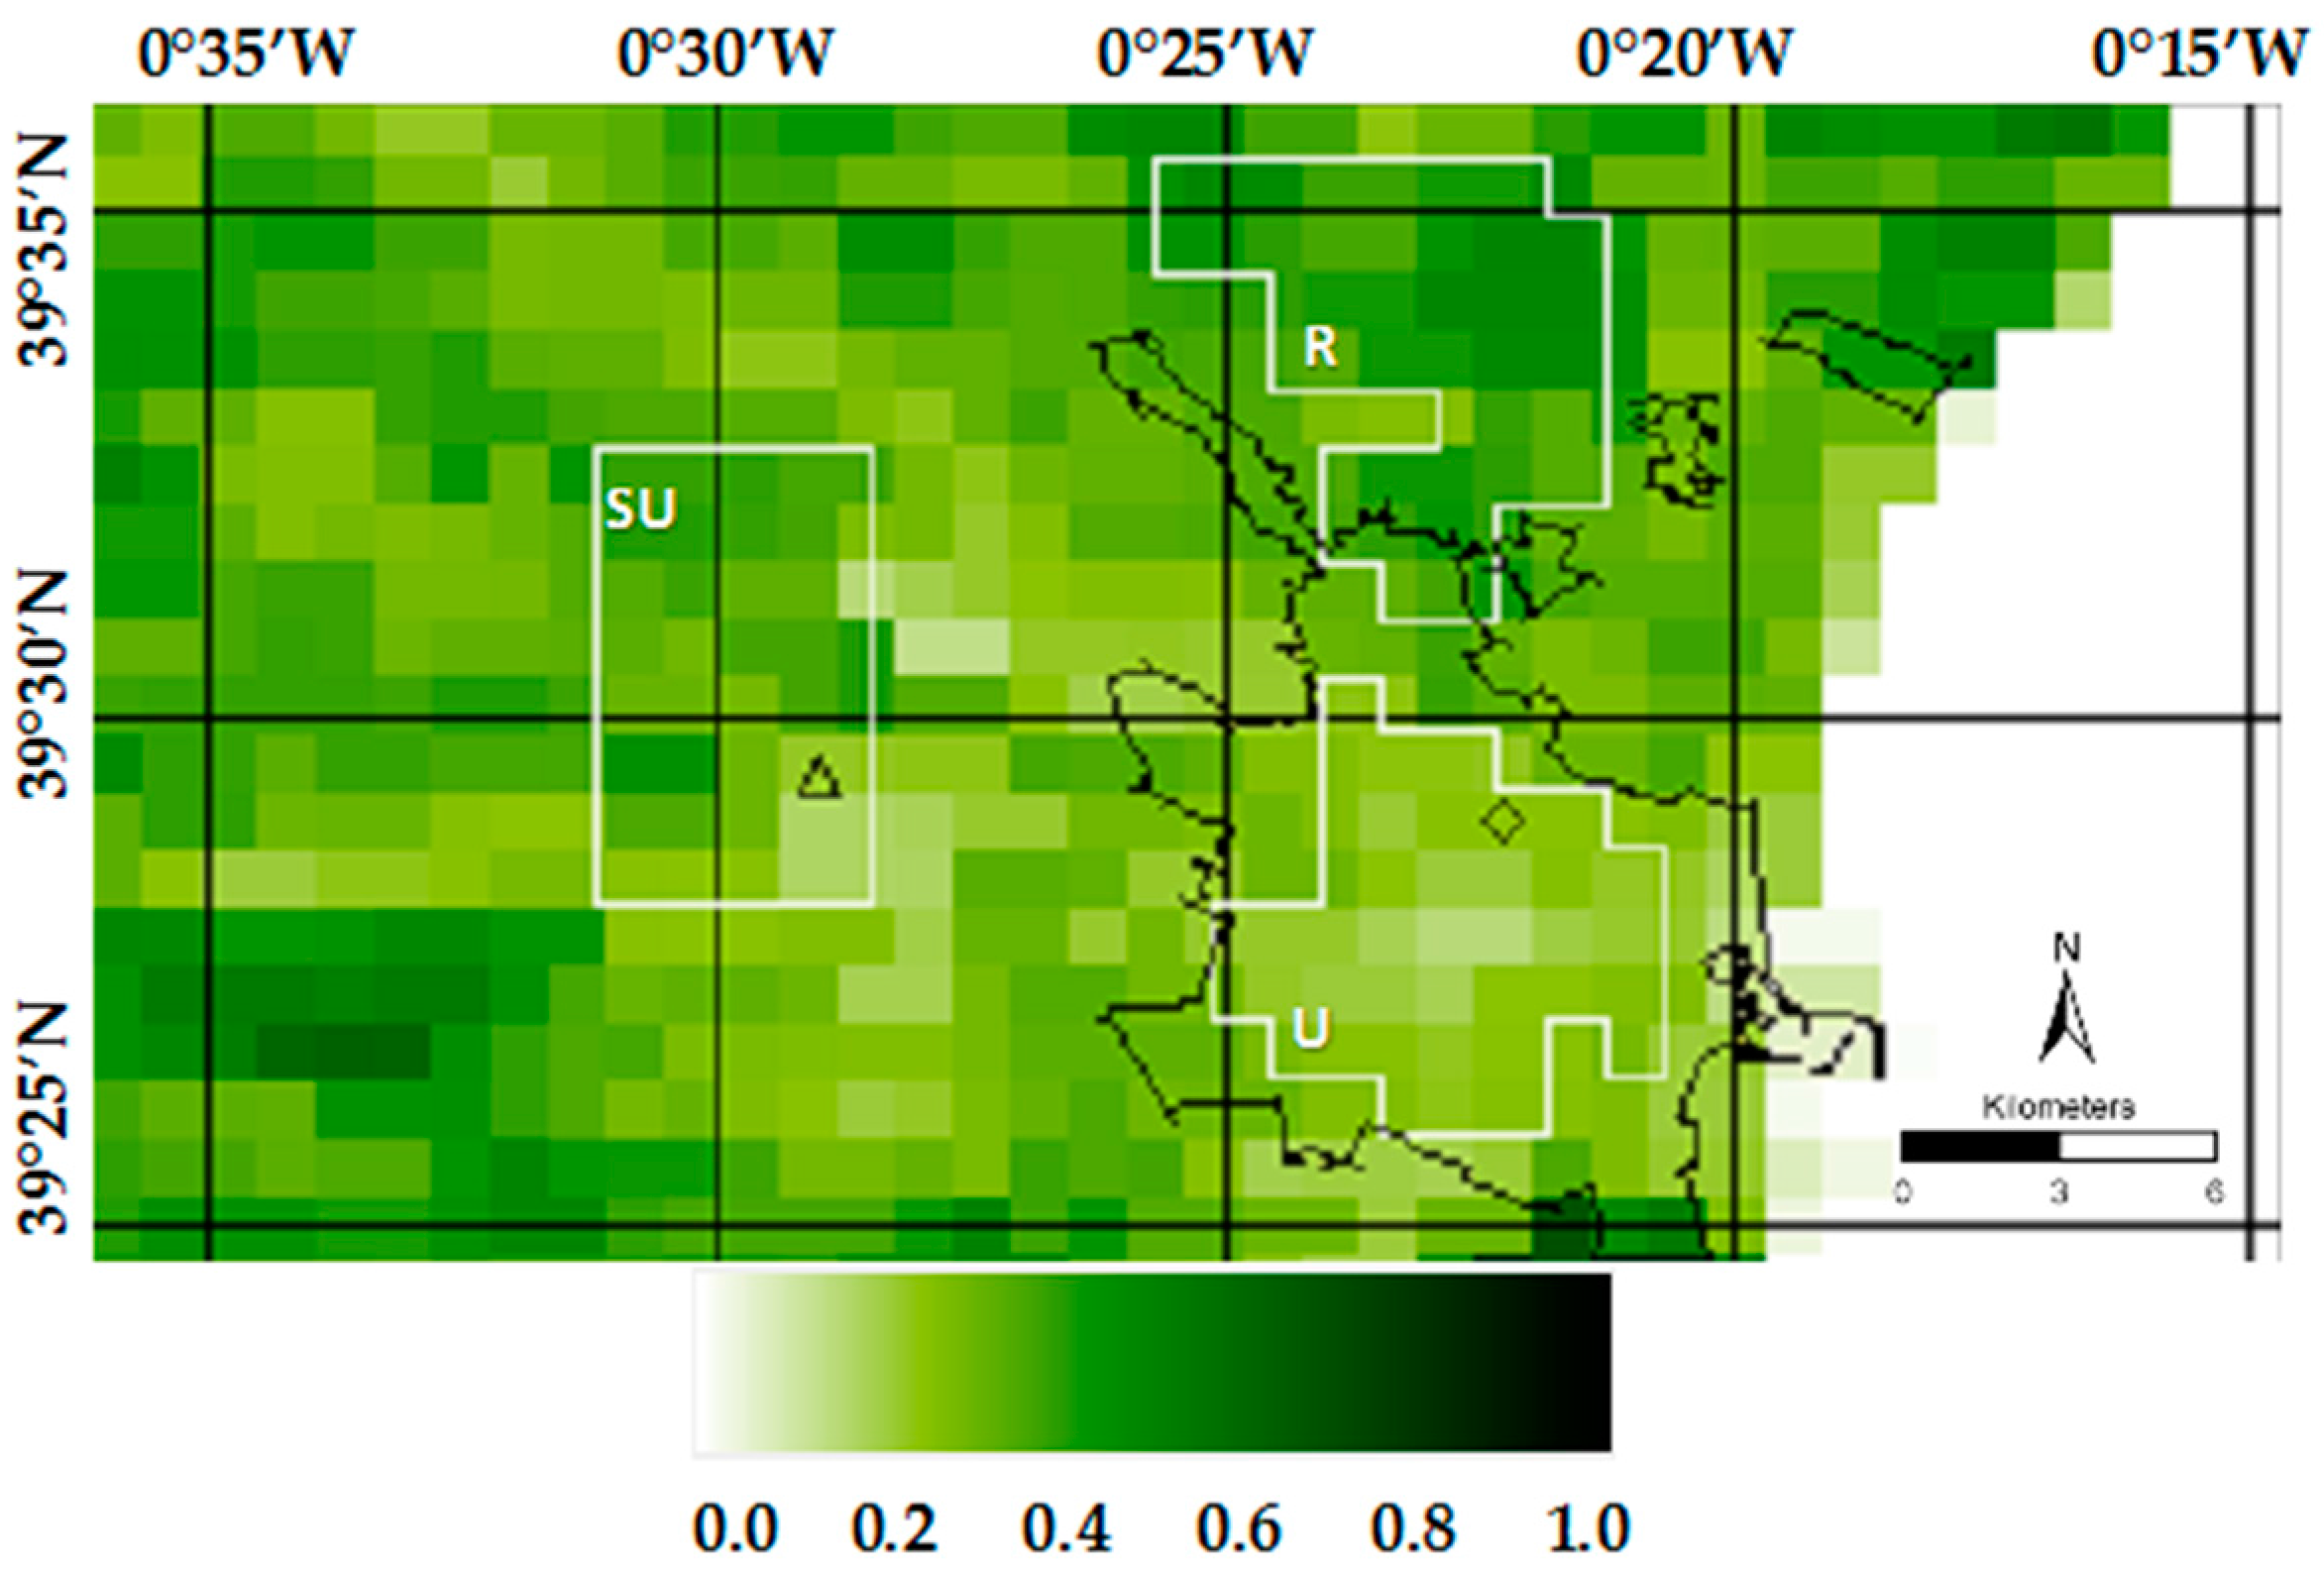
The MODerate resolution Imaging Spectroradiometer (MODIS) sensor was deemed to be the most suitable for this study for different reasons. The MODIS sensor is carried on both NASA’s Aqua and Terra satellites that have near polar orbits resulting in three images per satellite per day. Image acquisition on Aqua is two per night and one per day and on Terra is vice versa. This is a high temporal resolution, meanwhile the spatial resolution is only ca. 1 km that is considered coarse compared to other alternatives such as the Advanced Thermal Emission and Reflection Radiometer (ASTER), the Landsat series as Enhanced Thematic Mapper Plus (ETM+) or the Thermal Infra-Red Sensor (TIRS), all of which have spatial resolutions below 100 m. However, the number of images available from ASTER or Landsat is significantly less than MODIS, and in our case there were hardly any images suitable. A strength of the MODIS sensor is the compromise between regular image acquisition and reasonable spatial resolution, in comparison to other sensors that offer higher spatial resolution but lower temporal resolution (e.g., Landsat), or higher temporal resolution but lower spatial resolution (e.g., SEVIRI) [45]. In spite of the coarse resolution (ca. 1 km) of the MODIS LST product, the high temporal resolution of MODIS makes it reasonable for UHI studies [45,46].
The MODIS data are available from the EOSDIS Reverb ECHO—NASA [47] and useful land surface temperature (LST) products include MYD11 (Aqua) and MOD11 (Terra) at 1 km resolution. As MODIS data have a limited number of useful images (clear sky conditions and not too high zenith angle of the observing sensor are needed), detailed study of the development of UHI can be carried out in a limited number of consecutive days. Potential cases have been selected by analysing the nighttime heat conditions of the summer semester (May, June, July, August, September), by highlighting the days when the Tmin exceeded the 90th percentile of the MJJAS daily data calculated on the base of 109 years. Accordingly, a 3-day period of August 2014—with a record hot day in the middle of the period—was chosen based on the climatological criteria and the availability of MODIS images. Eleven MODIS products (two MODIS images from both satellites for day and night) were eligible for the study as these products provided LST data with moderate bias due to the image acquisition angle. The thermal products were obtained directly from the NASA, then they were georeferenced and multiplied by the MOD11 scaling factor of 0.02. Depending on the angle of image acquisition, the error was between 1.5–2 °C, as [48,49] described it.

2.4. NDVI

Three regions (Urban, Semi-Urban and Rural) were determined to calculate the surface UHI (sUHI) across Valencia. The areas with human constructions and areas covered with vegetation were distinguished according to the NDVI (Normalized Difference Vegetation Index) (Figure 2). The index was calculated using the infrared and red bands of the Terra satellite thermal image on 26th of August 2014. The Urban area (U) (NDVI ≤ 0.20) is a relatively homogenous built up area considering the resolution of MODIS image, where the average NDVI value was 0.18 (SD = 0.02). The western zone indicates a Semi-Urban (SU) inhomogeneous area around the airport, with a mixture of rural and urban surfaces (NDVI ≈ 0.26; SD = 0.06). The relatively homogenous Rural area (R) north from the city (NDVI > 0.27) had the highest NDVI, an average of 0.34 (SD = 0.04). The three regions were chosen to have equal areas of 34,020 km2 (including 40 pixels).

2.5. Discomfort Index

Although there are many complex and multi-variant based methods for determining bioclimatic comfort, one of the best indices for estimating the effective temperature is the DI index [50], also known as Thom’s discomfort index (THI) [36]. This index is based on the effective temperature and humidity conditions and describes the degree of discomfort by categories covering the whole spectrum from cold to tropical climates. DI is defined as
DI = AT − (0.55 − 0.0055 f) (AT − 14.5)
where AT is expressed in °C and f stands for relative humidity in percentage.

3. Results

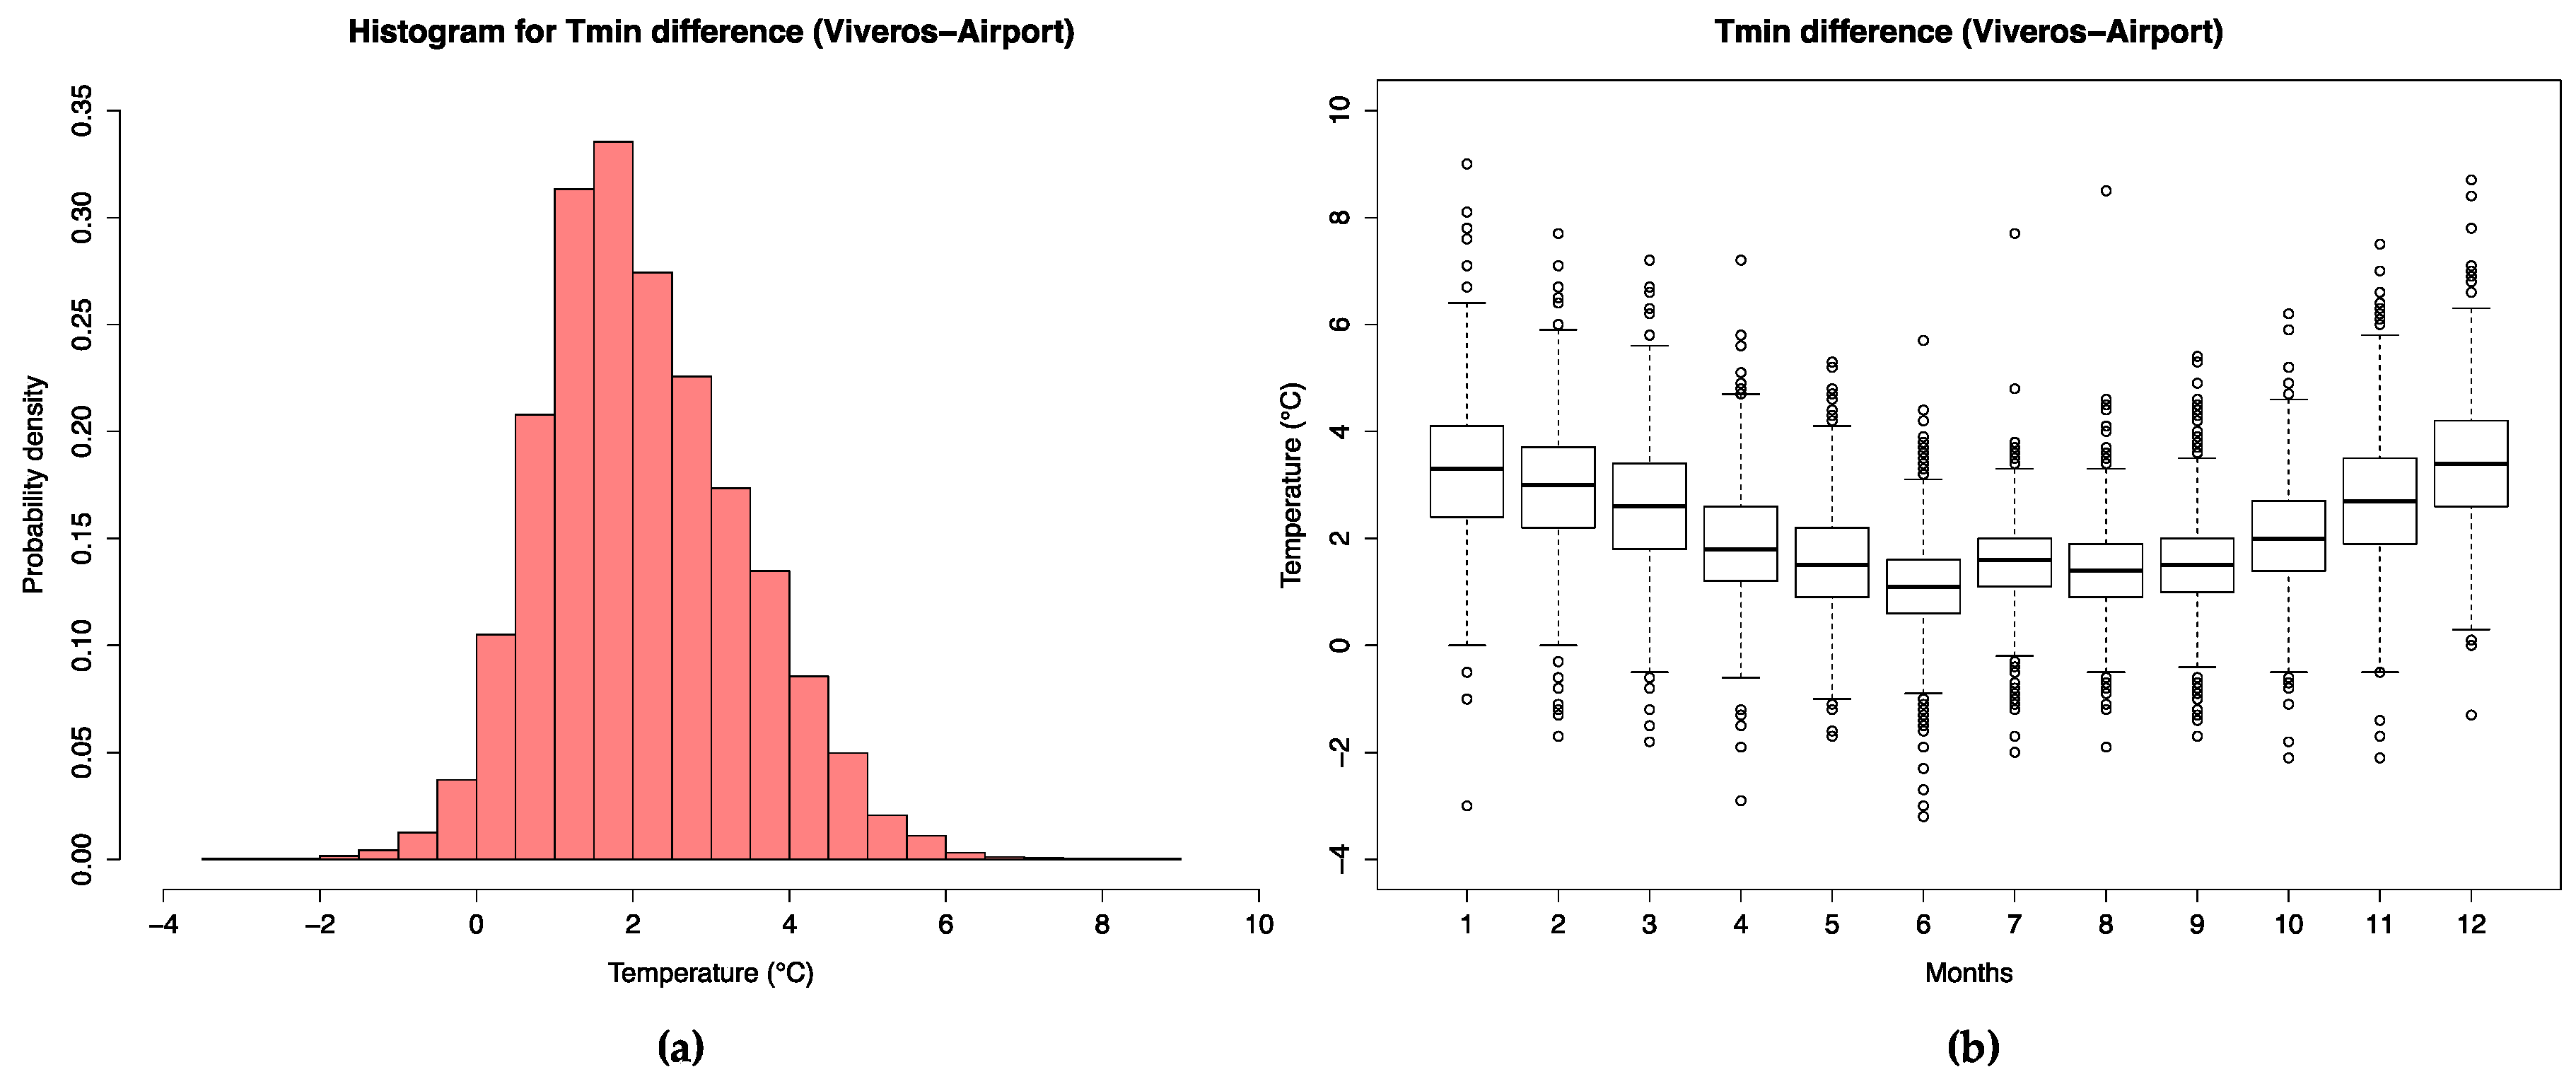
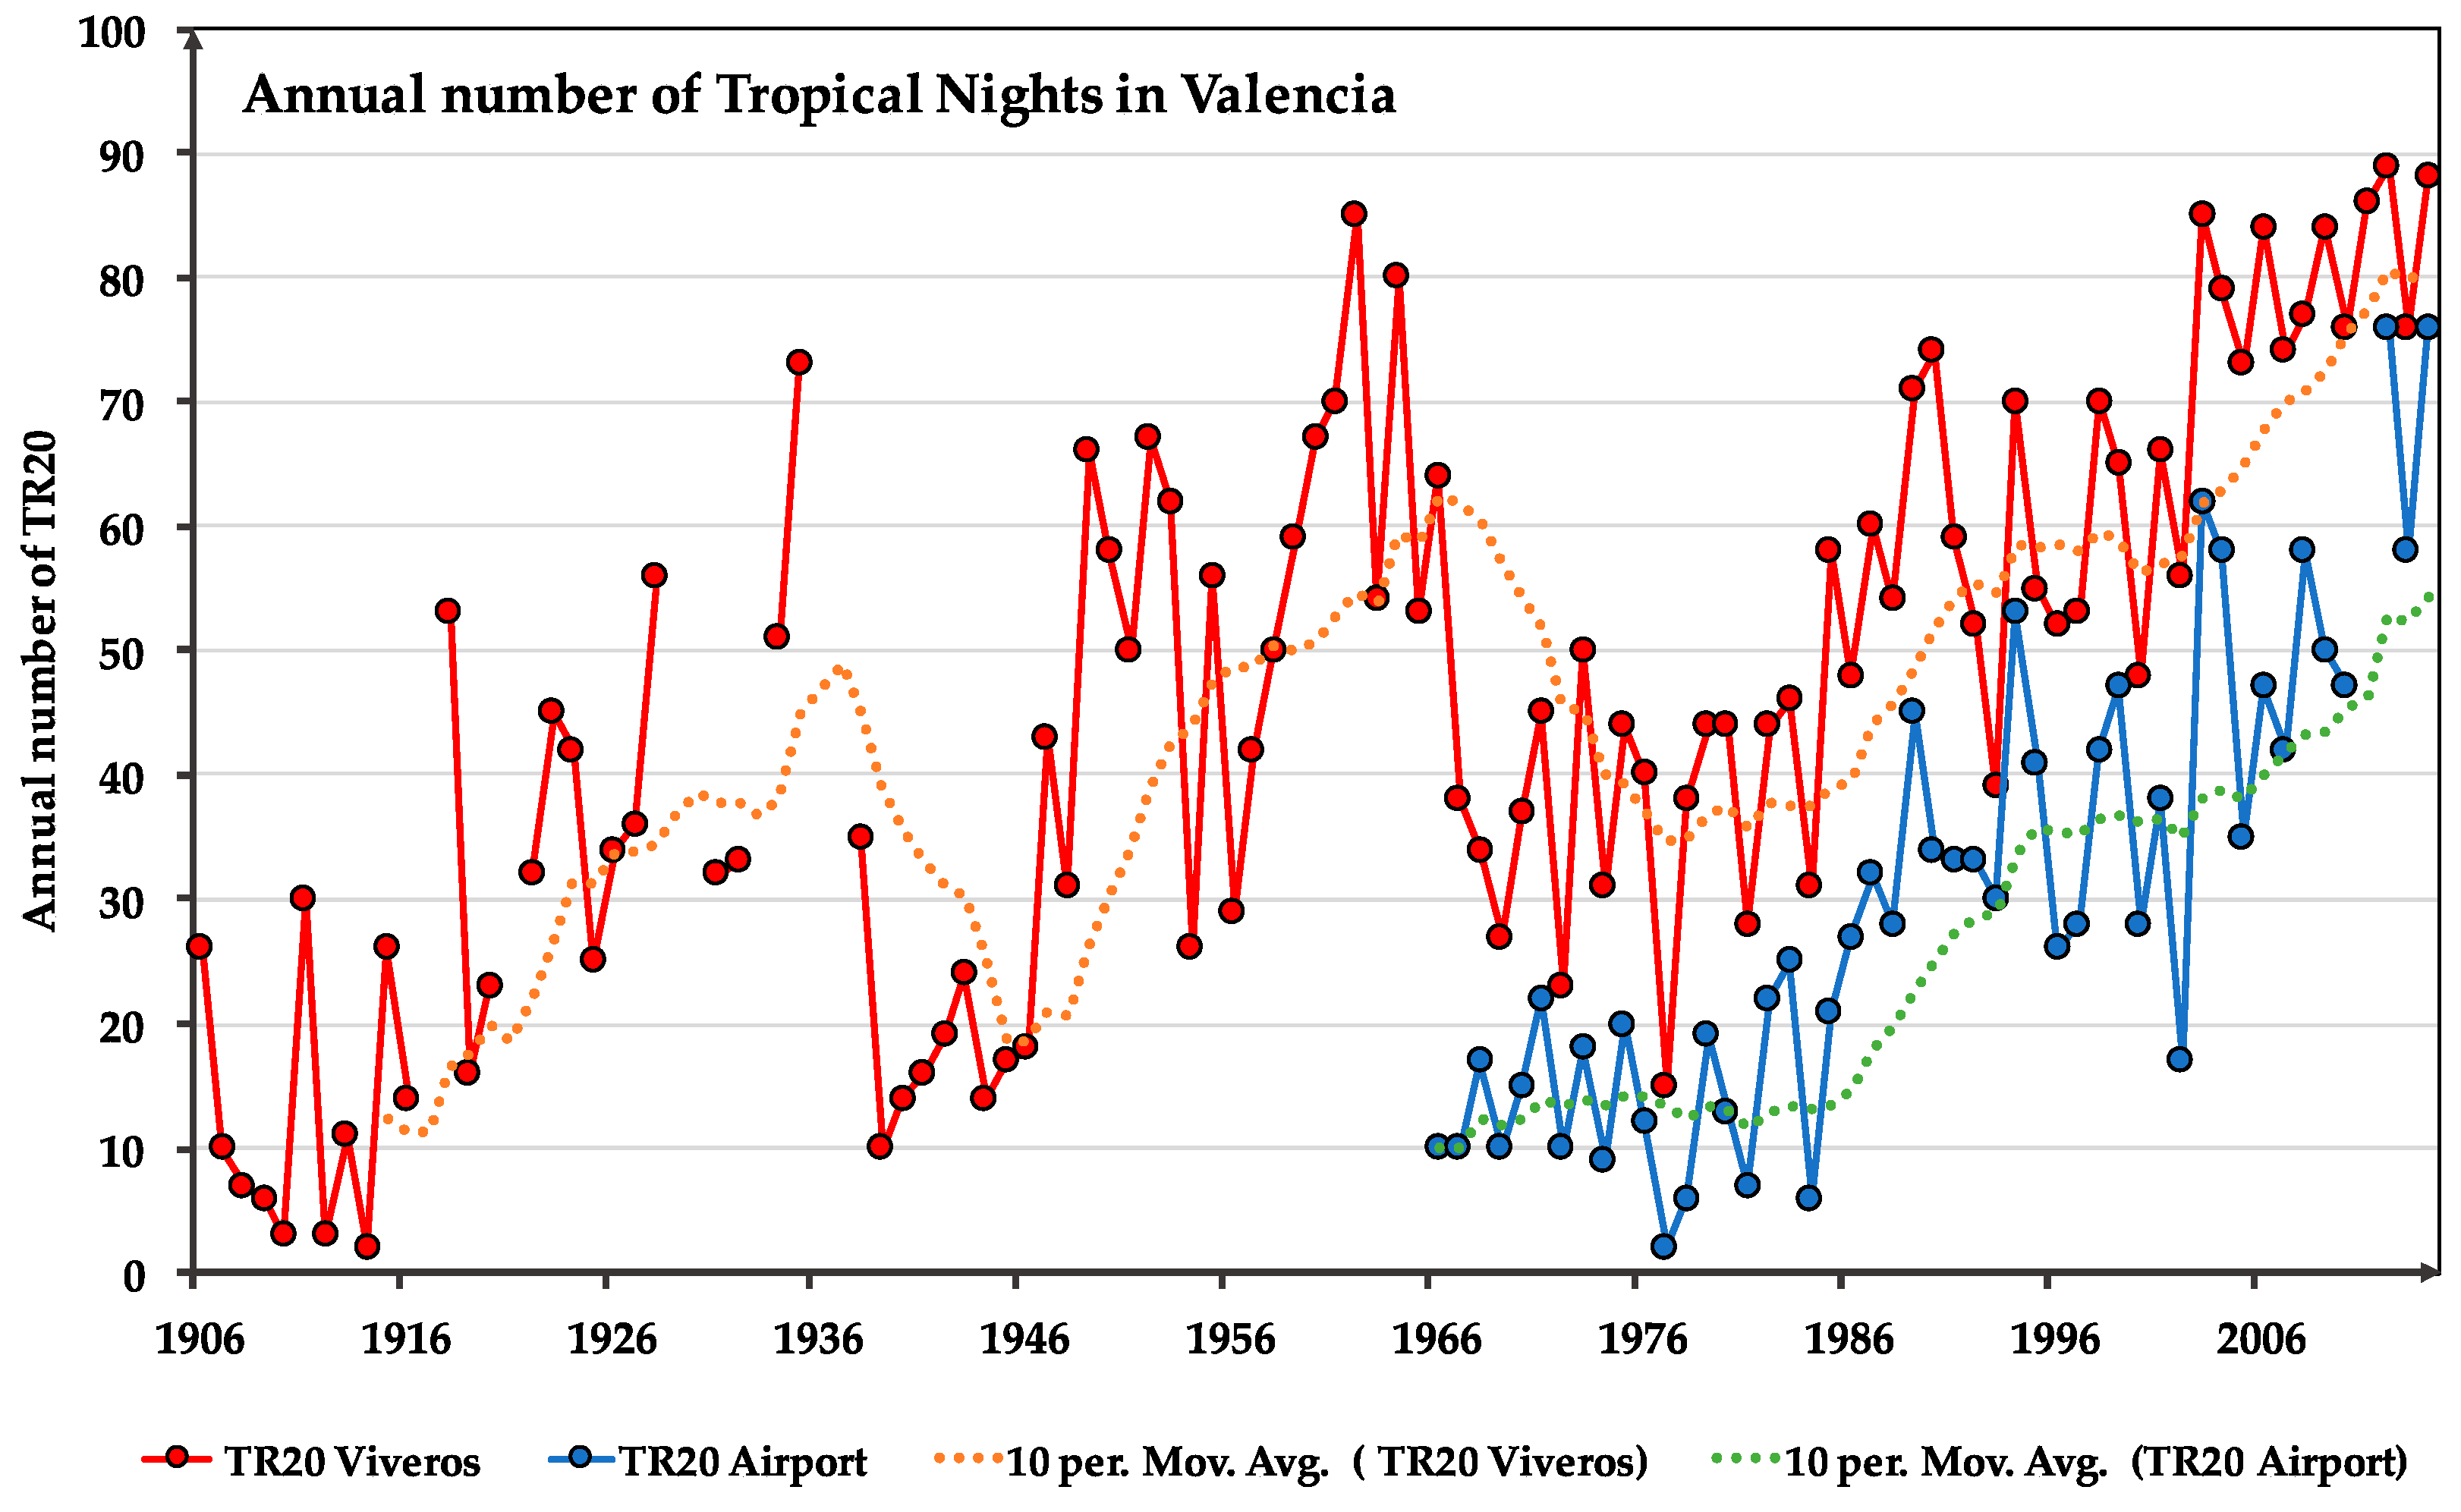
3.1. The Long-Term Estimation of Nighttime UHI and Tropical Nights

To describe the nighttime temperature conditions in Valencia from a long-term climatological perspective, 5 decades (1966–2014) of daily minimum temperature (Tmin) records were analysed. As the positive AT contrast between the urban and rural areas tends to be the largest in the late night–early morning hours, the daily Tmin can be used as an indicator of the general heat conditions of the night. Thus, a rough estimate can be given for the nighttime UHI by calculating the difference of Tmin time series at the two meteorological stations.
As shown in Figure 3a, the intensity of the estimated nighttime UHI was most frequently between +1.5 and +2.0 °C, and even reached +9.0 °C on the 26th of January 1978. Furthermore, the most intense positive contrast between the city centre and the airport usually occurred in the cold half of the year, especially in December and January (Figure 3b). During summer (MJJAS) the average value was +1.4 °C (SD = 3.0 °C), however negative values also occurred. The two “extreme” outlier values in the summer (8.5 °C, 7.7 °C) were recorded in the early morning on days with summer storms with precipitation of 26.5 mm and 123 mm, respectively. The annual number of tropical nights (Tmin > 20.0 °C) significantly increased at both stations, at the Airport from 10 to 76 between 1966 and 2014 (slope of linear trend: 1.12 per year), at Viveros from 64 to 88 between 1906 and 2014 (slope of linear trend for 11 decades: 0.48, for the last 5 decades: 1.10 per year) (Figure 4). Interestingly, despite the growth of the city, the trend in tropical nights was similar in the urban and the rural stations, suggesting that the nighttime UHI intensity has not increased significantly in the last 5 decades.

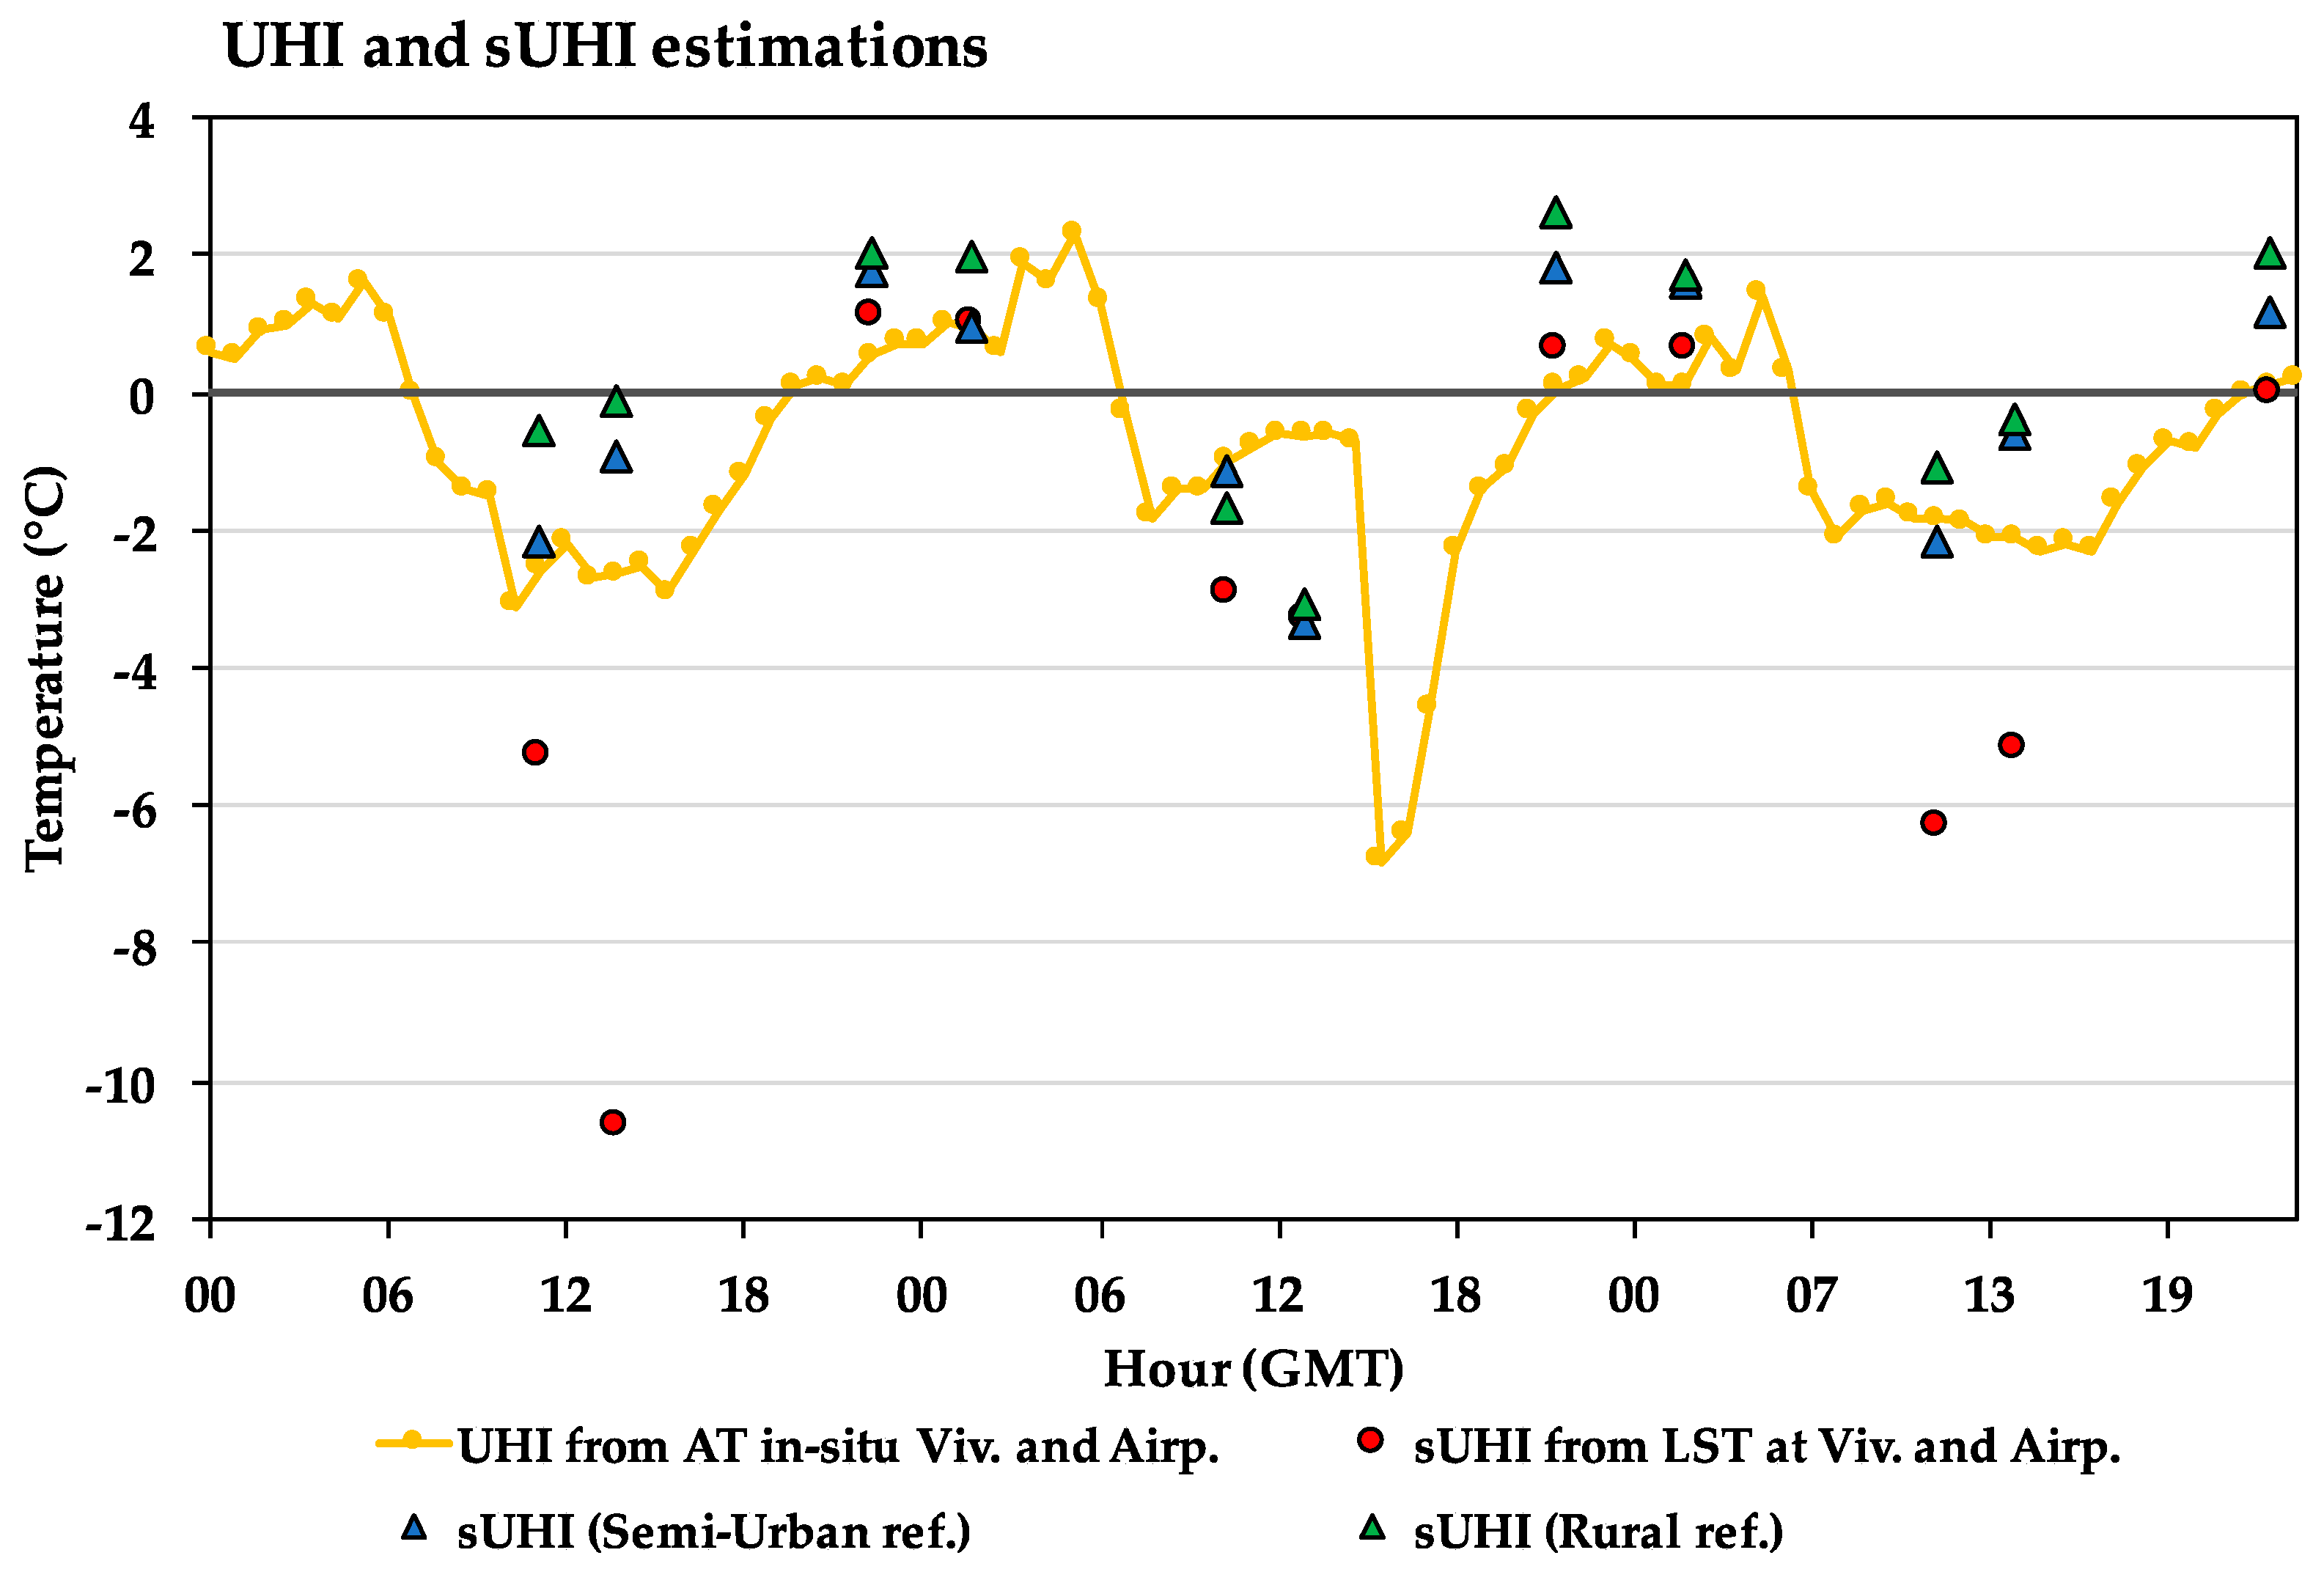
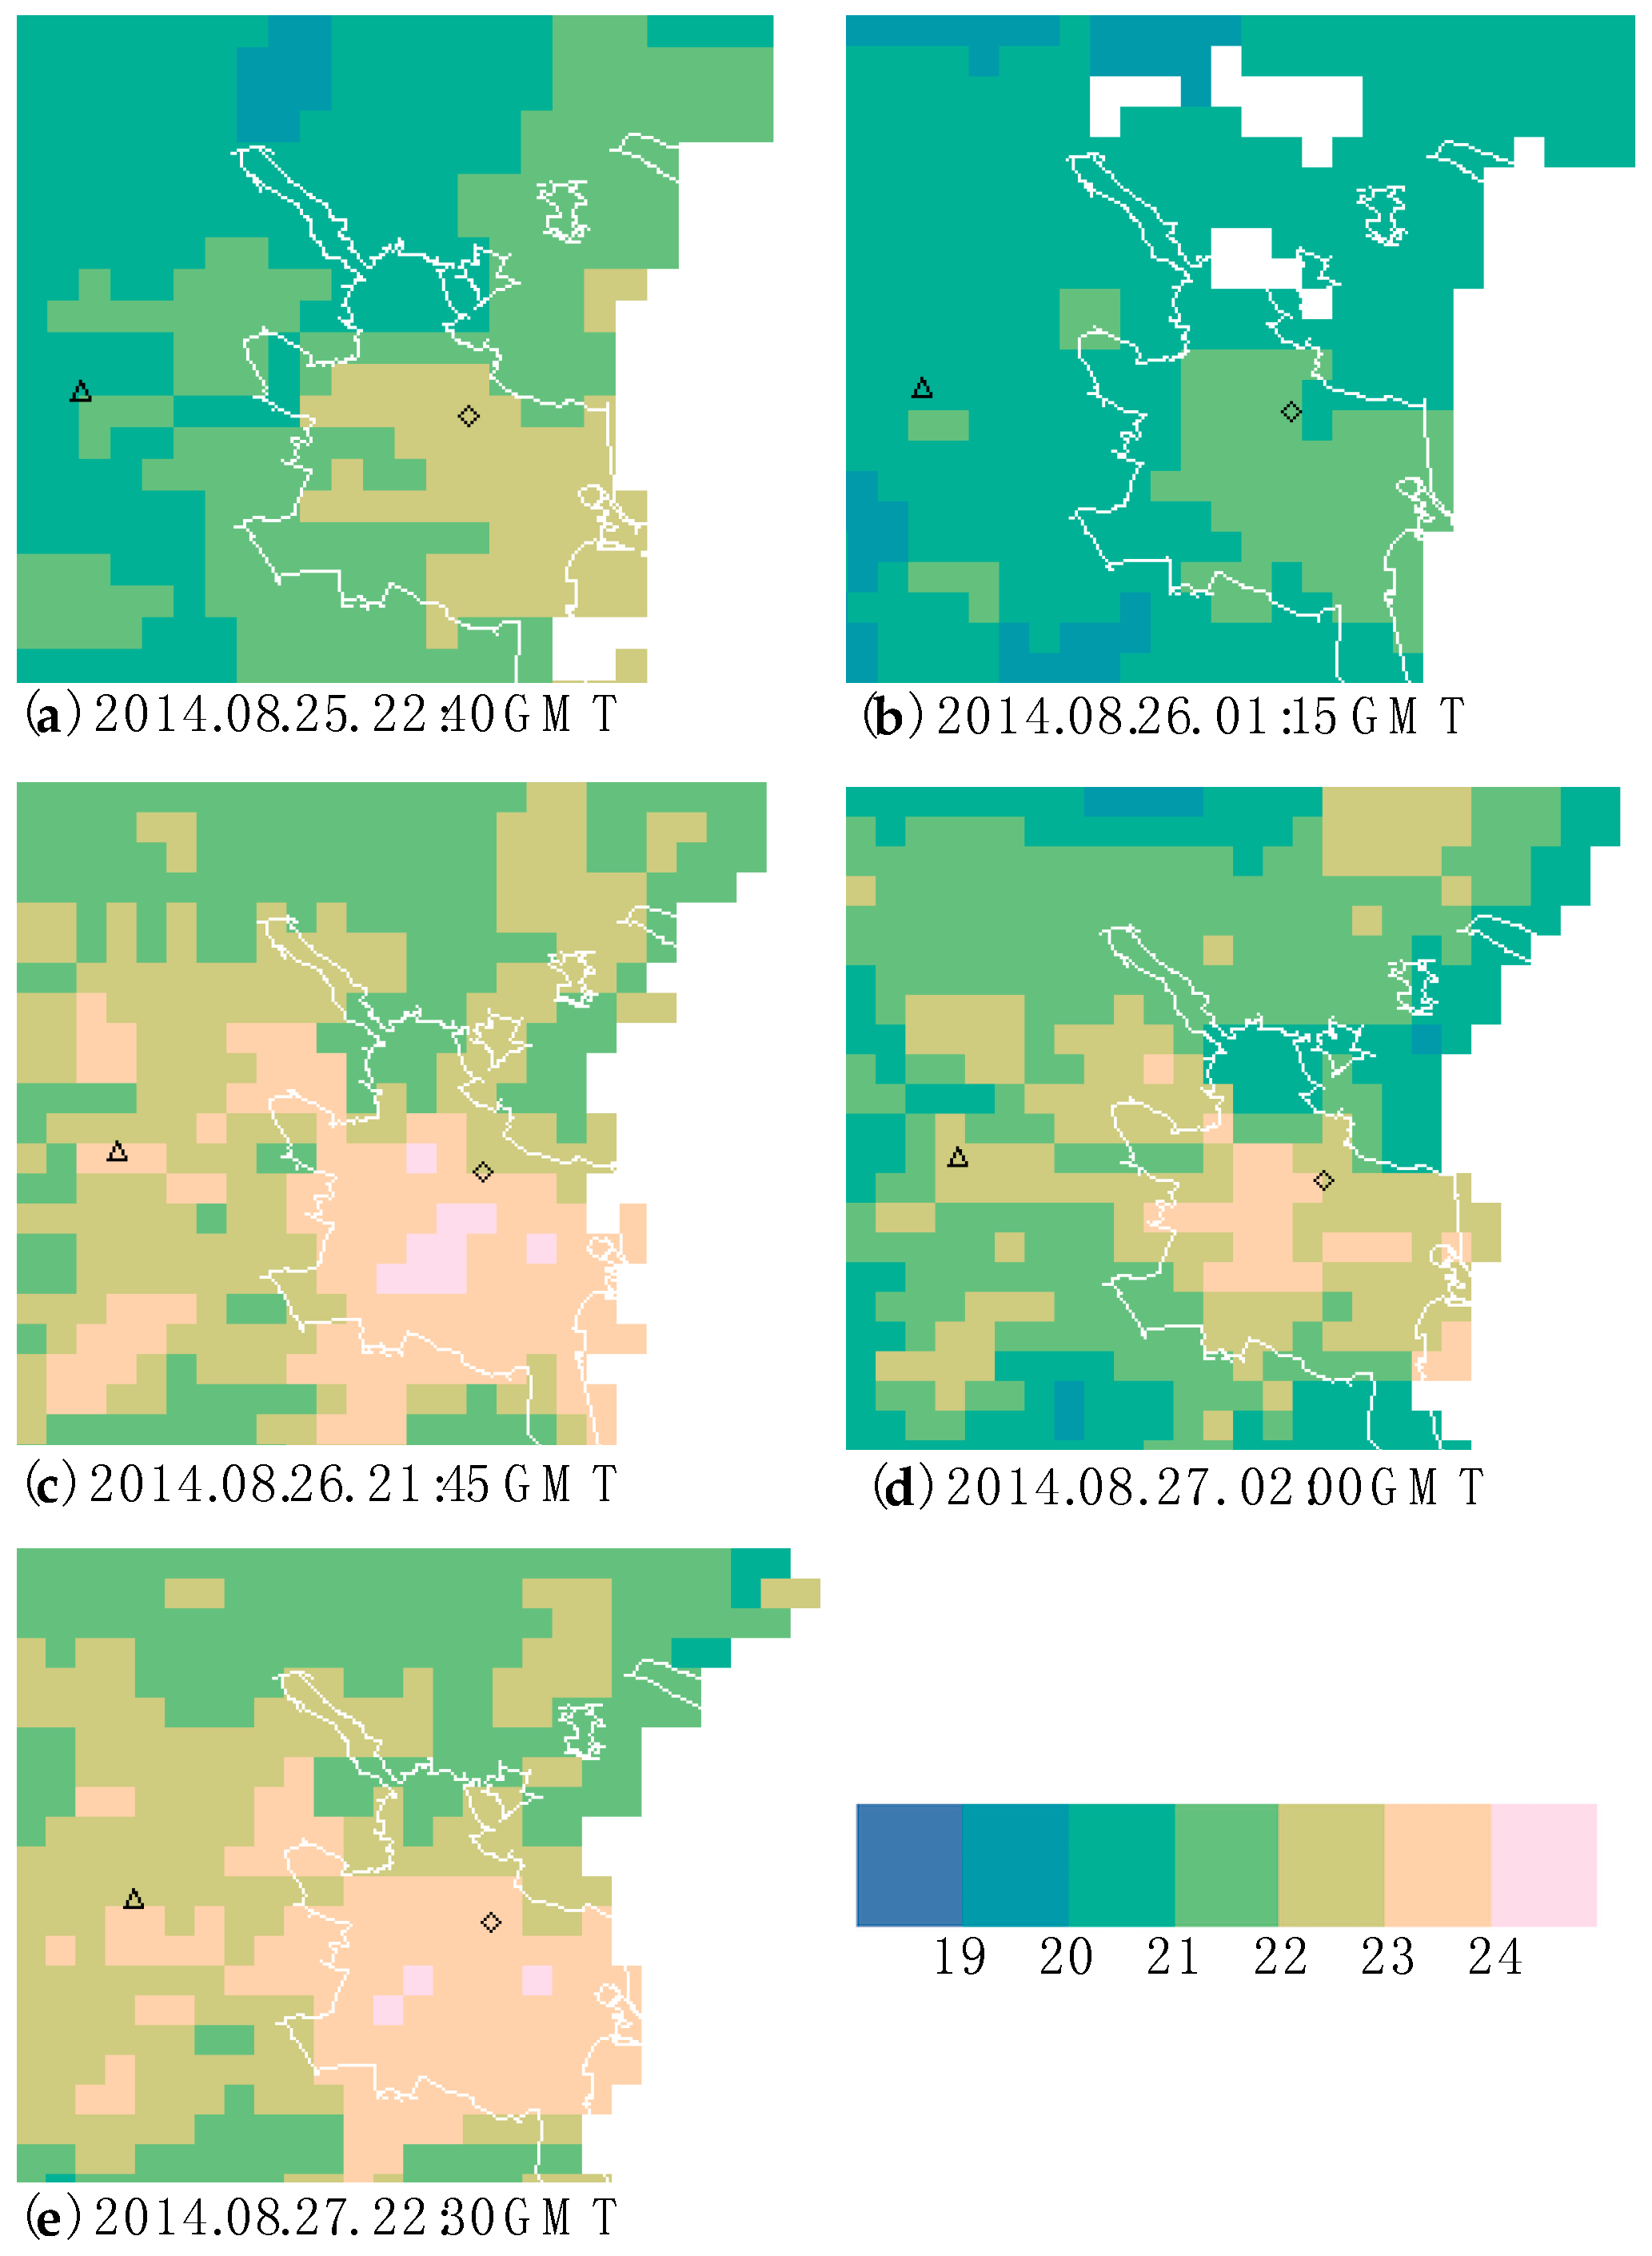
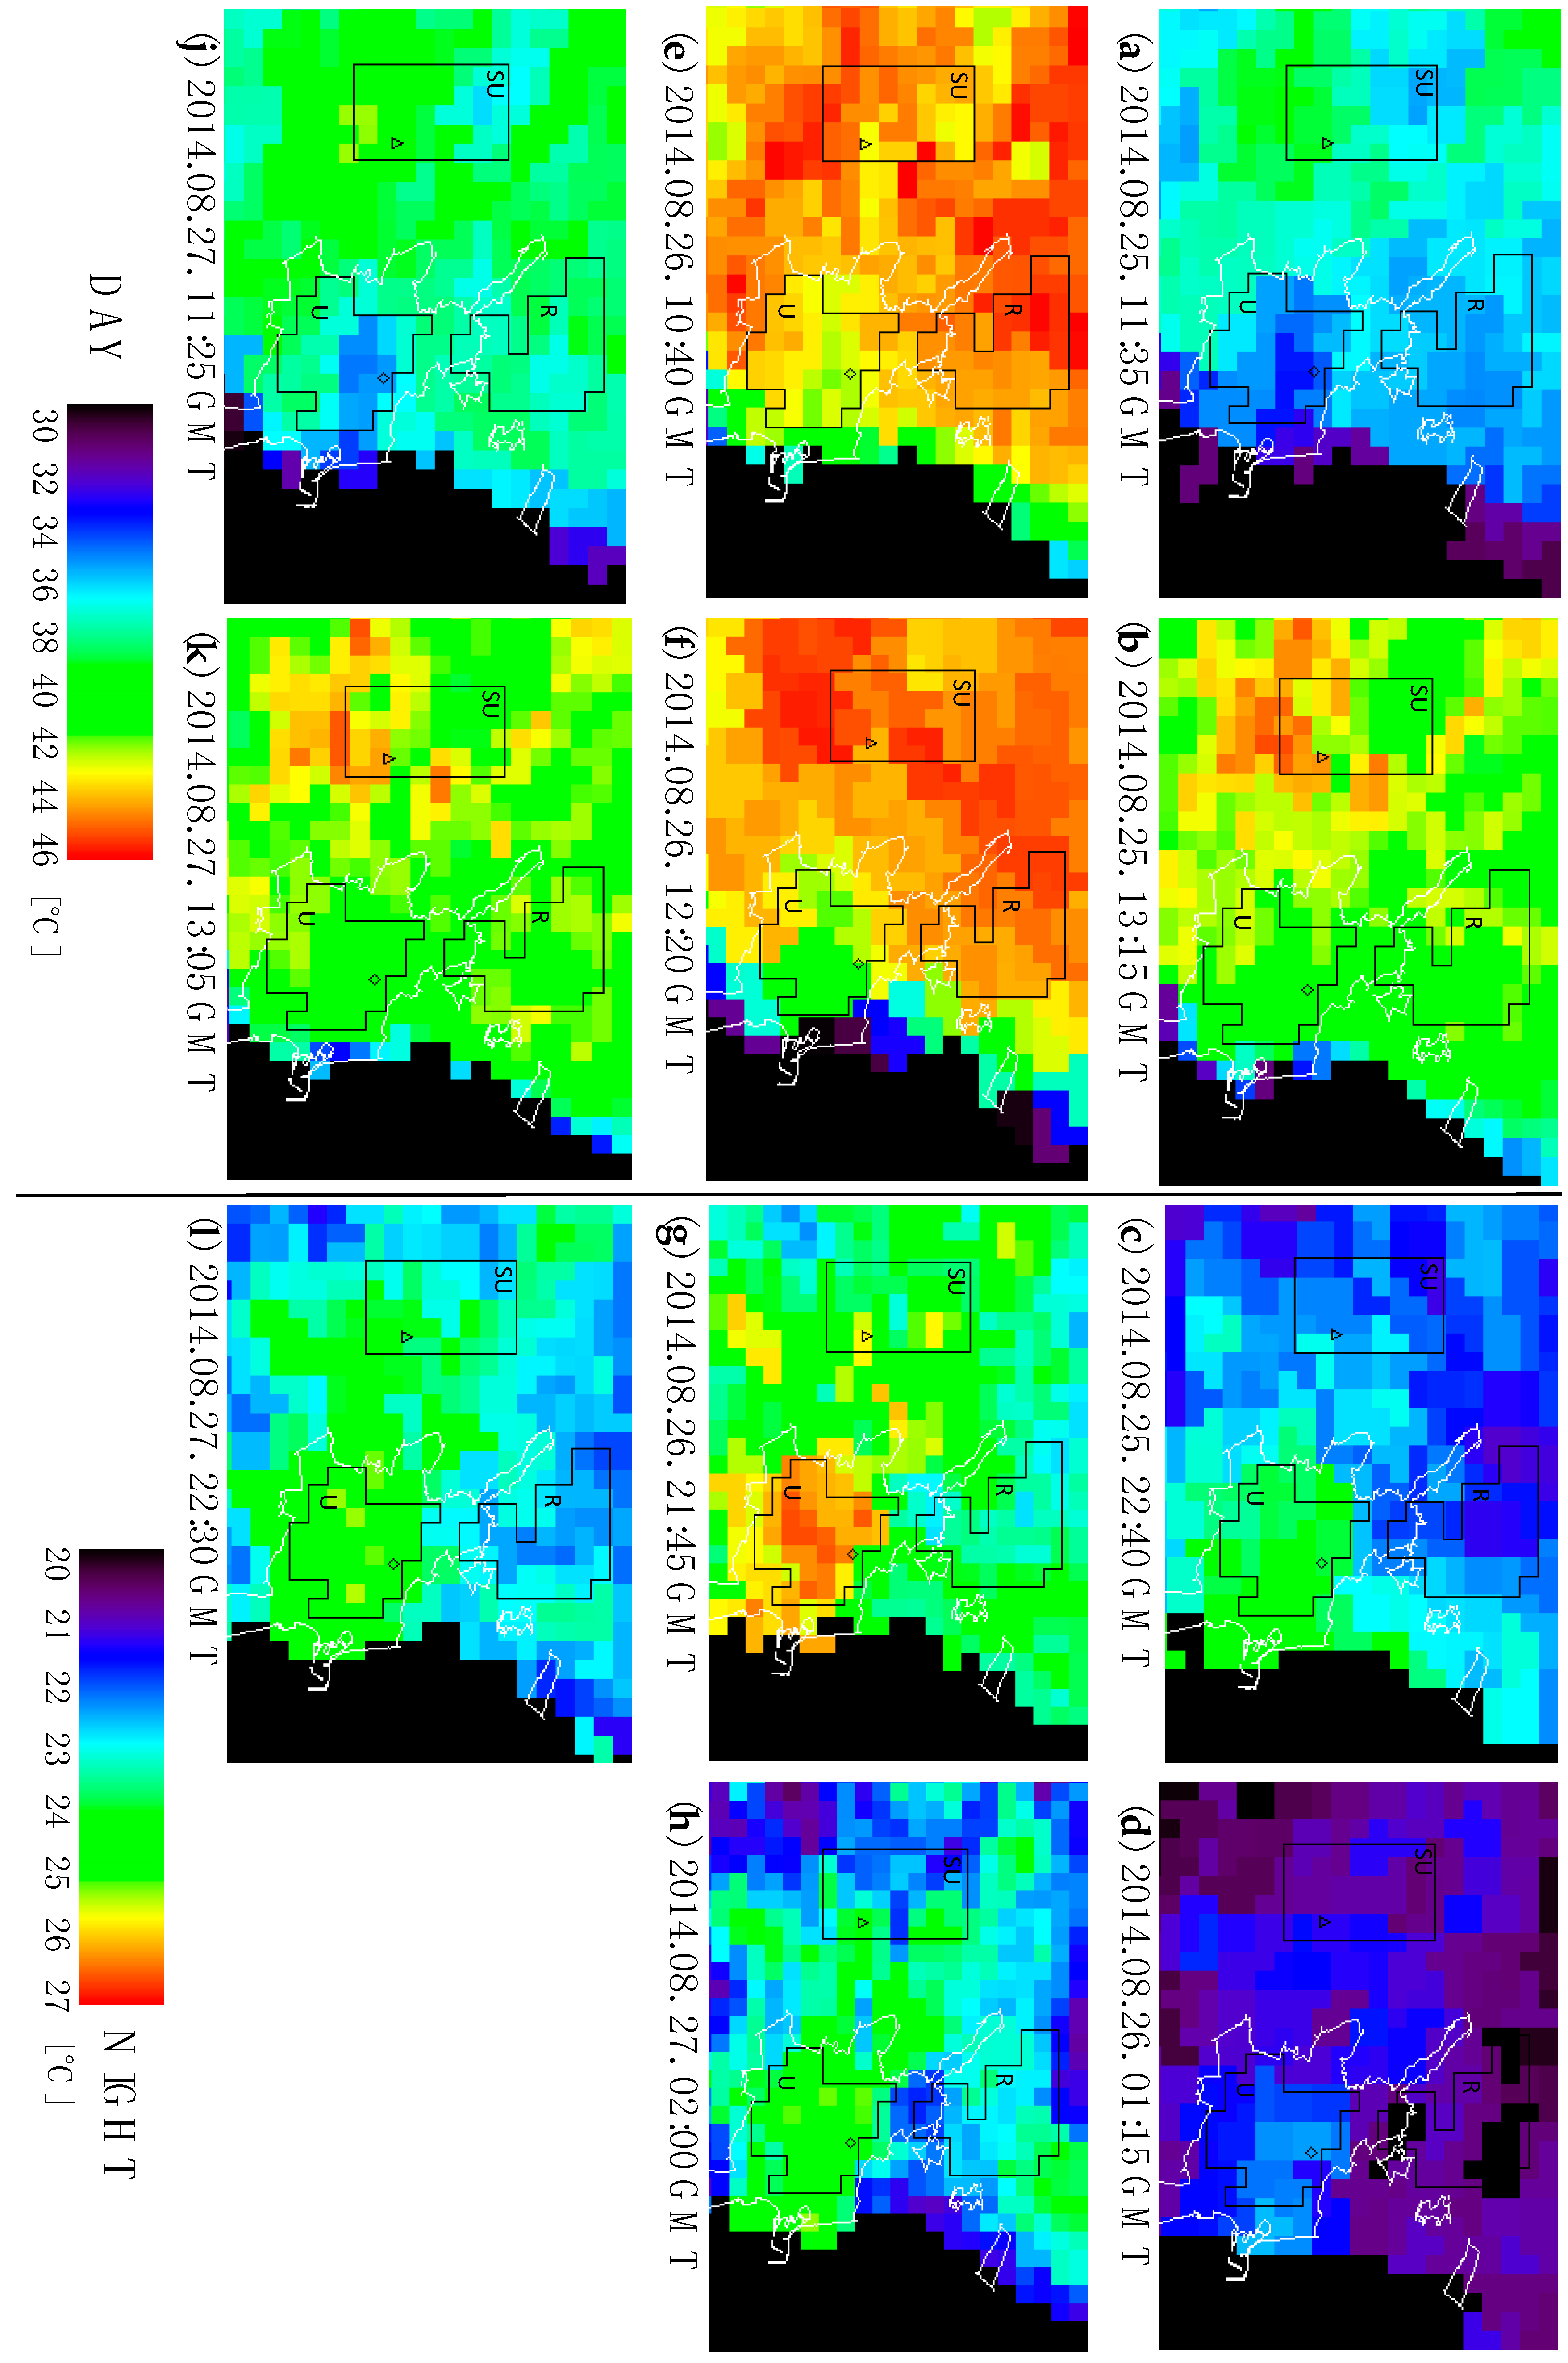
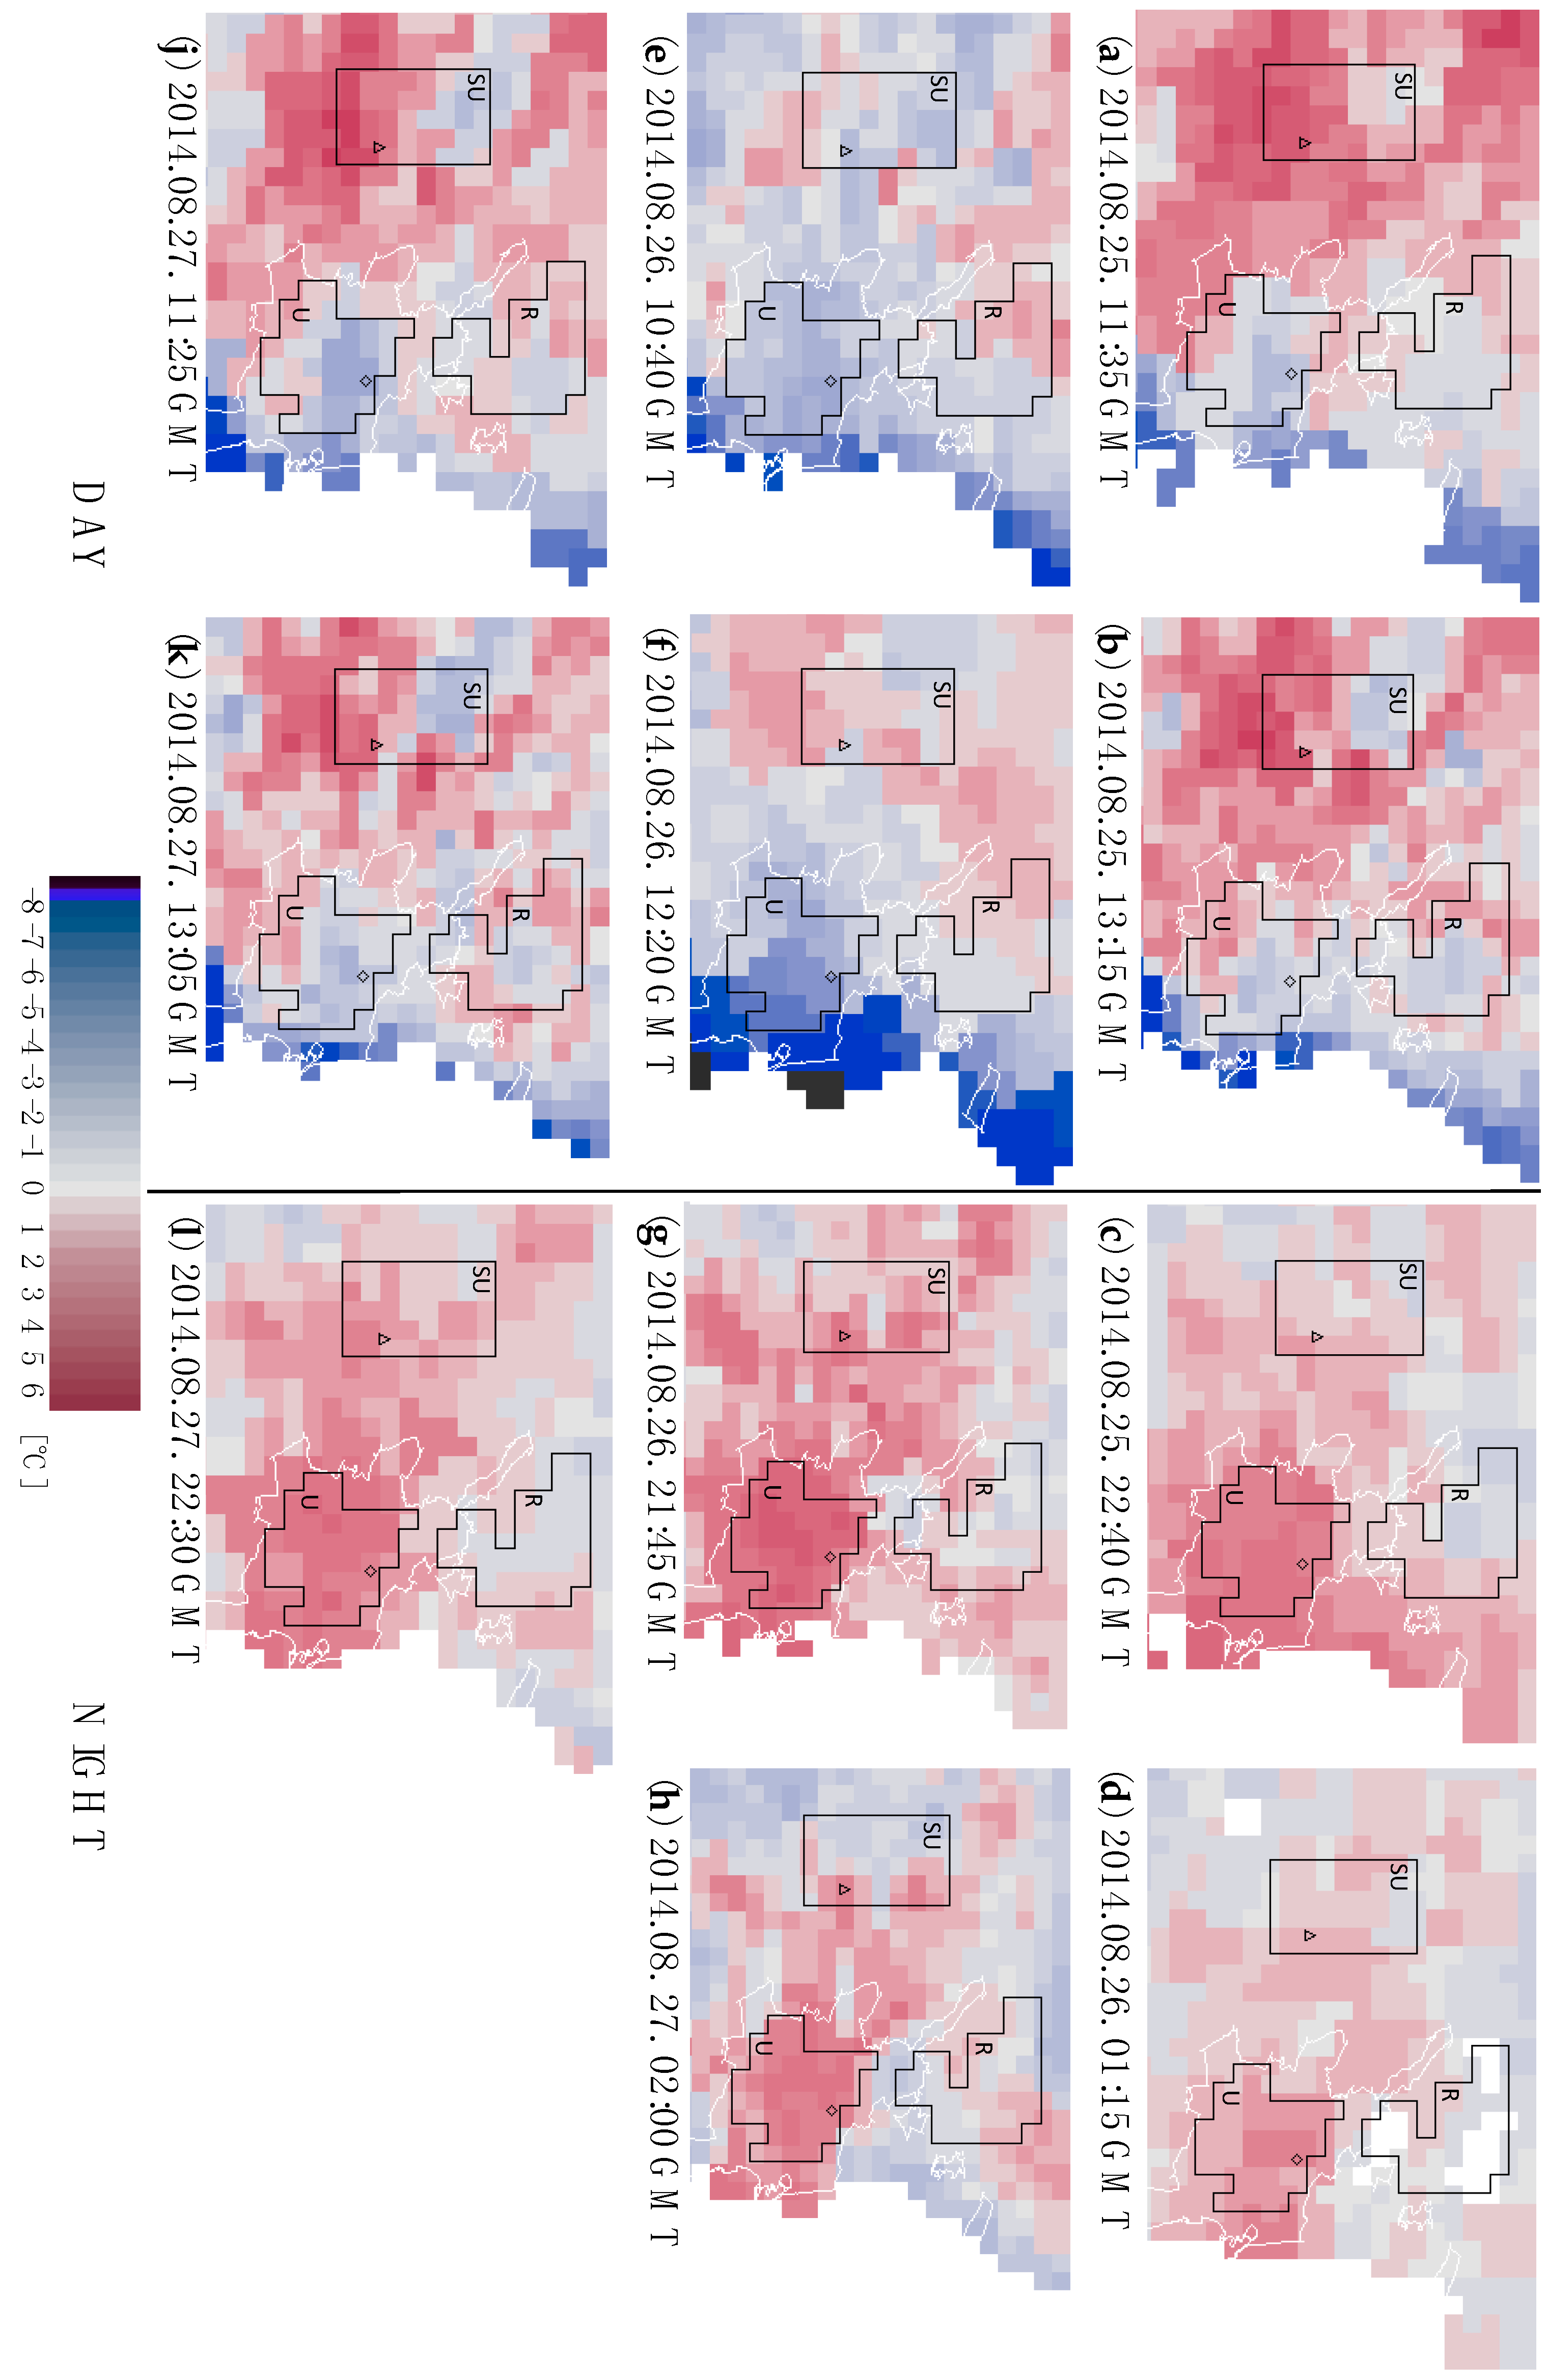
3.2. Case Study of the Evolution of sUHI

In August of 2014 the region of Valencia experienced its 5th hottest day on record (26th of August, 42.2 °C measured at Airport) that was accompanied by tropical nights throughout the month and followed by extreme hot nights with Tmin > 22.0 °C (i.e., exceeding the 90th percentile of Tmin data as described in Section 2.3). The LST images (Figure 5) present the evolution of the surface urban heat island over the city of Valencia during 3 consequitive days around the hot record (25–27 of August).
The daytime images (Figure 5a,b,e,f,j,k) taken in the early and middle afternoon show the so-called negative sUHI in the city. During the day the surrounding fields—characterized mostly by bare soil and low level vegetation—warmed up faster due to the direct insolation, meanwhile the urban areas stayed relatively cooler thanks to the shadows provided by the buildings, the higher specific heat capacity of the urbanized soil and the breeze coming from the direction of the sea (Table 1). The right column images (Figure 5c,d,g,h,l) presenting the nighttime conditions were taken around midnight and early morning. This well-pronunced positive temperature anomaly of the urban surface temperature is the phenomenon that is conventionally defined as sUHI.
The previous day of the record heat (25th) was a common, cloudless August day, with a gentle breeze from the sea cooling the city during the day, and having light air flow after sunset. In the afternoon the highest negative value of sUHI occurred near Viveros (Figure 5a, black rectangle) and in the eastern part of the city (−2 °C), meanwhile SW-NE gradient can be noticed over the city (SW: 37 °C, NE: 34 °C). 1.5 h later the differences between the urban and rural areas became negligible, hence the “island of city” cannot be clearly distinguished in the Figure 5b. The nighttime images taken approximately 4 and 6 h after sunset (Figure 5c) show a generally warmer city (+2 °C). Around midnight the western and eastern residential areas of the city were the warmest, while 2 h later the warmest spots were the densely built old city centre in the vicinity of Viveros and the harbor (Figure 5d). The pixels with outstanding low/high values near the beach should not be considered as they might be influenced by the sea [51].
On the 26th wind was blowing from west all the morning indicating the arrival of the so-called “Poniente” (meaning “westerly wind”) that usually brings hot air from the inner plateau which warms more, by adiabatic compression, when descending into the coast. The Poniente prevailed all the afternoon as a mild breeze from SW—with the maximum velocity of 33 km h−1 at early afternoon (11 GMT)—resulting in a warm air advection to the city. The MODIS image in the early afternoon (Figure 5e) also captures this phenomenon as the LST was generally higher (42–46 °C) than the previous day at similar time (Figure 5a). The image 1.5 h later has a similar pattern and presents the rapidly warming surroundings, however there is less precision due to the high angle of the measuring sensor (Figure 5f). By twilight the wind had turned 180° and the NE-E gentle breeze from the sea started to refresh the city. The early night image (Figure 5g) presents an extended sUHI effect (2.5 °C) with the highest LST values in the inner city (25.5–26.5 °C). Later on in the night (Figure 5h) the city started to cool down, however still keeping its contrast with the surroundings (+1.5 °C). Furthermore, thanks to the northerly winds over open land the northern agricultural area of the city—the “Huerta”—stayed significantly cooler than the rest of the city.
The afternoon images for the next day (27th) are similar to those from the 25th, with strong negative sUHI in the early afternoon that became weaker as the city warmed up and the breeze fostered the heat transport from the surface to the air (Figure 5j,k). The early night image of 27/28 (Figure 5l) shows a similar sUHI pattern than the late night the day before (Figure 5h), with an average +2 °C. Later the night became cloudy, resulting in extreme high Tmin (24.5 °C) by early morning.
As the Figure 5 maps show, even though the Airport weather station is set up over bare soil and away from buildings, its surrounding is affected by artifical surfaces that influence the thermal radiance data. Hence, in order to evaluate the sUHI quantitatively, the differences between the average LST of the Urban and Rural, as well as the Urban and Semi-Urban (i.e., the surrounding of the airport) regions were calculated (Table 2). As the defined Rural region is a good representative of the agricultural belt around the city, using it as a reference resulted in the most precise estimation of the sUHI of Valencia. Further qualitative evaluation is provided in form of “difference maps” where the average LST value of the Rural region is subtracted from all the pixels (Figure A1a–l). These maps also support the findings that during daytime the urban area was generally cooler than the rural area (−0.6–−3.3 °C), and during nighttime the city area was a relatively homogenous warm spot (+1.7–2.6 °C). It should be noted that the western suburbs (including the airport) were also warmer during night, but showed more heterogenous pattern than the city.

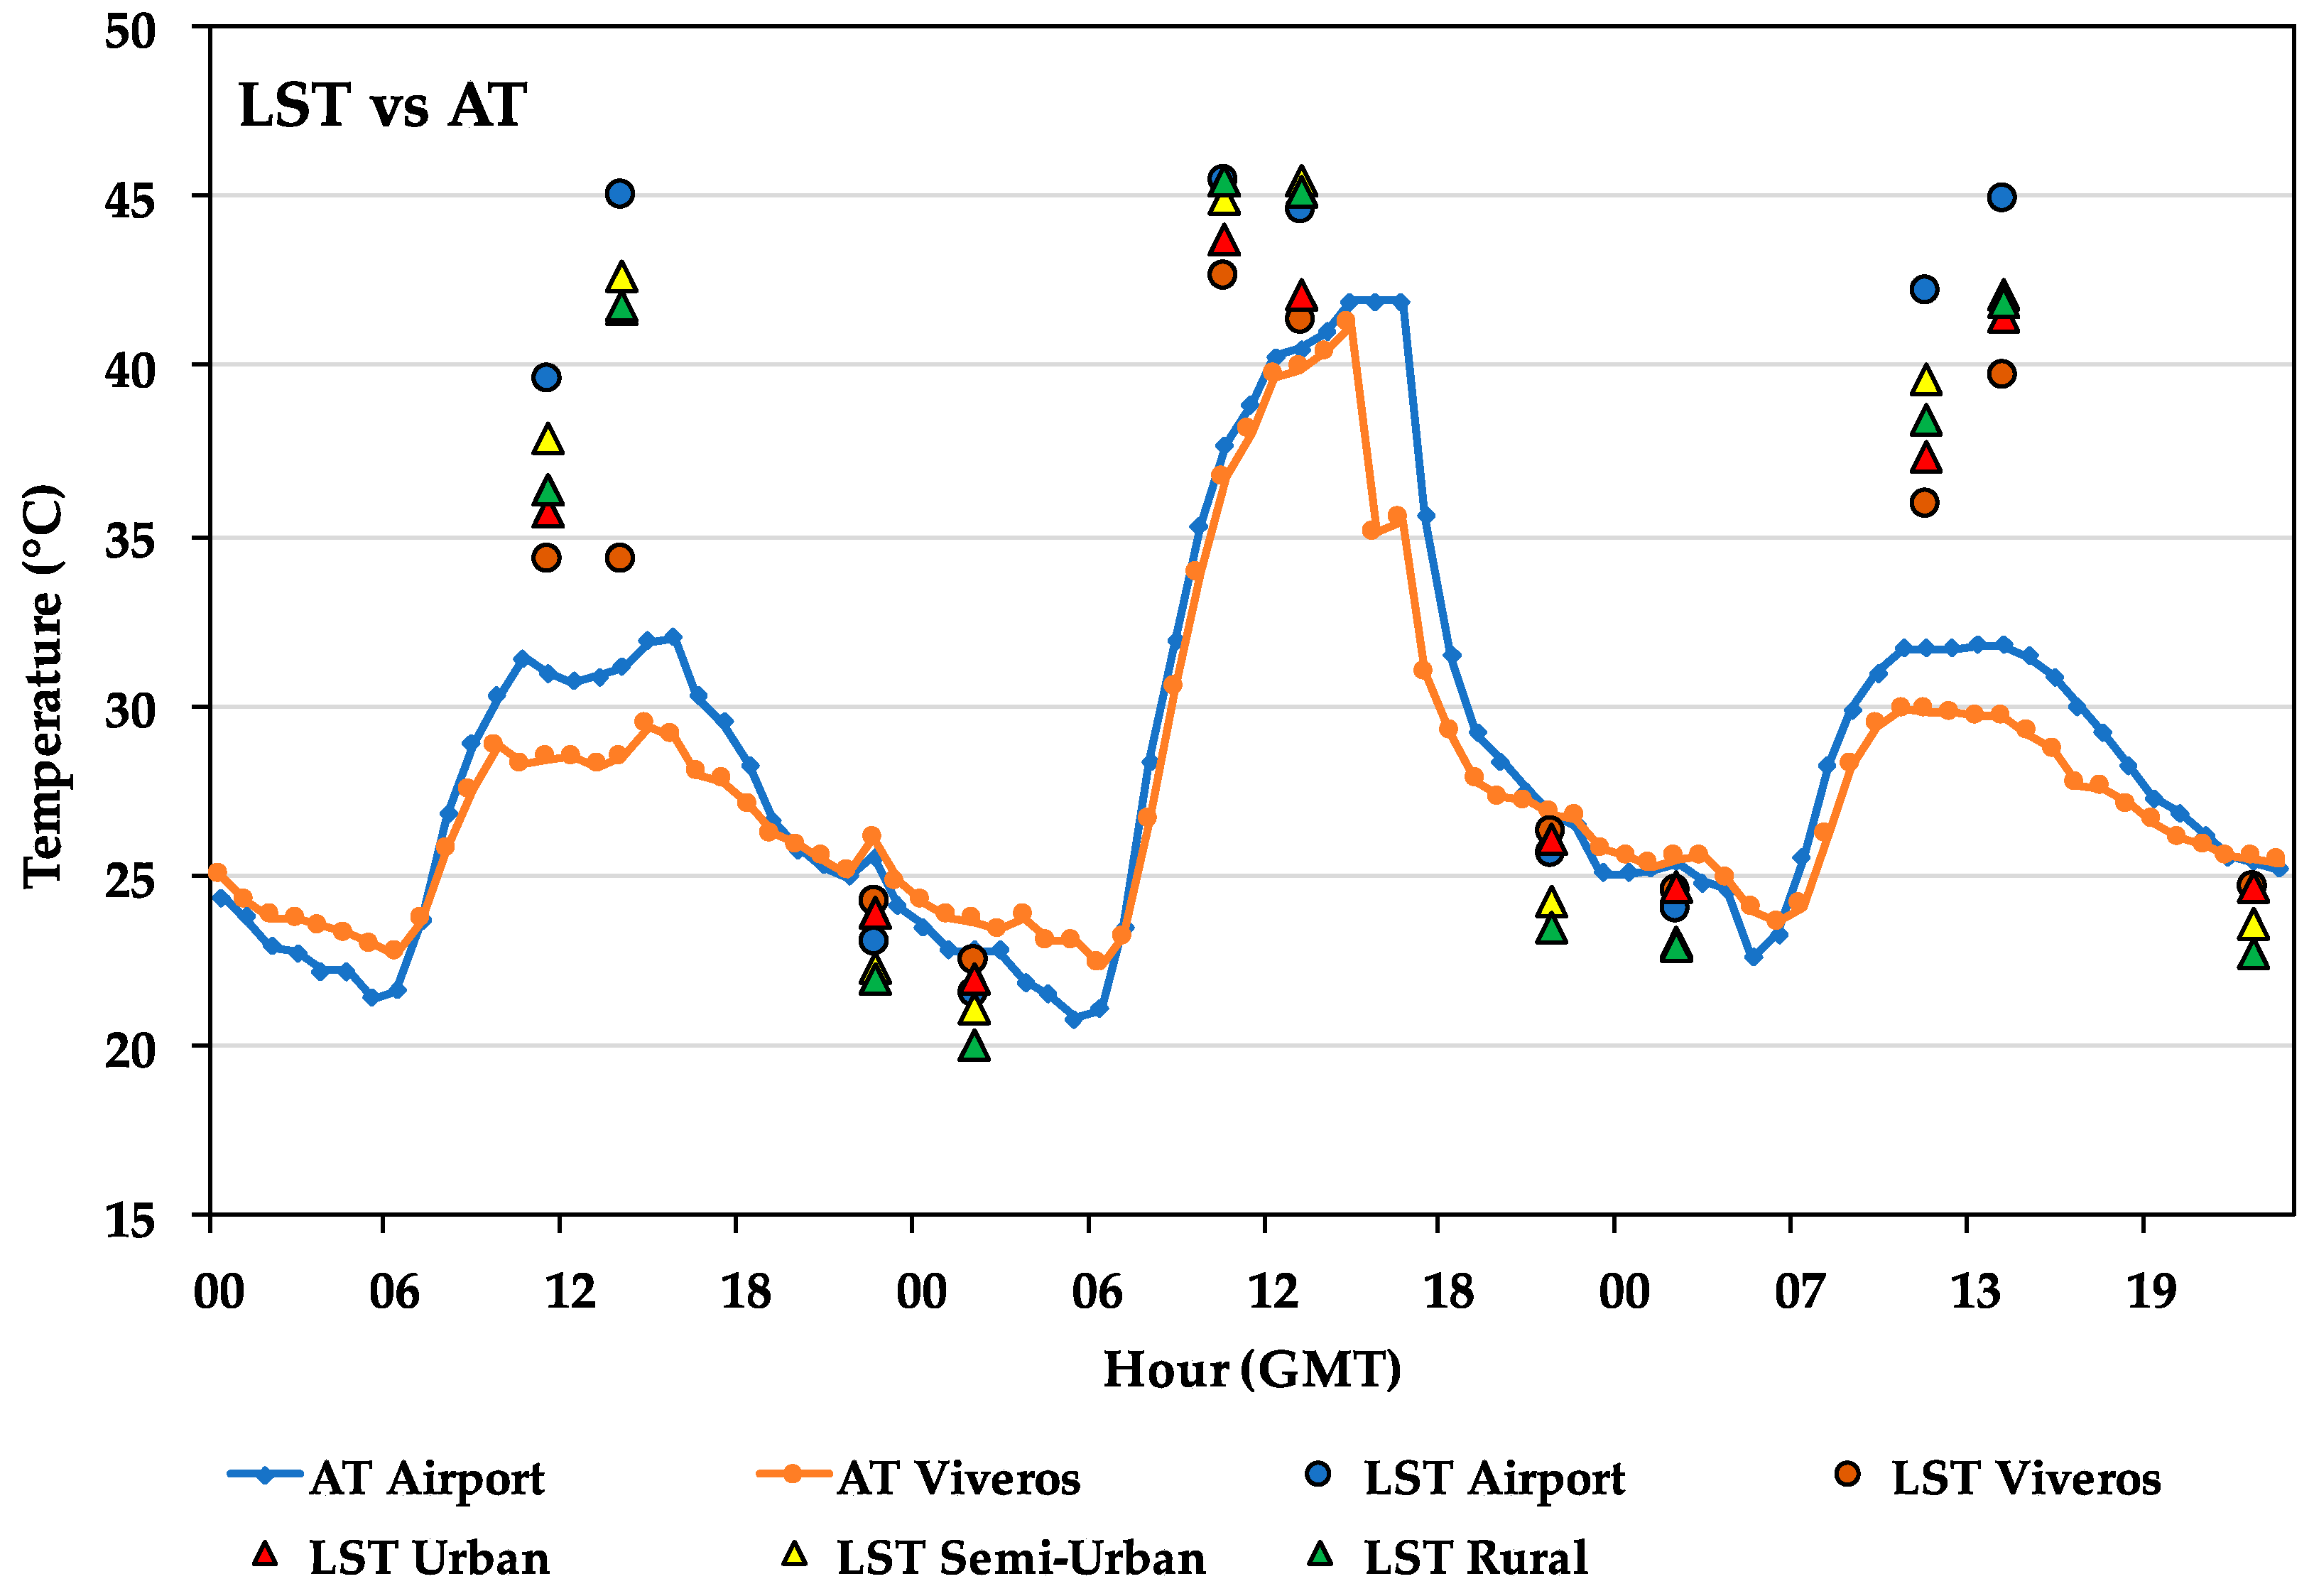
3.3. Comparison of AT and LST

In order to evaluate the differences between the urban heat island effect in terms of surface and air temperature observations during the studied 3-day period, LST data (point values retrieved from pixel as well as regional averages) and AT time series from the two weather stations were analysed (Figure 6). The point LST values were obtained from the nearest pixel to the stations to compare them directly with the air temperature measurements. During daytime the differences between AT and LST at the Airport reached more than 10 °C, however during the night the difference was not greater than 2.5 °C. This discrepancy was due to the different physical nature of AT and LST as it has been studied in several settings [53,54,55]. At Viveros the difference between AT and LST was more moderated, during daylight less than 6 °C, and during nighttime less than 2 °C. This is a consequence of the altered surface-atmosphere interaction resulting in the urban canopy layer (UCL, the lower atmosphere from the surface until the mean building height) and the urban boundary layer (UBL, the lower atmosphere above UCL) that function as “buffer” layers over the surface of the city [24].
The regional LST averages characterizing the 3 regions defined by the NDVI (Figure 2) provide a further description of the surface heat conditions over the different (Urban, Semi-Urban, Rural) regions. Similar to the point LST values during the day the regional LST values were much higher than the corresponding AT, showing the lowest difference in the city (LST Urban—AT Viveros). There were smaller differences between the regional values than between the point values during night, and the point LST values were the closest to the AT values. Additionally, in most of the cases the point LST value at Viveros fit well to the Urban regional average, meanwhile the point LST at the Airport had larger discrepancies compared to the Semi-Urban regional average.
The evolution of the urban heat island effect estimated from LST and AT measurements is presented in the Figure 7. The “biphasic” day-to day rhythm of the urban heat island effect is clearly seen in the air temperature measurements, showing a maximum difference between the Viveros and Airport station right before sunrise (5 GMT) with values of 1.6, 2.3 and 1.4 °C on the 3 consecutive days. On the other hand, the LST measurements suggest that the differences between the Urban and Semi-Urban region (Figure 7, blue triangles), as well as the Urban and Rural region (Figure 7, green triangles) were generally larger than the contrast in AT, showing the highest value (Urban-Rural: 2.6 °C) after sunset on the record hot day. Interestingly, on the 26th, a higher value of sUHI was found right after sunset (ca. 22 GMT) than at 2 GMT, probably due to the intense heat transport from the surface to the atmosphere.
The sUHI estimations from the regional LST values were in accordance with the sUHI estimations from point LST values, however during the day the point values suggest extreme sUHI values that is not representative for the region. Another relevant point to highlight is that in the afternoon the estimated UHI and sUHI had maximum discrepancies, while at night reasonable agreement was found between both effects (<0.6 °C in case of point LST). Thus, during nighttime land surface data may indicate not only the sUHI pattern but the UHI pattern as well.

3.4. The Discomfort Index

The spatial variability of human thermal comfort in the city was assessed using the DI discomfort index. As the DI formula (see Section 2.5) originally involves AT and RH data, the index was calculated only at nighttime when the AT and LST were in reasonable agreement (see Figure 7 and [46]). Accordingly, the index was estimated using the nighttime LST images and the average RH values calculated from the in situ measurements at Viveros and the Airport (Table 1). Although using an average RH value for the entire region introduced a moderated spatial bias to the DI, it did not affect the index significantly as there were only slight differences between the RH values (<12%) at the two stations. The DI values throughout the 3 nights of the observed period ranged between 19.5 and 24.2 that fell into the categories of “comfortable” (15.0–19.9 °C) and “hot” (20–26.4 °C) (Table 3).
On the night 25/26th of August the major part of the region was characterized by “hot” conditions (Figure 8a,b). About 4 h after sunset the DI in the city was around 22.5 and slightly decreased by early morning, while some rural spots had values at the upper limit of the “comfortable” category. The midnight image of the night 26/27 (Figure 8c,d) expresses the higher heat stress after a hot day. The inner densely built-up areas (District 1, 2, 3 in Figure 1) of the city experienced “hot” conditions characterized with the highest DI (24.2), and the >23 values extended to the outskirts of the city as well. By early morning the region became less “hot”, and some “comfortable” rural spots appeared. The night of 27/28 (Figure 8e) similar conditions occurred than the night before, probably due to the increased nighttime temperature and humidity.

4. Discussion

Assessing the nighttime temperature conditions of Valencia from a long-term climatological perspective, the growing number of tropical nights indicates a general warming trend at both the city centre and the countryside. The temperature contrast between the two sites has not changed in the last 5 decades, suggesting that the intensity of the urban heat island effect is not sensitive to the growth of the city or the warming trend. It is worth noting that the UHI effect is independent of the warming trends experienced by the studied locations in relation to global atmospheric dynamics, as the latter happens independently of the urban or rural nature of the measurement sites. Nevertheless, the Tmin as an indicator of nighttime conditions has limitations, providing more accurate information about the early morning, but less of the early night.
A measurement campaign carried out during two winter nights in 1988 [34] first quantified the UHI in Valencia, taking ground-based air temperature measurements along transects and using remote sensing NOAA data. According to [34] in a winter morning (5 GMT) 3.0 °C of heat island effect was estimated by transect AT measurements and 4.5 °C by satellite LST data. This agrees with our results presenting 2.3 °C of heat island effect estimated by in situ AT data at 5 GMT and 2.6 °C by remotely sensed LST data at ca. 22 GMT after the record hot summer day. Our slightly lower values—besides the use of improved satellite sensors—were due to the seasonal difference, as the cool winter nights provide more favorable conditions for the development of UHI (Figure 3b).
Furthermore, [34] found that the heat island effect obtained from satellite data is 1–2 °C higher than the value obtained from air temperature measurements. This also supports our findings that in general the nighttime sUHI was higher (with 1.5–2.2 °C, Figure 7) than the corresponding UHI. Nonetheless, our results emphasise that the “urban” and “rural” reference locations in an extensively urbanised landscape have a high impact on the estimations of the urban heat island effect (Table 2, Figure A1), hence should be chosen prudently. The NDVI provides a good base to distinguish surfaces with or without vegetation, however an objective, universally applicable landscape classification scheme is needed for further higher resolution sUHI studies [56].
According to an early analysis on the urban climate of Valencia [33], the heat island effect of the city decreases the discomfort of winter cold, but it increases the discomfort of summer heat. In the present case study the sea breeze played a main role in refreshing the city after the record hot day. It is notable that the prominent SW continental wind (“Poniente”) blocked from early morning the beneficial sea breeze from E on the 26th of August 2014, resulting in a severe warm advection all day, that was overtaken by the NE sea breeze only in the early evening hours. Consequently, the nighttime UHI after the unusually hot day was more intense as we might expect from other cases, e.g., Birmingham, UK [45], Beijing, China [57], and Madison, USA [58].
Regarding the sUHI pattern, using low resolution NOAA images [34] found a similar structure to that identified in the MODIS images, namely higher values in the city centre and the eastern part of the city. They also identified a maximum SW temperature gradient from the city centre, which occurs thanks to the unfragmented agricultural fields and forests on the SW (Figure 5). A similar spatial pattern was found in Barcelona, another Mediterranean coastal city, with higher intensity [31], probably due to the larger population of the city. For further spatial assessment of the intra-urban variability of UHI in a district or neighborhood level spatial resolutions greater than 50 m are needed, and the recommended satellite overpass time is immediately before sunrise, as [59] suggests.
The discomfort index is an important indicator to evaluate the heat stress that the increased nighttime temperatures impose on the human body and well-being. It is notable that the inner city and surrounding residential areas (with the highest number of inhabitants in the SW districts of 2, 3, 7, 8, 9, in the N districts 5, 15, 16 and the E districts of 12, 13, 14, Figure 1) generally tended to be warmer than the surroundings during the usual sleeping period of night in summer in Valencia (02–08 GMT+2). This increases the discomfort of habitants, and might cause more frequent insomnia events [13]. According to the DI maps, the hot zones with the highest DI were in the densely built-up city centre, while the cooler areas that were categorized as “comfortable” corresponded to non-urban zones. An airborne measurement campaign over Madrid [46] found similar patterns on a summer dawn, corroborating that most of the hot areas are inside the city, while the cooler ones (categories of comfortable, cool and cold) are outside it.
According to an urban planning study from 2010 [40], an interconnected green area throughout the city and joint to the sea could significantly improve the ventilation of the city. The daytime “negative” urban heat island in summer is conserved partially thanks to the morning fresh sea breeze. As soon as the morning breeze stops penetrating the city (at around 11–12 h local time), the temperature between the city and the countryside equalizes, as it was shown in Figure 5b,f,k. Based on the proven value of the already existing green urban areas throughout Europe [60,61] as well as the park of the Turia riverbed and the green road Blasco Ibáñez towards the sea in Valencia, the extension of these green lanes would be highly beneficial for a climate-resilient city.
Our case study on the urban heat island of Valencia provides essential knowledge to help urban designers mitigate the combined effects of climate change and UHI. As a next step, higher resolution satellite images will be analysed to provide a more detailed thermal map of the city for strategic urban planning and for modeling studies to estimate the effect of the different measures. As the use of green spaces could alleviate the perception of thermal discomfort during periods of heat stress [62], increasing the urban greenery as well as promoting light colored building design are highly recommended [63]. Moreover, both public opinion and expertise from different municipal departments, literature surveys and life cycle assessments should be considered in an integrated urban planning process [21,64]. This has been already initiated through various cross-sector projects [65,66] in collaboration with the Municipality of Valencia.

5. Conclusions

The urban heat island effect in Valencia estimated from AT and LST measurements showed a good agreement regarding the intensity and evolution of the effect during hot summer days. The UHI estimated from AT measured at the two stations was highest just before sunrise (2.3 °C). The sUHI calculated as the difference between the urban and rural region was the most intense after sunset on the record hot day (2.6 °C). The MODIS satellite images provided valuable insights to the heat conditions over the region of Valencia, but because of its moderate resolution the differences inside the city were blurred. For this reason, higher resolution satellite images with more frequent data acquisition time are needed especially over cities. In order to facilitate the mitigation of urban heat risk, detailed thermal maps of UHI and DI should be considered in urban planning and modeling, and measures should be taken to reduce the discomfort of the humid heat in the summer period, such as those that improve the natural sea breeze to ventilate the city. Furthermore, more green areas (interconnected parks, rooftops, etc.) as well as high albedo building materials (e.g., cool roofs and cool pavements) should be installed throughout the city. As an answer to the increasing demand of city scale environmental data, the presented results provide essential information on the urban climate and thermal comfort to be integrated in the climate change adaptation strategy of Valencia.

Acknowledgments

The principle author of this paper was supported by the Martí-Franquès Research Grant Program (reference number: 2014PMF-PIPF-21). This study was partly funded by the Ministry of Science and Innovation of Spain (CEOS-Spain 2 project, ESP2014-52955-R) and the European Union-funded project Uncertainties in Ensembles of Regional Reanalyses 570 (UERRA, FP7-SPACE-2013-1 Project No. 607193). Authors wish to acknowledge the Municipality of Valencia for the cartographic data and the Earth Observing System Data and Information System (EOSDIS) 2009, Earth Observing System ClearingHOuse (ECHO)/Reverb, Version 10.X [online application] Greenbelt, MD: EOSDIS, Goddard Space Flight Center (GSFC) National Aeronautics and Space Administration (NASA) (URL: http://reverb.earthdata.nasa.gov) for the satellite images. Furthermore, we express thanks to Jorge Tamayo and M. Yolanda Luna (AEMet) who provided the meteorological data to this study. We are also grateful to Alba Gilabert Gallart and Joan Ramon Coll (C3, University Rovira i Virgili) for their useful advice during the early stage of data processing. We are thankful to Linden Ashcroft (C3, University Rovira i Virgili) for the editing work on the last version of the manuscript.

Author Contributions

Annamária Lehoczky and José Sobrino conceived and designed the study; Annamária Lehoczky conducted the research, analysed the data and wrote the paper. Dražen Skoković contributed with analysis tools and guiding advice. Enric Aguilar contributed with advice on the homogenisation process of daily air temperature data. All authors have read and approved the final manuscript.

Conflicts of Interest

The authors declare no conflict of interest.

Appendix A

Figure A1. The evolution of sUHI during three hot summer days (25–27 August 2014) presented in form of “difference maps”: the average LST value of the Rural region is subtracted from all the pixels in order to have a general view on the urbanized landscape in the region of Valencia. (U: Urban, SU: Semi-Urban, R: Rural region; diamond: Viveros meteorological station; triangle: Airport meteorological station; white border: administrative border of Valencia, white pixels: missing value/sea, dark blue-black pixels: values significantly influenced by the sea). (al): MODIS LST difference images, see the corresponding data in Table 2.
Urbansci 01 00009 g009

References

  1. Stern, N. Stern Review: The Economics of Climate Change. Available online: http://mudancasclimaticas.cptec.inpe.br/~rmclima/pdfs/destaques/sternreview_report_complete.pdf (accessed on 12 February 2017).
  2. Oke, T.R. The energetic basis of the urban heat island. Q. J. R. Meteorol. Soc. 1982, 108, 1–24. [Google Scholar] [CrossRef]
  3. Arnfield, A.J. Two decades of urban climate research: A review of turbulence, exchanges of energy and water, and the urban heat island. Int. J. Climatol. 2003, 23, 1–26. [Google Scholar] [CrossRef]
  4. Lindén, J.; Grimmond, C.S.B.; Esper, J. Urban warming in villages. Adv. Sci. Res. 2015, 12, 157–162. [Google Scholar] [CrossRef]
  5. Rosenzweig, C.; Solecki, W.D.; Hammer, S.A.; Mehrotra, S. Climate Change and CitiesFirst Assessment Report of theUrban Climate Change Research Network. Available online: http://uccrn.org/files/2015/01/ARC3-Frontmatter-Final.pdf (accessed on 12 February 2017).
  6. Stocker, T.F.; Qin, D.; Plattner, G.-K.; Tignor, M.; Allen, S.K.; Boschung, J.; Nauels, A.; Xia, Y.; Bex, V.; Midgley, P.M. (Eds.) Climate Change 2013: The Physical Science Basis; Contribution of Working Group I to the Fifth Assessment Report of the Intergovernmental Panel on Climate Change; Cambridge University Press: Cambridge, UK; New York, NY, USA, 2013.
  7. IPCC Special Report on Managing the Risks of Extreme Events and Disasters to Advance Climate Change Adaptation. Available online: https://www.ipcc.ch/news_and_events/docs/srex/SREX_slide_deck.pdf (accessed on 12 February 2017).
  8. Tomlinson, C.J.; Chapman, L.; Thornes, J.E.; Baker, C.J. Including the urban heat island in spatial heat health risk assessment strategies: A case study for Birmingham, UK. Int. J. Health Geogr. 2011, 10, 42. [Google Scholar] [CrossRef] [PubMed] [Green Version]
  9. Buscail, C.; Upegui, E.; Viel, J.-F. Mapping heatwave health risk at the community level for public health action. Int. J. Health Geogr. 2012, 11, 38. [Google Scholar] [CrossRef] [PubMed] [Green Version]
  10. Dong, W.; Liu, Z.; Zhang, L.; Tang, Q.; Liao, H.; Li, X. Assessing heat health risk for sustainability in Beijing’s urban heat island. Sustainability 2014, 6, 7334–7357. [Google Scholar] [CrossRef]
  11. Adegoke, J.; Wright, C.Y. Preface—Vulnerability of Human Health to Climate. Clim. Vulnerability 2013, 1, 1–2. [Google Scholar]
  12. Nastos, P.T.; Matzarakis, A. The effect of air temperature and human thermal indices on mortality in Athens, Greece. Theor. Appl. Climatol. 2012, 108, 591–599. [Google Scholar] [CrossRef]
  13. Vineis, P. Climate change and the diversity of its health effects. Int. J. Public Health 2010, 55, 81–82. [Google Scholar] [CrossRef] [PubMed]
  14. Zander, K.K.; Botzen, W.J.W.; Oppermann, E.; Kjellstrom, T.; Garnett, S.T. Heat stress causes substantial labour productivity loss in Australia. Nat. Clim. Chang. 2015, 5, 647–651. [Google Scholar] [CrossRef]
  15. Kennedy, C.; Pincetl, S.; Bunje, P. The study of urban metabolism and its applications to urban planning and design. Environ. Pollut. 2011, 159, 1965–1973. [Google Scholar] [CrossRef] [PubMed]
  16. Van Timmeren, A. The Concept of the Urban Metabolism (UM). In ReciproCities. A Dynamic Equilibrium; TU Delft: Delft, The Netherlands, 2014. [Google Scholar]
  17. Kenney, W.L.; DeGroot, D.W.; Alexander Holowatz, L. Extremes of human heat tolerance: Life at the precipice of thermoregulatory failure. J. Therm. Biol. 2004, 29, 479–485. [Google Scholar] [CrossRef]
  18. Lin, Y.; Yang, L.; Zheng, W.; Ren, Y. Study on Human Physiological Adaptation of Thermal Comfort under Building Environment. Procedia Eng. 2015, 121, 1780–1787. [Google Scholar] [CrossRef]
  19. Blumberg, G. Assessing the Potential Impact of Heat Waves in Cities: Implications for Hazard Preparation and Planning. Procedia Econ. Financ. 2014, 18, 727–735. [Google Scholar] [CrossRef]
  20. European Environment Agency. Urban Adaptation to Climate Change in Europe; European Environment Agency: Copenhagen, Denmark, 2012. [Google Scholar]
  21. Andersson-Sköld, Y.; Thorsson, S.; Rayner, D.; Lindberg, F.; Janhäll, S.; Jonsson, A.; Moback, U.; Bergman, R.; Granberg, M. An integrated method for assessing climate-related risks and adaptation alternatives in urban areas. Clim. Risk Manag. 2015, 7, 31–50. [Google Scholar] [CrossRef]
  22. Hart, M.A.; Sailor, D.J. Quantifying the influence of land-use and surface characteristics on spatial variability in the urban heat island. Theor. Appl. Climatol. 2009, 95, 397–406. [Google Scholar] [CrossRef]
  23. Eliasson, I. The use of climate knowledge in urban planning. Landsc. Urban Plan. 2000, 48, 31–44. [Google Scholar] [CrossRef]
  24. Stewart, I.D.; Oke, T.R. Local climate zones for urban temperature studies. Bull. Am. Meteorol. Soc. 2012, 93, 1879–1900. [Google Scholar] [CrossRef]
  25. Mendelsohn, R.; Kurukulasuriya, P.; Basist, A.; Kogan, F.; Williams, C. Climate analysis with satellite versus weather station data. Clim. Chang. 2007, 81, 71–83. [Google Scholar] [CrossRef]
  26. Taha, H. Urban climates and heat islands: Albedo, evapotranspiration, and anthropogenic heat. Energy Build. 1997, 25, 99–103. [Google Scholar] [CrossRef]
  27. Watkins, R.; Littlefair, P.; Kolokotroni, M.; Palmer, J. The London Heat Island—Surface and air temperature measurements in a park and street gorges. ASHRAE Trans. 2002, 108, 419–427. [Google Scholar]
  28. Gedzelman, S.D.; Austin, S.; Cermak, R.; Stefano, N.; Partridge, S.; Quesenberry, S.; Robinson, D.A. Mesoscale aspects of the Urban Heat Island around New York City. Theor. Appl. Climatol. 2003, 75, 29–42. [Google Scholar]
  29. Cuadrat, J.M.; Martín Vide, J. La Climatología Española : Pasado, Presente y Futuro (Spanish Climatology: Past, Present and Future); Prensas Universitarias de Zaragoza: Zaragoza, Spain, 2007. [Google Scholar]
  30. López Gómez, A.; López Gómez, J.; Fernández, F.; Moreno, A. El Clima Urbano. Teledetección de la isla de Calor en Madrid; Ministerio de Obras Públicas y Transportes: Madrid, Spain, 1993. [Google Scholar]
  31. Moreno-Garcia, M.C. Intensity and form of the urban heat island in Barcelona. Int. J. Climatol. 1994, 14, 705–710. [Google Scholar] [CrossRef]
  32. Cuadrat, J.M. Patrones temporales de la isla de calor urbana de Zaragoza. In Aportaciones Geográficas En Homenaje Al Profesor Antonio Higueras; Universidad de Zaragoza: Zaragoza, Spain, 2004; pp. 63–70. [Google Scholar]
  33. Pérez Cueva, A.J. Clima y confort en las ciudades: La ciudad de Valencia. Métode 2001, 31, 16–21. [Google Scholar]
  34. Caselles, V.; López García, M.J.; Meliá, J.; Pérez Cueva, A.J. Analysis of the heat-island effect of the city of Valencia, Spain, through air temperature transects and NOAA satellite data. Theor. Appl. Climatol. 1991, 43, 195–203. [Google Scholar] [CrossRef]
  35. Fernández-Gimeno, L.; López-García, M.J. Expansión urbana del Área metropolitana de valencia en el periodo 1984–2011 a partir de imágenes landsat TM y ETM+. Rev. Teledetec. 2015, 2015, 1–14. [Google Scholar] [CrossRef]
  36. Thom, E.C. The Discomfort Index. Weatherwise 1959, 12, 57–61. [Google Scholar] [CrossRef]
  37. Statistical Analysis of Census 2011. Available online: http://www.valencia.es/estadistica (accessed on 21 September 2016).
  38. Kottek, M.; Grieser, J.; Beck, C.; Rudolf, B.; Rubel, F. World map of the Köppen-Geiger climate classification updated. Meteorol. Zeitschrift 2006, 15, 259–263. [Google Scholar]
  39. AEMet (Agencia Estatal de Meteorología). Available online: http://www.aemet.es/ (accessed on 26 September 2016).
  40. Lozano Esteban, D.S. Analisis de la Ciudad de Valencia. Master’s Thesis, Degree of Gardening and Landscape at Polytechnic University of Valencia, Valencia, Spain, 2010. [Google Scholar]
  41. Brunet, M.; Saladié, O.; Jones, P.; Sigró, J.; Aguilar, E.; Moberg, A.; Lister, D.; Walther, A.; Diego, L.; Almarza, C. The development of a new dataset of Spanish daily adjusted temeperature series (SDATS) (1850–2003). Int. J. Climatol. 2006, 26, 1777–1802. [Google Scholar] [CrossRef]
  42. Aguilar, E.; Prohom, M. RClimDex-extraQC (EXTRAQC Quality Control Software); User Manual; Centre for Climate Change, University Rovira i Virgili: Tarragona, Spain, 2011; Available online: http://www.c3.urv.cat/data/manual/Manual_rclimdex_extraQC.r.pdf (accessed on 16 February 2016).
  43. Mestre, O.; Domonkos, P.; Picard, F.; Auer, I.; Robin, S.; Lebarbier, E.; Böhm, R.; Aguilar, E.; Guijarro, J.; Vertachnik, G.; et al. HOMER: A homogenization software—Methods and applications. Idojaras 2013, 117, 47–67. [Google Scholar]
  44. ETCCDI Core Climate Indices. Available online: http://www.climdex.org/indices.html (accessed on 24 October 2016).
  45. Tomlinson, C.J.; Chapman, L.; Thornes, J.E.; Baker, C.J. Derivation of Birmingham’s summer surface urban heat island from MODIS satellite images. Int. J. Climatol. 2012, 32, 214–224. [Google Scholar] [CrossRef]
  46. Sobrino, J.A.; Oltra-Carrió, R.; Sòria, G.; Jiménez-Muñoz, J.C.; Franch, B.; Hidalgo, V.; Mattar, C.; Julien, Y.; Cuenca, J.; Romaguera, M.; et al. Evaluation of the surface urban heat island effect in the city of Madrid. Int. J. Remote Sens. 2013, 34, 3177–3192. [Google Scholar] [CrossRef]
  47. EOSDIS Reverb ECHO—NASA. Available online: http://reverb.echo.nasa.gov/reverb/ (accessed on 14 March 2016).
  48. Wang, W.; Liang, S.; Meyers, T. Validating MODIS land surface temperature products using long-term nighttime ground measurements. Remote Sens. Environ. 2008, 112, 623–635. [Google Scholar] [CrossRef]
  49. Sobrino, J.; Skoković, D. Permanent Stations for Calibration/Validation of Thermal Sensors over Spain. Data 2016, 1, 10. [Google Scholar] [CrossRef]
  50. Toy, S.; Yilmaz, S.; Yilmaz, H. Determination of bioclimatic comfort in three different land uses in the city of Erzurum, Turkey. Build. Environ. 2007, 42, 1315–1318. [Google Scholar] [CrossRef]
  51. Baghdadi, N.; Zribi, M. Land Surface Remote Sensing in Urban and Coastal Areas; Elsevier: Amsterdam, The Netherlands, 2016. [Google Scholar]
  52. Wolfe, R.E.; Roy, D.P.; Vermote, E. MODIS land data storage, gridding, and compositing methodology: Level 2 grid. IEEE Trans. Geosci. Remote Sens. 1998, 36, 1324–1338. [Google Scholar] [CrossRef]
  53. Tomlinson, C.J.; Chapman, L.; Thornes, J.E.; Baker, C.J.; Prieto-Lopez, T. Comparing night-time satellite land surface temperature from MODIS and ground measured air temperature across a conurbation. Remote Sens. Lett. 2012, 3, 657–666. [Google Scholar] [CrossRef]
  54. Boudhar, A.; Duchemin, B.; Hanich, L.; Boulet, G.; Chehbouni, A. Spatial distribution of the air temperature in mountainous areas using satellite thermal infra-red data. C. R. Geosci. 2011, 343, 32–42. [Google Scholar] [CrossRef] [Green Version]
  55. Gallo, K.; Hale, R.; Tarpley, D.; Yu, Y. Evaluation of the Relationship between Air and Land Surface Temperature under Clear- and Cloudy-Sky Conditions. J. Appl. Meteorol. Climatol. 2011, 50, 767–775. [Google Scholar] [CrossRef]
  56. Stewart, I.; Oke, T. Methodological concerns surrounding the classification of urban and rural climate stations to define urban heat island magnitude. In Proceedings of the Preparation 6th International Conference Urban Climate, Goteborg, Sweden, 12–16 June 2006.
  57. Li, D.; Sun, T.; Liu, M.; Yang, L.; Wang, L.; Gao, Z. Contrasting responses of urban and rural surface energy budgets to heat waves explain synergies between urban heat islands and heat waves. Environ. Res. Lett. 2015, 10, 54009. [Google Scholar] [CrossRef]
  58. Schatz, J.; Kucharik, C.J. Urban climate effects on extreme temperatures in Madison, Wisconsin, USA. Environ. Res. Lett. 2015, 10, 9. [Google Scholar] [CrossRef]
  59. Sobrino, J.A.; Oltra-Carrió, R.; Sòria, G.; Bianchi, R.; Paganini, M. Impact of spatial resolution and satellite overpass time on evaluation of the surface urban heat island effects. Remote Sens. Environ. 2012, 117, 50–56. [Google Scholar] [CrossRef]
  60. Dimoudi, A.; Nikolopoulou, M. Vegetation in the urban environment: Microclimatic analysis and benefits. Energy Build. 2003, 35, 69–76. [Google Scholar] [CrossRef]
  61. Bowler, D.E.; Buyung-Ali, L.; Knight, T.M.; Pullin, A.S. Urban greening to cool towns and cities: A systematic review of the empirical evidence. Landsc. Urban Plan. 2010, 97, 147–155. [Google Scholar] [CrossRef]
  62. Lafortezza, R.; Carrus, G.; Sanesi, G.; Davies, C. Benefits and well-being perceived by people visiting green spaces in periods of heat stress. Urban For. Urban Green. 2009, 8, 97–108. [Google Scholar] [CrossRef]
  63. Hoverter, S.P. Adapting to Urban Heat: A Tool kIt for Local Governments; Georgetown Climate Center: Washington, DC, USA, 2012. [Google Scholar]
  64. Wolf, T.; Chuang, W.C.; McGregor, G. On the science-policy bridge: Do spatial heat vulnerability assessment studies influence policy? Int. J. Environ. Res. Public Health 2015, 12, 13321–13349. [Google Scholar] [CrossRef] [PubMed] [Green Version]
  65. Municipality of Valencia and InnDEA. Valencia Smart City Strategy Environmental and Sustainable Development. In Proceedings of the Innovation Festival 2014, Valencia, Spain, 29–31 October 2014.
  66. Dominguez, M.C.; Lehoczky, A.; López, Á.P.; Tomás, V.R. BIKE GENERATION: How to improve the sustainable mobility in the city of Valencia? In Proceedings of the Innovation Festival, Frankfurt, Germany, 7–9 November 2016.
Figure 1. The map of Valencia city [37] (diamond: Viveros meteorological station, triangle: Airport meteorological station).
Urbansci 01 00009 g001
Figure 2. The different regions determined according to the calculated NDVI on 26th of August. (U: Urban, SU: Semi-Urban, R: Rural region; diamond: Viveros meteorological station, triangle: Airport meteorological station, black border: administrative border of Valencia).
Urbansci 01 00009 g002
Figure 3. The frequency distribution of the temperature contrast between the Viveros and the Airport station calculated from daily in situ measurements of Tmin (1966-2014): (a) The probability density; (b) Monthly statistics.
Urbansci 01 00009 g003
Figure 4. The annual number of tropical nights (Tmin > 20.0 °C) at the airport and at the city centre (Viveros).
Urbansci 01 00009 g004
Figure 5. The evolution of sUHI during three hot summer days (25–27 August 2014). (U: Urban, SU: Semi-Urban, R: Rural region; diamond: Viveros meteorological station, triangle: Airport meteorological station, white border: administrative border of Valencia, black pixels: missing value/sea). (al): MODIS LST images, see the corresponding data in Table 2.
Urbansci 01 00009 g005
Figure 6. Comparison of the LST and AT values during 25–27 August 2014. (AT Airport: air temperature from the in situ measurements at the Airport; AT Viveros: air temperature from the in situ measurements at Viveros; LST Airport: LST of one pixel nearest to the Airport; LST Viveros: LST of one pixel nearest to Viveros; LST Urban: average of LST over the Urban region; LST Semi-Urban: average of LST over the Semi-Urban region; LST Rural: average of LST over the northern Rural region).
Urbansci 01 00009 g006
Figure 7. Comparison of the estimated UHI and sUHI. (UHI from AT in situ Viv. and Airp.: the difference between the in situ measurements of AT recorded at Viveros and AT recorded at Airport; sUHI from LST at Viv. and Airp.: the difference between the LST obtained from one pixel nearest to the meteorological stations at Viveros and the Airport; sUHI (Semi-Urban ref.): the difference between the LST averages over the Urban region and the Semi-Urban region; sUHI (Rural ref.): the difference between the LST averages over the Urban region and the Rural region).
Urbansci 01 00009 g007
Figure 8. The DI discomfort index during the 3 nights of the examined period (25–27 August 2014). (Diamond: Viveros meteorological station, triangle: Airport meteorological station, white border: administrative border of Valencia, white pixels: missing value/sea). (ae): DI based on MODIS nighttime LST images.
Urbansci 01 00009 g008
Table 1. The weather conditions during 25–27 August 2014 at the Airport and temperature at Viveros. (ATv: AT measured at Viveros, ATa: AT measured at Airport, v.a.: veering around, lower index a: measured at the Airport).
DateATv (°C) min/maxATa (°C) min/maxRHa (%) min/maxSolar Time (GMT)Wind DirectionaWind Speeda (km h−1)Description
25 August22.7/30.221.1/32.432/880–5
6–8
9–16
17–20
21–24
NW-W
Calm
SE–E
NE-E
variable
2–5
0
4–19
15–21
0–5
light air
calm
gentle breeze
mild/gentle breeze
calm/light air
26 August22.2/41.620.5/42.28/900–10
11–16
17–20
21–24
v.a. W
SW
NE-E
variable
2–6
21–33
8–20
0–8
light air
mild breeze
gentle breeze
calm/light breeze
27 August23.1/30.522.6/32.441/870–4
5–8
9–18
19–24
E
variable
E
SE
6–9
3–9
8–22
2–6
light breeze
light air
mild/gentle breeze
light air
Table 2. The average LST over the three regions and the sUHI with Semi-Urban (SU) and Rural (R) references. (The best estimation of sUHI [Urban vs. Rural] is marked in bold. Letters in brackets correspond to the images of Figure 5a–l.)
Image Acquisition Time (GMT)View Zenith Angle (°) 1Pixel Size (km)Urban (°C)Semi-Urban (°C)Rural (°C)sUHI Ref.: SU (°C)sUHI Ref.: R (°C)
25 August 2014. 11:35 (a)542.735.837.936.3−2.2−0.6
25 August 2014. 13:15 (b)141.041.742.641.8−0.9−0.1
25 August 2014. 22:40 (c)532.723.922.221.91.72.0
26 August 2014. 01:15 (d)613.622.021.020.90.92.0
26 August 2014. 10:40 (e)281.243.844.945.5−1.1−1.7
26 August 2014. 12:20 (f)613.642.045.445.2−3.3−3.1
26 August 2014. 21:45 (g)301.326.124.323.51.82.6
27 August 2014. 02:00 (h)71.024.623.122.91.61.7
27 August 2014. 11:25 (j)421.737.439.638.5−2.2−1.1
27 August 2014. 13:05 (k)121.041.542.141.9−0.6−0.4
27 August 2014. 22:30 (l)411.724.723.622.71.22.0
1 Pixel size is estimated from the view zenith angle based on the calculations of [52].
Table 3. The DI categories based on [50].
DI CategoryDI Temperature (°C)
Hyperglacial<−40
Glacial−39.9 to −20
Extremely cold−19.9 to −10
Very cold−9.9 to −1.8
Cold−1.7 to 12.9
Cool13–14.9
Comfortable15–19.9
Hot20–26.4
Very hot26.5–29.9
Torrid>30

