
Physical Flood Vulnerability Mapping Applying Geospatial Techniques in Okazaki City, Aichi Prefecture, Japan

Abstract
:1. Introduction
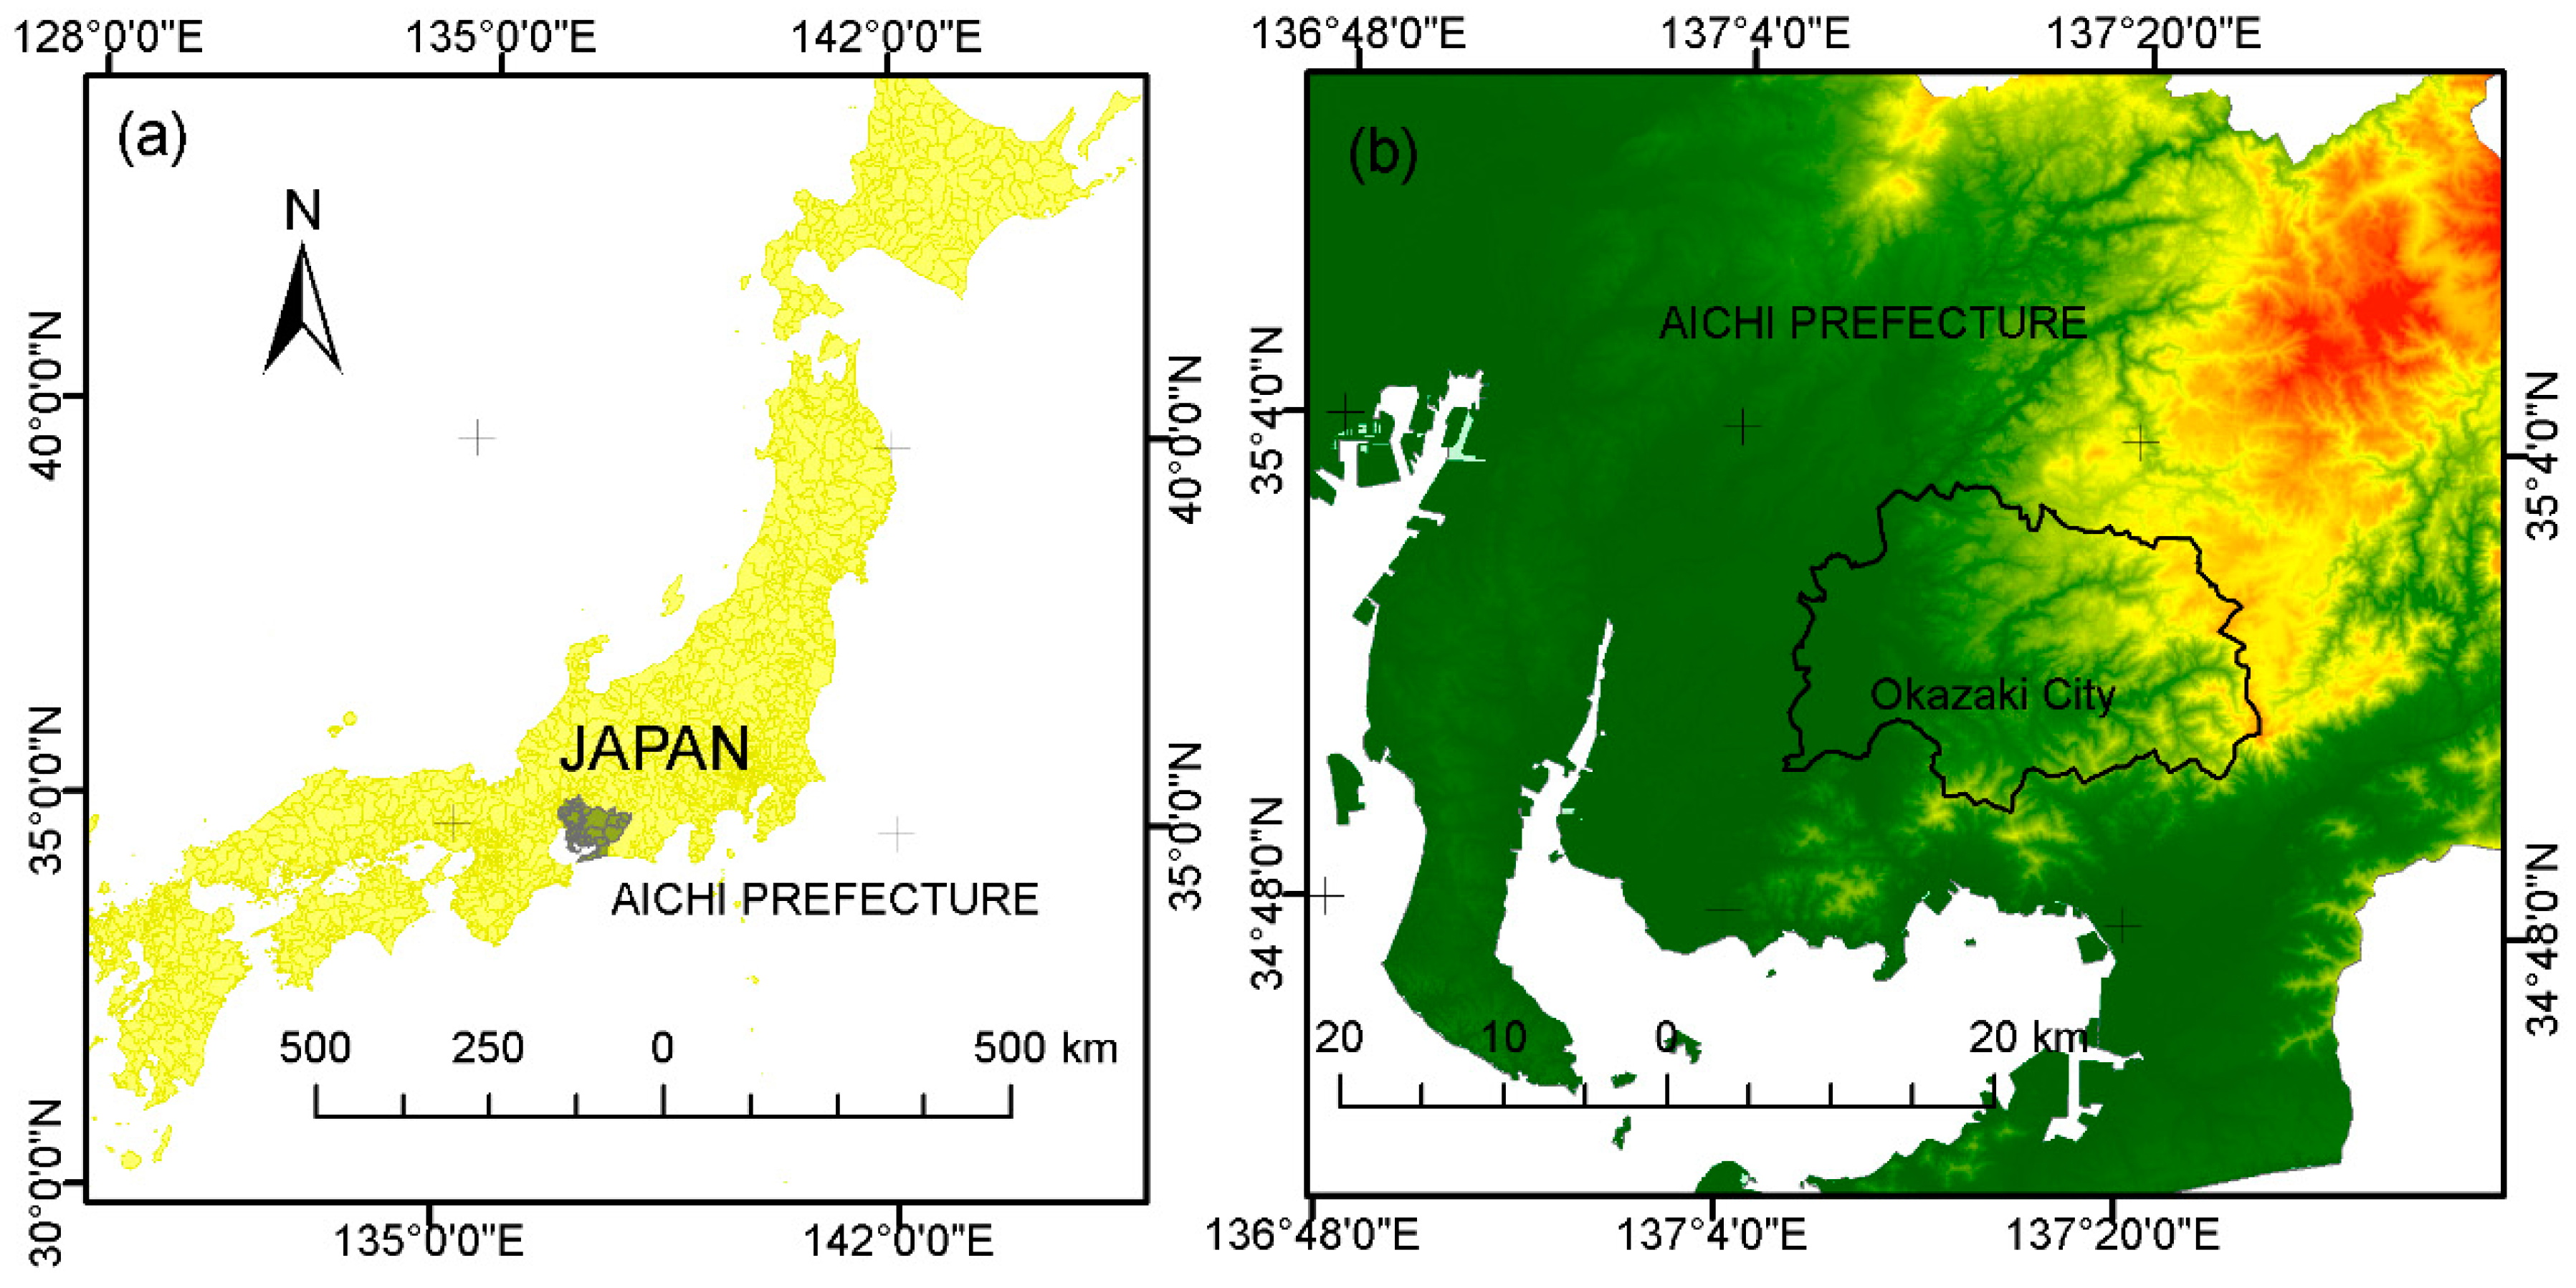
2. Study Area and Flood History
3. Materials and Methods
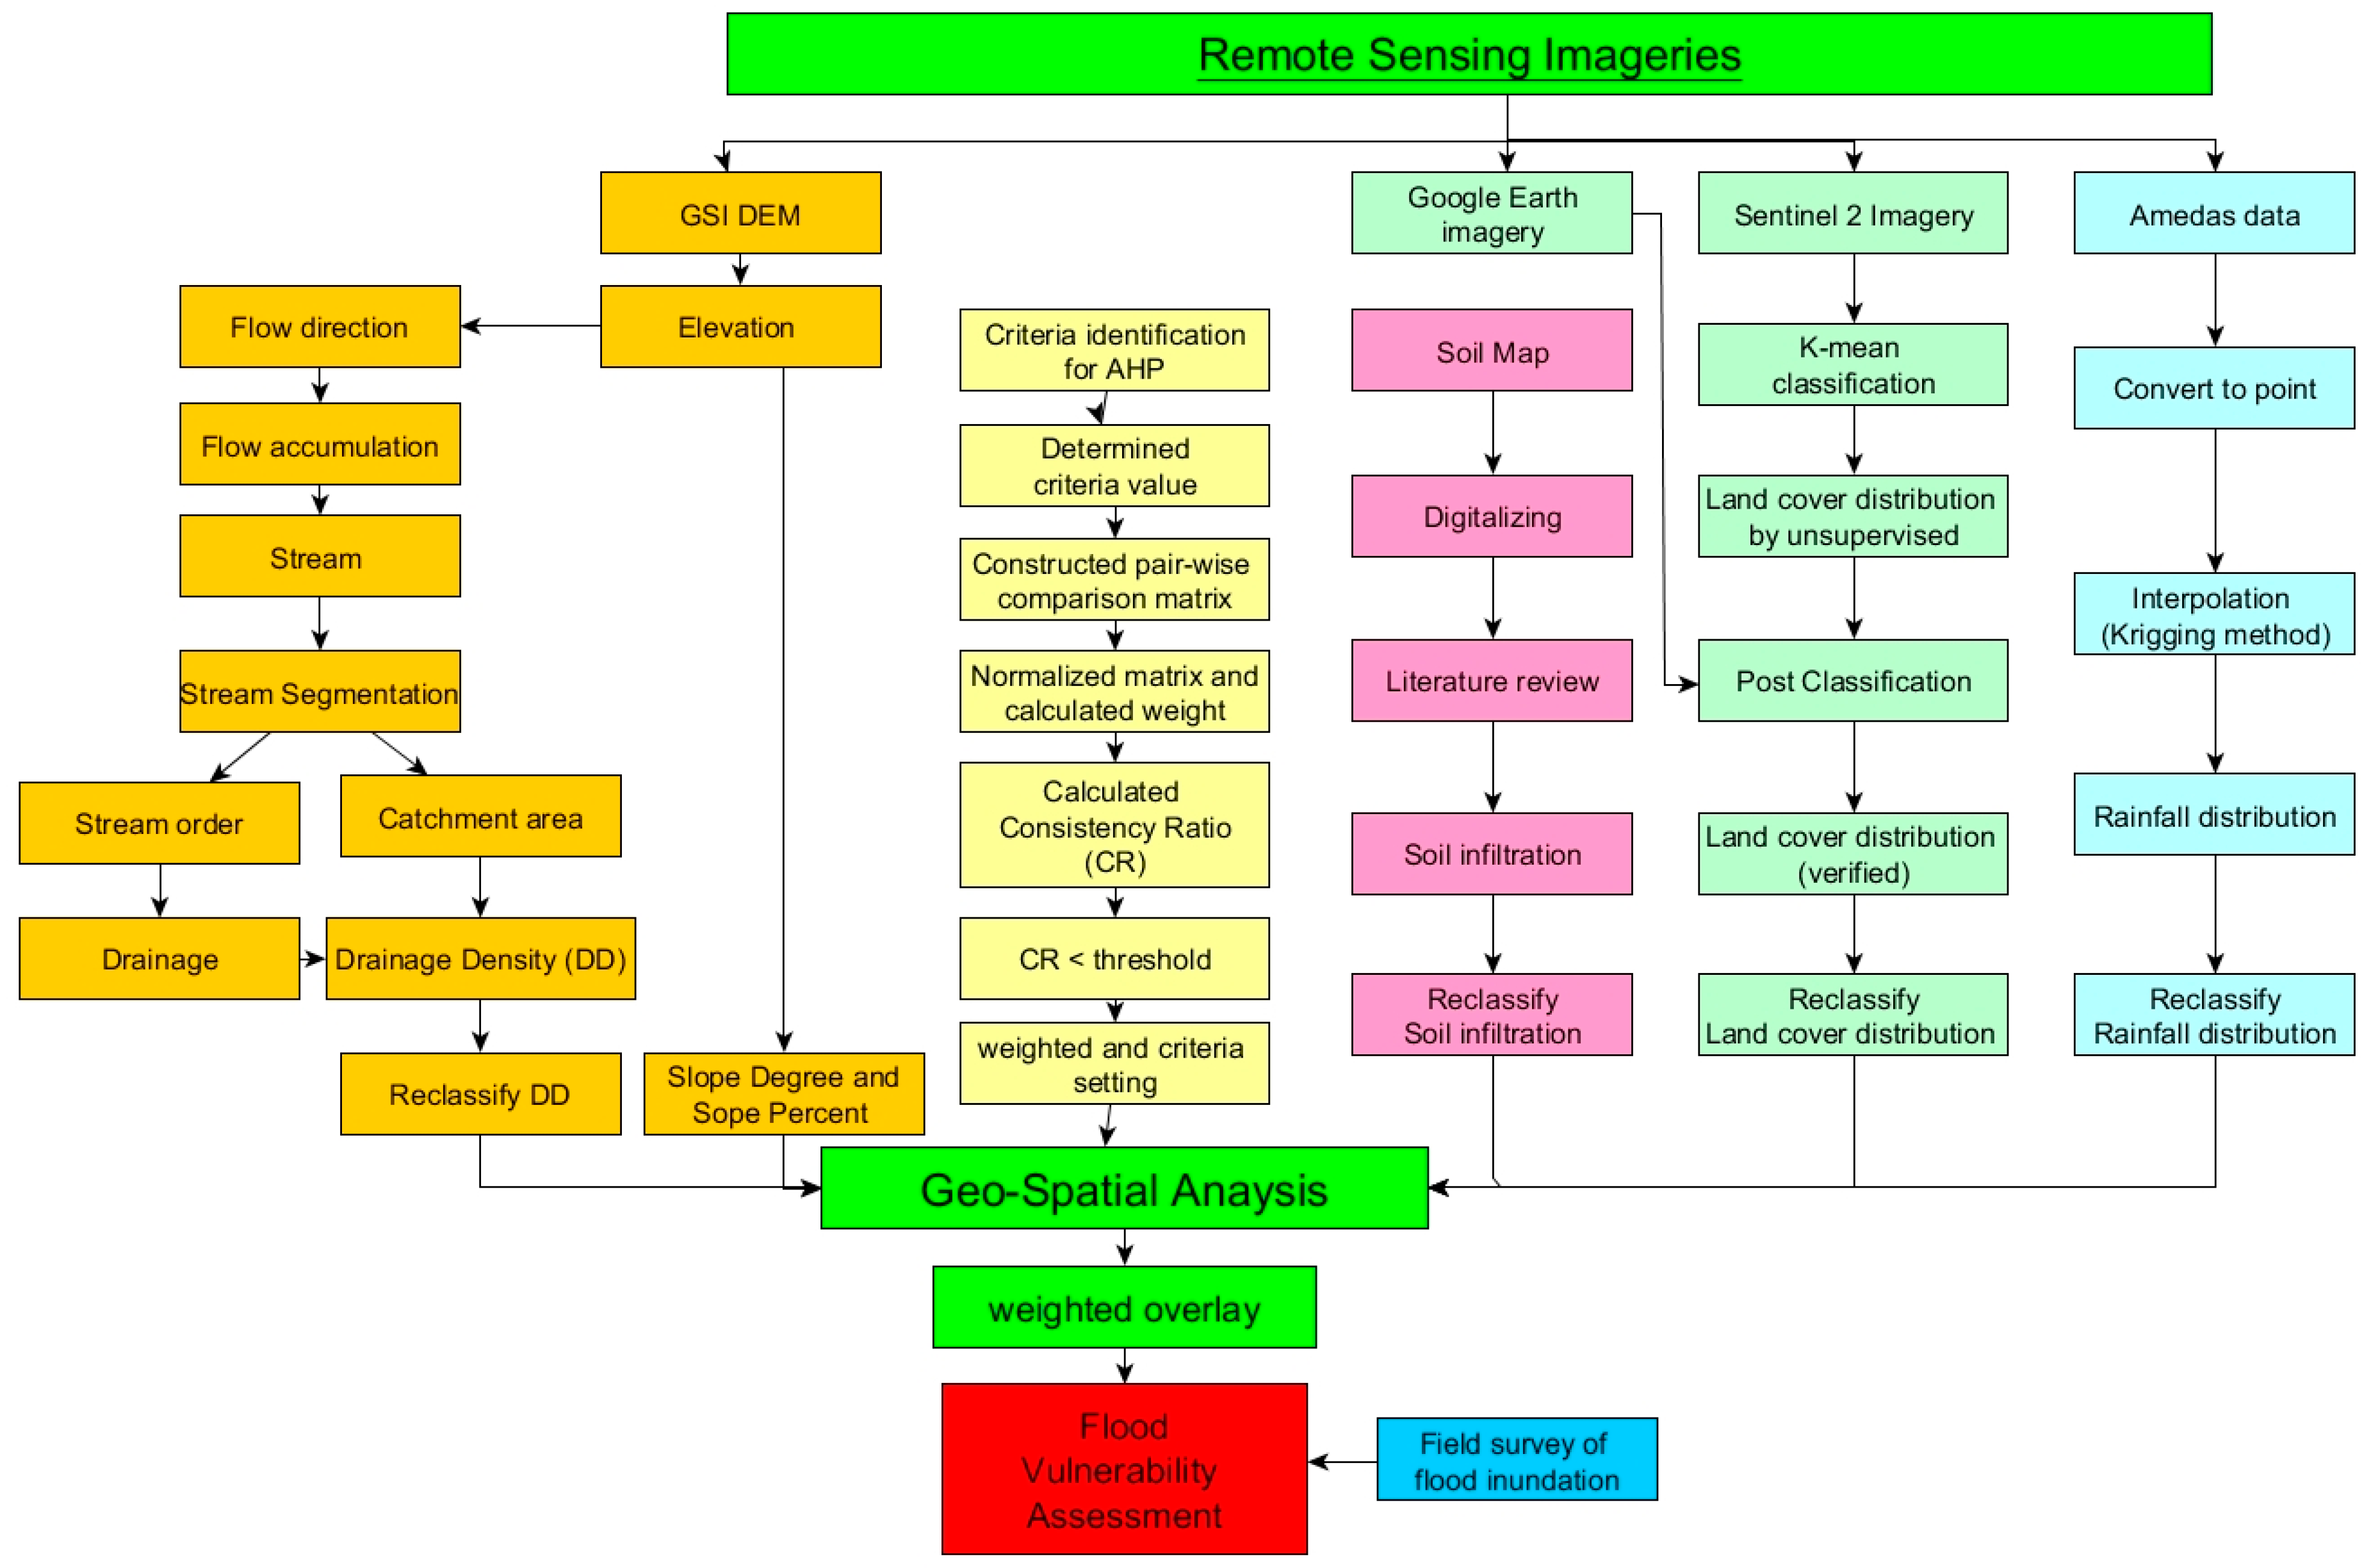
3.1. Overview
3.2. Flood Vulnerability Variable
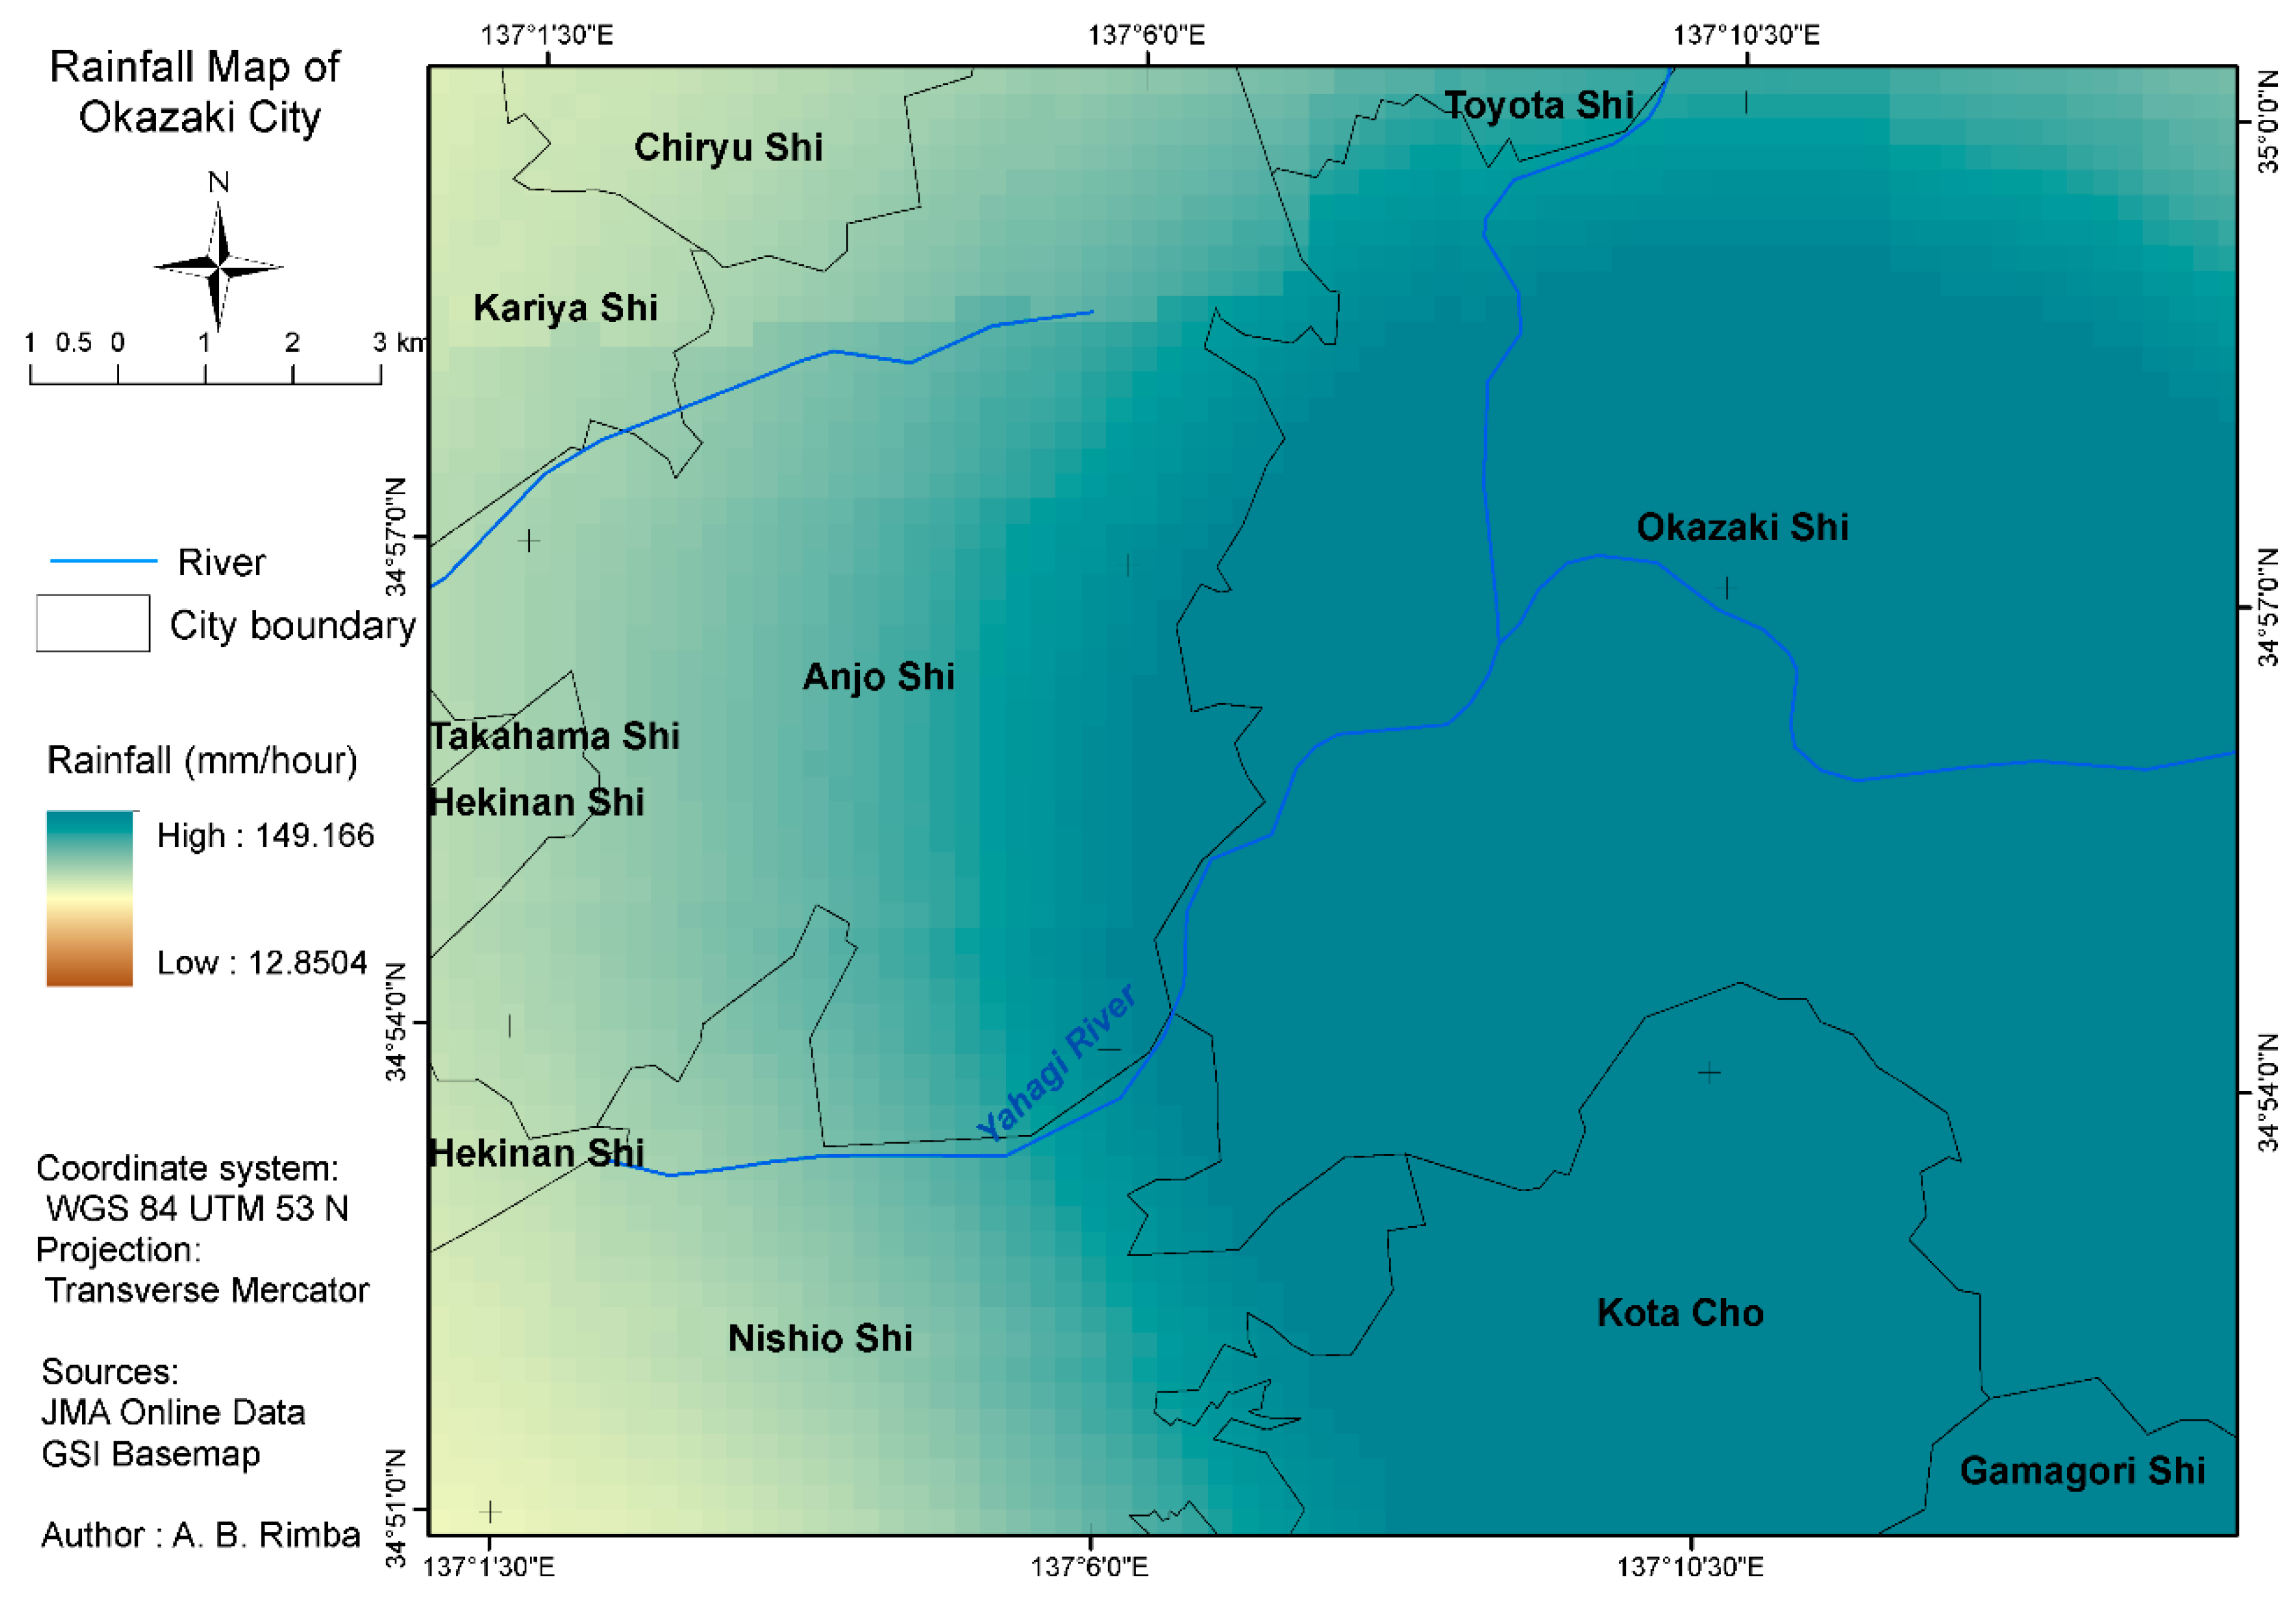
3.2.1. Rainfall
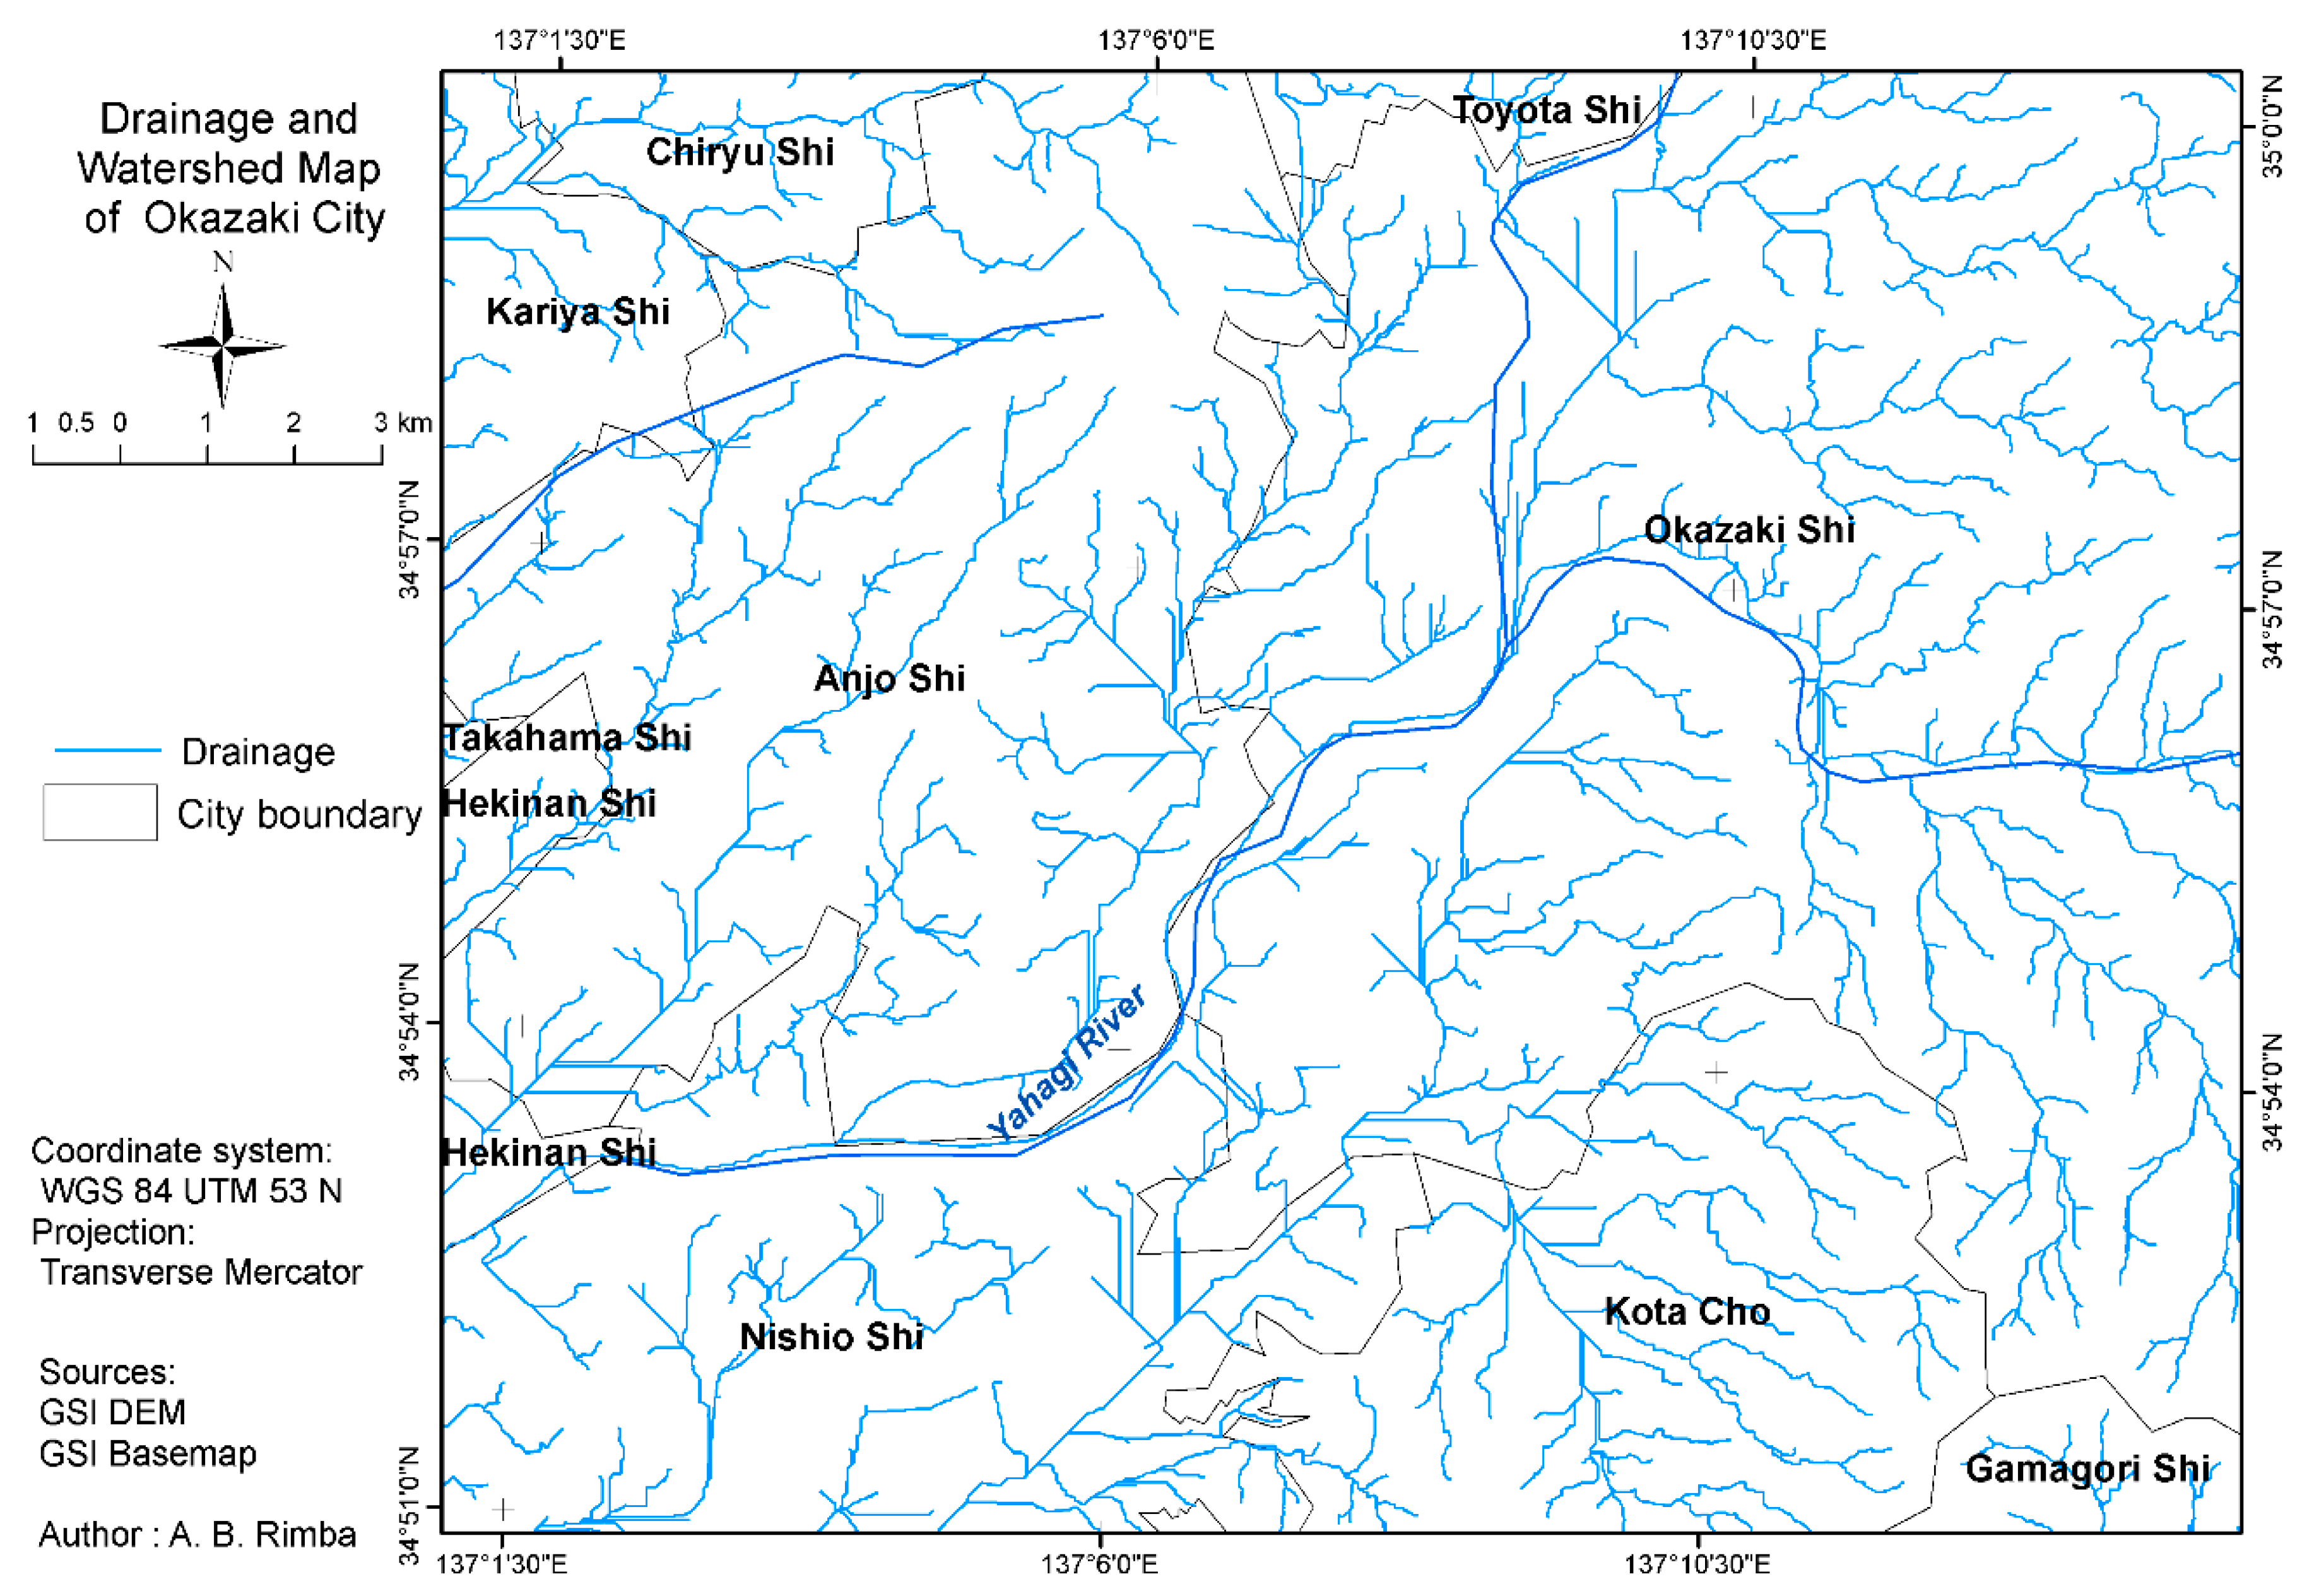
3.2.2. Drainage Density
3.2.3. Slope
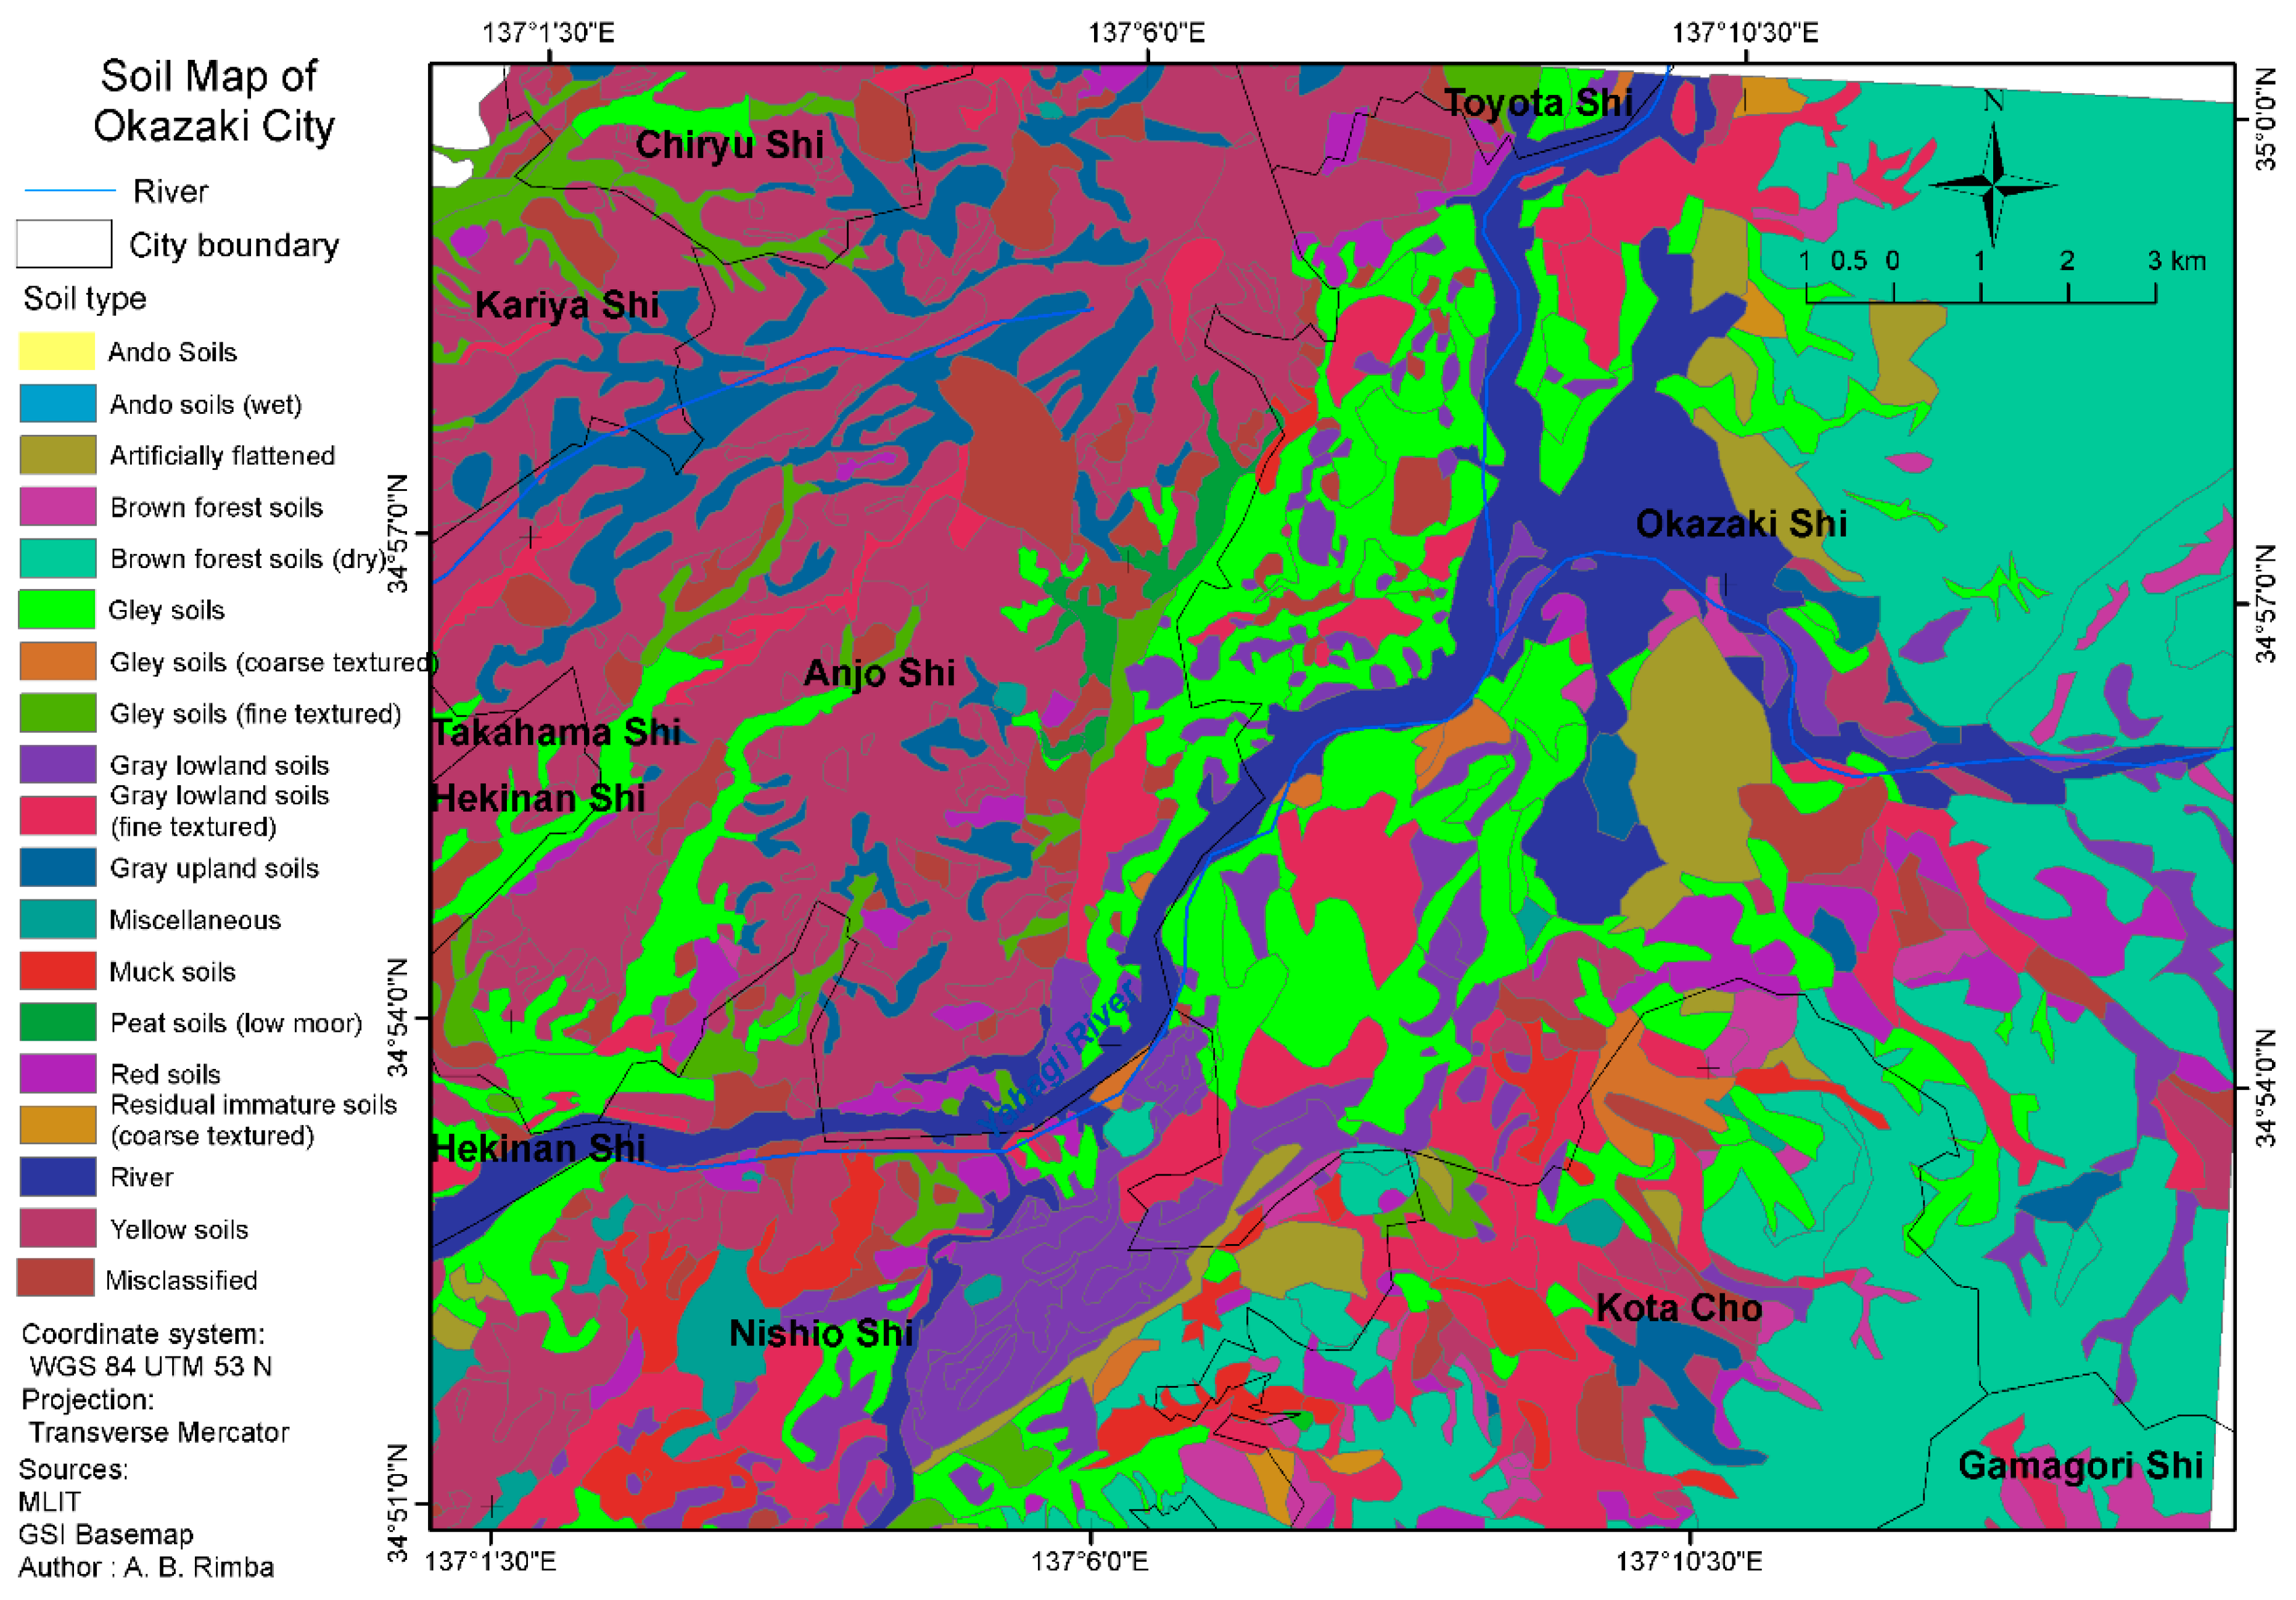
3.2.4. Soil
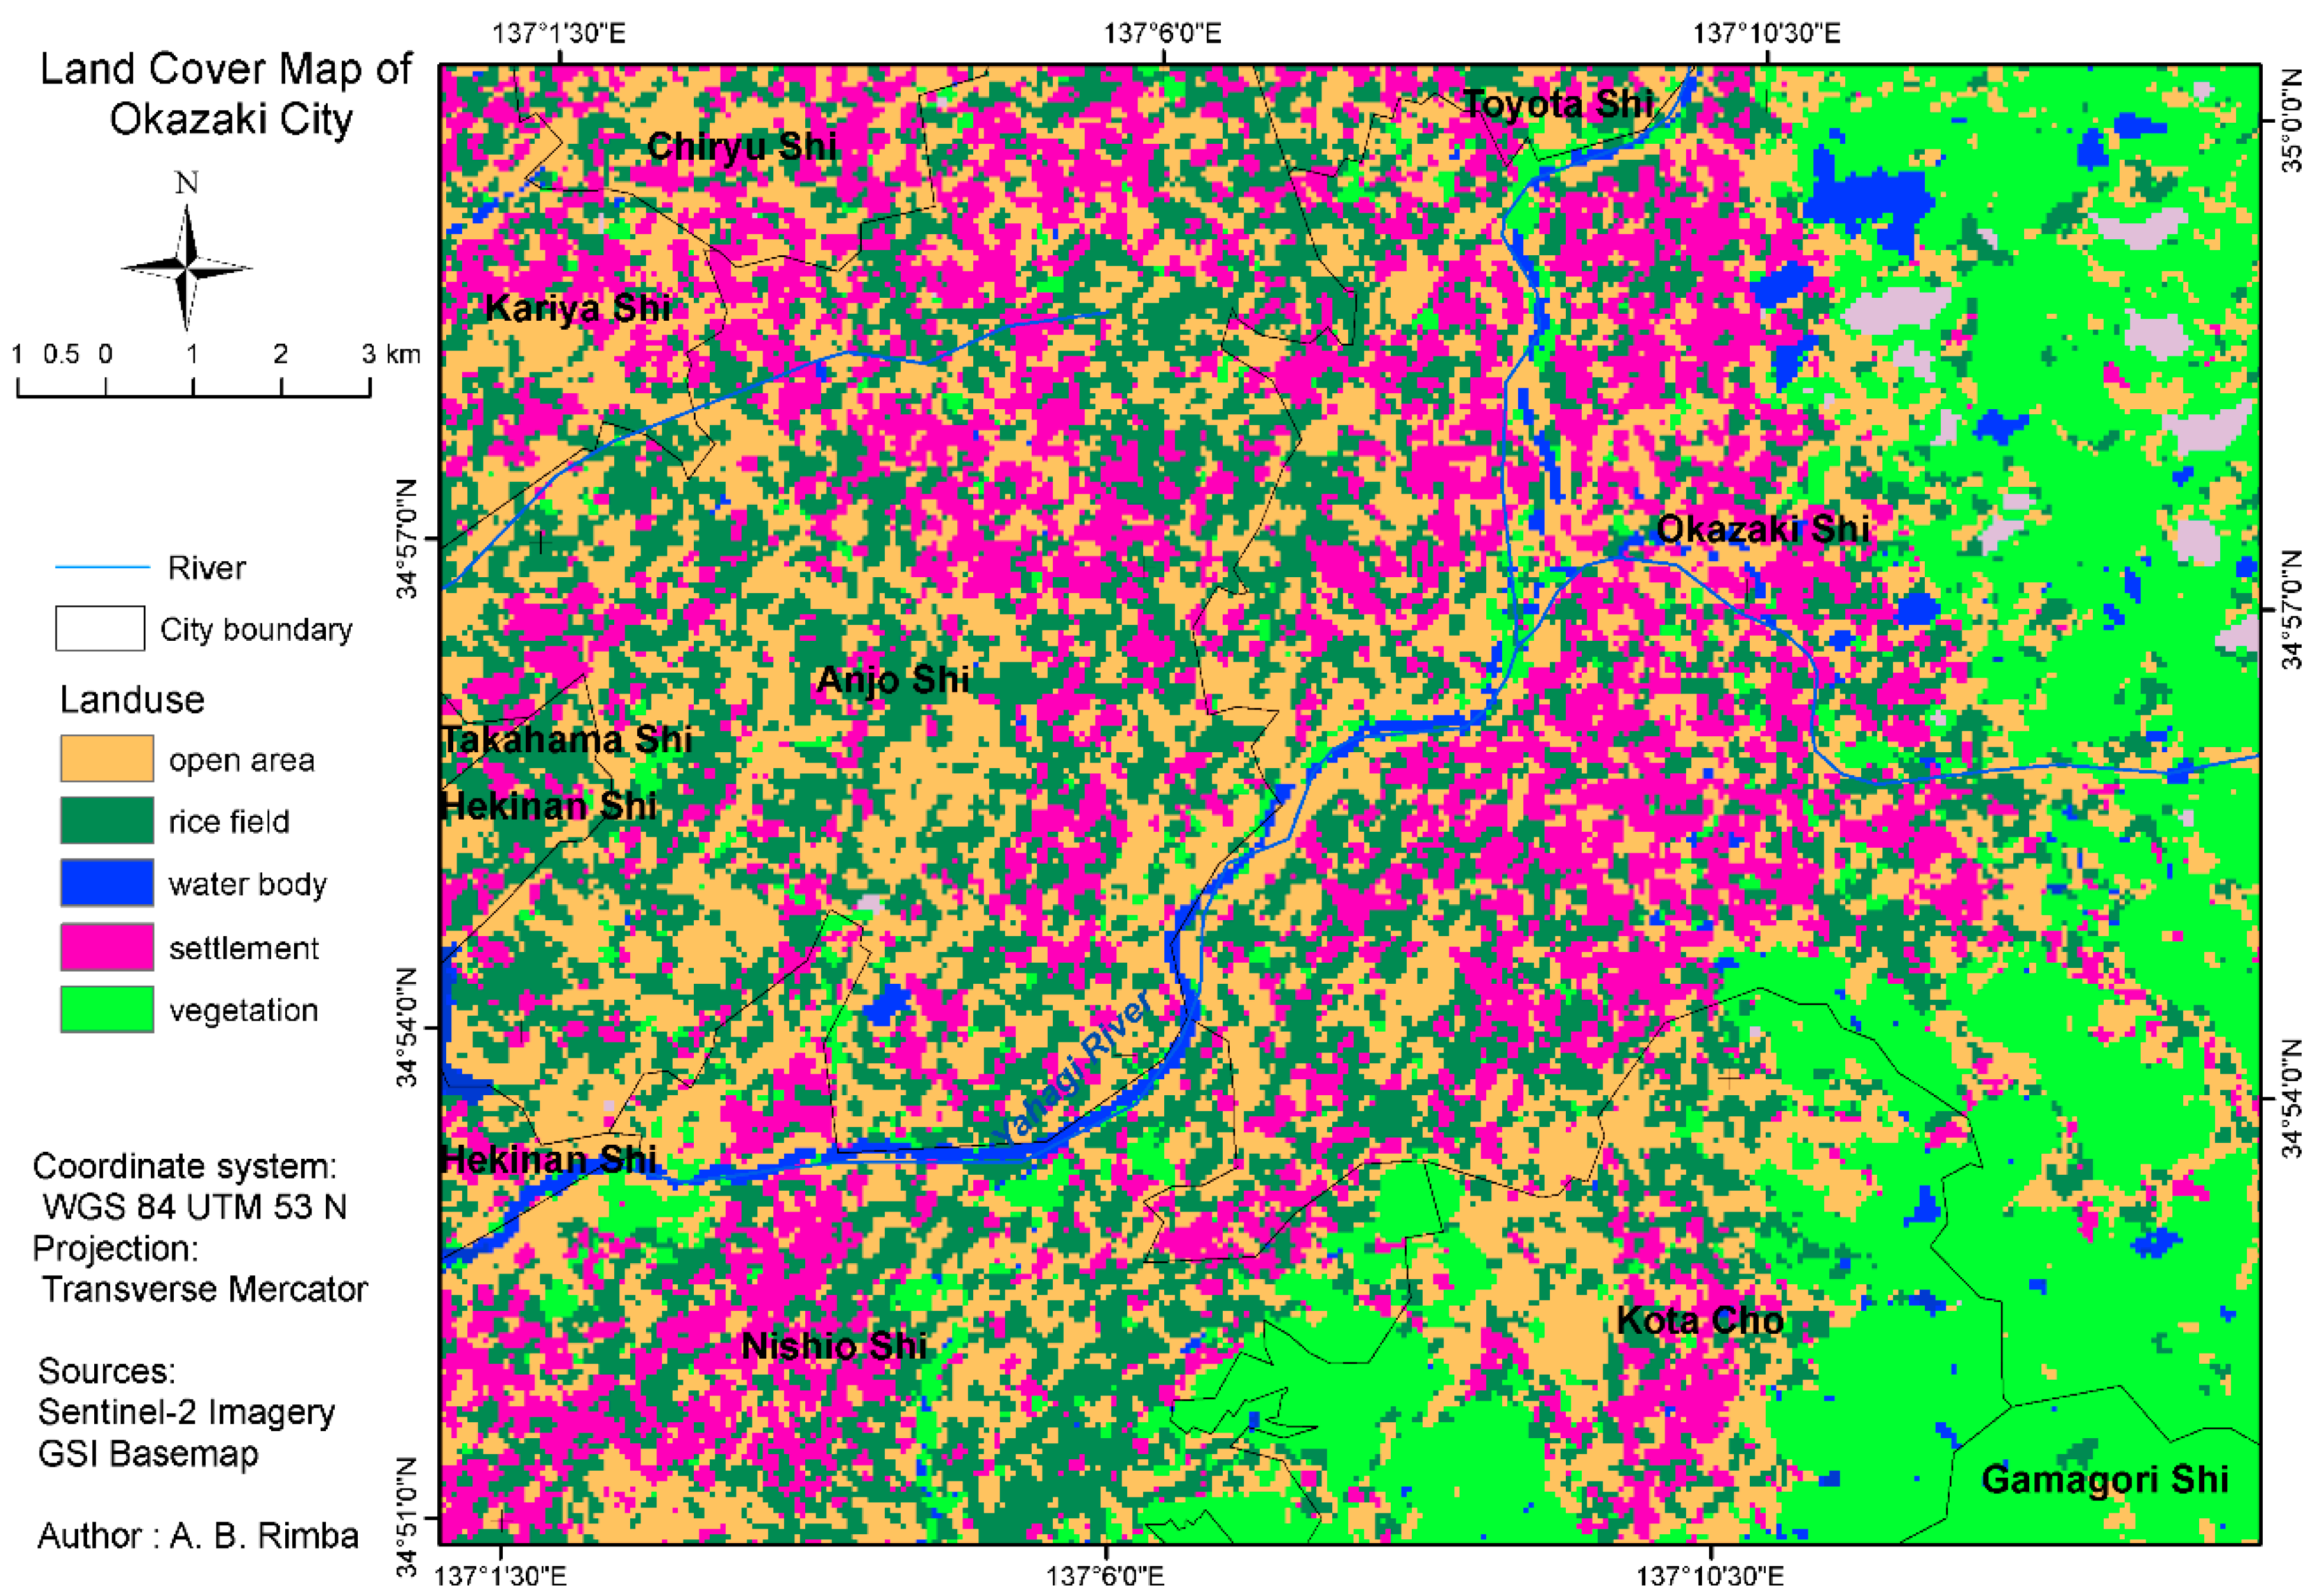
3.2.5. Land Cover
3.3. Analytical Hierarchy Process (AHP)
3.3.1. Relative Weight of the Parameters
3.3.2. Consistency Index (CI) and Consistency Ratio (CR)
4. Results
4.1. Ranking of Map Criteria by AHP
- (1)
- Determine each factor percentage to distinguish the weight.
- (2)
- Assign the least important factor from step 1 and assume the importance scale among the objective is linear.
- (3)
- The importance of factor should be ranked from 1 to 5, where 1 represents the least important factor and 5 is the most important.
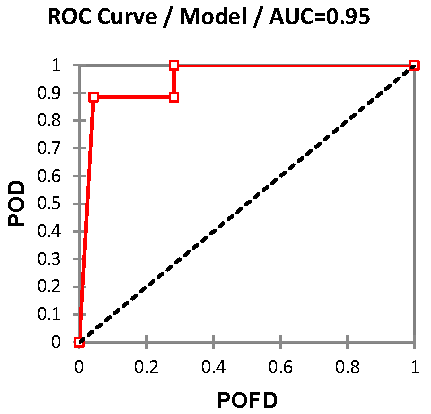
4.2. Flood Validation
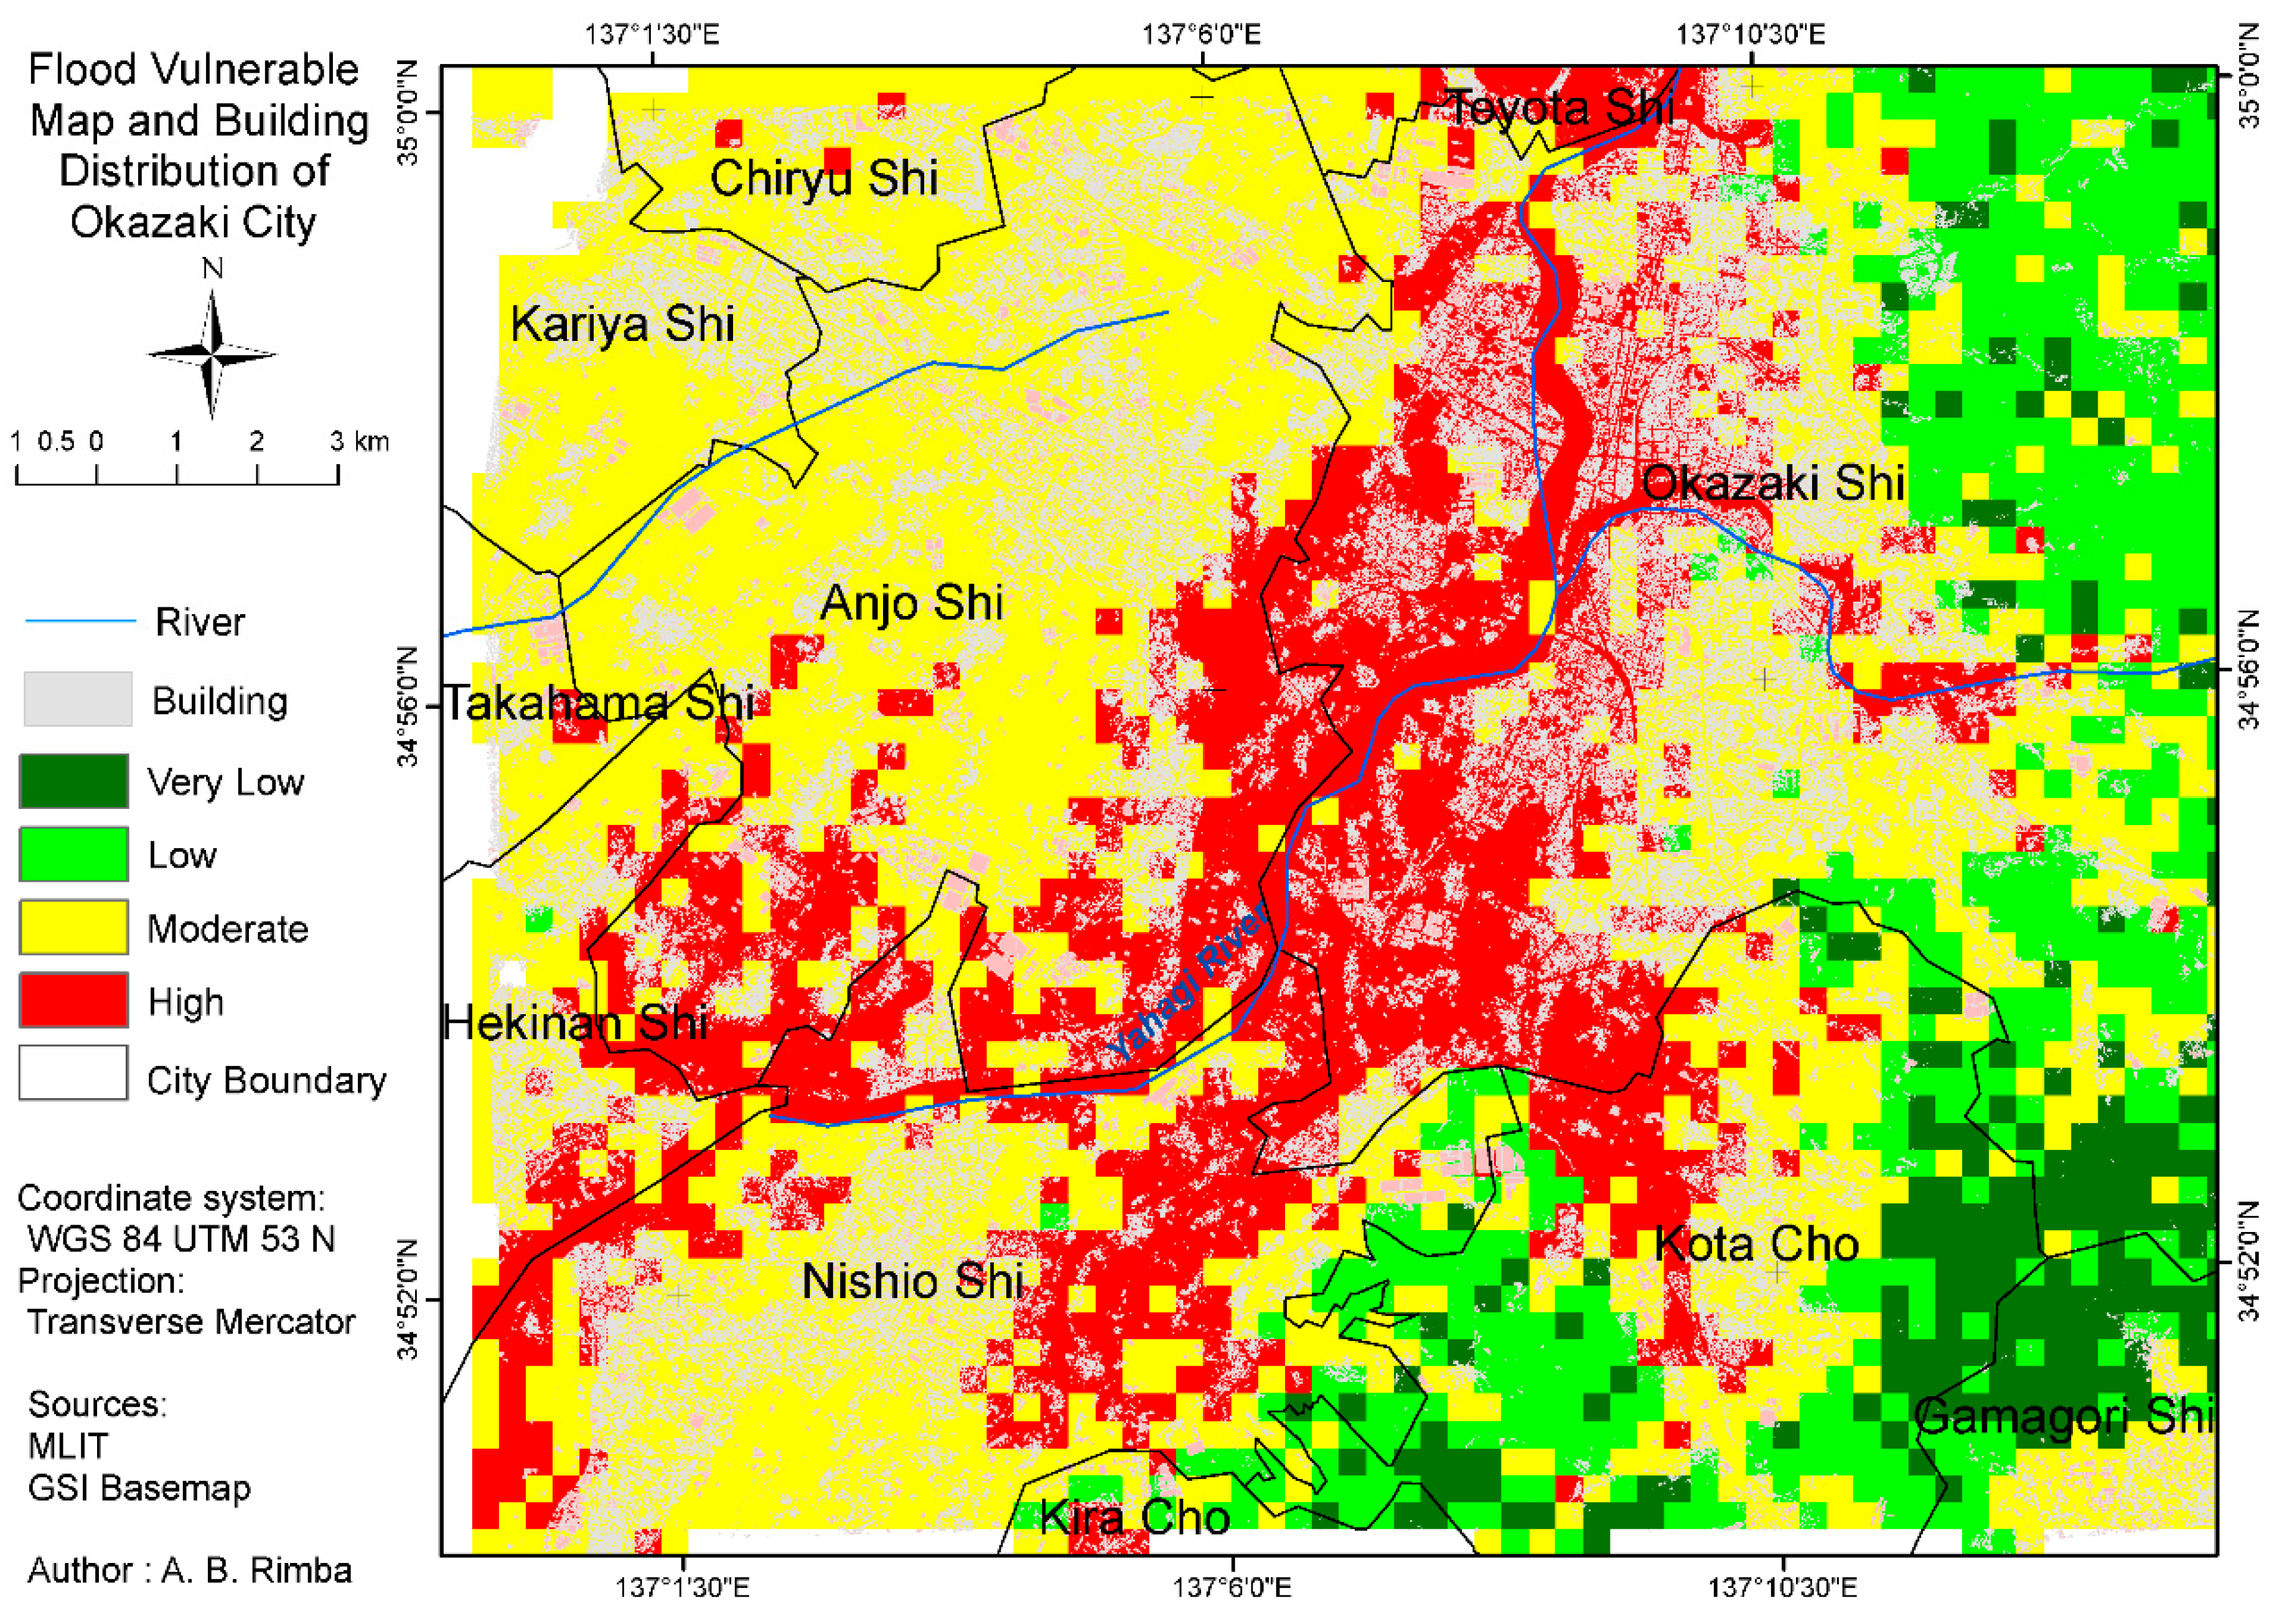
4.3. Urban Flood-Risk Area
5. Conclusions
Acknowledgments
Author Contributions
Conflicts of Interest
References
- Kazama, S.; Sato, A.; Kawagoe, S. Evaluating the Cost of Flood Damage Based on Changes in Extreme Rainfall in Japan. Sustain. Sci. 2009, 4, 61–69. [Google Scholar] [CrossRef]
- Ministry of Land, Infrastructure and Transport (MLIT); International Center for Water Hazard and Risk Management (ICHARM). Flood Hazard Mapping Manual in Japan; MLIT and ICHARM: Tokyo, Japan, 2005.
- Tockner, K.; Bunn, S.E.; Gordon, C.; Naiman, R.J.; Quinn, G.P.; Standord, J.A. Flood plains: Critically threatened ecosystems. In Aquatic Ecosystems; Cambridge University Press: Cambridge, UK, 2008. [Google Scholar]
- Japan Meteorology Agency (JMA). Hourly Wather Observation. Available online: http://www.jma.go.jp/en/amedas_h/index.html (accessed on 22 October 2016).
- Hong, J.-Y.; Bae-Ahn, J. Change of early summer of precipitation in the Korean Peninsula and Nearby Regions based on RCP simulation. J. Clim. 2015, 28, 3557–3578. [Google Scholar] [CrossRef]
- Ouma, Y.O.; Tateishi, R. Urban Flood Vulnerability and Risk Mapping Using Integrated Multi-Parametric AHP and GIS: Methodological Overview and Case Study Assessment. Water 2014, 6, 1515–1545. [Google Scholar] [CrossRef]
- Rufat, S.; Tate, E.; Burton, C.G.; Maroof, A.S. Social vulnerability to floods: Review of case studies and implications for measurement. Int. J. Disaster Risk Reduct. 2015, 14, 470–486. [Google Scholar] [CrossRef]
- Larsen, J.B. Forestry between land use intensification and sustainable development: Improving landscape functions with forests and trees. Geogr. Tidsskr. Dan. J. Geogr. 2009, 109, 191–195. [Google Scholar] [CrossRef]
- United Nations. World Urbanization Prospects—The 2011 Revision; United Nations: New York, NY, USA, 2012. [Google Scholar]
- Wilby, R.L.; Keenan, R. Adapting to flood risk under climate change. Prog. Phys. Geogr. 2012, 2012, 348–378. [Google Scholar] [CrossRef]
- Schanze, J.; Zeman, E.; Marsalek, J. Flood Risk Management: Hazards, Vulnerability and Mitigation Measures; Springer: Berlin, Germany, 2006. [Google Scholar]
- Panagiota, M.; Jocelyn, C.; Erwan, P. State of the Art on Remote Sensing for Vulnerability and Damage Assessment on Urban Context; Urban Seismology-Seismic Risk Evaluation by Using Innovative Techniques; GIPSA-Lab: Saint-Martin-d’Hères, France; ISTerre: Gières, France, 2011. [Google Scholar]
- Ebert, A.; Kerle, N. Urban social vulnerability assessment using object-oriented analysis of Remote Sensing and GIS Data. Int. Arch. Photogram. Remote Sens. Spat. Inf. Sci. 2008, 37, 1307–1312. [Google Scholar]
- Saaty, T.L. The analytical Hierarchy Process—What it is and how it is used. Math. Modell. 1987, 9, 161–176. [Google Scholar] [CrossRef]
- Saaty, T.L. Decision making with the analytic hierarchy process. Int. J. Serv. Sci. 2008, 1, 83–98. [Google Scholar] [CrossRef]
- Saaty, T.L. A scaling method for priorities in hierarchical structures. J. Math. Psychol. 1977, 15, 234–281. [Google Scholar] [CrossRef]
- Siddayao, G.P.; Valdez, S.E.; Fernandez, P.L. Analytic Hierarchy Process (AHP) in Spatial Modeling for Floodplain Risk Assessment. Int. J. Mach. Learn. Comput. 2014, 4, 450–457. [Google Scholar] [CrossRef]
- Kazakis, N.; Kougias, I.; Patsialis, T. Assessment of flood hazard areas at a regional scale using an index-based approach and Analytical Hierarchy Process: Application in Rhodope–Evros region, Greece. Sci. Total Environ. 2015, 538, 555–563. [Google Scholar] [CrossRef] [PubMed]
- Bathrellos, G.D.; Karymbalis, E.; Skilodimou, H.D.; Gaki-Papanastassiou, K.; Baltas, E.A. Urban flood hazard assessment in the basin of Athens Metropolitan city, Greece. Environ. Earth Sci. 2016, 75, 319. [Google Scholar] [CrossRef]
- Bathrellos, G.D.; Skilodimou, H.D.; Chousianitis, K.; Youssef, A.M.; Pradhan, B. Suitability estimation for urban development using multi-hazard assessment map. Sci. Total Environ. 2017, 575, 119–134. [Google Scholar] [CrossRef] [PubMed]
- Sambah, A.B.; Miura, F. Remote sensing and spatial multi-criteria analysis for tsunami vulnerability assessment. Disaster Prev. Manag. 2014, 23, 271–295. [Google Scholar] [CrossRef]
- Sambah, A.B.; Miura, F. Integration of Spatial Analysis for Tsunami Inundation and Impact Assessment. J. Geogr. Inf. Syst. 2014, 6, 11–22. [Google Scholar] [CrossRef]
- Poursaber, M.R.; Ariki, Y. Estimation of Tsunami Hazard Vulnerability Factors by Integrating Remote Sensing, GIS and AHP Based Assessment. Open Access Libr. J. 2016, 3, 1–11. [Google Scholar] [CrossRef]
- Kayasthaa, P.; Dhital, M.R.; de Smedt, F. Application of the analytical hierarchy process (AHP) for landslide susceptibility mapping: A case study from the Tinau watershed, west Nepal. Comput. Geosci. 2013, 52, 398–408. [Google Scholar] [CrossRef]
- Hasekioğulları, G.D.; Ercanoglu, M. A new approach to use AHP in landslide susceptibility mapping: A case study at Yenice (Karabuk, NW Turkey). Nat. Hazards 2012, 63, 1157–1179. [Google Scholar] [CrossRef]
- Shahabi, H.; Hashim, M. Landslide susceptibility mapping using GIS-based statistical models and Remote sensing data in tropical environment. Sci. Rep. 2015, 5, 9899. [Google Scholar] [CrossRef] [PubMed]
- Ahmed, B. Landslide susceptibility modelling applying user-defined weighting and data-driven statistical techniques in Cox’s Bazar Municipality, Bangladesh. Nat. Hazards 2015, 79, 1707–1737. [Google Scholar] [CrossRef]
- Rozos, D.; Bathrellos, G.D.; Skillodimou, H.D. Comparison of the implementation of rock engineering system and analytic hierarchy process methods, upon landslide susceptibility mapping, using GIS: A case study from the Eastern Achaia County of Peloponnesus, Greece. Environ. Earth Sci. 2011, 63, 49–63. [Google Scholar] [CrossRef]
- Ahmed, B. Landslide susceptibility mapping using multi-criteria evaluation techniques in Chittagong Metropolitan Area, Bangladesh. Landslides 2015, 12, 1077–1095. [Google Scholar] [CrossRef]
- Ekrami, M.; Marj, A.F.; Barkhordari, J.; Dashtakian, K. Drought vulnerability mapping using AHP method in arid and semiarid areas: A case study for Taft Township, Yazd Province, Iran. Environ. Earth Sci. 2016, 75, 1–13. [Google Scholar] [CrossRef]
- Bathrellos, G.D.; Gaki-Papanastassiou, K.; Skilodimou, H.D.; Skianis, G.A.; Chousianitis, K.G. Assessment of rural community and agricultural development using geomorphological-geological factors and GIS in the Trikala prefecture (Central Greece). Stoch. Environ. Res. Risk Assess. 2013, 27, 573–588. [Google Scholar] [CrossRef]
- Bathrellos, G.D.; Gaki-Papanastassiou, K.; Skilodimou, H.D.; Papanastassiou, D.; Chousianitis, K.G. Potential suitability for urban planning and industry development using natural hazard maps and geological-geomorphological parameters. Environ. Earth Sci. 2012, 66, 537–548. [Google Scholar] [CrossRef]
- Ran, J.; Nedovic-Budic, Z. Integrating spatial planning and flood risk management: A new conceptual framework for the spatially integrated policy infrastructure. Comput. Environ. Urban Syst. 2016, 57, 68–79. [Google Scholar] [CrossRef]
- Van Herk, S.; Zevenbergen, C.; Ashley, R.; Rijke, J. Learning and Action Alliances for the integration of flood risk management into urban planning: A new framework from empirical evidence from The Netherlands. Environ. Sci. Policy 2011, 14, 543–554. [Google Scholar] [CrossRef]
- Plate, E.J. Flood risk and flood management. J. Hydrol. 2002, 267, 2–11. [Google Scholar] [CrossRef]
- Weblio. Okazaki City. Available online: http://www.weblio.jp/wkpja/content/%E5%B2%A1%E5%B4%8E%E5%B8%82_%E6%A6%82%E8%A6%81#cite_ref-chunichi2016-2-18_4-0 (accessed on 22 July 2016). (In Japanese)
- Okazakishi. Current Status and Problems of Biodiversity. Available online: http://www.city.okazaki.lg.jp/1300/1303/1326/p011109.html (accessed on 22 July 2016). (In Japanese)
- Okazakishi. Creating Master Plan of Okazaki Municipal Water Environment: Draft; Master Plan of Okazaki Municipal Water Environment: Okazaki, Japan, 2015. (In Japanese) [Google Scholar]
- Adachi, T. Flood damage mitigation efforts in Japan. In Proceedings of the Fifth US-Japan Conference on Flood Control and Water Resources Management, Tokyo, Japan, 27–29 September 2009.
- Okazakishi. Okazaki City. Available online: http://disapotal.gsi.go.jp/viewer/index.html?code=4 (accessed on 7 July 2016).
- Edwards, J.; Gustafsson, M.; Näslund-Landenmark, B. Handbook for Vulnerability Mapping: EU Asia Pro Eco Project Disaster Reduction through Awareness, Preparedness and Prevention Mechanisms in Coastal Settlements in Asia Demonstration in Tourism Destinations; EU and International Affairs Department; Swedish Rescue Services Agency: Karlstad, Sweden, 2007.
- Greenbaum, N.; Margalit, A.; Schick, A.P.; Sharon, D.; Baker, V.R. A high magnitude storm and flood in a hyperarid catchment, Nahal Zin, Negev Desert, Israel. Hydrol. Process. 1998, 12, 1–23. [Google Scholar] [CrossRef]
- Setiawati, M.D.; Miura, F.; Aryastana, P. Validation of hourly GSMaP and ground base estimates of precipitation for flood monitoring in Kumamoto, Japan. In Geospatial Technology for Water Resource Applications; CRC Press: Boca Raton, FL, USA, 2016. [Google Scholar]
- Rimba, A.B.; Miura, F. Predicting Flood-vulnerability of Areas Using Satellite Remote-sensing Images in Kumamoto City, Japan. In Geospatial Technology for Water Resource Applications; CRC Press: Boca Raton, FL, USA, 2016. [Google Scholar]
- Setiawati, M.D.; Miura, F. Evaluation of GSMaP Daily Rainfall Satellite Data for Flood Monitoring: Case Study—Kyushu Japan. J. Geosci. Environ. Protect. 2016, 4, 101–117. [Google Scholar] [CrossRef]
- Horton, R.E. Erosional Development of Streams and Their Drainage Basins; Hydrophysical Approach to Quantitative Morphology. Geol. Soc. Am. Bull. 1945, 56, 275–370. [Google Scholar] [CrossRef]
- Pallard, B.; Castellarin, A.; Montanary, A. A look at the links between drainage density and flood statistics. Hydrol. Earth Syst. Sci. 2009, 13, 1019–1029. [Google Scholar] [CrossRef]
- Merz, R.; Bloschl, G. Flood frequency hydrology: 2. Combining data evidence. Water Resour. Res. 2008, 44, 1–6. [Google Scholar] [CrossRef]
- Di Lazzaro, M.; Zarlenga, A.; Volpi, E. A new approach to account for the spatial variability of drainage density in rainfall-runoff modeling. Boletín Geológico y Minero 2014, 152, 301–313. [Google Scholar]
- Anwar, M.R. The rainfall-runoff modeling using of the watershed physical characteristic approach. Int. J. Civ. Environ. Eng. 2011, 11, 71–75. [Google Scholar]
- Moglen, G.E. On the sensitivity of drainage density to climate change. Water Resour. Res. 1998, 34, 855–862. [Google Scholar] [CrossRef]
- Bateman, A.; Medina, V.; Velasco, D. Soil Infiltration Effect in Flat Areas Floods Simulation. In Proceedings of the 18th International Conference on Water Resources, Barcelona, Sapin, 21–24 June 2010.
- Ghazavi, R.; Vali, A.; Eslamian, S. Impact of Flood Spreading on Infiltration Rate and Soil Properties in an Arid Environment. Water Resour. Manag. 2010, 24, 2781–2793. [Google Scholar] [CrossRef]
- Zope, P.E.; Eldho, T.I.; Jothiprakash, V. Impacts of land use–land cover change and urbanization on flooding: A case study of Oshiwara River Basin in Mumbai, India. CATENA 2016, 145, 142–154. [Google Scholar] [CrossRef]
- Al-Khudhairy, D.; Shepherd, I. Changes in Land-Use and Land-Cover: A Cause of Flooding? A Literature Review; Institute for Systems, Informatics and Safety: Ispra, Italy, 1997. [Google Scholar]
- Halounova, L.; Holubec, V. Assessment of Flood with Regards to Land Cover Changes. In Proceedings of the 4th International Conference on Building Resilience, Incorporating the 3rd Annual Conference of the ANDROID Disaster Resilience Network, Salford Quays, UK, 8–11 September 2014; Volume 18, pp. 940–947.
- Trenberth, K.E. The impact of climate change and variability on heavy precipitation, floods, and droughts. In Encyclopedia of Hydrological Sciences; John Wiley & Sons, Ltd.: Hoboken, NJ, USA, 2005. [Google Scholar]
- Bracken, L.J.; Cox, N.J.; Shannon, J. The relationship between rainfall inputs and flood generation in South–East Spain. Hydrol. Process. 2007, 22, 683–696. [Google Scholar] [CrossRef]
- Gregory, K.J.; Walling, D.E. The variation of drainage density within a catchment. Int. Assoc. Sci. Hydrol. Bull. 1968, 13, 61–68. [Google Scholar] [CrossRef]
- Ogden, F.L.; Pradhan, N.R.; Downer, C.W.; Zahner, J.A. Relative importance of impervious area, drainage density, width function, and subsurface storm drainage on flood runoff from an urbanized catchment. Water Resour. Res. 2011, 47, 12. [Google Scholar] [CrossRef]
- Geokov. Geokov Education. Available online: http://geokov.com/education/slope-gradient-topographic.aspx (accessed on 7 July 2016).
- Haynes, R.H. The Canadian System of Soil Classification, 3rd ed.; NRC Research Press: Ottawa, ON, Canada, 1998. [Google Scholar]
- Amano, Y. Classification of Cultivated Soils in Japan. JARQ 1985, 18, 4. [Google Scholar]
- Obara, H.; Maejima, Y.; Kohyama, K.; Ohkura, T.; Takata, Y. Outline of Comprehensive Soil Classification System of Japan-First Approximation. Jpn. Agr. Res. Q. 2014, 3, 217–226. [Google Scholar] [CrossRef]
- Perrin, J.L.; Bouvier, C.; Janeau, J.L.; Ménez, G.; Cruz, F. Rainfall/runoff processes in a small peri-urban catchment in the Andes mountains. The Rumihurcu Quebrada, Quito (Ecuador). Hydrol. Process. 2001, 15, 843–854. [Google Scholar] [CrossRef]
- Tejedor, M.; Neris, J.; Jiménez, C. Soil Properties Controlling Infiltration in Volcanic Soils (Tenerife, Spain). Soil Sci. Soc. Am. J. 2013, 77, 202–212. [Google Scholar] [CrossRef]
- Kyuma, K.; Kawaguchi, K. Major Soils of Southeast Asia and the Classification of Soils Under Rice Cultivation (Paddy Soils). Kyoto Univ. Center Southeast Asian Stud. 1966, 4, 290–312. [Google Scholar]
- Academia Sinica Institute of Soil Science. In Proceedings of Symposium on Paddy Soil, 1st ed.; Science Press: Beijing, China; Springer: Berlin/Heidelberg, Germany, 1981.
- Kern, J. Water Use and Conservation; California Department of Water Resources: Sacramento Country, CA, USA, 2010.
- Doerr, S.H.; Shakesby, R.A.; Walsh, R.P.D. Soil water repellency: Its causes, characteristics and hydro-geomorphological significance. Earth Sci. Rev. 2000, 51, 1–4. [Google Scholar] [CrossRef]
- Brouwer, C. Gestion des Eaux en Irrigation Manual de Fromation No. 5 Methodes D’irrigation; Devision de la Mise en Valeur des Terres et Des Eaux; Food and Agriculture Organization (FAO): Rome, Italy, 1990. (In French) [Google Scholar]
- Johnson, A.I. A Field Method for Measurement of Infiltration, 2nd ed.; U.S. GeoloTical Survey: Denver, CO, USA, 1991. [Google Scholar]
- Sohl, T.; Benjamin, S. Role of remote sensing for land-use and land-cover change modeling. In Remote Sensing of Land Use and Land Cover: Principles and Applications; CRC Press: Boca Raton, FL, USA, 2012; pp. 225–239. [Google Scholar]
- Ahmed, B.; Ahmed, R. Modeling Urban Land Cover Growth Dynamics Using Multi-Temporal Satellite Images: A Case Study of Dhaka, Bangladesh. ISPRS Int. J. Geo-Inf. 2012, 1, 3–31. [Google Scholar] [CrossRef]
- Ahmed, B.; Ahmed, R.; Zhu, X. Evaluation of Model Validation Techniques in Land Cover Dynamics. ISPRS Int. J. Geo-Inf. 2013, 2, 577–597. [Google Scholar] [CrossRef]
- Anderson, J.R.; Hardy, E.E.; Roach, J.T.; Witmer, R.E. A Land Use and Land Cover Classification System for Use with Remote Sensor Data; Geological Survey; Land Cover Institute: Washington, DC, USA, 1976. [Google Scholar]
- ESA. ESA Sentinel Online. Available online: https://earth.esa.int/web/sentinel/user-guides/sentinel-2-msi/resolutions/spatial (accessed on 22 October 2016).
- Esri. ArcGIS Spatial Analyyst: Advanced GIS Spatial Analysis Using Raster and Vector Data; Esri: New York, NY, USA, 2001. [Google Scholar]
- Demek, J. Manual of Detailed Geomorphological Mapping; Academia, Publishing House of the Czechoslovak Academy of Science: Prague, Czech Republic, 1972. [Google Scholar]
- Mason, I. A model for assessment of weather forecasts. Aust. Meteorol. Mag. 1982, 30, 291–303. [Google Scholar]
- Brooks, H.E. Tornado-warning performance in the past and future. Bull. Am. Meteorol. Soc. 2004, 85, 837–843. [Google Scholar] [CrossRef]
- Brooks, H.E.; Marsh, P.T.; Kowaleski, A.M.; Groenemeijer, P.; Thompson, T.E.; Schwart, C.S.; Shafer, C.M.; Kolodziej, A.; Dahl, N.; Buckey, D. Evaluation of European Storm Forecast Experiment (ESTOFEX) forecasts. Atmos. Res. 2011, 100, 538–546. [Google Scholar] [CrossRef]
- Eastman, R.J. DIRISI Andes: Guide to GIS and Image; Clark University: Worcester, MA, USA, 2001. [Google Scholar]
- Okazakishi. Okazaki Agriculture Review. Available online: http://www.city.okazaki.lg.jp/1300/1301/1313/p017725.html (accessed on 7 July 2016).
- Xiao, Q.; McPherson, E.G.; Simpson, J.R.; Ustin, S.L. Hydrologic processes at the urban residential scale. Hydrol. Process. 2007, 21, 2174–2188. [Google Scholar] [CrossRef]
- Ministry of Land, Infrastructure, Transport and Tourism (MLIT). Introduction of Urban Land Use Planning System in Japan; City Planning Devision of MLIT: Tokyo, Japan, 2013.


| Rainfall Intensity | Description |
|---|---|
| 10–20 mm/h | Slightly strong rain |
| 20–30 mm/h | Strong rain |
| 30–50 mm/h | Heavy rain |
| 50–80 mm/h | Very hard rain |
| >80 mm/h | Raging rain |
| Slope Class | Slope (%) | Slope (Degree) | Terminology |
|---|---|---|---|
| 1 | 0–0.5 | 0 | Level |
| 2 | >0.5–2 | 0.3–1.1 | Near level |
| 3 | >2–5 | >1.1–3 | Very gentle slopes |
| 4 | >5–10 | >3–5 | Gentle slopes |
| 5 | >10–15 | >5–8.5 | Moderate slopes |
| 6 | >15–30 | >8.5–16.5 | Strong slopes |
| 7 | >30–45 | >16.5–24 | Very strong slopes |
| 8 | >45–70 | >24–35 | Extreme slopes |
| 9 | >70–100 | >35–45 | Steep slopes |
| 10 | >100 | >45 | Very steep slopes |
| Soil Groups | Description |
|---|---|
| Ando soils | Ando soils are from volcano parent material and unconsolidated soils. Their colors are dark rich from organic matter and have well-drained conditions. At an altitude of 3300 m, their textures are sandy-silt regosoils [63,65]. |
| Ando soils (wet) | Ando soils wet have the same parent material as the Ando soils but poorly drained conditions and are freckled due to groundwater or irrigation water. Their colors are dark and rich from organics. They distribute in alluvial bottom land and are utilized as a paddy field [63]. |
| Brown forest soils | Brown Forest soils are composed by various parent material. Their colors are yellow-brown, and they are well drained and spread in a mountainous area as upland crops, tree crops and pasture. Small parts of these soils are utilized for cultivating [63]. |
| Gley soils | Gley soils are poorly drained alluvial plains and high groundwater tables. These soils are broadly used for paddy rice cultivation [63]. |
| Gray lowland soils | Gray Lowland soils are from Holocene alluvial plains or polders under well- to imperfectly drained conditions. These soils are the most productive for paddy cultivated soil in Japan [63]. |
| Muck soils | Muck soils decompose more than 20% of organic matter from back marshes, the margin of peat moor, etc. Compared to Ando soils, they have low phosphate retention and are widely utilized as a paddy field [63]. |
| Red soils | Red soils are decomposed from various parent materials. These soils decompose due to humid conditions and the warm to temperate climate in western Japan. Red soils are spread in terraces and hills of low altitude near seacoasts and are suitable for upland crops, tree crops and grasses [63]. |
| Yellow soils | Yellow soils decompose due to humid warm and humid temperate climates. Their characteristics are similar to Red soils except for their yellow color. Some of them are poorly drained and have freckles [63]. |
| Manmade soils (artificially flattened areas) | Manmade soils are emplaced soil at least to a depth of 35 cm from the surface. These soils are deeply disturbed or reshaped by humans. There are two types of manmade soils according to their altitude, i.e., Manmade Upland soils and Manmade Lowland soils [63]. |
| Soil Texture, Type | Infiltration Rate (IR) mm/h | ||||
|---|---|---|---|---|---|
| 0%–4% | 5%–8% | 8%–12% | 12%–16% | >16% | |
| Coarse Sand | 31.75 | 25.4 | 19.05 | 12.7 | 7.874 |
| Medium Sand | 26.924 | 21.59 | 16.256 | 10.668 | 6.858 |
| Fine Sand | 23.876 | 19.05 | 14.224 | 9.652 | 6.096 |
| Loamy Sand | 22.352 | 17.78 | 13.462 | 8.89 | 5.588 |
| Sandy Loam | 19.05 | 15.24 | 11.43 | 7.62 | 4.826 |
| Fine Sandy Loam | 16.002 | 12.7 | 9.652 | 6.35 | 4.064 |
| Very Fine Sandy Loam | 14.986 | 11.938 | 8.89 | 6.096 | 3.81 |
| Loam | 13.716 | 10.922 | 8.382 | 5.588 | 3.556 |
| Silt Loam | 12.7 | 10.16 | 7.62 | 5.08 | 3.302 |
| Silt | 11.176 | 8.89 | 6.604 | 4.572 | 2.794 |
| Sandy Clay | 7.874 | 6.35 | 4.826 | 3.048 | 2.032 |
| Clay Loam | 6.35 | 5.08 | 3.81 | 2.54 | 1.524 |
| Silty Clay | 4.826 | 3.81 | 2.794 | 2.032 | 1.27 |
| Land Cover | Description |
|---|---|
| Built-up land | Area that has been populated (e.g., land use: residential, commercial, industrial, transportation and facilities). |
| Forest or rangeland | Area covered with mature trees, shrubby plants and other plants growing close together. |
| Water | Area covered with water such as river and lakes |
| Agricultural land | Rainfed cropping, planted and irrigated cropping areas, areas covered mainly with herbaceous vegetation with shrubs (e.g., open area) |
| Barren land | Mountainous or hill areas, no covered vegetation area, degraded land and all unused area. |
| Intensity of Importance | Definition | Explanation |
|---|---|---|
| 1 | Equal importance | Two elements contribute equally to the objective |
| 3 | Moderate importance | Experience and judgment slightly favor one parameter overanother |
| 5 | Strong importance | Experience and judgment strongly favor one parameter over another |
| 7 | Very strong importance | One parameter is favored very strongly s and is considered superior to another; its dominance is demonstrated in practice |
| 9 | Extreme importance | The evidence favoring one parameter as superior to another is of the highest possible order of affirmation |
| Criteria | Rainfall | Drainage Density | Slope | Soil | Land Cover |
|---|---|---|---|---|---|
| Rainfall | 1 | 1 | 1/3 | 2 | 2 |
| Drainage density | 1 | 1 | 1/2 | 2 | 2 |
| Slope | 3 | 2 | 1 | 4 | 4 |
| Soil | 1/2 | 1/2 | 1 | 1 | |
| Land cover | 1/2 | 1/2 | 1/4 | 1 | 1 |
| Summary | 6 | 5 | 2 | 10 | 10 |
| Rainfall | Drainage | Slope | Soil | Land Cover | Priority | Percent | |
|---|---|---|---|---|---|---|---|
| Rainfall | 0.167 | 0.200 | 0.143 | 0.200 | 0.200 | 0.174 | 17% |
| Drainage | 0.167 | 0.200 | 0.214 | 0.200 | 0.200 | 0.196 | 20% |
| Slope | 0.500 | 0.400 | 0.429 | 0.400 | 0.400 | 0.434 | 43% |
| Soil | 0.083 | 0.100 | 0.107 | 0.100 | 0.100 | 0.098 | 10% |
| Land cover | 0.083 | 0.100 | 0.107 | 0.100 | 0.100 | 0.098 | 10% |
| Total | 1 | 1 | 1 | 1 | 1 | 100% |
| Parameters | Relative Weight | Re-Classified Parameter | Ranking |
|---|---|---|---|
| Rainfall intensity (R) [4] | 17% | 10–20 mm/h | 1 |
| 20–30 mm/h | 2 | ||
| 30–50 mm/h | 3 | ||
| 50–80 mm/h | 4 | ||
| >80 mm/h | 5 | ||
| Drainage density (DD) [78] | 20% | <0.001434 m/m2 | 1 |
| 0.001435–0.00287 m/m2 | 2 | ||
| 0.00288–0.004305 m/m2 | 3 | ||
| 0.004306–0.00574 m/m2 | 4 | ||
| >0.00574 m/m2 | 5 | ||
| Slope (S) [79] | 43% | Very strong, extreme, steep and very steep slope | 1 |
| Strong slope | 2 | ||
| Gentle slope to moderate slope | 3 | ||
| Very gentle slope | 4 | ||
| Level to near level | 5 | ||
| Soil(So) [71] (Basic infiltration rates by FAO) | 10% | Less than 30 mm/h (sand) | 1 |
| 20–30 mm/h (sandy loam) | 2 | ||
| 20–10 mm/h (loam) | 3 | ||
| 5–10 mm/h (clay loam) | 4 | ||
| 1–5 mm/h (clay) | 5 | ||
| Land cover(LC) [44] | 10% | Vegetation (forest) | 1 |
| Vegetation (crops tree) | 2 | ||
| Barren land | 3 | ||
| Built-up land | 4 | ||
| Rice field and open area | 5 |
| Rainfall | Drainage Density | Slope | Soil | Land Cover | |
|---|---|---|---|---|---|
| Lambda | 1.0189 | 1.0024 | 1.0016 | 1.0024 | 1.0024 |
| Model | Survey | Total | ||
| Flood | Non-Flood | |||
| Flood | 282 (a) | 352 (b) | 607 | |
| Non-Flood | 37 (c) | 820 (d) | 857 | |
| Total | 319 | 1145 | 1464 | |
© 2017 by the authors; licensee MDPI, Basel, Switzerland. This article is an open access article distributed under the terms and conditions of the Creative Commons Attribution (CC BY) license (http://creativecommons.org/licenses/by/4.0/).
Share and Cite
Rimba, A.B.; Setiawati, M.D.; Sambah, A.B.; Miura, F. Physical Flood Vulnerability Mapping Applying Geospatial Techniques in Okazaki City, Aichi Prefecture, Japan. Urban Sci. 2017, 1, 7. https://doi.org/10.3390/urbansci1010007
Rimba AB, Setiawati MD, Sambah AB, Miura F. Physical Flood Vulnerability Mapping Applying Geospatial Techniques in Okazaki City, Aichi Prefecture, Japan. Urban Science. 2017; 1(1):7. https://doi.org/10.3390/urbansci1010007
Chicago/Turabian StyleRimba, Andi Besse, Martiwi Diah Setiawati, Abu Bakar Sambah, and Fusanori Miura. 2017. "Physical Flood Vulnerability Mapping Applying Geospatial Techniques in Okazaki City, Aichi Prefecture, Japan" Urban Science 1, no. 1: 7. https://doi.org/10.3390/urbansci1010007
APA StyleRimba, A. B., Setiawati, M. D., Sambah, A. B., & Miura, F. (2017). Physical Flood Vulnerability Mapping Applying Geospatial Techniques in Okazaki City, Aichi Prefecture, Japan. Urban Science, 1(1), 7. https://doi.org/10.3390/urbansci1010007