Article

Rapid Classification of Cow, Goat, and Sheep Milk Using ATR-FTIR and Multivariate Analysis

by
Lamprini Dimitriou
1,
Michalis Koureas
2,
Christos Pappas
3,
Athanasios Manouras
4,
Dimitrios Kantas
1 and
Eleni Malissiova
1,*
1
Food of Animal Origin Laboratory, Animal Science Department, University of Thessaly, 41221 Larisa, Greece
2
Laboratory of Hygiene and Epidemiology, Faculty of Medicine, University of Thessaly, 41221 Larisa, Greece
3
Laboratory of Chemistry, Department of Food Science and Human Nutrition, Agricultural University of Athens, 11855 Athens, Greece
4
Laboratory of Food Chemistry, Biochemistry and Technology, Nutrition and Dietetics Department, University of Thessaly, 42132 Trikala, Greece
*
Author to whom correspondence should be addressed.
Submission received: 28 April 2025 / Revised: 13 June 2025 / Accepted: 25 June 2025 / Published: 1 July 2025

Abstract

Sheep and goat milk authenticity is of great importance, especially for countries like Greece, where these products are connected to the country’s rural economy and cultural heritage. The aim of the study is to evaluate the effectiveness of Fourier Transform Infrared Attenuated Total Reflectance (ATR-FTIR) spectroscopy in combination with chemometric techniques for the classification of cow, sheep, and goat milk and consequently support fraud identification. A total of 178 cow, sheep and goat milk samples were collected from livestock farms in Thessaly, Greece. Sheep and goat milk samples were confirmed as authentic by applying a validated Enzyme Linked Immunosorbent Assay (ELISA), while all samples were analyzed using ATR-FTIR spectroscopy in both raw and freeze-dried form. Freeze-dried samples exhibited clearer spectral characteristics, particularly enhancing the signals from triglycerides, proteins, and carbohydrates. Partial Least Squares Discriminant Analysis (PLS-DA) delivered robust discrimination. By using the spectral range between 600 and 1800 cm−1, 100% correct classification of all milk types was achieved. These findings highlight the potential of FTIR spectroscopy as a fast, non-destructive, and cost-effective tool for milk identification and species differentiation. This method is particularly suitable for industrial and regulatory applications, offering high efficiency.

1. Introduction

Milk is a nutritional cornerstone and economic driver for rural communities, providing essential proteins, lipids, carbohydrates, vitamins, and minerals and serving as the basis for a wide range of dairy products. Because cow, goat, and sheep milks differ markedly in composition with sheep’s milk being higher in fat, protein, and lactose, and goat’s milk offering greater digestibility and lower allergenicity, ensuring product quality and authenticity is critical [1,2]. In Greece, consumption of goat and sheep dairy exceeds 80% of the population, alongside a sustained rise in both production volumes and farmgate prices for small-ruminant milk [3].
Sheep and goat milk authenticity is essential for the production of premium cheeses and other dairy products with distinctive qualities [4]. For several cheese types, like Cyprus’s Halloumi cheese and Feta from Greece, which historically calls for sheep’s and/or goat’s milk, the usage of particular milk types, frequently in specified proportions, is an integral part of the traditional recipe and designation of origin [5,6]. In addition to affecting the integrity of the final product, adulterating it with milk from other sources can result in unfair competition and customer deceit [2,4].
Milk adulteration undermines quality and economic integrity, and may pose a safety risk for consumers allergic to cow milk proteins, which are not typically found in sheep or goat milk [1]. Due to the financial incentive, it is common practice to substitute cow milk into goat and sheep milk, which are more expensive [2,6,7]. Direct repercussions of this financially driven deception [8,9] include decreased product quality, distorted market prices, and heightened consumer health risks as a result of possible concealed allergens [7].
The mixing of cow’s milk with sheep or goat’s milk without the appropriate labeling is an example of adulteration [2,7], a procedure that could cause adverse reactions in customers who are susceptible [1,2,4]. These tactics cause financial losses and harm to the reputation of producers, and may also be related to adverse health effects connected to allergies [2].
Immunological techniques like ELISA, which can identify particular milk proteins to discriminate species are being used as conventional milk analysis methods for detecting adulteration [2,7,10]. Differences between milk types can also be found through chemical analysis, as the use of gas chromatography (GC-FID) to determine the fatty acids profile. Protein and peptide analysis with the use of liquid chromatography-mass spectrometry have been also applied [2,7]. These techniques are characterized by high cost, the requirement for specialized personnel, the need for advanced instrumentation, difficult sample preparation, and lengthy analysis times [2,7]. Fourier transform infrared (FTIR) spectroscopy has become a popular and dependable substitute for confirming the validity of milk, as it provides quick measurements with little to no sample preparation and no need for chemical reagents [2,11,12,13]. Compared to traditional techniques such as gas chromatography (GC), liquid chromatography-mass spectrometry (LC-MS), or polymerase chain reaction (PCR), FTIR offers significant advantages in terms of speed, cost, and ease of use. These traditional methods often require lengthy sample preparation, chemical reagents, and highly trained personnel, making them less suitable for routine industrial applications [14].
Despite the fact that FTIR spectroscopy has shown great promise for food authenticity verification, there is still a need for better understanding on the effectiveness and precise distinction of cow’s, goat’s, and sheep’s milk [2,6,15]. To effectively utilize FTIR’s potential in guaranteeing milk authenticity, a thorough examination of spectrum discrepancies and the creation of reliable chemometric models are necessary [2,15]. To classify milk by species, multivariate statistical techniques to FTIR spectral data are applied, to handle complex data and hundreds of overlapping absorbance values. Unsupervised methods like Principal Component Analysis (PCA) and Hierarchical Cluster Analysis (HCA) help visualize natural clustering. Supervised models such as Linear Discriminant Analysis (LDA), Partial Least Squares Discriminant Analysis (PLS-DA), and Orthogonal PLS-DA (OPLS-DA) can offer high classification accuracy [4].
This study aims to assess the efficiency of FTIR spectroscopy in conjunction with multivariate statistical techniques, for the quick and accurate classification and differentiation of sheep’s, goat’s, and cow’s milk. In a broader context, to safeguard consumers and uphold the integrity of the dairy business, this research attempts to improve the quality assurance of dairy products and offer better control tools.

2. Materials and Methods

2.1. Sample Collection, Preparation and Storage

A total of 178 raw milk samples were collected between April and July 2024 from various livestock farms located across different regions and villages of Thessaly, Greece. The samples were obtained during the morning milking to ensure freshness and consistency. Specifically, the sample set included 44 goats, 61 cows, and 73 sheep milk samples. Milk samples were collected from both individual animals and bulk tanks at the farm level, depending on farm practices. Bulk tank samples represented pooled milk from animals of the same species. In order to ensure species authenticity and exclude any potential inter-species contamination, all goat and sheep samples were subsequently tested using a highly specific ELISA assay prior to FTIR analysis. From each individual sample, 50 mL of milk was collected and immediately stored under refrigerated conditions. Upon arrival at the laboratory, each sample was homogenized and then divided into two equal aliquots. One portion was retained for analysis in its raw state, while the other was subjected to freeze-drying using a BIOBASE Freeze Dryer (Model: BK-FD10P; BIOBASE Group, Jinan, Shandong, China). All samples were stored at −18 °C until further processing. Prior to analysis, thawing was performed gradually over a 24-h period under refrigerated conditions to avoid structural changes. The quality of the raw milk samples was assessed based on organoleptic properties such as color and odor. Additionally, the pH of each sample was measured using a bench pH/Ion Meter (Eutech Instruments/Oakton Instruments; Thermo Fisher Scientific, Singapore/Vernon Hills, IL, USA). Freeze-dried samples were evaluated for uniformity and consistency following processing. Throughout the sampling and analytical procedures, temperature and humidity conditions were carefully maintained to ensure reproducibility.

2.2. Laboratory Analysis

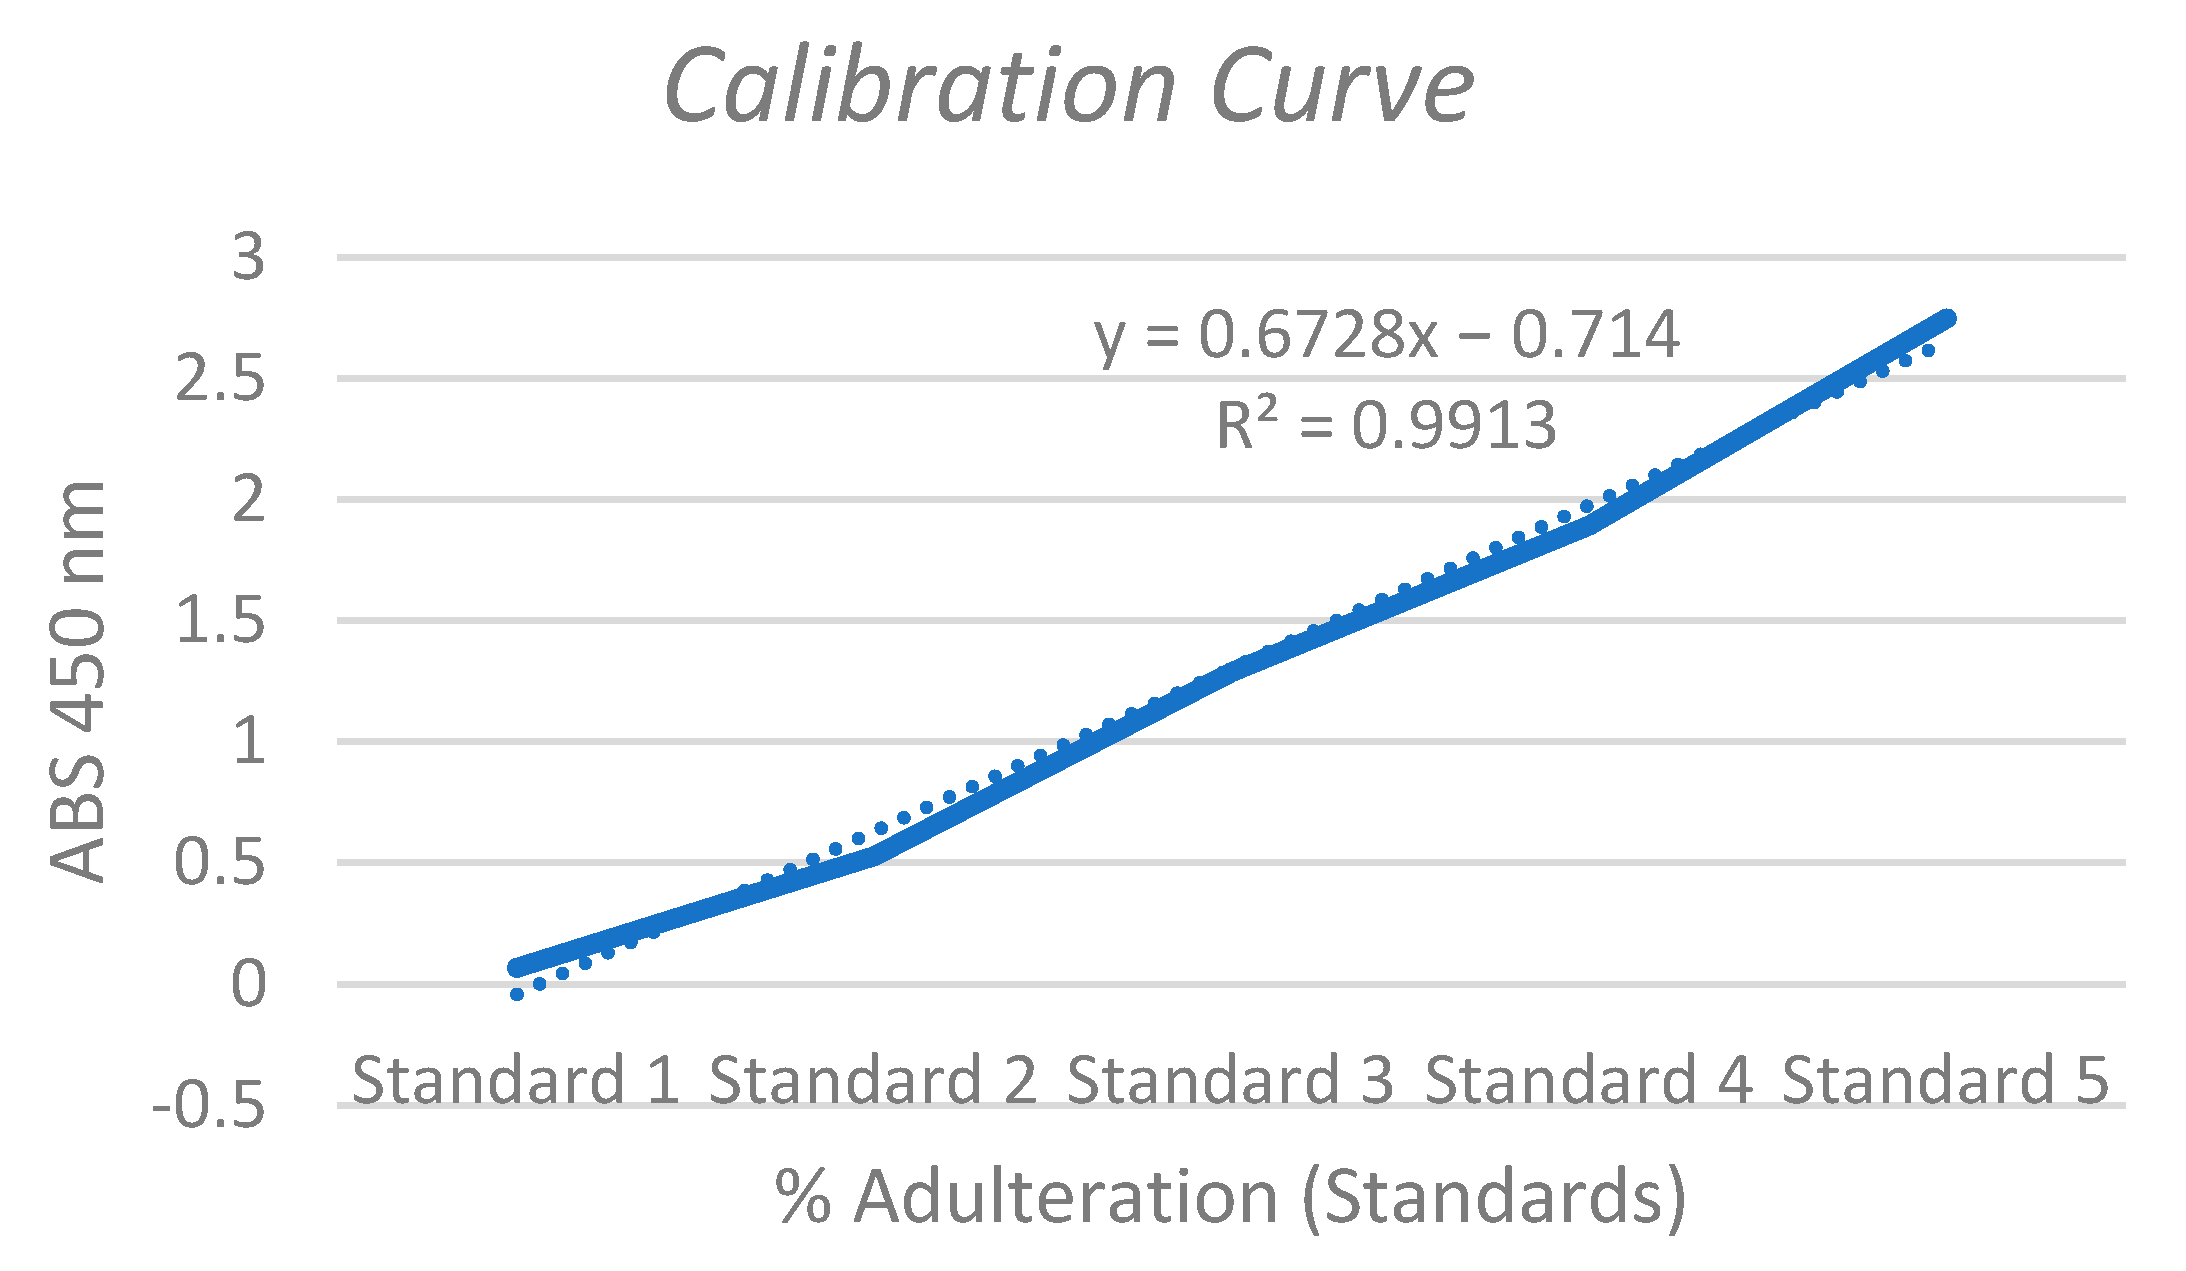
2.2.1. Enzyme Linked Immunosorbent Assay (ELISA)

In this phase, ELISA was employed as a preliminary check to guarantee that all samples were genuine and unadulterated before moving to subsequent analyses. All samples were analyzed in duplicate using a commercially available ELISA kit (Bio-Shield Adulteration Cow ELISA Kit, ProGnosis Biotech S.A.; Larisa, Greece) for the detection of cow milk adulteration. The analysis was strictly performed according to the manufacturer’s instructions. Absorbance was measured at 450 nm using a microplate spectrophotometer (MultiskanTM FC, Thermo Fisher Scientific Inc.; Waltham, MA, USA). The assay demonstrated a limit of detection (LOD) of 0.10% and a limit of quantification (LOQ) of 0.15%. The intra-assay precision, expressed as the coefficient of variation (CV), was 5.5% at the 1% adulteration level. The kit exhibited 100% recovery and high specificity, with cross-reactivity values of <0.01% for sheep and goat immunoglobulins, and 3.7% for buffalo immunoglobulins, ensuring the reliability of cow milk detection. The calibration curve used to quantify bovine immunoglobulin G (IgG) was provided as part of the ELISA kit and included five ready-to-use standards corresponding to 0%, 0.5%, 1%, 2%, and 4% (v/v) cow milk in goat/sheep milk matrices. Concentrations were determined by interpolating the sample absorbance values on the fifth-order polynomial calibration curve supplied by the manufacturer. The curve demonstrated excellent fitting (R2 = 0.99), as shown in Figure 1.

2.2.2. Attenuated Total Reflectance Fourier Transform Infrared Spectroscopy (ATR-FTIR)

Spectroscopic analysis was performed using a Nicolet 6700 FT-IR Spectrometer (Thermo Fisher Scientific; Waltham, MA, USA), equipped with a Deuterated Triglycine Sulfate (DTGS) detector, operated via the OMNIC 9 software (v9.1.24). The measurements were carried out using the ATR mode, employing a diamond crystal within the Smart iTR accessory. A small aliquot of each sample was directly deposited onto the ATR surface using a micropipette to ensure uniform contact. The instrument was allowed to warm up for 30 min prior to spectra recording to ensure stability and spectral accuracy. Prior to each spectrum recording, the ATR crystal was thoroughly cleaned with ethanol and deionized water to avoid cross-contamination. Spectra were collected in the mid-infrared region (4000–400 cm−1), using air as the background. The background spectrum was acquired before each sample to account for environmental and instrumental noise. Each sample was analyzed in triplicate (a different sub-sample in each replicate) to ensure reproducibility, with a total of 32 scans recorded per spectrum at a resolution of 4 cm−1. The mean spectrum of each sample was then calculated 4000–400 cm−1.

2.3. Spectra Processing and Data Analysis

2.3.1. Spectral Preprocessing and Visualization

The spectral data collected via ATR-FTIR were processed before analysis to ensure sample uniformity. The processing of the mean spectra was done using Macros/Basic mode of OMNIC software, where corrections such as straight line, automatic smooth, display limits, baseline correct and scale normalization were applied. These procedures allow for the comparison of spectra and make them suitable for statistical analysis. Next, the spectra of the raw and freeze-dried samples were converted into CSV files, which included the wavenumber (cm−1) and the corresponding absorption values. For spectra visualization, individual absorbance spectra were plotted against wavenumber and colored by the experimental group. Additionally, group-wise average absorbance spectra were calculated and plotted to illustrate overall group-level spectral trends. All analyses considered only spectral regions with wavenumbers above 600 cm−1.

2.3.2. Principal Component Analysis (PCA)

Principal Component Analysis (PCA) was conducted to investigate the underlying structure and variability among raw and freeze-dried milk samples. The first two components were selected for visualization, capturing the most significant variation. Samples were color-coded by milk sample group, and 95% confidence ellipses were added to highlight clustering patterns. The resulting PCA plot was constructed to provide a clear overview of the sample distribution across principal component space. Analyses were performed using the R programming language with the FactoMineR and factoextra packages.

2.3.3. Partial Least Squares Discriminant Analysis (PLS-DA)

Following PCA, data were subjected to supervised classification via PLS-DA using the mixOmics package. The dataset was split into training (80%) and test (20%) subsets using stratified random sampling. Predictor variables (X) included the scaled absorbance for each wavenumber values, with the milk type (Y) used as the response variable. The PLS-DA model was trained with up to 18 components, and 10-fold cross-validation with 10 repeats was used to assess model performance. The optimal number of components was selected based on balanced error rate (BER), using one-sided t-tests to check for a significant difference in the mean error rate, with the addition of components in the model. Model performance was evaluated in the test set, through confusion matrices comparing predicted and true class labels. Final classification accuracy and validation performance metrics (accuracy, sensitivity specificity) were calculated. Variable Importance in Projection (VIP) scores—which reflect the relative importance of each wavenumber to classification—were also calculated to identify spectral regions important for discrimination.

3. Results and Discussion

3.1. ELISA Analysis

The ELISA assay implemented served as a robust and sensitive pre-screening tool. All 117 goat (n = 44) and sheep (n = 73) milk samples were confirmed to be authentic, as no cow milk adulteration was detected by the ELISA assay. The concentration of bovine immunoglobulin G (IgG) in sheep and goat milk samples was below the detection limit of the method (0.1%), indicating the absence of cow milk. This verification step was essential to ensure the integrity of the samples prior to FTIR analysis, as any contamination with cow milk could introduce spectral variability and compromise chemometric modeling. The ELISA method uses high-specificity antibodies for the quantitative determination of bovine milk IgG, offering a reliable and sensitive method for detecting such adulterations. The reliability of the method has been confirmed in previous studies, where IgG concentrations in bovine milk typically ranged between 0.2% and 0.5%, but also higher [16,17].

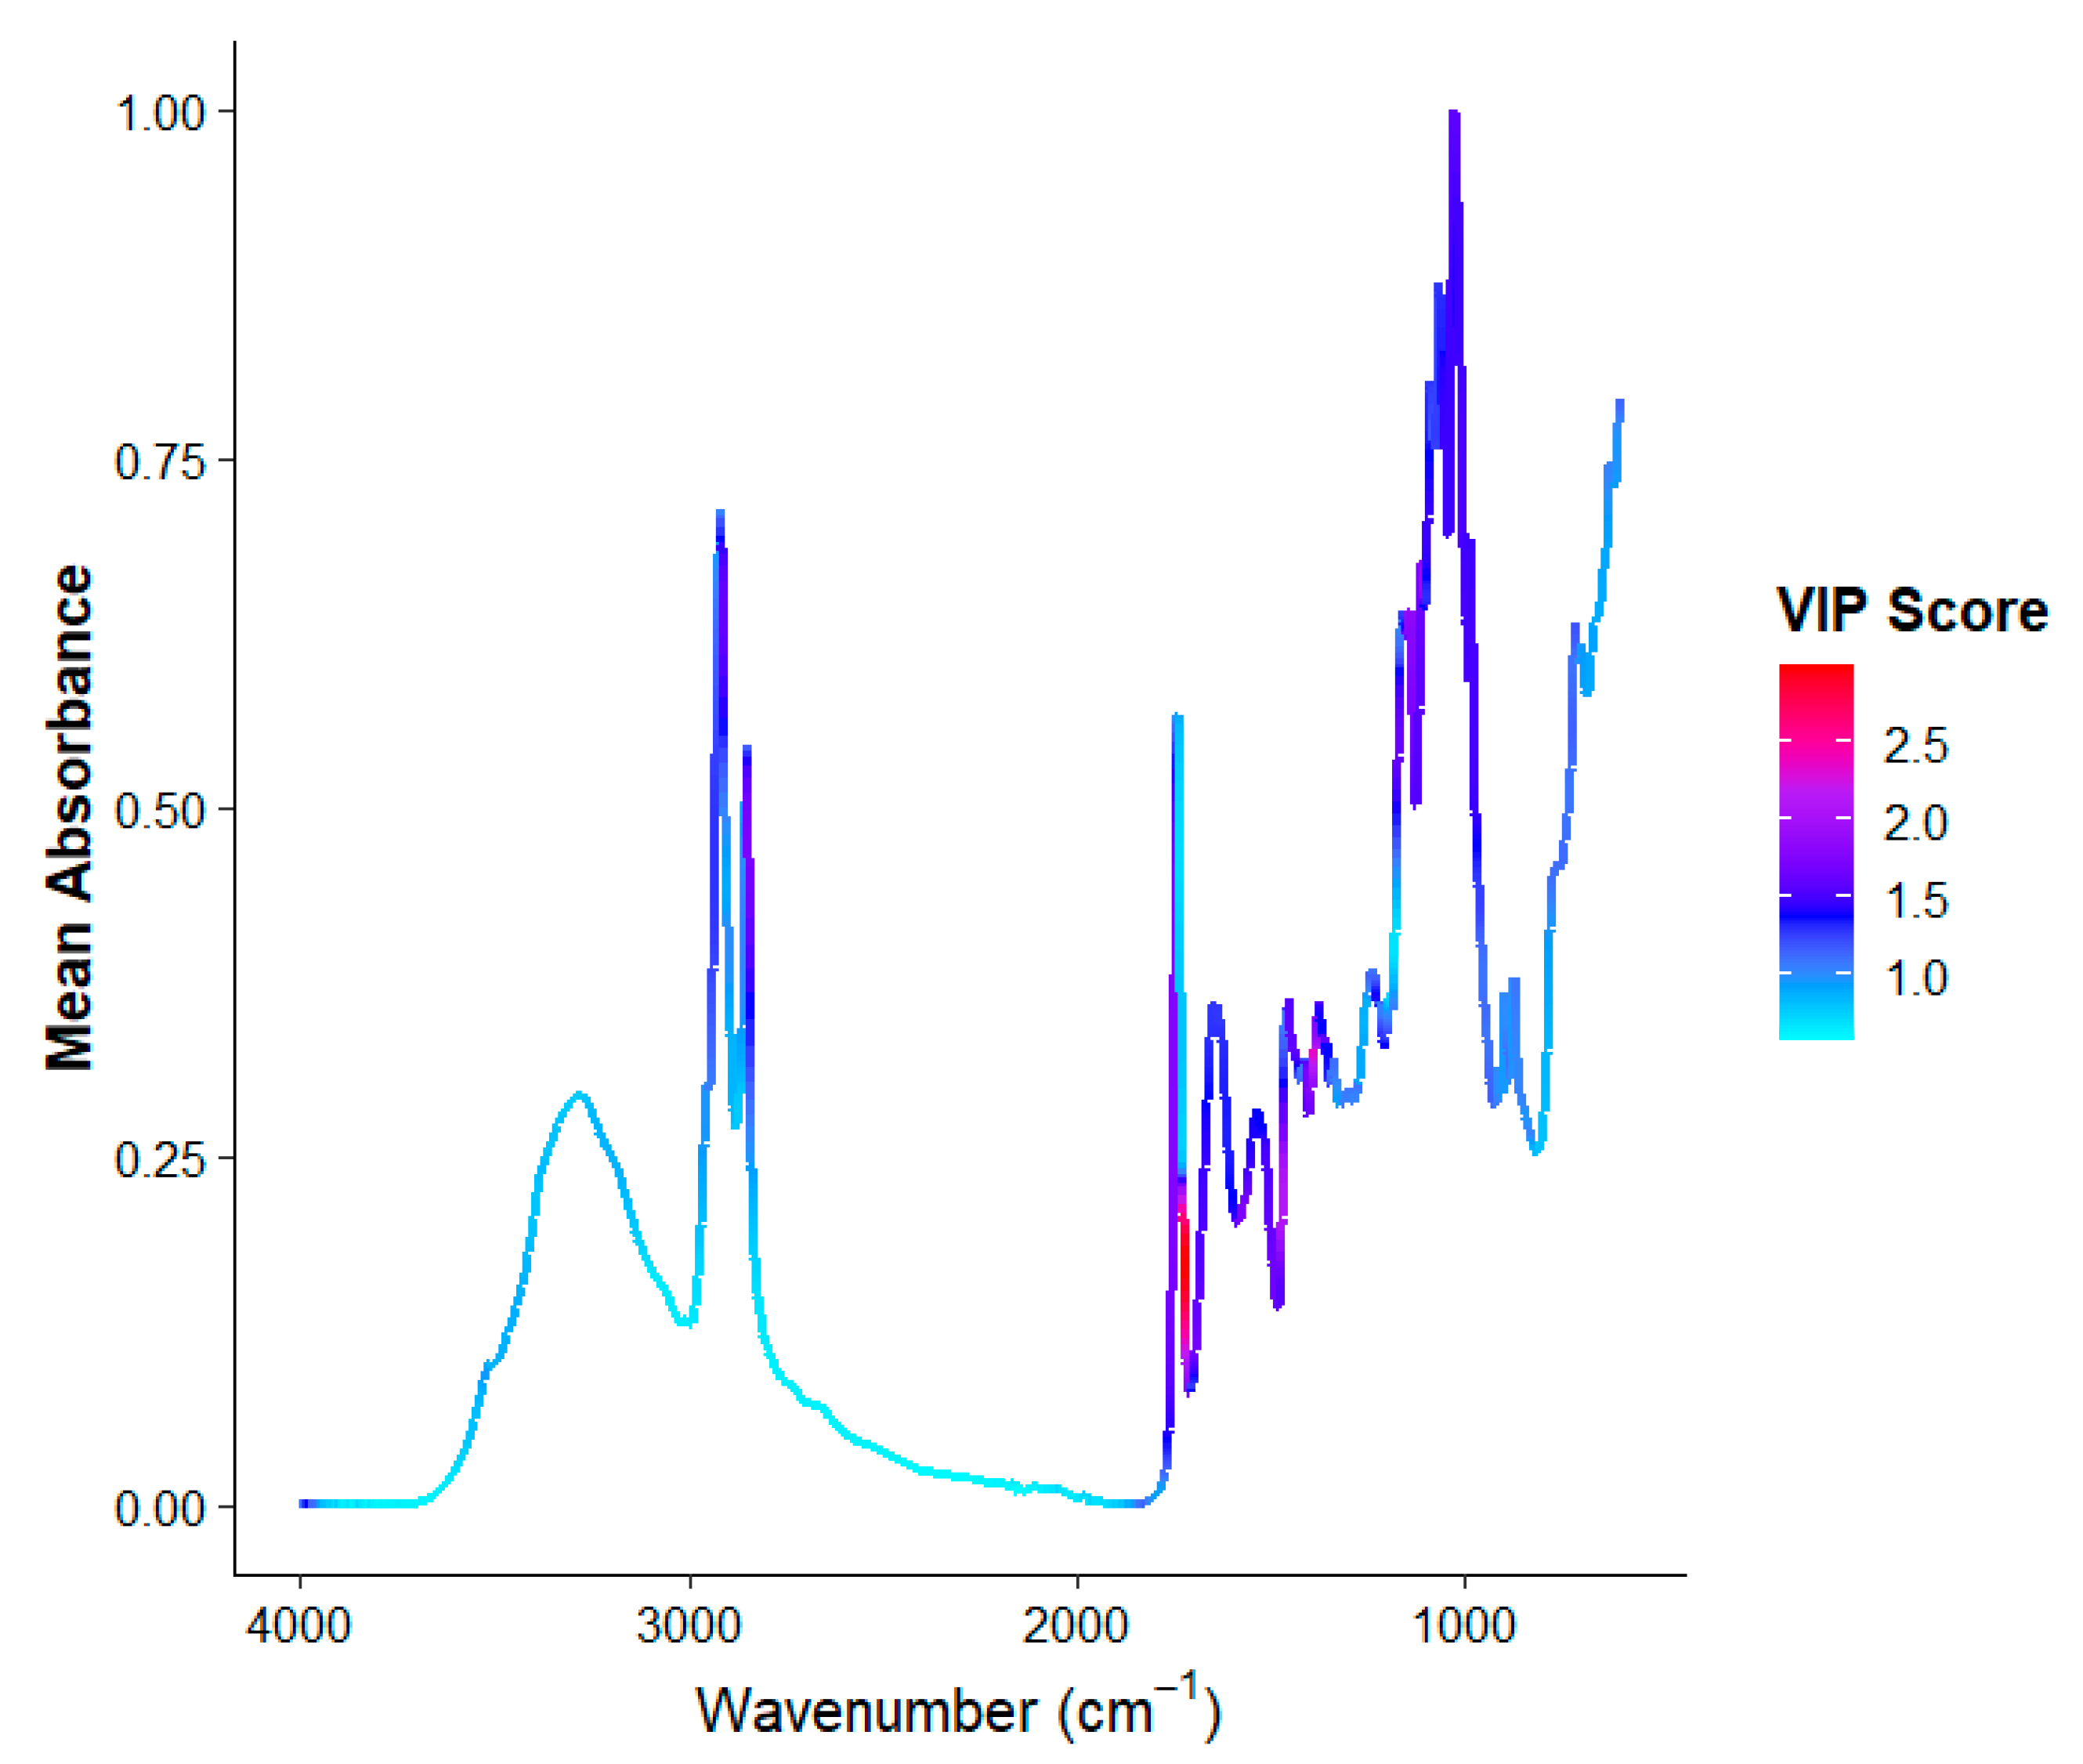
3.2. Analysis of FTIR Spectra

The infrared absorbance spectra of raw cow, goat, and sheep milk samples are presented in Figure 2A (raw milk samples) and Figure 2B (freeze-dried milk samples). For raw milk samples, the visual comparison of the mean absorption across the milk types does not indicate notable differences. Simple visual inspection is not sufficient to draw any conclusion, and subtle differences in specific absorbance regions must be explored to achieve classification. However, it is observed that freeze-drying significantly enhanced the spectral resolution by eliminating the dominant water-related absorbances, particularly the broad O–H stretching band (3100–3600 cm−1) and the H–O–H bending region (~1650 cm−1). This dehydration process allowed clearer identification of functional groups such as protein amide bands, lipid C=O stretches, and carbohydrate-related vibrations [18,19]. This allowed clearer detection of functional groups such as protein amide I and II bands, lipid CH2 and C=O stretches, and carbohydrate C–O vibrations. The absorbance bands observed in the 3000–2800 cm−1 and 1800–1700 cm−1 regions, which are characteristic of lipid components [20], are clearly present. Presumably, the 1700–1500 cm−1 corresponds to protein amide I and II bands [21] 1500–1200 cm−1 reflects protein interactions [22] and 1200–900 cm−1 indicates minerals, lactose, and fat [23]. The FTIR spectra of freeze-dried cow, goat, and sheep milk produces some more apparent differences in certain regions.

3.3. Principal Component Analysis

Principal Component Analysis (PCA) was employed as an unsupervised exploratory technique to evaluate whether spectral variation could reveal distinct clustering of milk samples from cow, goat, and sheep. As shown in Figure 3A, the first two principal components (PC1 and PC2) captured the majority of the variance in the dataset; however, significant overlap was observed among species clusters. Although some group tendencies emerged—particularly a partial separation of sheep milk—PCA did not fully resolve the three classes. This highlights a limitation of PCA, which maximizes variance in the data without considering class labels, and therefore may not prioritize features that are most relevant for classification. In Figure 3B, even after freeze-drying the samples, PCA still showed overlapping clusters, especially between cow and goat samples. While the preprocessing improved cluster compactness and directional separation, it did not achieve sufficient intergroup discrimination. This underlines that while PCA is useful for visualizing high-dimensional spectral data and identifying trends, it was not sufficient to classify the milk types suggesting the implementation of supervised methods.

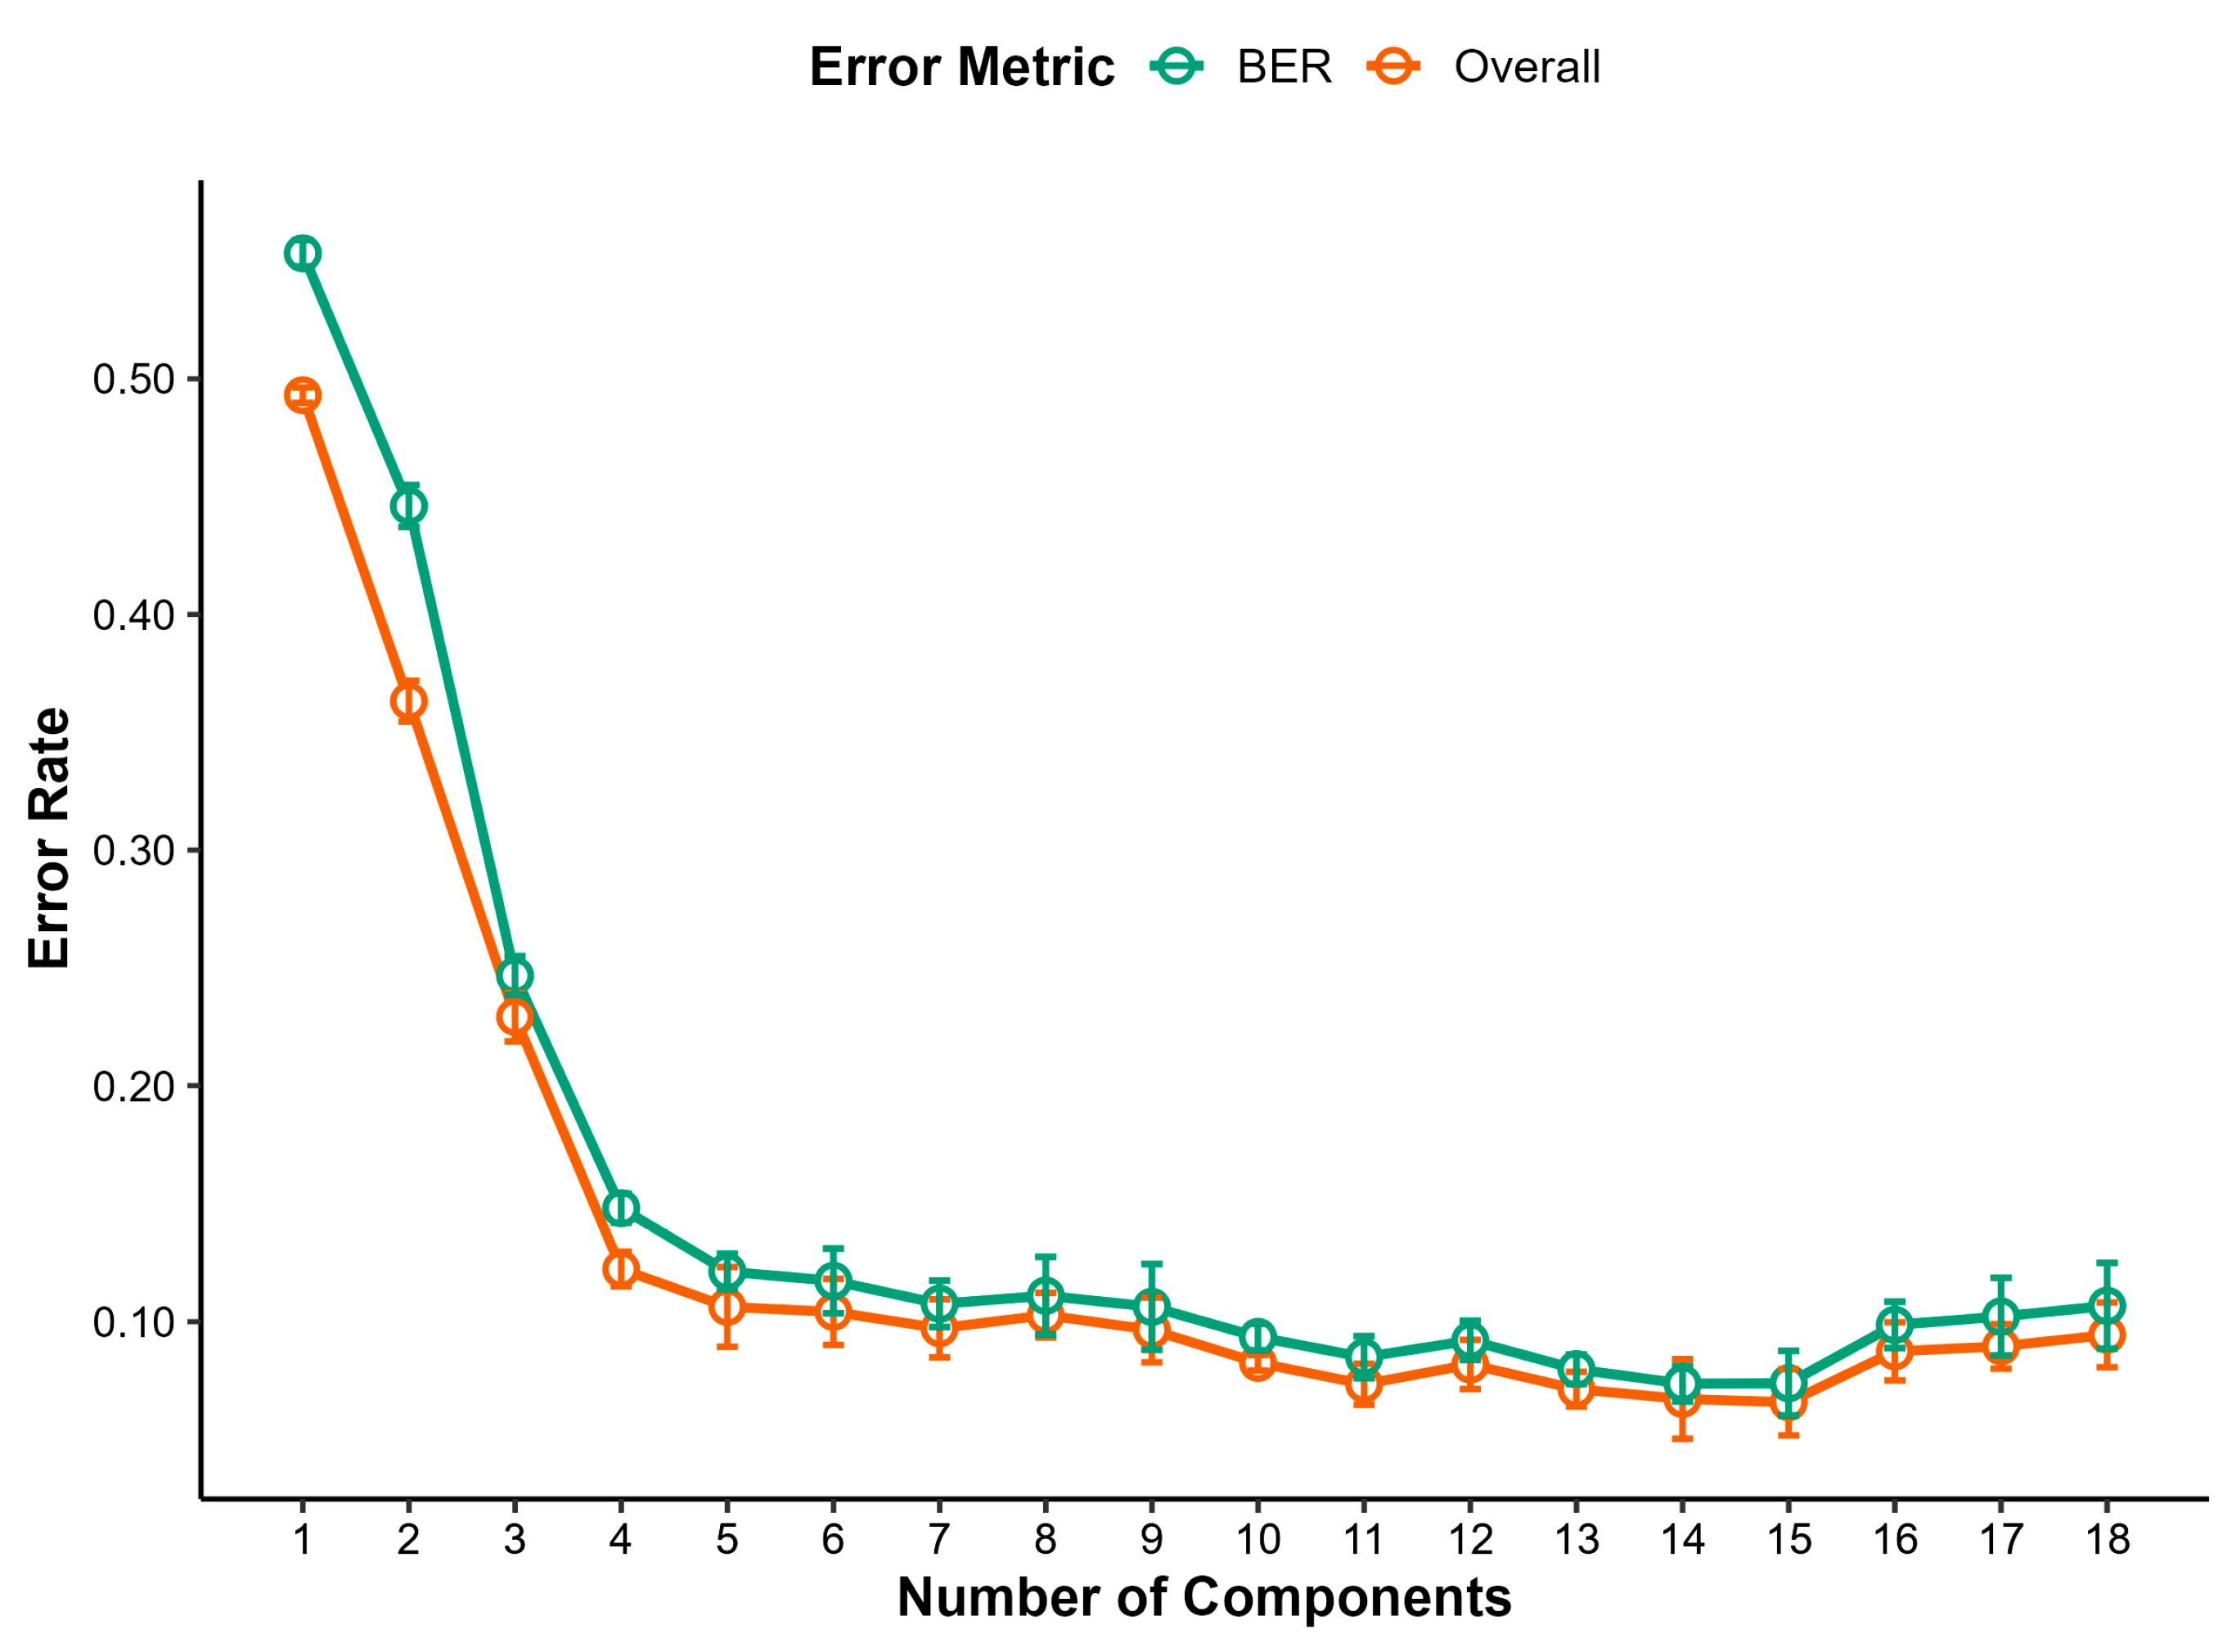
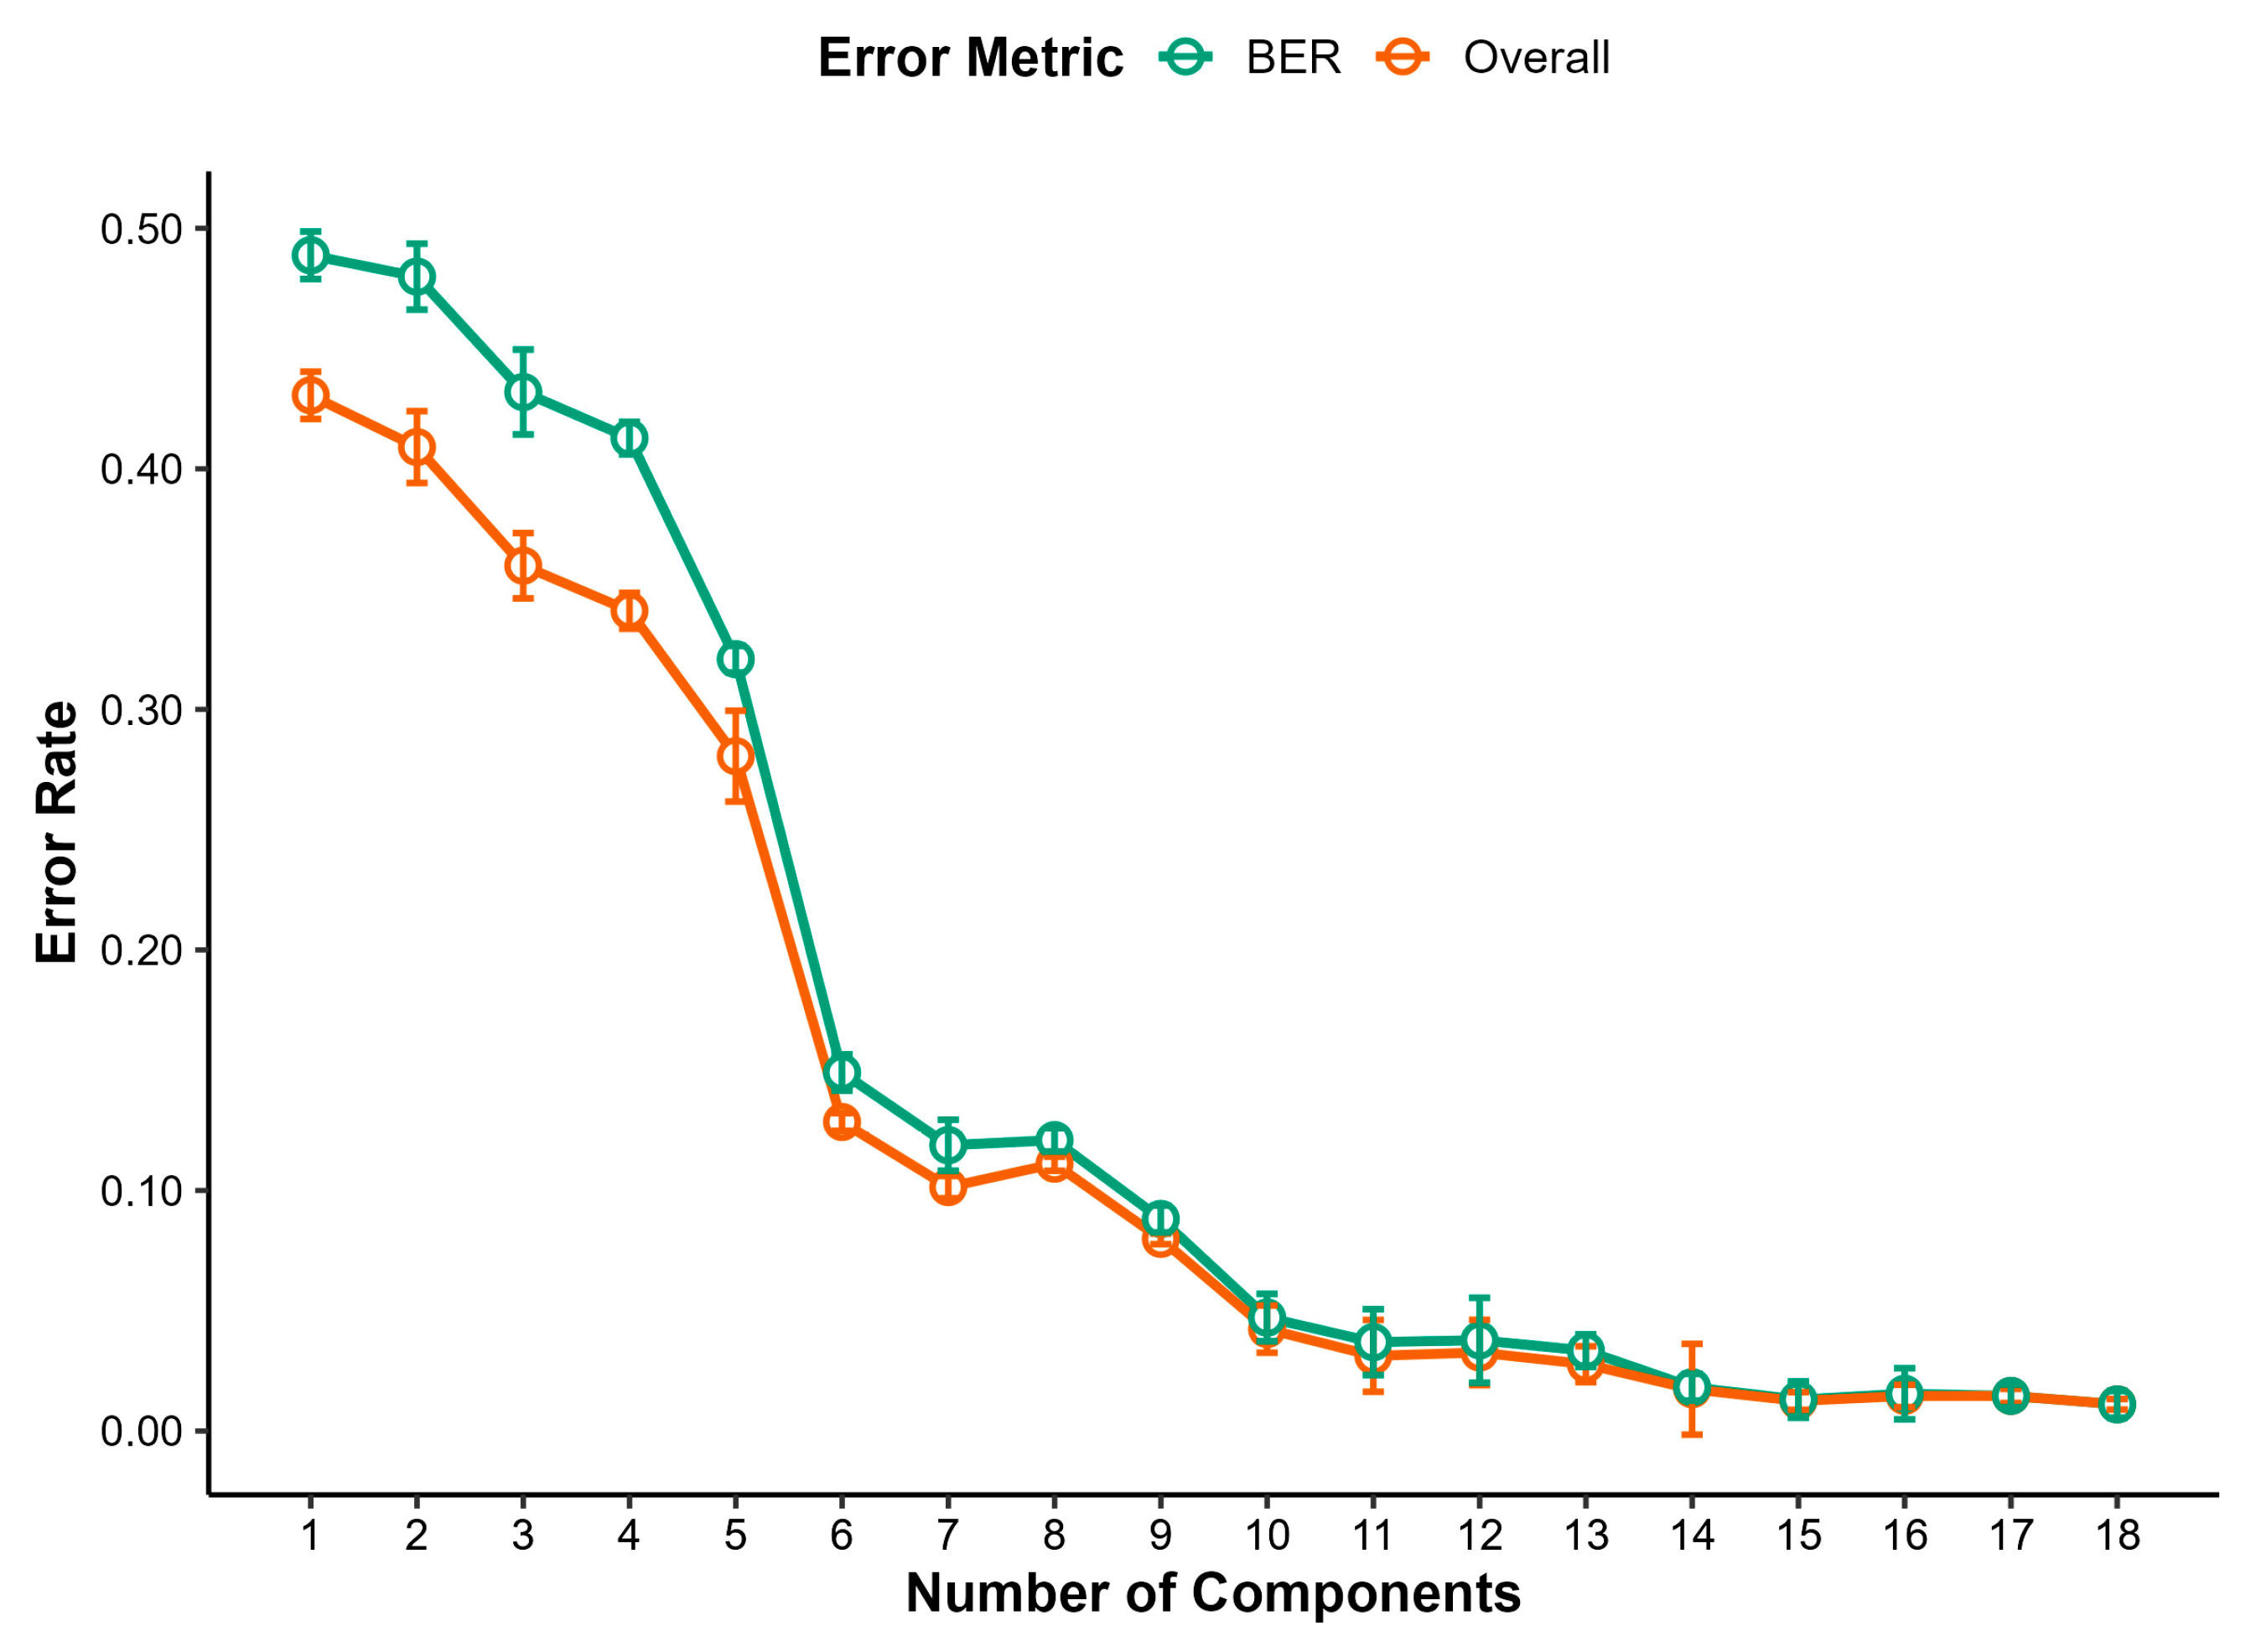
3.4. Partial Least Square Discriminant Analysis (PLS-DA)

3.4.1. Raw Milk Samples

Partial least squares discriminant analysis (PLS-DA) models were trained using repeated 10-fold cross-validation. The optimal number of latent variables was determined by minimizing the balanced error rate (BER), across all repeats and folds, which reached its minimum at 14 components (Figure 4), although the error drops rapidly until ~5 components and after that, it flattens, meaning extra components have a lesser effect on accuracy.
The performance of the final PLS-DA model was assessed on the test set using the maximum distance metric and 14 latent variables, as determined by cross-validation. The model achieved a high overall accuracy of 97.1% (95% CI: 84.7–99.9%), indicating strong agreement between predicted and actual classes. Sensitivity and specificity were both 100% for cow and goat classes, and 92.9% and 100% for sheep, respectively (Table 1).

3.4.2. Freeze-Dried Milk Samples

For the analysis of freeze-dried samples, the PLS-DA model required a relatively higher number of latent variables (LVs) to achieve optimal classification performance. As shown in Figure 5, cross-validation results indicate that both the overall classification error rate and the balanced error rate (BER) consistently decreased with increasing numbers of components, stabilizing at 14 to 16 LVs. Beyond this point, additional components did not result in notable improvements. Freeze-drying preserves and concentrates biochemical compounds that may otherwise be masked by water in fresh samples. This results in richer spectral data, requiring more latent variables to capture the full complexity of compositional differences between milk types.
The chosen model consisting of 14 LVs achieved an overall accuracy of 97.1% on the test set, indicating near-perfect classification agreement. All cow and sheep samples were correctly identified, while one goat sample was misclassified as sheep. In Figure 6, the variable importance—expressed as VIP scores, which reflect the relative contribution of each variable to the classification model—is mapped across the spectrum, to explore the most informative spectral regions for differentiating milk types.
The FTIR spectra revealed several bands relevant to milk composition, with the region around 1745 cm−1 showing elevated importance for class discrimination. This band corresponds to the C=O stretching vibration of ester linkages, primarily arising from milk triglycerides. Milk fat molecules contain ester linkages between glycerol and fatty acids, and these ester carbonyls give a strong, sharp absorption in the IR. These are typically observed around 1740–1750 cm−1 [24]. The strong contribution of this region suggests that differences in milk fat composition are among the key chemical features distinguishing the milk types. This is supported by the literature, as studies have shown that goat milk fat differs from cow milk fat by having higher levels of short- and medium-chain fatty acids and a distinct triglyceride profile [25]. In general, large differences in the triglyceride profile are observed among the three species [26]. Additional variation in the 1000–1500 cm−1 and 2800–3000 cm−1 regions may reflect differences in proteins and fatty acid chains, respectively. The spectral region between 1200 and 900 cm−1 can be attributed to polysaccharides [4] and presumably lactose, which exhibits strong absorptions due to C–O stretching and C–O–C vibrations within its glycosidic bonds and sugar rings [27]. Pinto et al. demonstrated that mid-infrared spectroscopy, focusing on the 935–1200 cm−1 range, can effectively detect and quantify lactose in cow milk and distinguish between regular and lactose-free milk samples [19]. Casein phosphates are also associated with this region due to P–O stretching of phosphate groups (~1100 cm−1) [28].
Following the above interpretations, we retrained the model using only the 600–1800 cm−1 region of the spectrum (which is associated with key biochemical constituents of milk) to evaluate its performance when limited to biochemically relevant areas, while excluding less informative regions. The 600–1800 cm−1 region, also known as the “fingerprint region,” was selected because it contains vibrational modes from all major milk constituents: triglycerides (C=O stretching), proteins (amide I and II), carbohydrates (C–O stretching), and phosphate-related P–O vibrations from casein micelles. By focusing on this region, we retained chemically meaningful information while excluding high-noise regions dominated by water interference [18]. Focusing the model on this region enables a more targeted analysis of chemically meaningful features, enhancing interpretability by omitting irrelevant spectral regions. The model achieved 100% 95% CI: (0.90, 1.00) classification accuracy, fully separating the three milk types. However, it required a relatively high number of latent variables (14), highlighting the underlying biochemical complexity captured within the 600–1800 cm−1 region.
The present study demonstrates the capability of FTIR spectroscopy, combined with chemometrics, to accurately classify milk samples from different animal origins, particularly distinguishing between cow and sheep milk. The PLS-DA models achieved 100% correct classification when the 600–1800 cm−1 region was analyzed. This level of performance highlights the diagnostic power of FTIR when appropriate spectral preprocessing and classification models are applied.
Previous research has demonstrated the efficacy of FTIR in dairy authentication, particularly in adulteration detection. Recent studies have shown that algorithms such as Support Vector Machine (SVM), PLS-DA, and Random Forest (RF) are highly effective in classifying adulterated samples, particularly within key spectral ranges. These techniques have been successfully applied to detect a wide range of adulterants, supporting their value in food quality monitoring and regulatory enforcement [19,29].
The majority of these studies focus on the detection of specific adulterants, such as melamine, water, palm oil, or chemical residues. While highly relevant to food safety, they do not directly address the issue of inter-species milk adulteration, particularly the substitution of goat or sheep milk with cow milk—a practice that carries both economic and allergenic implications.
In this context, Sen et al. (2021) [30] and Silva et al. (2019) [31] applied FTIR to detect adulteration of buffalo milk with cow and goat milk, using advanced chemometric tools like PCA, Artificial Neural Network (ANN), and Orthogonal Partial Least Squares Discriminant Analysis (OPLS-DA). Their findings confirm the potential of FTIR to resolve complex mixtures, but these studies remain limited to less common milk types. Furthermore, Julmohammad et al. (2025) [29] highlighted the lack of research focusing specifically on the detection of cow milk in goat or sheep matrices using FTIR.
Our approach enables a more robust foundation for future detection models and avoids issues of artificial spectral overlap introduced during mixture preparation. By achieving 100% classification accuracy using only the fingerprint region, we demonstrate that inter-species differentiation is not only feasible but also highly accurate when freeze-dried matrices are used.
The combined use of ATR-FTIR and chemometrics represents a rapid, non-destructive, and cost-effective alternative to traditional methods, which are time-consuming, expensive, and require specialized personnel. This study reinforces the available data in favor of the application of ATR-FTIR spectroscopy for milk authenticity testing and highlights the importance of targeted analysis of biochemically critical regions of the spectrum. Given its rapid response and non-destructive nature, FTIR spectroscopy is particularly promising for integration into inline quality control systems within dairy production facilities. Real-time monitoring could significantly improve traceability and reduce economic losses from undetected adulteration. Additionally, it highlights the role that appropriate sample processing, such as lyophilization, can have in optimizing the accuracy of the models.
This approach might be promising for application in industrial environments with high sampling and adulteration control needs. The high classification accuracy of the model, especially in freeze-dried samples—indicates that this approach could be applied not only for the certification of fresh milk but also for processed products such as powdered milk and cheeses. This approach could provide significant contribution for the authentications of dairy products with protected designation of origin (PDO) such as feta and halloumi, where the origin of the milk is legally required.
Despite the promising results obtained in this study, limitations must be acknowledged. First, although the sample size (n = 178) was adequate for initial modeling and validation, it may not fully capture the natural variability in milk composition arising from seasonal, dietary, or geographic factors. To address these issues and ensure model generalizability, future studies should incorporate larger and more diverse datasets including diverse milk samples from various breeds, different lactation stages, and cover multiple regions. Additionally, seasonal variability should be investigated.
Further research is also needed to assess how well the developed models perform on commercially processed dairy products, such as pasteurized milk, cheeses, or milk powders. The influence of technological treatments like heating, fermentation, or homogenization on spectral features and classification accuracy warrants detailed investigation.
Finally, while this study focused on qualitative classification by species, expanding the framework to include quantitative prediction of adulteration levels (e.g., percentage of cow’s milk in a goat milk sample) could significantly broaden the practical applications of this approach. Future work can analyze well-characterized calibration sets with known adulteration ratios and apply quantitative models, such as PLS regression alongside non-linear methods like SVR or Random Forest, can then be trained to predict the percentage of an intruder species.

4. Conclusions

This study demonstrates that Fourier transform infrared (FTIR) spectroscopy, when combined with advanced chemometric techniques, offers a highly effective, non-destructive, and rapid method for discriminating milk samples based on their species and consequently for detecting milk species fraud. Future research should focus on scaling the approach, validating it under industrial conditions, exploring processed matrices, and integrating more advanced data analysis techniques to enhance both precision and applicability.

Author Contributions

Conceptualization, E.M.; methodology, C.P., E.M., A.M. and D.K.; software, M.K.; validation, L.D. and M.K.; formal analysis, L.D.; investigation, E.M., M.K. and L.D.; resources, D.K. and E.M.; data curation, M.K. and L.D.; writing—original draft preparation, E.M., M.K. and L.D.; writing—review and editing, D.K., C.P., A.M. and E.M.; visualization, M.K.; supervision, E.M., C.P. and A.M.; project administration, E.M. All authors have read and agreed to the published version of the manuscript.

Funding

This research received no external funding.

Institutional Review Board Statement

Not applicable.

Informed Consent Statement

Not applicable.

Data Availability Statement

The data presented in this study are available on request from the corresponding author.

Acknowledgments

We would like to thank V. Kossyva from the Laboratory of Food Chemistry, Biochemistry and Technology, Department of Nutrition and Dietetics, for her valuable support in the freeze-drying of the samples. Special thanks also go to M. Starfa from the Laboratory of Foods of Animal Origin, Department of Animal Science, University of Thessaly, for her contribution to the ELISA analysis.

Conflicts of Interest

The authors declare no conflicts of interest.

Abbreviations

The following abbreviations are used in this manuscript:
LDLinear dichroism
ATR-FTIRFourier Transform Infrared Attenuated Total Reflectance
PLS-DAPartial Least Squares Discriminant Analysis
PCAPrincipal Component Analysis
BERbalanced error rate
LVslatent variables
DTGSDeuterated Triglycine Sulfate
VIPVariable Importance in Projection
FTIRFourier transform infrared
ANNArtificial Neural Network
OPLS-DAOrthogonal Partial Least Squares Discriminant Analysis
SVMSupport Vector Machine
RFRandom Forest

References

  1. Hodgkinson, A.J.; McDonald, N.A.; Kivits, L.J.; Hurford, D.R.; Fahey, S.; Prosser, C. Allergic responses induced by goat milk αS1-casein in a murine model of gastrointestinal atopy. J. Dairy Sci. 2012, 95, 83–90. [Google Scholar] [CrossRef] [PubMed]
  2. Yulyana, A.; Rohman, A.; Arifah, M.F.; Windarsih, A.; Nisa, K. Authentication analysis of goat milk from cow milk using Fourier TransformInfrared spectroscopy and chemometrics. Food Res. 2024, 8, 459–466. [Google Scholar] [CrossRef] [PubMed]
  3. Hellenic Agricultural Organization—Recording of Fresh Milk Production Data. Available online: https://www.elgo.gr/index.php?option=com_content&view=article&id=888&Itemid=1267&lang=el#%CF%83%CF%84%CE%B1%CF%84%CE%B9%CF%83%CF%84%CE%B9%CE%BA%CE%AC-%CE%BD%CF%89%CF%80%CE%BF%CF%8D-%CF%80%CF%81%CF%8C%CE%B2%CE%B5%CE%B9%CE%BF%CF%85-%CE%B3%CE%AF%CE%B4%CE%B9%CE%BD%CE%BF%CF%85-%CE%B3%CE%AC%CE%BB%CE%B1%CE%BA%CF%84%CE%BF%CF%82 (accessed on 25 April 2025).
  4. Nicolaou, N.; Xu, Y.; Goodacre, R. Fourier transform infrared spectroscopy and multivariate analysis for the detection and quantification of different milk species. J. Dairy Sci. 2010, 93, 5651–5660. [Google Scholar] [CrossRef] [PubMed]
  5. Kritikou, A.S.; Aalizadeh, R.; Damalas, D.E.; Barla, I.V.; Baessmann, C.; Thomaidis, N.S. MALDI-TOF-MS integrated workflow for food authenticity investigations: An untargeted protein-based approach for rapid detection of PDO feta cheese adulteration. Food Chem. 2022, 370, 131057. [Google Scholar] [CrossRef]
  6. Tarapoulouzi, M.; Kokkinofta, R.; Theocharis, C.R. Chemometric analysis combined with FTIR spectroscopy of milk and Halloumi cheese samples according to species’ origin. Food Sci. Nutr. 2020, 8, 3262–3273. [Google Scholar] [CrossRef]
  7. Calvano, C.D.; De Ceglie, C.; Monopoli, A.; Zambonin, C.G. Detection of sheep and goat milk adulterations by direct MALDI–TOF MS analysis of milk tryptic digests. J. Mass Spectrom. 2012, 47, 1141–1149. [Google Scholar] [CrossRef]
  8. Moyer, D.C.; DeVries, J.W.; Spink, J. The economics of a food fraud incident—Case studies and examples including Melamine in Wheat Gluten. Food Control 2017, 71, 358–364. [Google Scholar] [CrossRef]
  9. Yang, Y.; Huisman, W.; Hettinga, K.A.; Zhang, L.; Van Ruth, S.M. The Chinese milk supply chain: A fraud perspective. Food Control 2020, 113, 107211. [Google Scholar] [CrossRef]
  10. Balan, B.; Dhaulaniya, A.S.; Jamwal, R.; Yadav, A.; Kelly, S.; Cannavan, A.; Singh, D.K. Rapid detection and quantification of sucrose adulteration in cow milk using Attenuated total reflectance-Fourier transform infrared spectroscopy coupled with multivariate analysis. Spectrochim. Acta Part A Mol. Biomol. Spectrosc. 2020, 240, 118628. [Google Scholar] [CrossRef]
  11. Cirak, O.; Icyer, N.C.; Durak, M.Z. Rapid detection of adulteration of milks from different species using Fourier Transform Infrared Spectroscopy (FTIR). J. Dairy Res. 2018, 85, 222–225. [Google Scholar] [CrossRef]
  12. Conceição, D.; Gonçalves, B.-H.; Da Hora, F.; Faleiro, A.; Santos, L.; Ferrão, S. Use of FTIR-ATR Spectroscopy Combined with Multivariate Analysis as a Screening Tool to Identify Adulterants in Raw Milk. J. Braz. Chem. Soc. 2019, 30, 780–785. [Google Scholar] [CrossRef]
  13. Julmohammad, N.; Suhaini, I.K.M.; Govindasamy, T.; Tan, E.; Soloi, S.; Julmohamad, N.; Akanda, M.J.H. Quantification of Adulterant Residues in UHT Milk Products using ATR-FTIR Spectroscopy Coupled with Multivariate Analysis. J. Adv. Res. Des. 2024, 115, 1–13. [Google Scholar] [CrossRef]
  14. Reid, L.M.; O’Donnell, C.P.; Downey, G. Recent technological advances for the determination of food authenticity. Trends Food Sci. Technol. 2006, 17, 344–353. [Google Scholar] [CrossRef]
  15. Salleh, N.A.; Selamat, J.; Meng, G.Y.; Abas, F.; Jambari, N.N.; Khatib, A. Fourier transform infrared spectroscopy and multivariate analysis of milk from different goat breeds. Int. J. Food Prop. 2019, 22, 1673–1683. [Google Scholar] [CrossRef]
  16. Kourkouli, A.; Thomaidis, N.; Dasenaki, M.; Markou, A. Novel and Sensitive Touchdown Polymerase Chain Reaction Assays for the Detection of Goat and Sheep Milk Adulteration with Cow Milk. Molecules 2024, 29, 1820. [Google Scholar] [CrossRef]
  17. Angelopoulou, M.; Petrou, P.S.; Raptis, I.; Misiakos, K.; Livaniou, E.; Makarona, E.; Kakabakos, S. Rapid detection of mozzarella and feta cheese adulteration with cow milk through a silicon photonic immunosensor. Analyst 2021, 146, 529–537. [Google Scholar] [CrossRef]
  18. Barth, A. Infrared spectroscopy of proteins. Biochim. Biophys. Acta (BBA)-Bioenerg. 2007, 1767, 1073–1101. [Google Scholar] [CrossRef]
  19. Pinto, P.A.; Anconi, A.C.S.A.; De Abreu, L.R.; Magalhães, E.J.; Nunes, C.A. Strategies to determine lactose in cow milk by mid infrared spectroscopy. J. Food Compos. Anal. 2021, 104, 104176. [Google Scholar] [CrossRef]
  20. Iñón, F.A.; Garrigues, S.; De La Guardia, M. Nutritional parameters of commercially available milk samples by FTIR and chemometric techniques. Anal. Chim. Acta 2004, 513, 401–412. [Google Scholar] [CrossRef]
  21. Murphy, E.G.; Fenelon, M.A.; Roos, Y.H.; Hogan, S.A. Decoupling Macronutrient Interactions during Heating of Model Infant Milk Formulas. J. Agric. Food Chem. 2014, 62, 10585–10593. [Google Scholar] [CrossRef]
  22. Kher, A.; Udabage, P.; McKinnon, I.; McNaughton, D.; Augustin, M.A. FTIR investigation of spray-dried milk protein concentrate powders. Vib. Spectrosc. 2007, 44, 375–381. [Google Scholar] [CrossRef]
  23. Gebhardt, R.; Takeda, N.; Kulozik, U.; Doster, W. Structure and Stabilizing Interactions of Casein Micelles Probed by High-Pressure Light Scattering and FTIR. J. Phys. Chem. B 2011, 115, 2349–2359. [Google Scholar] [CrossRef] [PubMed]
  24. Toledo-Alvarado, H.; Pérez-Cabal, M.A.; Tempelman, R.J.; Cecchinato, A.; Bittante, G.; de Los Campos, G.; Vazquez, A.I. Association between days open and milk spectral data in dairy cows. J. Dairy Sci. 2021, 104, 3665–3675. [Google Scholar] [CrossRef] [PubMed]
  25. Ruiz-Sala, P.; Hierro, M.T.G.; Martínez-Castro, I.; Santa-María, G. Triglyceride composition of ewe, cow, and goat milk fat. J. Am. Oil Chem. Soc. 1996, 73, 283–293. [Google Scholar] [CrossRef]
  26. Barron, L.J.R.; Hierro, M.T.G.; Santa-María, G. HPLC and GLC analysis of the triglyceride composition of bovine, ovine and caprine milk fat. J. Dairy Res. 1990, 57, 517–526. [Google Scholar] [CrossRef]
  27. Rachah, A.; Reksen, O.; Tafintseva, V.; Stehr, F.J.M.; Rukke, E.O.; Prestløkken, E.; Martin, A.; Kohler, A.; Afseth, N.K. Exploring Dry-Film FTIR Spectroscopy to Characterize Milk Composition and Subclinical Ketosis throughout a Cow’s Lactation. Foods 2021, 10, 2033. [Google Scholar] [CrossRef]
  28. Casarrubias-Torres, L.M.; Meza-Márquez, O.G.; Osorio-Revilla, G.; Gallardo-Velazquez, T. Mid-infrared spectroscopy and multivariate analysis for determination of tetracycline residues in cow’s milk. Acta Vet. Brno 2018, 87, 181–188. [Google Scholar] [CrossRef]
  29. Julmohammad, N.B.; Tan, E.; Yusop, M.R.; Samidin, S. Recent advances in detection techniques and chemometric methods for identifying adulterants in milk and dairy products. Food Chem. 2025, 483, 144202. [Google Scholar] [CrossRef]
  30. Sen, S.; Dundar, Z.; Uncu, O.; Ozen, B. Potential of Fourier-transform infrared spectroscopy in adulteration detection and quality assessment in buffalo and goat milks. Microchem. J. 2021, 166, 106207. [Google Scholar] [CrossRef]
  31. Silva, L.K.R.; Gonçalves, B.R.F.; Da Hora, F.F.; Santos, L.S.; Ferrão, S.P.B. Spectroscopic method (FTIR-ATR) and chemometric tools to detect cow’s milk addition to buffalo’s milk. Rev. Mex. Ing. Química 2019, 19, 11–20. [Google Scholar] [CrossRef]
Figure 1. Milk authenticity calibration curve by ELISA.
Sci 07 00087 g001
Figure 2. (A) Mean ATR-FTIR absorbance spectra of raw cow, goat, and sheep milk samples across the 4000–600 cm−1 wavenumber range. (B) Mean ATR-FTIR absorbance spectra of freeze-dried cow, goat, and sheep milk samples across the 4000–600 cm−1 wavenumber range.
Sci 07 00087 g002
Figure 3. (A) PCA score plot (PC1 vs. PC2) based on spectral data from raw milk samples, showing clustering by milk type (cow, goat, sheep). (B) PCA score plot (PC1 vs. PC2) based on spectral data from freeze-dried milk samples, indicating sample differentiation by milk type.
Sci 07 00087 g003
Figure 4. PLS-DA classification error (BER and overall) vs. number of components. BER minimized at 14 components.
Sci 07 00087 g004
Figure 5. Classification error (BER and overall) of PLS-DA models for freeze-dried milk samples. Optimal performance was reached at 14–16 latent variables.
Sci 07 00087 g005
Figure 6. VIP score plot from the optimal PLS-DA model (14 LVs), highlighting the most informative spectral regions for classifying milk types.
Sci 07 00087 g006
Table 1. Classification Performance Metrics and Confusion Matrix for PLS-DA Model of Raw milk samples on the test set.
Confusion MatrixPerformance Metrics
CowGoatSheepSensitivitySpecificityBalanced Accuracy
Predicted as Cow Milk120010.960.98
Predicted as Goat Milk080111
Predicted as Sheep Milk10130.9310.96
Overall Accuracy: 0.97, 95% CI: (0.85, 1.00)
Disclaimer/Publisher’s Note: The statements, opinions and data contained in all publications are solely those of the individual author(s) and contributor(s) and not of MDPI and/or the editor(s). MDPI and/or the editor(s) disclaim responsibility for any injury to people or property resulting from any ideas, methods, instructions or products referred to in the content.

