Review

Characterization of All Allotropes of Phosphorus

Department of Chemistry, Drexel University, Philadelphia, PA 19104, USA
*
Author to whom correspondence should be addressed.
Sci 2025, 7(3), 128; https://doi.org/10.3390/sci7030128
Submission received: 25 May 2025 / Revised: 30 June 2025 / Accepted: 30 July 2025 / Published: 9 September 2025
(This article belongs to the Section Chemistry Science)

Abstract

Recent advancements in carbon nanotubes and graphene have driven significant research into other low-dimensional materials, with phosphorus-based materials emerging as a notable area of interest. Phosphorus nanowires and thin sheets show promise for applications in devices such as batteries, photodetectors, and field-effect transistors. However, the presence of multiple allotropes of phosphorus complicates their characterization. Accurate identification of these allotropes is essential for understanding their physical, optical, and electronic properties, which influence their potential applications. Researchers frequently encounter difficulties in consolidating literature for the confirmation of the structure of their materials, a process that can be time-consuming. This minireview addresses this issue by providing a comprehensive, side-by-side comparison of Raman and X-ray diffraction characteristic peaks, as well as electron microscopic images and lattice spacings, for the various phosphorus allotropes. To our knowledge, this is the first compilation to integrate all major structural fingerprints into unified summary tables, enabling rapid cross-referencing. This resource aims to support researchers in accurately identifying phosphorus phases during synthesis and device fabrication workflows. For example, distinguishing between red phosphorus polymorphs is crucial for optimizing anode materials in sodium-ion batteries, where electrochemical performance is phase-dependent.

1. Introduction

The significant achievements in the field of carbon nanotubes and graphene have led to widespread research in the field of other 1D and 2D materials. Among the wide array of 2D materials explored for their novel properties, phosphorus allotropes have emerged as a particularly promising option due to their structural diversity and rich electronic behavior. Phosphorus based materials are garnering significant research interest after the discoveries of phosphorous nanowires [1] and thin sheets [2]. Low-dimensional phosphorus structures may be used to fabricate devices such as batteries, photodetectors, field effect transistors, etc. Because phosphorus has a larger number of allotropes than carbon, proper characterization can be difficult. There are three main allotropic forms of phosphorus: white, red, and black. White phosphorus (WP) exists in three modifications: α, β, and γ. Red phosphorus (RP) has five polymorphic subdivisions: type I or amorphous (a-RP), type II, type III, type IV (fibrous or occasionally called Ruck’s), and type V (violet or Hittorf’s). Black phosphorus has three distinct subdivisions: orthorhombic, rhombohedral, and simple cubic. Recently, blue phosphorus was computationally proposed and subsequently synthesized. As of present, little experimental work has been done surrounding blue phosphorus, but the current progress is discussed in more detail herein.
Correct identification of the allotropes is critical for understanding the physical, optical, and electronic properties of the nanostructures of phosphorus and the subsequent applications. The purpose of this minireview is to compile the characteristic peaks in Raman Spectroscopy X-ray diffraction (XRD), as well as transmission electron microscopic (TEM) images with corresponding selected area electron diffraction (SAED) patterns of all the phosphorus allotropes in literature at the time of this work’s publication. The known structures of most of these allotropes are also summarized.

2. Structures of Phosphorus Allotropes

All the known structures of phosphorus allotropes are shown in Figure 1.

2.1. White Phosphorus (WP)

WP is a highly reactive and pyrophoric material that presents as a yellow/white solid at standard conditions and is sometimes given the alias “yellow phosphorus.” Upon exposure to light, WP may decompose and subsequently form polymeric chains of the P4 building unit (Figure 1), thereby producing a small amount of its a-RP allotrope and causing the over yellowish tint. Because of its instability, it has little value for electronic or optoelectronic devices. As irradiation readily converts WP to RP, acquiring X-ray data proves challenging. WP was first successfully characterized as a tetrahedron following a study performed by Corbridge and Lowe in 1952 where X-ray spectra were successfully obtained by crystallizing β-WP in CS2 [3]. It is found that WP exists in three modifications: α-WP, β-WP, and γ-WP; where all three polymorphs are spatial arrangements of the P4 tetrahedron, which only has “marginal” variations from the Td point group [4]. The high reactivity of this allotrope can be most closely associated with the highly strained bonds of the tetrahedron.
Gas phase phosphorus consists of two distinct structures, which allows for allotropic variety as a result of differing cooling ramps. Below 800 °C in the vapor phase, the structure is mostly P4. Above 800 °C, the tetrahedrons “start to dissociate into” P2 [5]. While other phosphorus allotropes take on different morphologies from gas phase phosphorus, WP shares the tetrahedral structure with the lower temperature gas phase morphology.
The polymorph of WP found at room temperature is α-WP [4]. This subdivision is most commonly generated by vacuum distillation of anhydrous RP [6]. The feasibility of this synthetic route is likely associated with the presence of the P4 tetrahedra in the low temperature gas phase. α-WP has a “complicated cubic structure” that resembles α-Mn where each metal atom is replaced with a P4 tetrahedron [7]; it should be noted that α-WP is not a perfect crystal and does not occupy every position in the α-Mn structure i.e., there are vacancies. Because of the vacancies, there is a high degree of disorder. With its large unit cell, α-WP is the least structured of the three polymorphs.
When cooled below −76.4 °C, α-WP undergoes a reversible phase transition to β-WP. As previously described, β-WP may also be crystallized in a solution of CS2, which is the method often employed to afford crystallinity and purity suitable for single crystal XRD data. β-WP has a much smaller unit cell than does α-WP, which highlights its higher order. Similar to α-WP, β-WP can be compared to the crystal structure of a metal: γ-Pu [7].
When α-WP is quenched in liquid nitrogen to a temperature of −165 °C, an irreversible change of α-WP to γ-WP occurs [4]. Furthermore, when warmed to −115 °C, γ-WP irreversibly transitions to β-WP [4]. γ-WP can be most easily described by comparison with β-WP; both polymorphs form “distorted hexagon nets” in a “chair conformation,” but the β-WP polymorph is significantly more planar than is the γ-WP variant [8]. Because the “distorted hexagon net” is less planar in γ-WP, the unit cell increases, but both β- and γ-WP are more ordered than the α-WP variant.

2.2. Red Phosphorus (RP)

As discussed previously, RP has five notable polymorphs denoted by Roman numerals. RP was first discovered by Anton von Scrötter in 1847 when exposing WP to sunlight [9]. The type discovered by Schrötter is denoted type I and is amorphous. Types II, III, and IV were reported by Roth et al. in 1947 through differential thermal analysis [10]. Briefly, liquid white was converted to a-RP above 280 °C. Above 480 °C, the a-RP started the conversion to type II and remained in this form through 500 °C and up to ~530 °C. At 540 °C, type III was formed, companioned with the formation of type IV. Above 545 °C, all remaining types II and III had been converted into type IV. Heating the sample at longer times above 550 °C resulted in type V red phosphorus. It was reported that the “short temperature range of stability” makes it “difficult” to report type II “with assurance.” [10]. Type V was first reported in 1865 by Johann Wilhelm Hittorf, and it is commonly called Hittorf’s Phosphorus or Violet Phosphorus because of its violet appearance [11]. Because of their similar physical appearance and identification from differential scanning calorimetry, types I through V are all considered polymorphic subdivisions of the red phosphorus allotrope. Only types IV and V have well-defined crystal structures.
As implied by its name, a-RP has no long-range structural order. Because of its lack of crystallinity, the exact structure of the polymorph cannot be discerned through single crystal XRD. The structure of a-RP has been the subject of much debate, and as of writing this review, there is no widely agreed upon structure. Recently, Zhang et al. reported numerous studies on a-RP to attempt to discern the structure from four proposed chains [12]. The selected structures were considered to be the most probable of those proposed in the literature. Briefly, it is claimed that a-RP is a “linear inorganic polymer with a broad molecular weight distribution” that seems to match most closely with a zig-zag structure. The reported analysis used computational comparisons of the elasticity of the different chains with a-RP [12]. These results notwithstanding, literature reports discussed later in this minireview focusing on the Raman spectra support a more complex structure including P cages and their corresponding vibrational modes.
The powder XRD data for type II was reported by Roth et al. when the subdivision was first observed [10], but as previously mentioned, the data was inconclusive. Winchester et al. reported isolation of type II in 2009, but to the authors’ knowledge there have been no follow up studies [13]. The currently reported type II data is included herein.
Type III has only been reported by Roth et al., and the structure has never been defined [10]. It can only be prepared in a very narrow temperature range, and it is only found as a mixture with type II or type IV.
The structures of type IV and type V are very similar. The structure for type IV was first elucidated in 2005 by Ruck et al. [1], which is 37 years after its discovery by Thurn and Krebs [14]. Both structures are characterized by -[P2]-[P8]-[P2]-[P9]- repeating sub-chains; the relative orientation of these sub-chains is the difference between these structures (Figure 1). In type IV, which is also called fibrous phosphorus, the chains run parallel and are connected by a P-P bond between the peaks of the P9 cages. The name fibrous phosphorus comes from its “needle” like morphology and that the crystals “split into thin filaments” when “under mechanical stress” [1]. The structure of type V was initially determined by Thurn and Krebs in 1969 in the same study in which type IV was discovered [14]. In this structure the two chains are offset to each other through a P-P bond on the peak of the P9 cage so the chains are perpendicular to each other. The perpendicular orientation of two chains generates a mesh-like morphology, which is paralleled in the macroscopic behavior of the material. Type V is a “platelike” material and “under mechanical stress,” crystals of type V fracture into “smaller platelets” [1]. A singular mesh of type V can be isolated and is sometimes called Hittorfene.

2.3. Black Phosphorus (BP)

Black phosphorus is characterized by three notable polymorphic subdivisions: orthorhombic (A11), rhombohedral (A7), and simple cubic (sc). While the subdivisions of WP can be interconverted through temperature transitions, in BP the subdivisions are a function of both temperature and pressure. Under ambient conditions, Black phosphorus is in the A11 orthorhombic form [15,16,17,18]. It is comprised of covalently-bonded sheets of corrugated, continuous six-member rings. Only weak forces hold the layers of A11 orthorhombic together, making it easy to mechanically exfoliate. It can be prepared from red phosphorus by applying a high mechanical suppressing pressure [19,20], or in sealed ampoules when mineralizing agents are present [21,22]. Under higher suppressing pressure, typically carried in a diamond anvil cell apparatus, the A11 orthorhombic form is converted to the A7 rhombohedral form at 8.75 GPa or above, and to the simple cubic form at 11 GPa or above [19,20]. These pressure-induced phase transitions result from increased atomic packing and changes in phosphorus coordination. In the orthorhombic A11 phase, phosphorus atoms form puckered layers with threefold coordination. Rising pressure reduces interlayer spacing and favors new interactions, triggering a shift to the more symmetrical rhombohedral A7 phase. Further compression leads to a major bond rearrangement and sixfold coordination in the simple cubic phase, maximizing packing. This trend mirrors a broader pattern in group 15 elements: pressure promotes higher symmetry and coordination. The process is reversible. When the pressure is released, the rhombohedral or simple cubic phosphorus is converted back to the orthorhombic form at ambient condition, i.e., the orthorhombic form is the only stable form of black phosphorus under ambient conditions [23,24]. In another study, it is demonstrated that 4.68 GPa is the critical pressure for the partial transition from orthorhombic to rhombohedral, and complete at 7 GPa [25,26,27]. The following paper from 2015 [28] Bachhuber et al. investigated the effect of van der Waals interactions for the interlayer distances of black phosphorous and its electronic structure.

2.4. Blue Phosphorus (BuP)

After the discovery of monolayer black phosphorus as a 2D semiconductor, a large amount of computational effort was placed on determining new possible allotropic forms of phosphorus with semiconducting character. The most widely studied of these computationally predicted allotropes is blue phosphorus. BuP was predicted by Zhu and Tománek in 2014 as a modification of orthorhombic black phosphorus [29]. Briefly, the modification consists of converting the “armchair” configuration of orthorhombic into a zig-zag shape. This has a major effect on the structure of the 2D sheet; notably, the irregular hexagon structure of orthorhombic becomes much more regular. Computational calculations suggest that this allotrope has a similar thermodynamic stability to orthorhombic, which is remarkably stable [29].
After the computational prediction in 2014, Zhang et al. claimed to have synthesized monolayers of BuP through molecular beam epitaxy [5], but this has since been revisited by Zhao et al. [30] Zhao et al. determined that the structure was found to incorporate the gold atoms of the substrate into the structure. This posed a serious issue for an allotropic designation as the proposed experimental structure was not truly a pure isolation of phosphorus. In March 2020 Zhang et al. were successful in using a silicon intercalation method to isolate monolayer BuP [31]. Briefly, silicon is evaporated and intercalated beneath the contaminated BuP, which forms a “gold silicide […] buffer layer,” which “restores the band structure characteristic” for the “pristine” BuP monolayer [31].

3. Raman Spectra of Phosphorus Allotropes
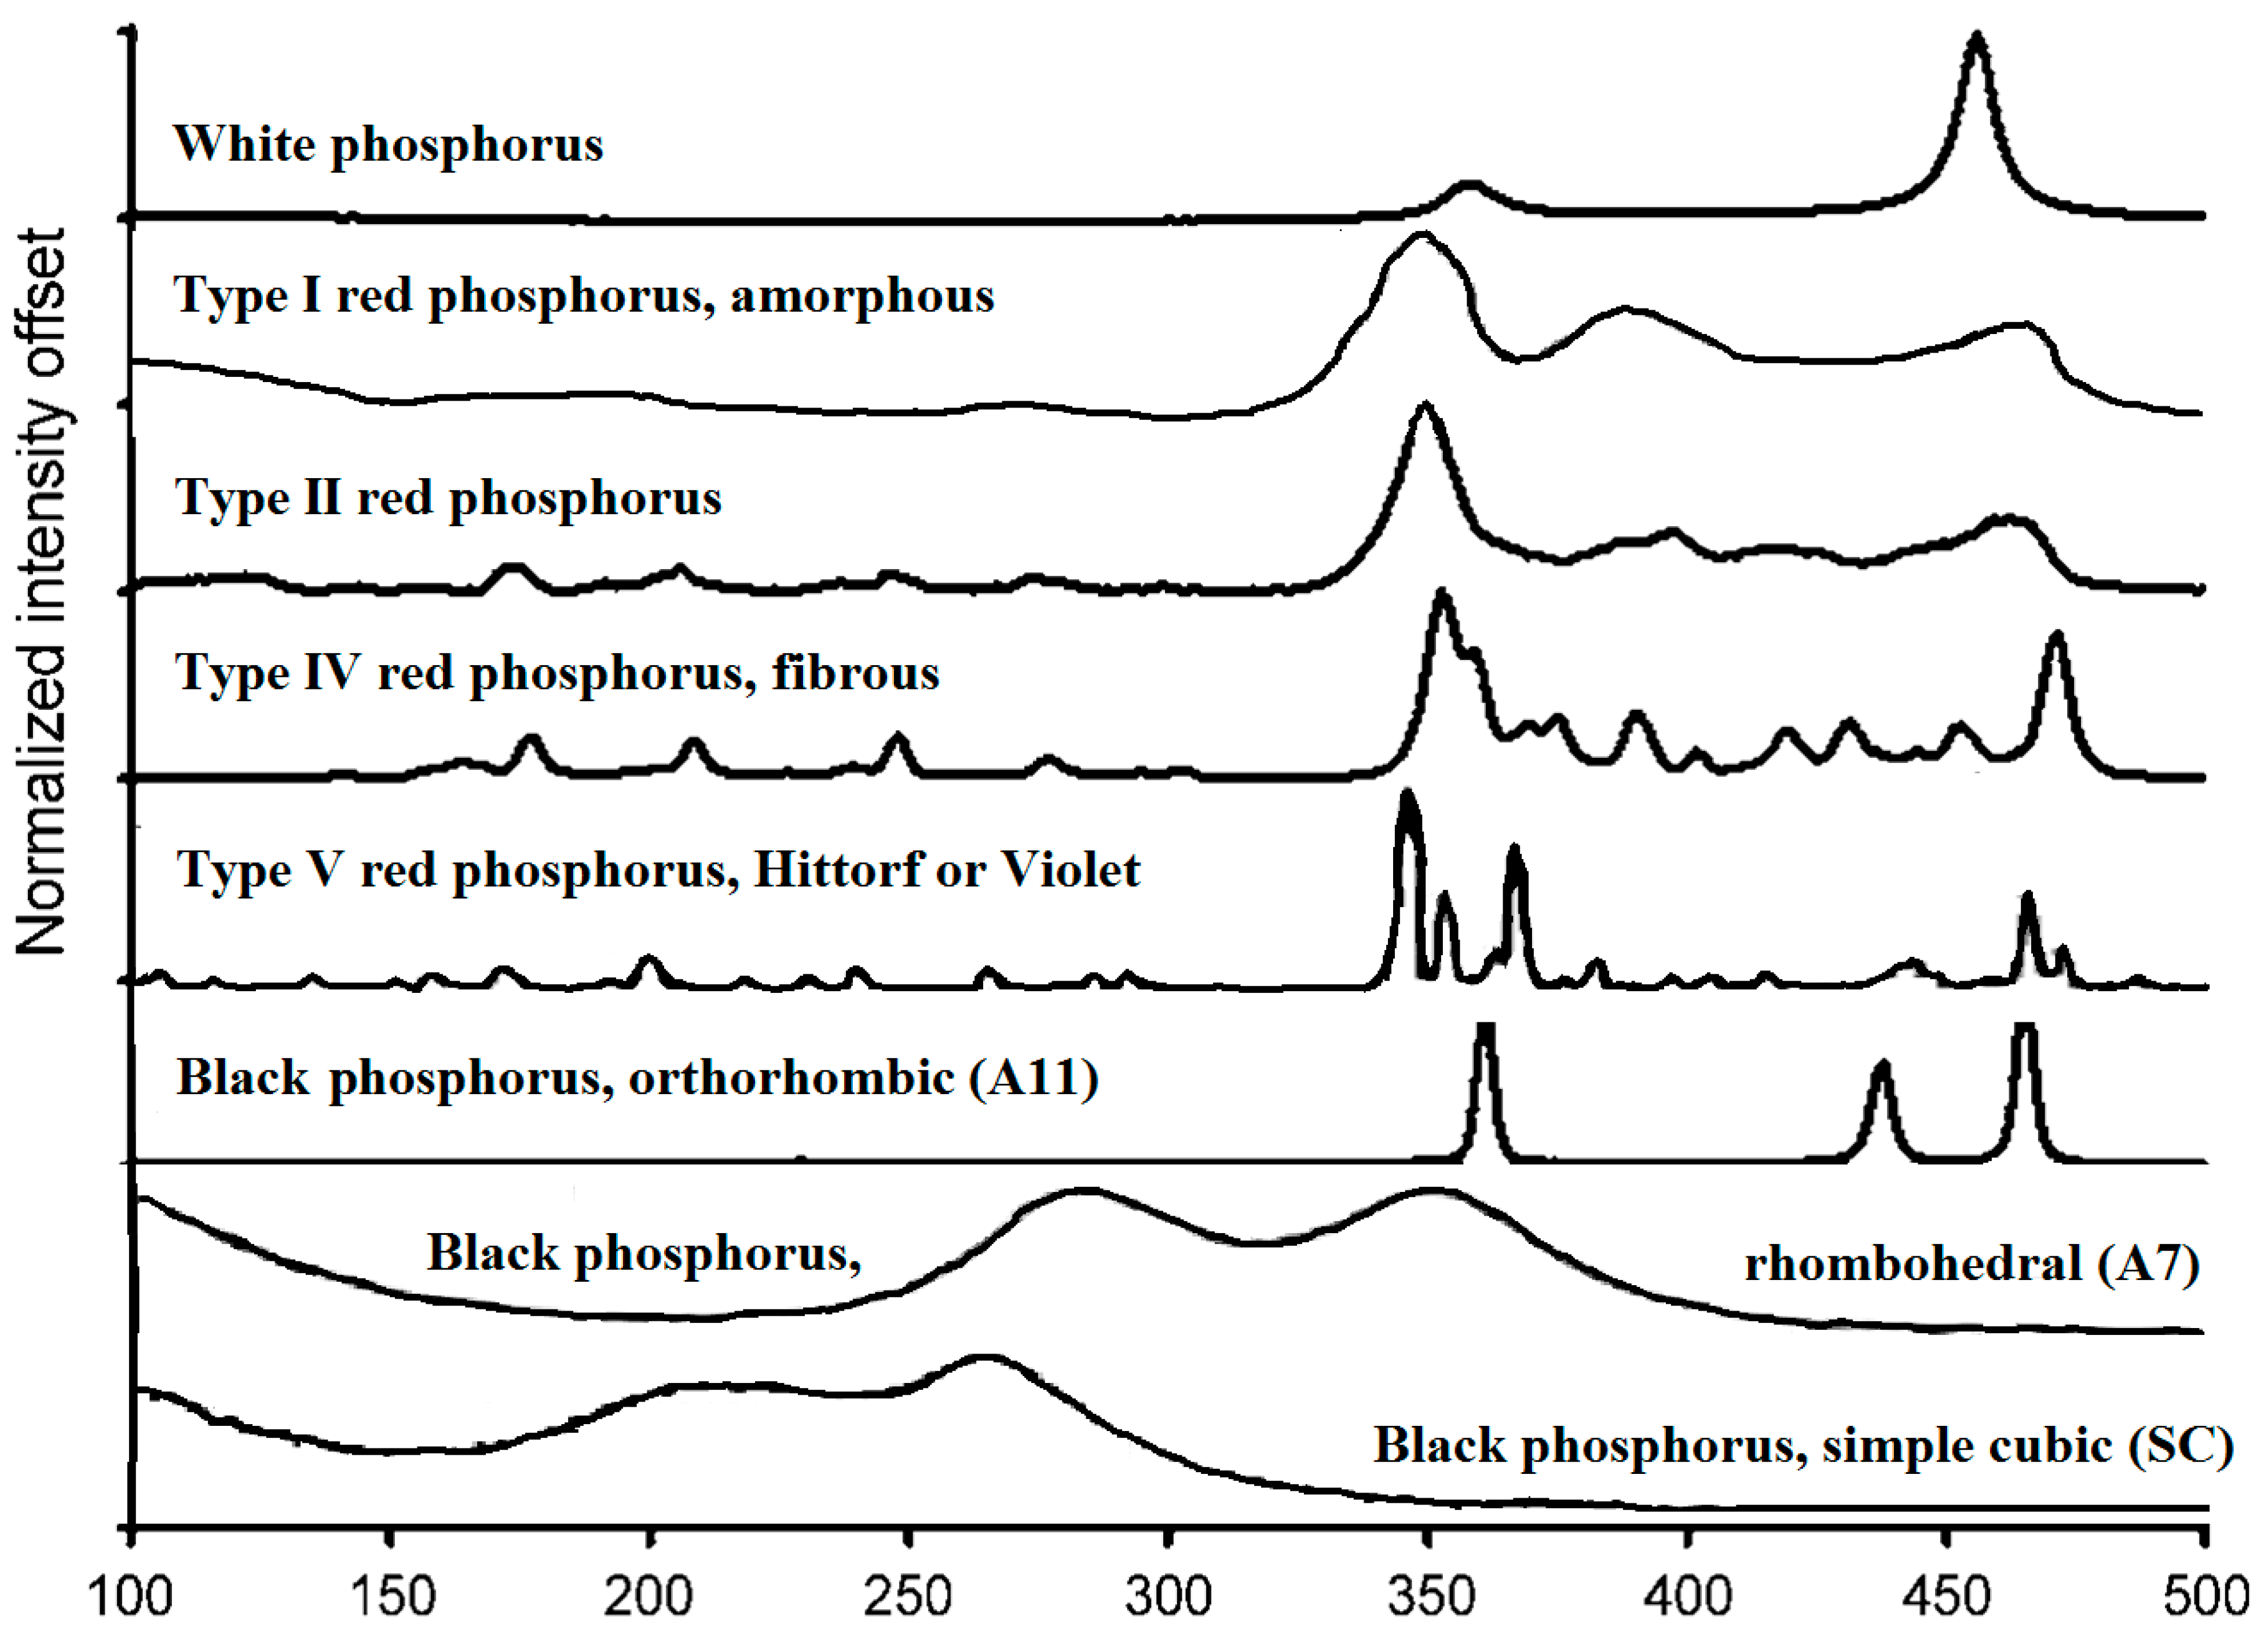
Except for type III red phosphorus, due to its scarcity in literature, the Raman spectra of all other types phosphorous are compared in Figure 2 and the major peaks, with their assignments, are listed in Table 1. It should be noted that great care must be taken when selecting beam intensity for Raman analysis of phosphorus allotropes to avoid exothermic events.
The Raman spectra and peak assignments of most of the allotropes, except for a-RP, are well studied (Table 1). The structural models proposed for a-RP and the assignments of the peaks are controversial. Several models have been proposed, such as a four-membered ring structural model [32], a layered structural model similar to that of orthorhombic black phosphorus [19,33,34], and a P8 and P9 cluster model [14,35,36], etc. A direct comparison of the Raman spectra in Figure 2 seems to partially support the P8 and P9 model due to the similarity between a-RP and type II, IV and V, i.e., the broad peaks in the amorphous phosphorus may be attributed to the P8 cages that exist in type II, IV, and V. This is reasonable since P8 can be formed from the fusing of two P4 molecules, and P2 molecules that bridge P8 have been found from vapor [37]. It is also possible that the subunit structures in a-RP are premature P8 structures that are later converted to P8 cages. The identity of such premature subunits may be comprised of two puckered four-membered rings before its transition to the P8 cage. This hypothesis supports both the four-membered ring structural model and the P8 and P9 cluster model. It is also likely that the polymeric premature P8 structures exist in all type II and III allotropes, with different spatial arrangement of the units. These comments notwithstanding, a defined structural model for a-RP remains to be determined.
Figure 2. Raman of white, red, and black phosphorus. White, type II red, type IV red, orthorhombic black are from [13] with permission from the publisher. a-RP and type V red are from [35] with permission from the publisher. Rhombohedral black and simple cubic black are from [19] with permission from the publisher. Raman of BuP was not reported.
Sci 07 00128 g002
Table 1. Raman peaks at room temperature and assignments (the unit of all the numbers is cm−1).
Phosphorus AllotropesPeak Locations and Assignments, cm−1
White F2 (457 [13], 461 [23]),
E (357, 365, same sequence above),
A1 (600, above, not shown in Figure 2).
a-RP (Type I) [35]350, 387, 464 (The assignment of the peaks remains to be determined).
Type II red350, 398, 417, 462 (Not assigned in the publication) [37]
Type III redNot reported. It can only be prepared in a very narrow temperature range, and mixed with either type II or type IV in the sample.
Type IV redNot specifically discussed in literature, but similar to those assigned for type V below.
Type V red [36]Breathing waves along the tube (430–480); Longitudinal (420) and transverse breathing modes (360–400) of P8 and P9; Bond angle distortions (290–175); Bending waves or rotational deformation waves along the tubes (<160).
Orthorhombic black [19] A g 1 , longitudinal displacement along the trigonal b-axis (362 [19], 365 [38,39], 362 [40]),
B2g, transverse motions (439, 442, 436, 439),
A g 2 , deformation of the zigzag chain along the a-axis (first paper) (466, 470, 471, 467)
B 3 g 1 , displacement between zigzag chains parallel to the c-axis (228, 223, 230)
B1g, displacement between zigzag chains parallel to the a-axis (192, 197, 193)
Rhombohedral black [19]Eg, pressure dependent. (308 at 5 GPa, 290 at 7 GPa, 280 at 10 GPa), decrease at −5.5 cm−1/GPa.
A1g pressure dependent. (388 at 5 GPa, 370 at 7 GPa, 340 at 10 GPa), decrease at −10 cm−1/GPa.
Simple cubic black230, 275. No explanation on the origin of the bands. [19]
It is noteworthy that
  • Raman spectra of a-RP films and bulk amorphous samples are very similar with minor difference corresponding to the difference in the ordered structure [41].
  • Under polarized light, the Raman spectra of phosphorus have some differences, such as a-RP [41] and type V red phosphorus [36].
  • The shift in peaks at different temperatures was also observed [41].

4. Powder X-Ray Diffraction

Except for white phosphorus and type III red phosphorus, because of their irradiation-based instability and scarcity in literature, respectively, the powder XRD patterns of all other types of red phosphorus and orthorhombic black phosphorus are compared in Figure 3 and their assignments are listed in Table 2.
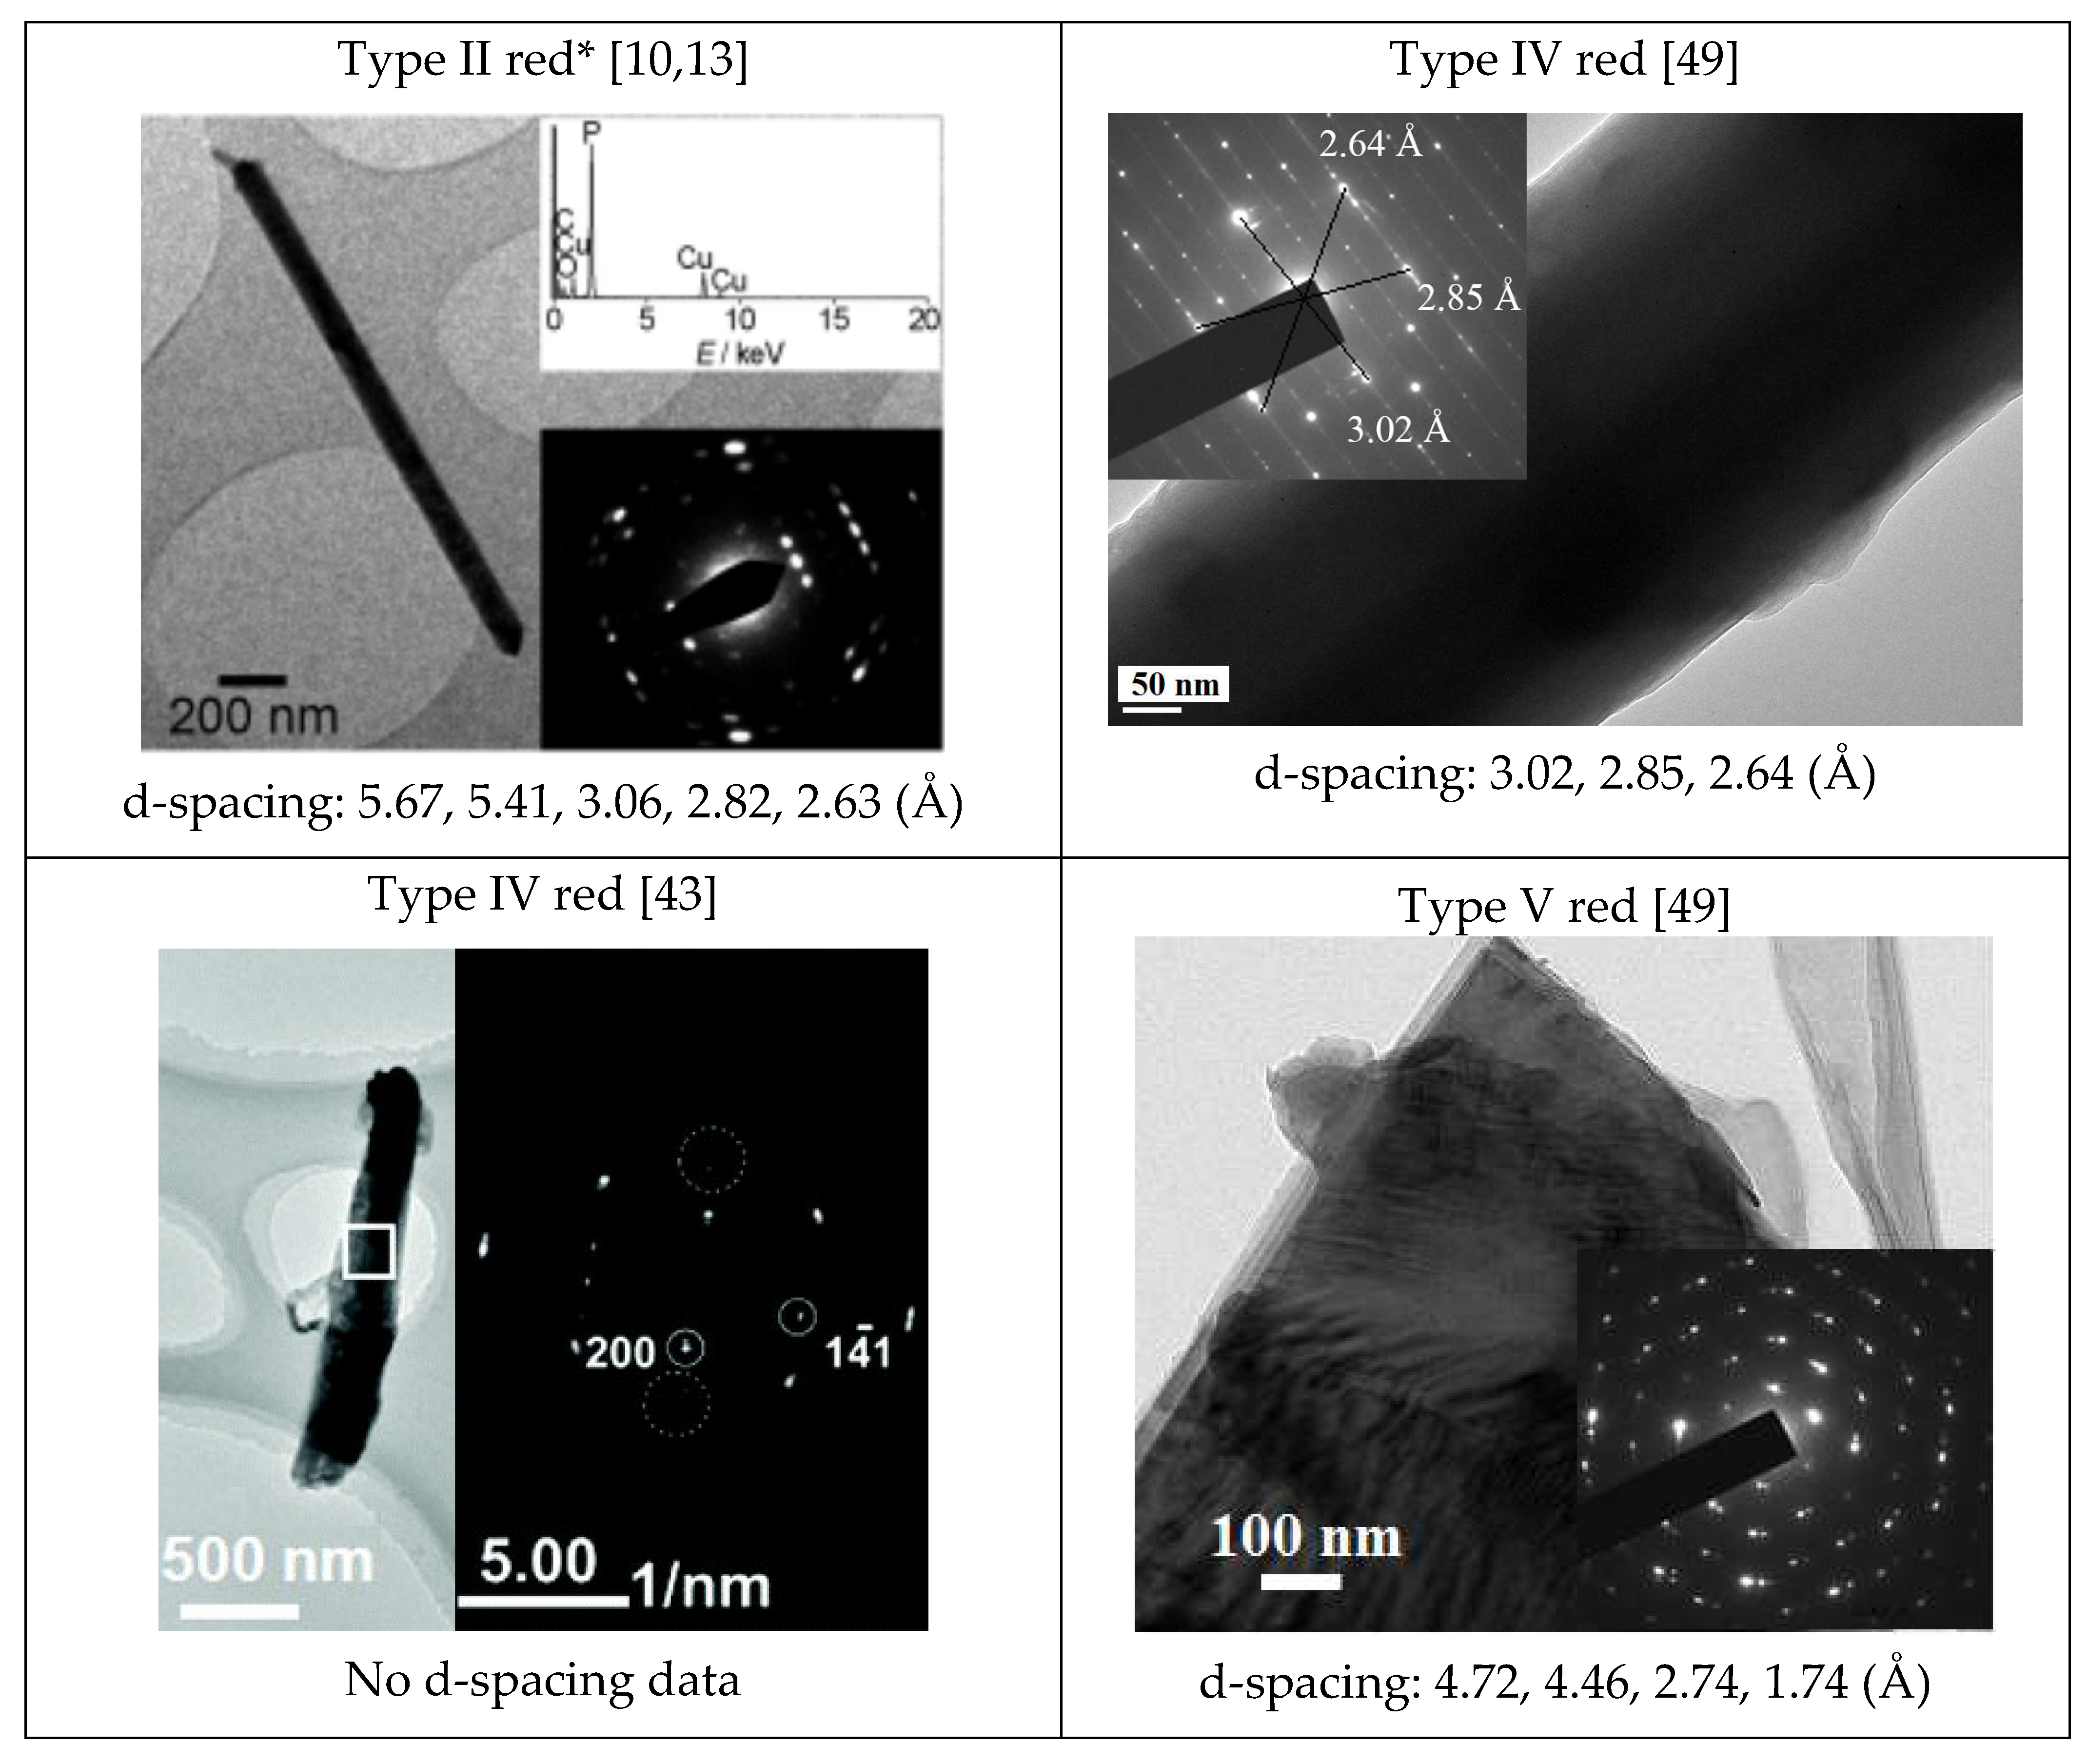
Powder XRD patterns were reported by Roth et al. in the paper first acknowledging the existence of type II red phosphorus [10]. Winchester et al. performed TEM with SAED on nanowire morphological variants of type II, which were synthesized on a silicon substrate with a bismuth catalyst [13]. Such SAED results agree well with the XRD pattern observed in both studies for type II. However, since the nanowire variants were grown from the (012) plane of the Bi catalyst, the latter’s signal dominates ~3.25 Å, thereby prohibiting further agreement with the d-spacing of 3.30 Å reported by Roth et al. Furthermore, the peak at 28.4 in the powder XRD, which corresponds to a spacing of 3.08 Å reported by Roth et al., is only weakly observed in the powder XRD acquired by Winchester et al. To the authors’ knowledge, TEM/SAED results have not been obtained for type II red phosphorus grown independent of a substrate.

5. Single Crystal XRD

The single crystal X-ray diffraction patterns for phosphorus allotropes are listed in Table 3. The cell constants of black phosphorus (possibly red phosphorus as well) are variable under differential temperatures because of compressibility effects of phosphorus crystals [46].

6. Transmission Electron Microscopy (TEM)/Selected Area Electron Diffraction (SAED)

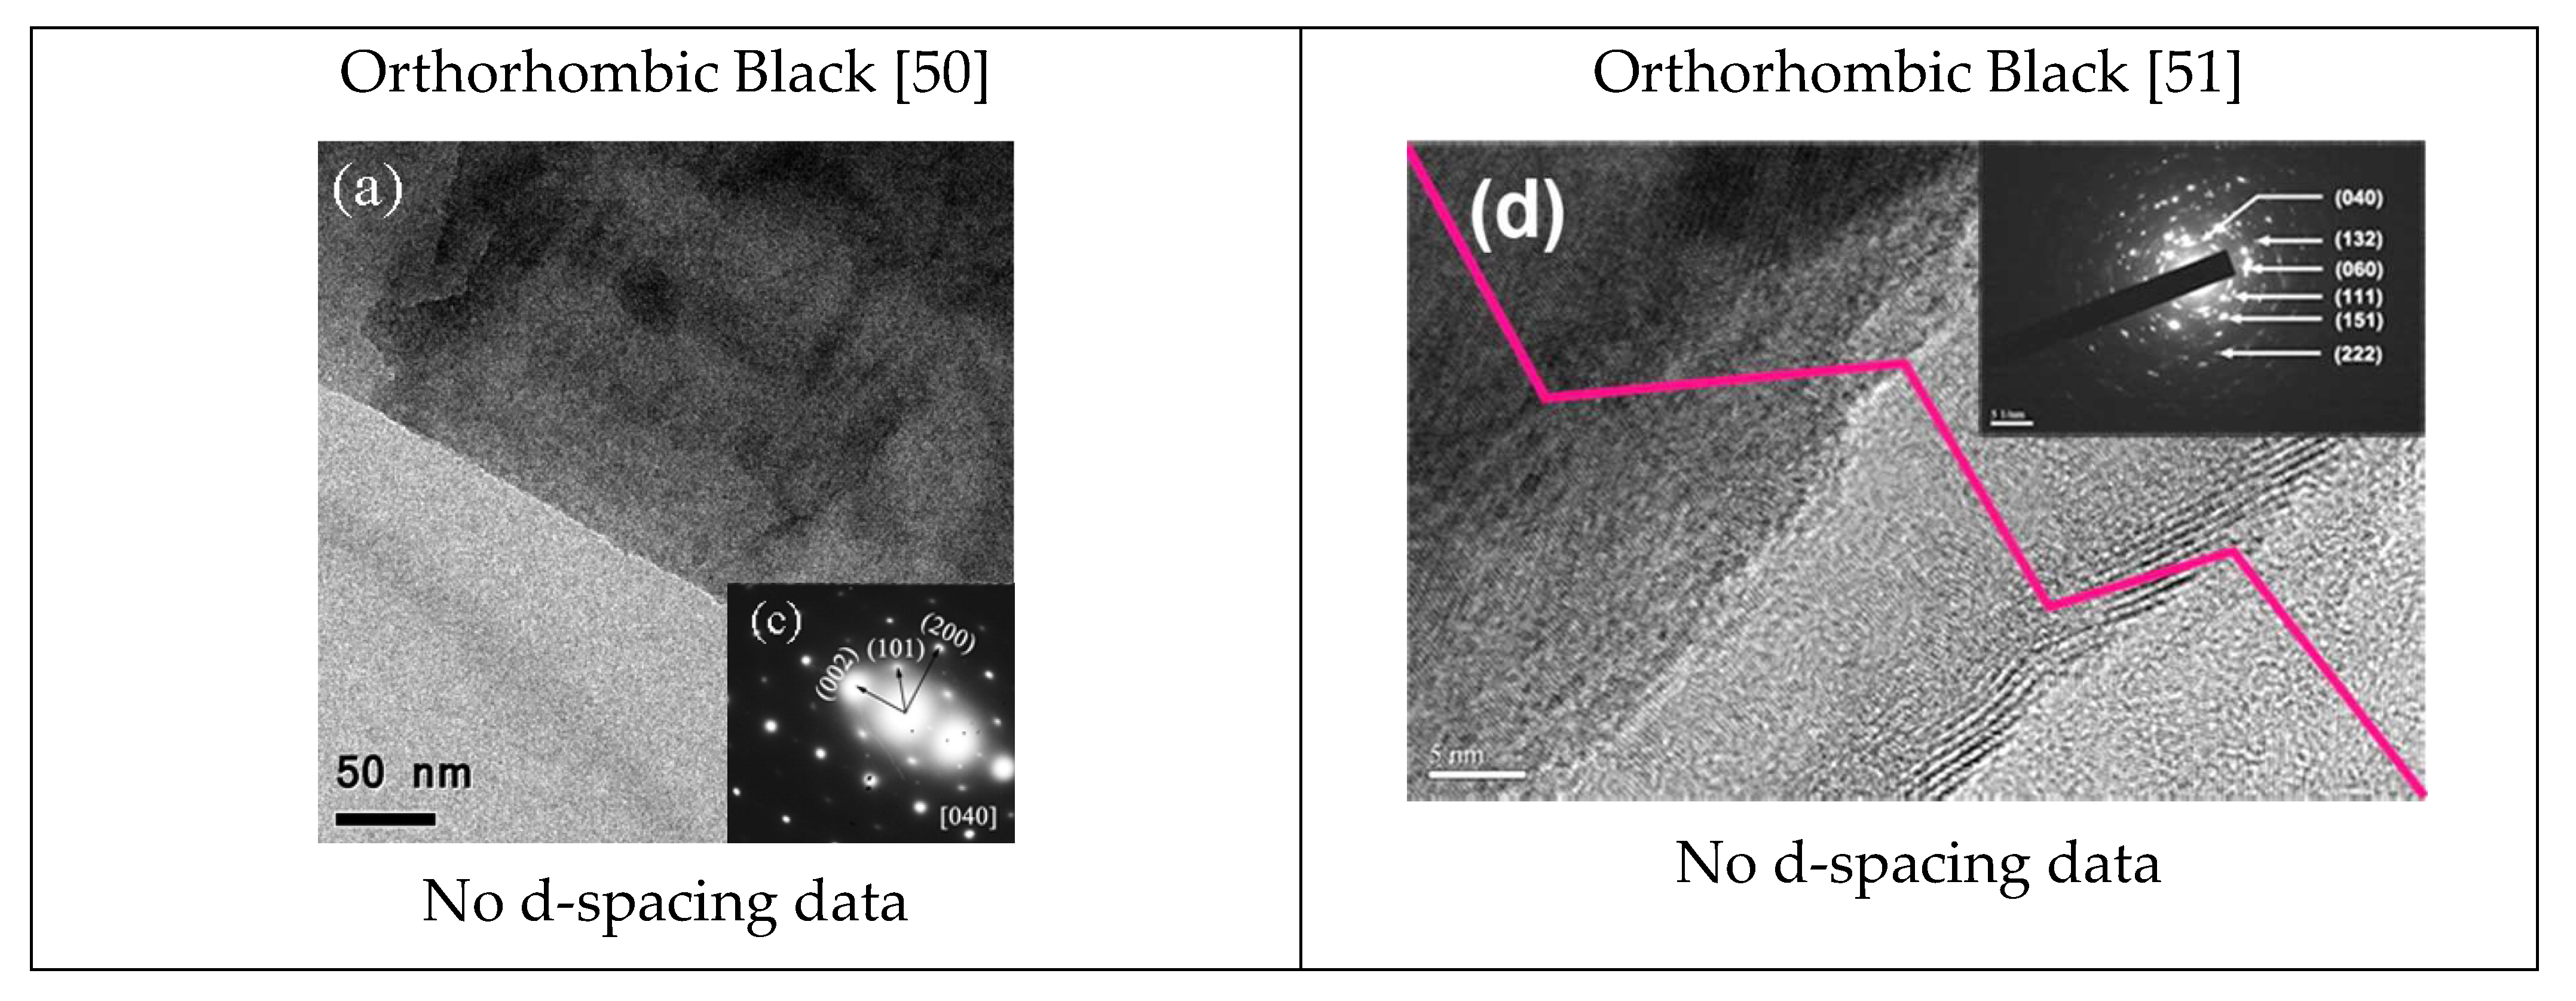
Except for white phosphorus and a-RP and type III red phosphorus, the TEM images and their diffraction patterns together with measured d-spacings of all other types of red phosphorus and black phosphorus are compared in Figure 4.

7. High-Resolution Transient Electron Microscopy (HRTEM)

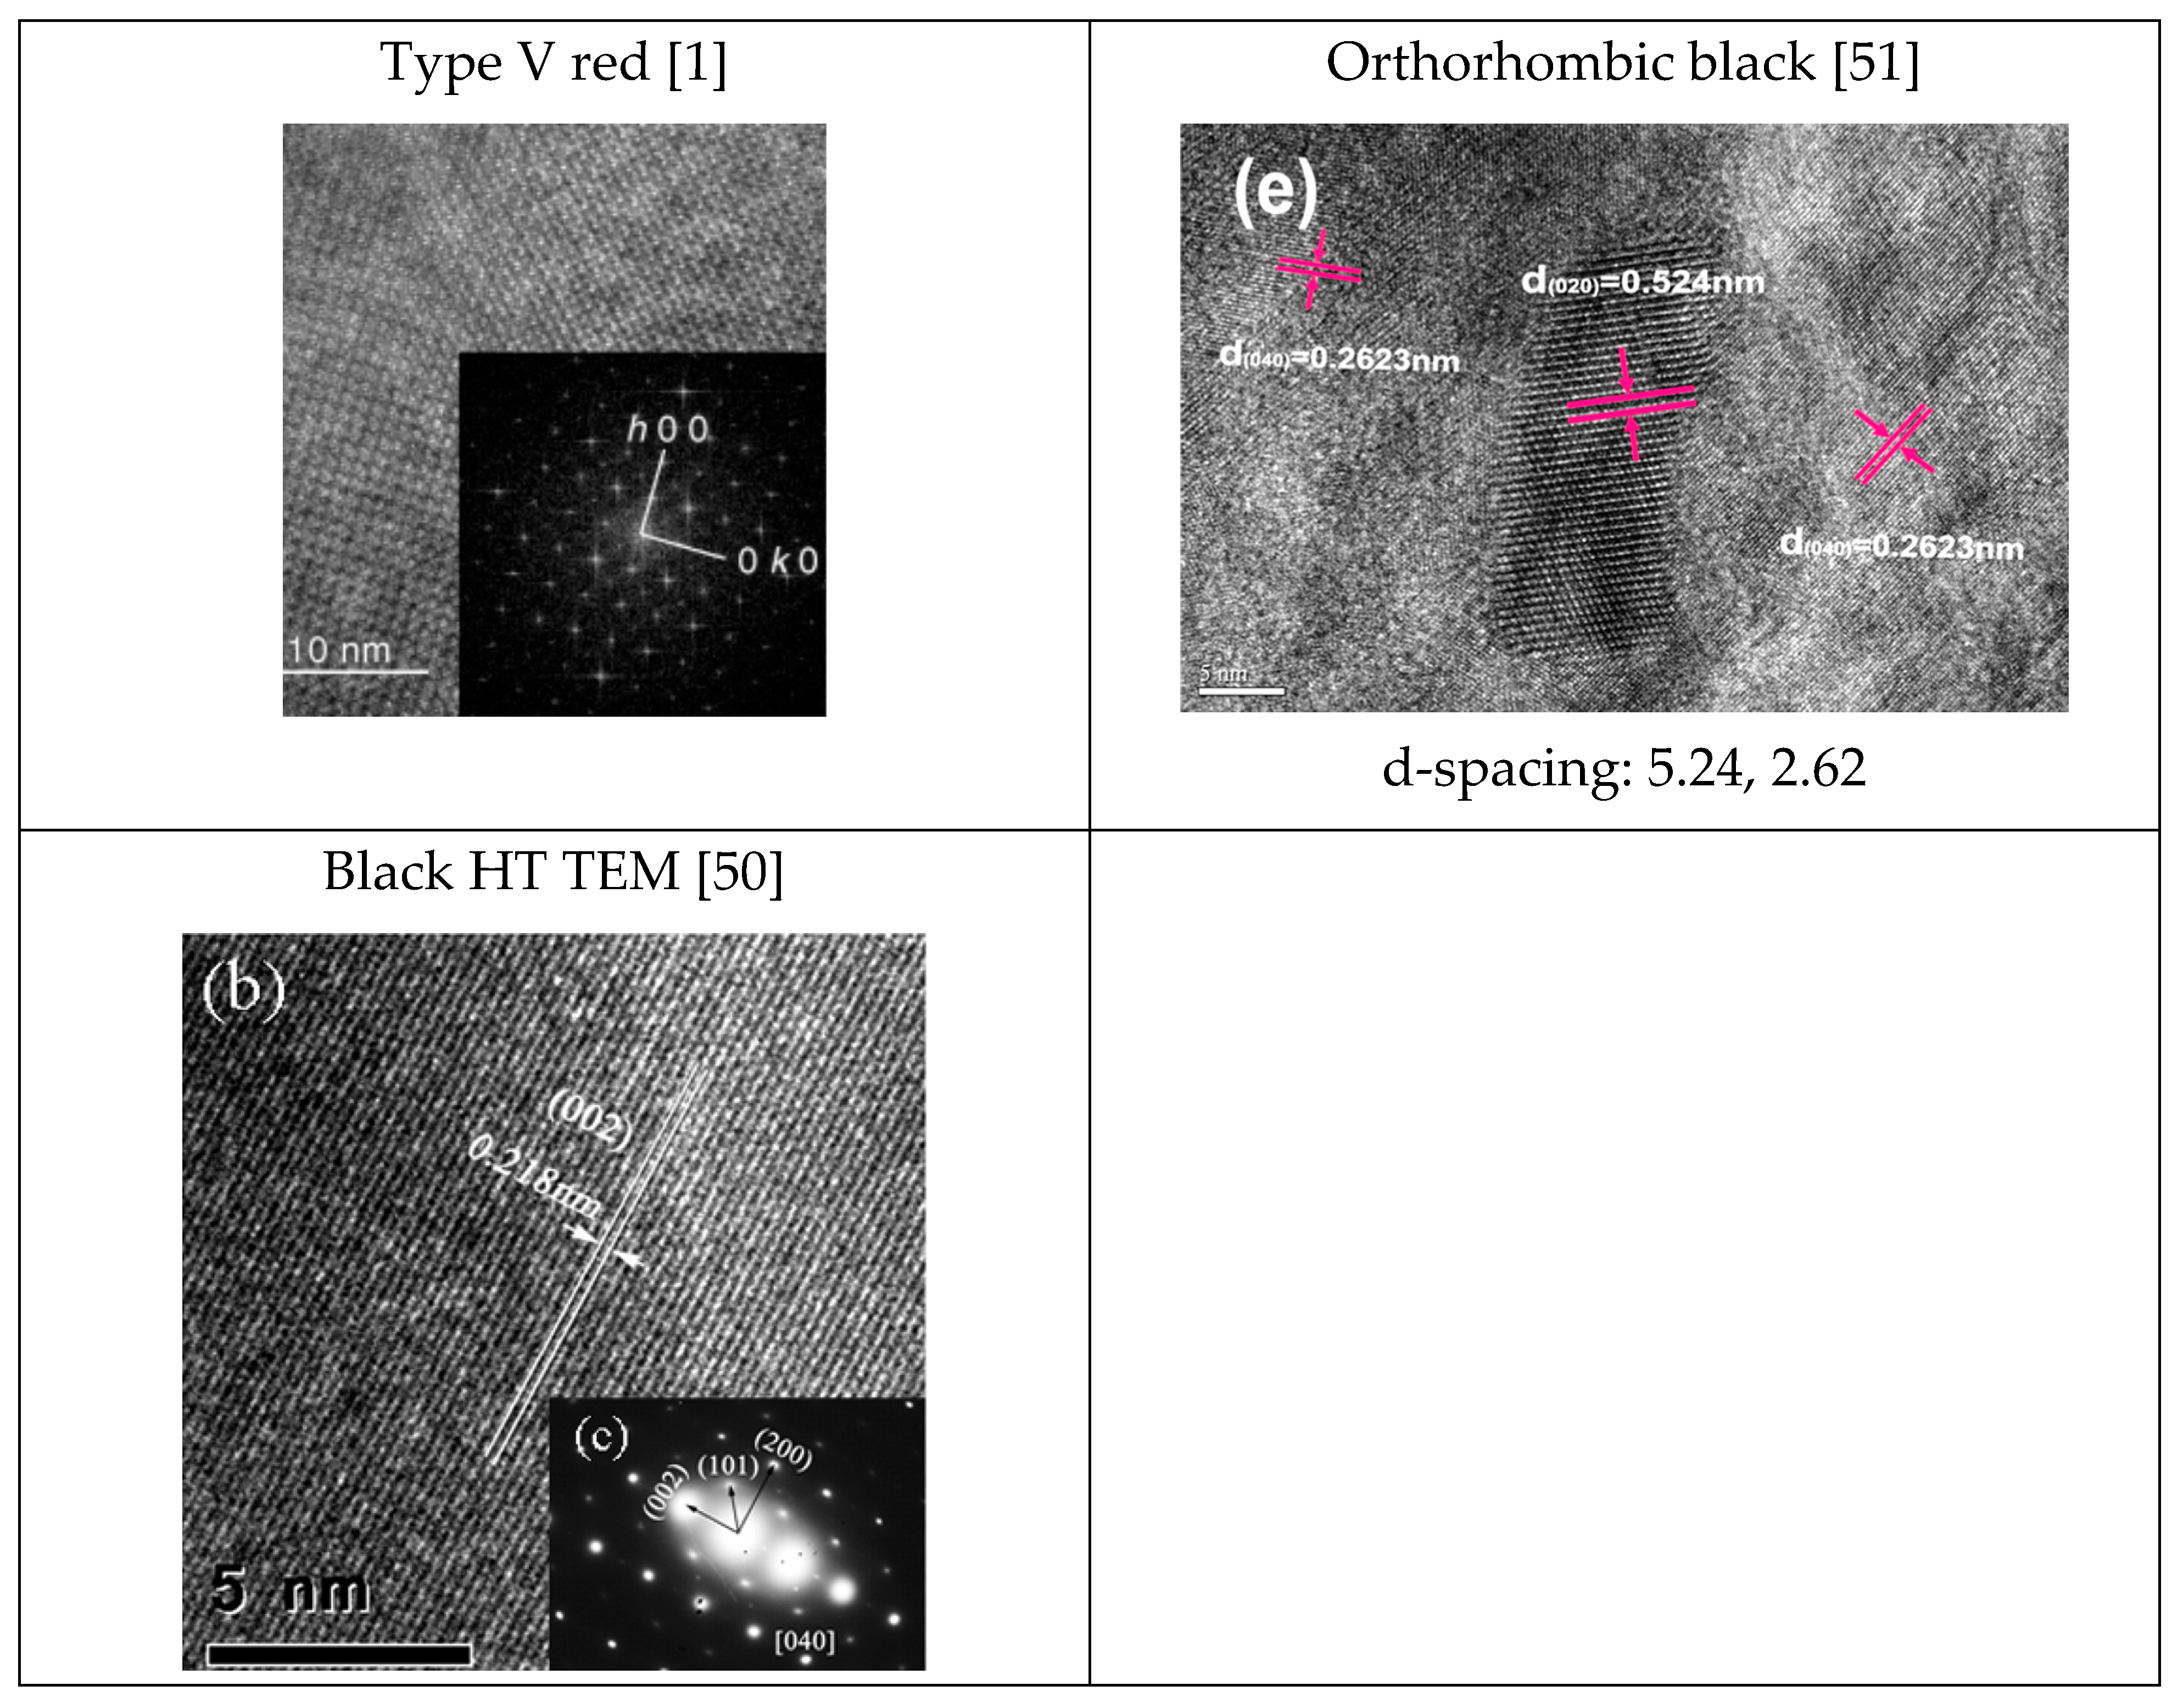
Except for white phosphorus and type III red phosphorus, the high-resolution TEM images of other types of red phosphorus and black phosphorous are compared in Figure 5.

8. A Summary of the Characterization Features for Phosphorus Allotropes and a Guideline for Choosing and Interpreting Characterization Techniques

To align with the review’s goal of being a practical reference for researchers, Table 4 shows a comprehensive, user-friendly summary table compiling the key characterization features (Raman peaks, powder XRD 2θ peaks, and TEM with SAED d-spacings) for several major phosphorus allotropes:
The following is a flowchart-style guide for choosing and interpreting characterization techniques based on the sample type (e.g., bulk, thin film, exfoliated, amorphous), which serve as a practical reference.
START → What is your sample?
→ Bulk solid? → Try Powder XRD + Raman → Identify 2θ positions and Raman shifts
→ Thin film? → Raman → Match key peak signatures
→ Nanosheet/wire? → TEM/HRTEM + SAED → Determine lattice spacing
→ Amorphous? → Raman → Look for broad features resembling P8/P9
A detailed clear guideline or step-by-step workflow in table format, summarizing technique selection and interpretation strategy is shown in Table 5.

9. Common Pitfalls and Ambiguities

The common pitfalls and ambiguities, along with tips for distinguishing closely related phosphorus allotropes are summarized in Table 6.

10. Conclusions

This minireview summarized the Raman, powder XRD, single crystal XRD, TEM with SAED, and HRTEM of phosphorus allotropes. It may be used as an index for the characterization of phosphorus. Phosphorus allotropes can also be characterized by other means, such as FTIR [32,41], neutron diffraction scattering, scanning tuning microscopy [52], X-ray photoemission spectroscopy [53], etc. However, they are not included in this short review since they are either not characteristic or not popular (see Table 7 for detailed reasons). Another important group of phosphorous families is MPn family, polyphosphides, which is not summarized in this work.

Funding

This research received no external funding.

Conflicts of Interest

The authors declare no conflict of interest.

References

  1. Ruck, M.; Hoppe, D.; Wahl, B.; Simon, P.; Wang, Y.; Seifert, G. Fibrous Red Phosphorus. Angew. Chem. Int. Ed. 2005, 44, 7616–7619. [Google Scholar] [CrossRef]
  2. Li, L.; Yu, Y.; Ye, G.J.; Ge, Q.; Ou, X.; Wu, H.; Feng, D.; Chen, X.H.; Zhang, Y. Black Phosphorus Field-Effect Transistors. Nat. Nanotechnol. 2014, 9, 372–377. [Google Scholar] [CrossRef] [PubMed]
  3. Corbridge, D.E.C.; Lowe, E.J. Structure of White Phosphorus: Single Crystal X-Ray Examination. Nature 1952, 170, 629. [Google Scholar] [CrossRef]
  4. Simon, A.; Borrmann, H.; Horakh, J. On the Polymorphism of White Phosphorus. Chem. Ber. 1997, 130, 1235–1240. [Google Scholar] [CrossRef]
  5. Zhang, J.L.; Zhao, S.; Han, C.; Wang, Z.; Zhong, S.; Sun, S.; Guo, R.; Zhou, X.; Gu, C.D.; Yuan, K.D.; et al. Epitaxial Growth of Single Layer Blue Phosphorus: A New Phase of Two-Dimensional Phosphorus. Nano Lett. 2016, 16, 4903–4908. [Google Scholar] [CrossRef] [PubMed]
  6. Nachtrieb, N.H.; Handler, G.S. Self-Diffusion in α White Phosphorus. J. Chem. Phys. 1955, 23, 1187–1193. [Google Scholar] [CrossRef]
  7. Simon, A.; Borrmann, H.; Craubner, H. Crystal Structure of Ordered White Phosphorus(β-P). Phosphorous Sulfur Relat. Elem. 1987, 30, 507–510. [Google Scholar] [CrossRef]
  8. Okudera, H.; Dinnebier, R.E.; Simon, A. The Crystal Structure of γ -P 4, a Low Temperature Modification of White Phosphorus. Z. Krist.-Cryst. Mater. 2005, 220, 259–264. [Google Scholar] [CrossRef]
  9. Kohn, M. The Discovery of Red Phosphorus (1847) by Anton von Schrötter (1802–1875). J. Chem. Educ. 1944, 21, 522. [Google Scholar] [CrossRef]
  10. Roth, W.; DeWitt, T.; Smith, A.J. Polymorphism of Red Phosphorus. J. Am. Chem. Soc. 1947, 69, 2881–2885. [Google Scholar] [CrossRef]
  11. Hittorf, W. Zur Kenntniss des Phosphors. Ann. Phys. Chem. 1865, 202, 193–228. [Google Scholar] [CrossRef]
  12. Zhang, S.; Qian, H.; Liu, Z.; Ju, H.; Lu, Z.; Zhang, H.; Chi, L.; Cui, S. Towards Unveiling the Exact Molecular Structure of Amorphous Red Phosphorus by Single-Molecule Studies. Angew. Chem. 2019, 131, 1673–1677. [Google Scholar] [CrossRef]
  13. Winchester, R.A.L.; Whitby, M.; Shaffer, M.S.P. Synthesis of Pure Phosphorus Nanostructures. Angew. Chem. 2009, 121, 3670–3675. [Google Scholar] [CrossRef]
  14. Thurn, H.; Krebs, H. Über Struktur Und Eigenschaften Der Halbmetalle. XXII. Die Kristallstruktur Des Hittorfschen Phosphors. Acta Crystallogr. B Struct. Crystallogr. Cryst. Chem. 1969, 25, 125–135. [Google Scholar] [CrossRef]
  15. Corbridge, D.E.C. Phosphorus, 6th ed.; CRC Press: Boca Raton, FL, USA, 2016. [Google Scholar] [CrossRef]
  16. Maruyama, Y.; Suzuki, S.; Kobayashi, K.; Tanuma, S. Synthesis and Some Properties of Black Phosphorus Single Crystals. Physica B+C 1981, 105, 99–102. [Google Scholar] [CrossRef]
  17. Hultgren, R.; Gingrich, N.S.; Warren, B.E. The Atomic Distribution in Red and Black Phosphorus and the Crystal Structure of Black Phosphorus. J. Chem. Phys. 1935, 3, 351–355. [Google Scholar] [CrossRef]
  18. Cartz, L.; Srinivasa, S.R.; Riedner, R.J.; Jorgensen, J.D.; Worlton, T.G. Effect of Pressure on Bonding in Black Phosphorus. J. Chem. Phys. 1979, 71, 1718–1721. [Google Scholar] [CrossRef]
  19. Akahama, Y.; Kobayashi, M.; Kawamura, H. Raman Study of Black Phosphorus up to 13 GPa. Solid State Commun. 1997, 104, 311–315. [Google Scholar] [CrossRef]
  20. Kikegawa, T.; Iwasaki, H. An X-Ray Diffraction Study of Lattice Compression and Phase Transition of Crystalline Phosphorus. Acta Crystallogr. B Struct. Sci. 1983, 39, 158–164. [Google Scholar] [CrossRef]
  21. Lange, S.; Schmidt, P.; Nilges, T. Au3SnP7@Black Phosphorus: An Easy Access to Black Phosphorus. Inorg. Chem. 2007, 46, 4028–4035. [Google Scholar] [CrossRef]
  22. Köpf, M.; Eckstein, N.; Pfister, D.; Grotz, C.; Krüger, I.; Greiwe, M.; Hansen, T.; Kohlmann, H.; Nilges, T. Access and in Situ Growth of Phosphorene-Precursor Black Phosphorus. J. Cryst. Growth 2014, 405, 6–10. [Google Scholar] [CrossRef]
  23. Rissi, E.N.; Soignard, E.; McKiernan, K.A.; Benmore, C.J.; Yarger, J.L. Pressure-Induced Crystallization of Amorphous Red Phosphorus. Solid State Commun. 2012, 152, 390–394. [Google Scholar] [CrossRef]
  24. Chang, K.J.; Cohen, M.L. Structural Stability of Phases of Black Phosphorus. Phys. Rev. B 1986, 33, 6177–6186. [Google Scholar] [CrossRef]
  25. Iwasaki, H.; Kikegawa, T.; Fujimura, T.; Endo, S.; Akahama, Y.; Akai, T.; Shimomura, O.; Yamaoka, S.; Yagi, T.; Akimoto, S.; et al. Synchrotron Radiation Diffraction Study of Phase Transitions in Phosphorus at High Pressures and Temperatures. Physica B+C 1986, 139–140, 301–304. [Google Scholar] [CrossRef]
  26. Akai, T.; Endo, S.; Akahama, Y.; Koto, K.; Marljyama, Y. The Crystal Structure and Oriented Transformation of Black Phosphorus under High Pressure. High Press. Res. 1989, 1, 115–130. [Google Scholar] [CrossRef]
  27. Akahama, Y.; Endo, S.; Narita, S. Electrical Properties of Single-Crystal Black Phosphorus under Pressure. Physica B+C 1986, 139–140, 397–400. [Google Scholar] [CrossRef]
  28. Bachhuber, F.; Von Appen, J.; Dronskowski, R.; Schmidt, P.; Nilges, T.; Pfitzner, A.; Weihrich, R. Van Der Waals Interactions in Selected Allotropes of Phosphorus. Z. Krist.-Cryst. Mater. 2015, 230, 107–115. [Google Scholar] [CrossRef]
  29. Zhu, Z.; Tománek, D. Semiconducting Layered Blue Phosphorus: A Computational Study. Phys. Rev. Lett. 2014, 112, 176802. [Google Scholar] [CrossRef]
  30. Zhao, S.; Zhang, J.L.; Chen, W.; Li, Z. Structure of Blue Phosphorus Grown on Au(111) Surface Revisited. J. Phys. Chem. C 2020, 124, 2024–2029. [Google Scholar] [CrossRef]
  31. Zhang, J.L.; Zhao, S.; Sun, S.; Ding, H.; Hu, J.; Li, Y.; Xu, Q.; Yu, X.; Telychko, M.; Su, J.; et al. Synthesis of Monolayer Blue Phosphorus Enabled by Silicon Intercalation. ACS Nano 2020, 14, 3687–3695. [Google Scholar] [CrossRef]
  32. Durig, J.R.; Casper, J.M. On the Vibrational Spectra and Structure of Red phosphorus. J. Mol. Struct. 1970, 5, 351–358. [Google Scholar] [CrossRef]
  33. Shanabrook, B.V.; Lannin, J.S. Structural and Vibrational Properties of Amorphous Phosphorus. Phys. Rev. B 1981, 24, 4771–4780. [Google Scholar] [CrossRef]
  34. Lannin, J.S.; Shanabrook, B.V. Raman Scattering and Infrared Absorption in Bulk Amorphous Red Phosphorous. Solid State Commun. 1978, 28, 497–500. [Google Scholar] [CrossRef]
  35. Olego, D.J.; Baumann, J.A.; Kuck, M.A.; Schachter, R.; Michel, C.G.; Raccah, P.M. The Microscopic Structure of Bulk Amorphous Red Phosphorus: A Raman Scattering Investigation. Solid State Commun. 1984, 52, 311–314. [Google Scholar] [CrossRef]
  36. Fasol, G.; Cardona, M.; Hönle, W.; von Schnering, H.G. Lattice Dynamics of Hittorf’s Phosphorus and Identification of Structural Groups and Defects in Amorphous Red Phosphorus. Solid State Commun. 1984, 52, 307–310. [Google Scholar] [CrossRef]
  37. Olego, D.J.; Baumann, J.A.; Schachter, R. The Microscope Structures of Amorphous Phosphorus. Solid State Commun. 1985, 53, 905–908. [Google Scholar] [CrossRef]
  38. Sugai, S.; Shirotani, I. Raman and Infrared Reflection Spectroscopy in Black Phosphorus. Solid State Commun. 1985, 53, 753–755. [Google Scholar] [CrossRef]
  39. Sugai, S.; Ueda, T.; Murase, K. Pressure Dependence of the Lattice Vibration in the Orthorhombic and Rhombohedral Structures of Black Phosphorus. J. Phys. Soc. Jpn. 1981, 50, 3356–3361. [Google Scholar] [CrossRef]
  40. Vanderborgh, C.A.; Schiferl, D. Raman Studies of Black Phosphorus from 0.25 to 7.7 GPa at 15 K. Phys. Rev. B 1989, 40, 9595–9599. [Google Scholar] [CrossRef]
  41. Lannin, J.S.; Shanabrook, B.V.; Gompf, F. Intermediate Range Order in Amorphous Phosphorous. J. Non-Cryst. Solids 1982, 49, 209–219. [Google Scholar] [CrossRef]
  42. Ruan, B.; Wang, J.; Shi, D.; Xu, Y.; Chou, S.; Liu, H.; Wang, J. A Phosphorus/N-Doped Carbon Nanofiber Composite as an Anode Material for Sodium-Ion Batteries. J. Mater. Chem. A 2015, 3, 19011–19017. [Google Scholar] [CrossRef]
  43. Shen, Z.; Hu, Z.; Wang, W.; Lee, S.-F.; Chan, D.K.L.; Li, Y.; Gu, T.; Yu, J.C. Crystalline Phosphorus Fibers: Controllable Synthesis and Visible-Light-Driven Photocatalytic Activity. Nanoscale 2014, 6, 14163–14167. [Google Scholar] [CrossRef]
  44. Eckstein, N.; Hohmann, A.; Weihrich, R.; Nilges, T.; Schmidt, P. Synthesis and Phase Relations of Single-Phase Fibrous Phosphorus. Z. Anorg. Allg. Chem. 2013, 639, 2741–2743. [Google Scholar] [CrossRef]
  45. Nilges, T.; Kersting, M.; Pfeifer, T. A Fast Low-Pressure Transport Route to Large Black Phosphorus Single Crystals. J. Solid State Chem. 2008, 181, 1707–1711. [Google Scholar] [CrossRef]
  46. Clark, S.M.; Zaug, J.M. Compressibility of Cubic White, Orthorhombic Black, Rhombohedral Black, and Simple Cubic Black Phosphorus. Phys. Rev. B 2010, 82, 134111. [Google Scholar] [CrossRef]
  47. Natta, G.; Passerini, L. The Crystal Structure of White Phosphorus. Nature 1930, 125, 707–708. [Google Scholar] [CrossRef]
  48. Jamieson, J.C. Crystal Structures Adopted by Black Phosphorus at High Pressures. Science 1963, 139, 1291–1292. [Google Scholar] [CrossRef]
  49. Smith, J.B.; Hagaman, D.; DiGuiseppi, D.; Schweitzer-Stenner, R.; Ji, H. Ultra-Long Crystalline Red Phosphorus Nanowires from Amorphous Red Phosphorus Thin Films. Angew. Chem. Int. Ed. 2016, 55, 11829–11833. [Google Scholar] [CrossRef]
  50. Zhao, M.; Qian, H.; Niu, X.; Wang, W.; Guan, L.; Sha, J.; Wang, Y. Growth Mechanism and Enhanced Yield of Black Phosphorus Microribbons. Cryst. Growth Des. 2016, 16, 1096–1103. [Google Scholar] [CrossRef]
  51. Sun, L.-Q.; Li, M.-J.; Sun, K.; Yu, S.-H.; Wang, R.-S.; Xie, H.-M. Electrochemical Activity of Black Phosphorus as an Anode Material for Lithium-Ion Batteries. J. Phys. Chem. C 2012, 116, 14772–14779. [Google Scholar] [CrossRef]
  52. Zhang, C.D.; Lian, J.C.; Yi, W.; Jiang, Y.H.; Liu, L.W.; Hu, H.; Xiao, W.D.; Du, S.X.; Sun, L.L.; Gao, H.J. Surface Structures of Black Phosphorus Investigated with Scanning Tunneling Microscopy. J. Phys. Chem. C 2009, 113, 18823–18826. [Google Scholar] [CrossRef]
  53. Goodman, N.B.; Ley, L.; Bullett, D.W. Valence-Band Structures of Phosphorus Allotropes. Phys. Rev. B 1983, 27, 7440–7450. [Google Scholar] [CrossRef]
Figure 1. The structures of phosphorus allotropes; notably, the structure of a-RP is heavily debated in literature with the above representation of polymeric P4 tetrahedra representing one school of thought.
Sci 07 00128 g001
Figure 3. Powder X-ray diffraction patterns of the phosphorus allotropes. a-RP is from [42] with permission from the publisher. Type II is from [13] with permission from the publisher. Type IV and peaks assignments can be found from [43,44] with the permission from the publisher. Type V and black orthorhombic are from [45] with permission from the publisher.
Sci 07 00128 g003
Figure 4. TEM images of red and black phosphorus with d-spacings [10,13,43,49,50,51]. * These results are for a nanowire morphology of type II synthesized by Winchester et al. [13]. Further discussion on this point in Section 4.
Sci 07 00128 g004aSci 07 00128 g004b
Figure 5. High-resolution TEM images of some phosphorus allotropes [1,13,43,50,51]. * These results are for a nanowire morphology of type II synthesized by Winchester et al. [13]. Further discussion on this point in Section 4.
Sci 07 00128 g005aSci 07 00128 g005b
Table 2. Notable powder XRD peaks at room temperature and assignments.
Phosphorus AllotropesNotable Peak Locations, 2θ (Degree)
a-RP (Type I) [42]15, 34, 56 *
Type II red * [10,13]15.8, 16.5, ~27, 31.6, 34
Type IV red [44]15, 16, 17, 28, 31, 34, 57
Type V red [45]15, 29, 52
Orthorhombic black [45]35, 51, 56
* These results are for a nanowire morphology of type II synthesized by Winchester et al. [13]. Further discussion on this point in Section 4.
Table 3. Single crystal XRD data of phosphorus allotropes.
White Phosphorusa = 7.17 Å for α-WP, a ≈ 7.43 Å, c ≈ 18.9 Å for β-WP, and γ-WP Unknown [47].
Type II redNo single crystal data reported.
Type IV redTriclinic. Cell constants: a = 1219.8 pm, b = 1298.6 pm, c = 707.5 pm; α = 116.99°, β = 106.31°, γ = 97.91°. P-P bond lengths are between 219 pm and 231 pm; the mean length is 221.9 pm [1].
Type V redMonoclinic. Cell constants: a = 9.21 Å, b = 9.15 Å, c = 22.60 Å, β = 106.1°, Z = 84. The average P-P bond length is 2.219 Å [14].
Orthorhombic blacka = 3.31 Å, b = 4.38 Å, c = 10.50 Å. P-P bond length 2.18 Å [9], α = β = γ = 90°.
Rhombohedral blacka = 3.377 Å, c = 8.806 Å, P-P bond length 2.13 Å, α = 57.25° [48]
Simple cubic blacka = 2.377 Å, α = 60° [48].
Table 4. Summary of characterization features for phosphorus allotropes. Those for white phosphorus and black phosphorus at high pressure are not included since they are not major phosphorus allotropes used for electronic or optoelectronic applications.
AllotropeRaman Peaks (cm−1)Powder XRD Peaks (2θ, °)Single CrystalTEM d-Spacings (Å)
Red P—Type I350, 387, 46415, 34, 56No data.Not reported
Red P—Type II350, 398, 417, 46215.8, 16.5, ~27.20 *, 28.4 **, 31.6, 34.1Not reported.18.3 (HR), 5.67, 5.41, 3.05, 2.82, 2.63
Red P—Type IIINot reported15.5, 19.8, 27.3, 28.7, 30.8, 31.0, 34.1Not reported.Not reported
Red P—Type IVSimilar to Type V15, 16, 17, 28, 31, 34, 57Triclinic. Cell constants: a = 1219.8 pm, b = 1298.6 pm, c = 707.5 pm; α = 116.99°, β = 106.31°, γ = 97.91°.3.02, 2.85, 2.64, 2.78, 5.81
Red P—Type V<160, 290–175, 420, 360–400, 430–480.15, 29, 52Monoclinic. Cell constants: a = 9.21 Å, b = 9.15 Å, c = 22.60 Å, β = 106.1°, Z = 84.4.72, 4.46, 2.74, 1.74
Black P—Ortho192–197, 228–230, 362–365, 439–442, 466–47135, 51, 56a = 3.31 Å, b = 4.38 Å, c = 10.50 Å. β = 99°.5.24, 2.62, 2.18
Table 5. Guidelines for characterization of phosphorus allotropes based on sample type and equipment. Note: GIXRD = Grazing Incidence X-ray diffraction.
Sample TypeRecommended TechniqueWhat to Look ForNotes
Bulk crystalline samplePowder XRD or Single-Crystal XRDPhase identification via 2θ peaks or cell parametersUse XRD for types II, IV, V, and Black P (orthorhombic)
Thin filmRaman + GIXRDRaman fingerprints, weak XRD peaksUseful for a-RP; Raman shows broad features
Nanowires or nanoribbonsTEM/HRTEM + RamanLattice spacings, morphology, vibrational modesHRTEM can show lattice periodicity for Types II, IV, V
Amorphous powdersRaman + PXRDBroad PXRD humps, Raman cluster features (P8/P9)Look for similarity to types II/V in Raman
Exfoliated monolayersRaman + STEMRaman peak positions (strain sensitive), sheet morphologyUse polarized Raman if available
Table 6. Common Pitfalls and Ambiguities in Characterizing Phosphorus Allotropes (and How to Avoid Them).
Pitfall/AmbiguityCauseTips to Resolve/Distinguish
Confusing a-RP with type II or VBroad Raman peaks can overlap; amorphous character masks structureCompare Raman to known P8/P9 modes (430–480 cm−1); supplement with XRD for crystalline content
Overlapping Raman bands among red P polymorphsSimilar backbone structures (e.g., P9 cages in type IV and V)Use both Raman and XRD together; look for characteristic peak broadness in type I, and sharper peaks in V
Assigning mixed-phase samples as pureSamples (especially red P) may contain coexisting allotropesTEM or XRD may reveal multiple lattice spacings or 2θ peaks; always report the possibility of mixed-phase presence
Low crystallinity leads to weak/absent XRD peaksAmorphous or poorly ordered samples (e.g., a-RP)Use Raman as primary tool; avoid over-interpreting noisy XRD patterns
Contamination from substrate (e.g., BuP on Au)Elemental intercalation distorts crystal structureVerify purity via EDX or intercalation control (e.g., use silicon buffer layers)
Assuming blue phosphorus has the same features as blackStructural changes dramatically alter Raman/XRD signaturesCross-check against theoretical predictions; expect distinct Raman and regular hexagonal features
Misinterpretation of TEM d-spacing due to orientation effectsTEM lattice spacing depends on imaging axisConfirm zone axis orientation or use FFT patterns; pair with HRTEM
Table 7. Characterization methods not covered in the minireview due to their limitations.
TechniqueMain StrengthWhy It Is Omitted HereWhen It May Become Essential
FTIR/ATR-IRSensitive to P–H, P–O, and surface-oxidized speciesOverlaps heavily with Raman for bulk modes; most allotropes are IR-silent in the mid-IROxidation studies of BP devices; probing functionalized phosphorene
X-ray Photoelectron Spectroscopy (XPS)Quantifies oxidation states and surface chemistrySurface-sensitive only; does not resolve long-range crystal orderTracking ambient degradation of thin BP; validating P-elemental doping
Scanning Tunnelling Microscopy (STM)/AFMReal-space atomic imaging; topographyRequires ultra-clean, atomically flat surfaces rarely available for red-P polymorphsBand-edge mapping of exfoliated monolayer BP or BuP
Neutron or Electron Diffraction (ED)High sensitivity to light atoms; dynamic in-situ studiesLimited beam-time access; phosphorus is a strong neutron absorber; ED often duplicates TEM SAEDPhase transitions under rapid heating or electrochemical cycling
EELS/EXAFS/XANESBond-specific, oxidation-state-sensitiveRequires synchrotron/electron microscope add-ons and complex modellingTracking local coordination in a-RP and black-to-blue reconstructions
Magnetic, Optical Pump–Probe, THz, etc.Electronic/phonon dynamicsBeyond structural scope of this reviewDevice-level performance optimization
Disclaimer/Publisher’s Note: The statements, opinions and data contained in all publications are solely those of the individual author(s) and contributor(s) and not of MDPI and/or the editor(s). MDPI and/or the editor(s) disclaim responsibility for any injury to people or property resulting from any ideas, methods, instructions or products referred to in the content.