Article

Near-Field Pressure Signature of New-Concept Supersonic Aircraft Obtained Using Open-Source Approach

by
Antimo Glorioso
1,*,
Francesco Petrosino
2,
Mattia Barbarino
2,* and
Giuseppe Pezzella
1
1
Engineering Department, Università degli Studi della Campania “Luigi Vanvitelli”, 81031 Aversa, Italy
2
Italian Aerospace Research Center (CIRA), 81043 Capua, Italy
*
Authors to whom correspondence should be addressed.
Sci 2025, 7(3), 127; https://doi.org/10.3390/sci7030127
Submission received: 20 June 2025 / Revised: 9 August 2025 / Accepted: 4 September 2025 / Published: 9 September 2025
(This article belongs to the Section Computer Sciences, Mathematics and AI)

Abstract

This study investigates the numerical prediction of the sonic boom phenomenon in supersonic aircraft by evaluating the near-field pressure signatures of three different aeroshapes. Two computational fluid dynamics (CFD) solvers, the open-source SU2 Multiphysics code and ANSYS Fluent, were employed to assess their effectiveness in modeling the aerodynamic flow field. A preliminary validation of numerical methods was conducted against numerical data available from the Sonic Boom Prediction Workshops (SBPW) organized by NASA, ensuring simulation reliability. Particular attention is paid to the topology of the mesh grid, exploring hybrid approaches that combine structured and unstructured grids to optimize the accuracy of pressure wave transmission. In addition, different numerical schemes were analyzed to determine the best practices for sonic boom simulations. The proposed methodology was finally applied to three supersonic aircraft developed within the European project MORE&LESS, demonstrating the capability of the model to estimate shock wave generation, evaluate the aeroacoustic performance of different supersonic aeroshapes from Mach 2 to Mach 5, and provide predictions to support ground-level noise assessment. The findings of this study contribute to the definition of a comprehensive workflow for sonic boom evaluation, providing a reliable methodology for exploring future supersonic aircraft designs.

1. Introduction

A sonic boom is a high-amplitude impulsive sound wave generated by shock waves produced by a supersonic aircraft. As an aircraft moves through the atmosphere, it creates pressure disturbances that propagate outward in all directions along the three-dimensional characteristic planes of the supersonic flow. A portion of these downward-directed disturbances travels through the atmosphere and eventually reaches the ground, where they are perceived as a sonic boom (see Figure 1). The propagation and transformation of these pressure perturbations are influenced by various nonlinear and dissipative effects, such as shock coalescence and molecular relaxation events, which shape the temporal signal structure.
During the past two decades, there has been renewed interest in the development of a new generation of environmentally sustainable supersonic aircraft [1]. Although technological advancements have led to various conceptual designs, their operation is hindered by regulatory restrictions on supersonic flight over land, such as FAA regulations, imposed due to sonic boom concerns. Research efforts aim to establish acceptable noise thresholds and develop mitigation strategies to meet future regulatory standards.
The prediction and simulation of sonic booms pose a significant challenge due to the complex physical phenomena involved at different scales. Since the 1960s, numerous experimental investigations, including flight campaigns, wind tunnel tests, and numerical analyses, have contributed to the development of knowledge concerning the phenomenon of sonic booms. The first Sonic Boom Symposium, held in 1965 and sponsored by the Acoustical Society of America (ASA), recognized the complexity of this phenomenon. Subsequent research efforts have continued through dedicated symposiums [2,3] and NASA-sponsored workshops [4,5,6,7], addressing topics such as sonic boom generation, atmospheric propagation, noise prediction, and mitigation strategies. Significant efforts have been put into conducting further research in this field, and are discussed at the annual NASA Sonic Boom Workshops [8,9,10,11].
The ability to accurately model pressure disturbances is essential for estimating the sonic boom. The aerodynamic flow in the near-field region around the aircraft, where these disturbances originate, is governed by the nonlinear Euler equations and exhibits three-dimensional flow characteristics on scales proportional to the aircraft’s dimensions. Computational fluid dynamics (CFD) techniques play a crucial role in forecasting these aerodynamic disturbances.
High-quality computational meshes are required to capture the intricate flow physics and ensure accurate predictions of near-field pressure perturbations. Various approaches have been explored, including hybrid meshing techniques that employ unstructured grids near the aircraft and structured grids for far-field propagation [12,13,14].
In 2014, NASA initiated the Sonic Boom Prediction Workshop [15] series to evaluate and improve numerical methodologies for sonic boom prediction. These workshops focused on near-field pressure signature calculations using CFD approaches, and participants employed various computational tools to benchmark their predictions against experimental data. Studies from these workshops provide valuable insights into the best practices for sonic boom simulation, particularly in grid generation and numerical scheme selection [16,17,18].
The computational domain typically extends to two to five times the aircraft body length to account for the propagation of pressure waves. Mesh discretization, refinement strategies, and numerical schemes significantly impact the accuracy of sonic boom simulations [19]. A proper grid resolution ensures that discontinuities are well tracked while avoiding numerical filtering effects that could alter the frequency content of the pressure disturbance [20,21].
This study focuses on the numerical simulation of sonic boom pressure signatures in the near field using CFD techniques. Two solvers, the open-source SU2 Multiphysics Simulation and Design Software “Blackbird” 7.2.1 [22] and the commercial ANSYS Fluent 2021-R1 code [23], were employed to analyze different aerodynamic configurations. The study began with a validation phase using benchmark test cases from the Sonic Boom Prediction Workshops to establish the best practices for the grid topology and numerical schemes. Subsequently, the selected methodology was applied to simulate the pressure signature of three supersonic aircraft developed within the European MORE&LESS project (MDO and Regulations for Low-Boom and Environmentally Sustainable Supersonic Aviation) [24]. By refining the numerical approach, this research contributes to the broader goal of accurate sonic boom prediction and supports the development of next-generation supersonic aircraft.

2. Numerical Approach: Development and Validation

2.1. Numerical Setup

CFD simulations in the near field were performed using two different solvers: the commercial ANSYS Fluent and the open-source SU2. Both utilize an unstructured finite-volume method to solve the Reynolds-Averaged Navier–Stokes (RANS) equations on structured, unstructured, and hybrid grids. For gradient computation, both codes implement different reconstruction techniques, and a Green–Gauss reconstruction technique was used in the simulations.
Fluent simulations employ an adaptive strategy for the Courant–Friedrichs–Lewy (CFL) number to accelerate convergence; in contrast, SU2 simulations are performed using a fixed CFL value of 1 to mitigate the numerical oscillations associated with central differencing schemes when using CFL relaxation.
All simulations were conducted assuming a steady and inviscid flow to reduce the influence of turbulence modeling and simplify the analysis. Moreover, the Euler equations were solved using the ideal gas assumption for air.
Several numerical discretization schemes were evaluated to determine the most appropriate scheme for simulating the sonic boom phenomena. These schemes control the transformation of the governing equations from a continuous form to a discrete representation suitable for numerical computation.
In Fluent, a second-order upwind Roe scheme with flux-difference splitting (FDS) [25] is available. The Roe method works as an approximate Riemann solver and evaluates the intercell flux, also known as the Godunov flux, by estimating characteristic speeds and wave strengths. The FDS version enhances this by splitting fluxes based on eigenvalue structures, allowing for accurate resolution of discontinuities such as shock waves.
SU2, on the other hand, offers a wider selection of numerical schemes. In this work, four are used: the JST (Jameson–Schmidt–Turkel) central scheme [26], the HLLC (Harten–Lax–van Leer–Contact) scheme [27], the ROE scheme [28], and the AUSM (Advection Upstream Splitting Method) scheme [29].
The JST method, though central in nature, includes numerical dissipation tailored to suppress high-frequency instabilities and allows acceptable shock capture, making it suitable for sonic boom simulations, as previously demonstrated in SU2 applications [30].
The HLLC scheme extends the basic HLL solver by incorporating additional estimates to recover contact and shear waves, enabling the method to handle transverse velocity discontinuities more precisely. This is especially useful in conditions where directional diffusion must be minimized.
Finally, the AUSM is an upwind-based approach that separates flux calculations into convective and pressure components. This distinction improves the performance in compressible flow simulations with shocks by more accurately handling both advective and acoustic wave propagation.

2.2. Test Cases

To assess the effectiveness of the proposed CFD approach in predicting the near-field pressure signature, several validation cases were considered. These cases are based on the configurations and conditions outlined in the Sonic Boom Prediction Workshop (SBPW), which offers a reference framework to compare different numerical solvers and methods.
Among the various configurations, the AXIE test case was selected for its geometric simplicity combined with a challenging shock structure. The geometry is defined by an axisymmetric fuselage model with a canonical shape that has been widely used in previous studies on sonic booms. The geometry setup and corresponding conditions aim to replicate realistic supersonic cruise scenarios in which the sonic boom must be accurately predicted.
The simulations were conducted under freestream conditions specified by the SBPW. The freestream Mach number was set to 1.6, and the flight altitude was set to 15,760 m. These values are consistent with the benchmark scenarios proposed by the SBPW and are summarized in Table 1. Additional reference parameters and complete configuration details are publicly available on the workshop website [31].
To facilitate the validation of the numerical methodology and because the angle of attack is zero degrees, both 2D axisymmetric and 3D configurations of the AXIE geometry were considered. In the 2D case, an axisymmetric simplification of the full 3D body was used, and geometric symmetries were exploited to reduce the computational costs. In contrast, the 3D setup accounts for the complete spatial variation in the geometry and flow field.
The second geometry used to validate the strategy is the JWB, which is a complication of the AXIE because the JWB has wings; however, it is interesting because of the same pressure signature as the C25D at three body lengths distant from the body, as well as the AXIE geometry. To design the JWB, JAXA [32] adopted a procedure similar to that of the AXIE geometry, with Euler and panel methods.
In Figure 2, the three geometries provided in the second SBPW are shown.

2.3. Validation Data

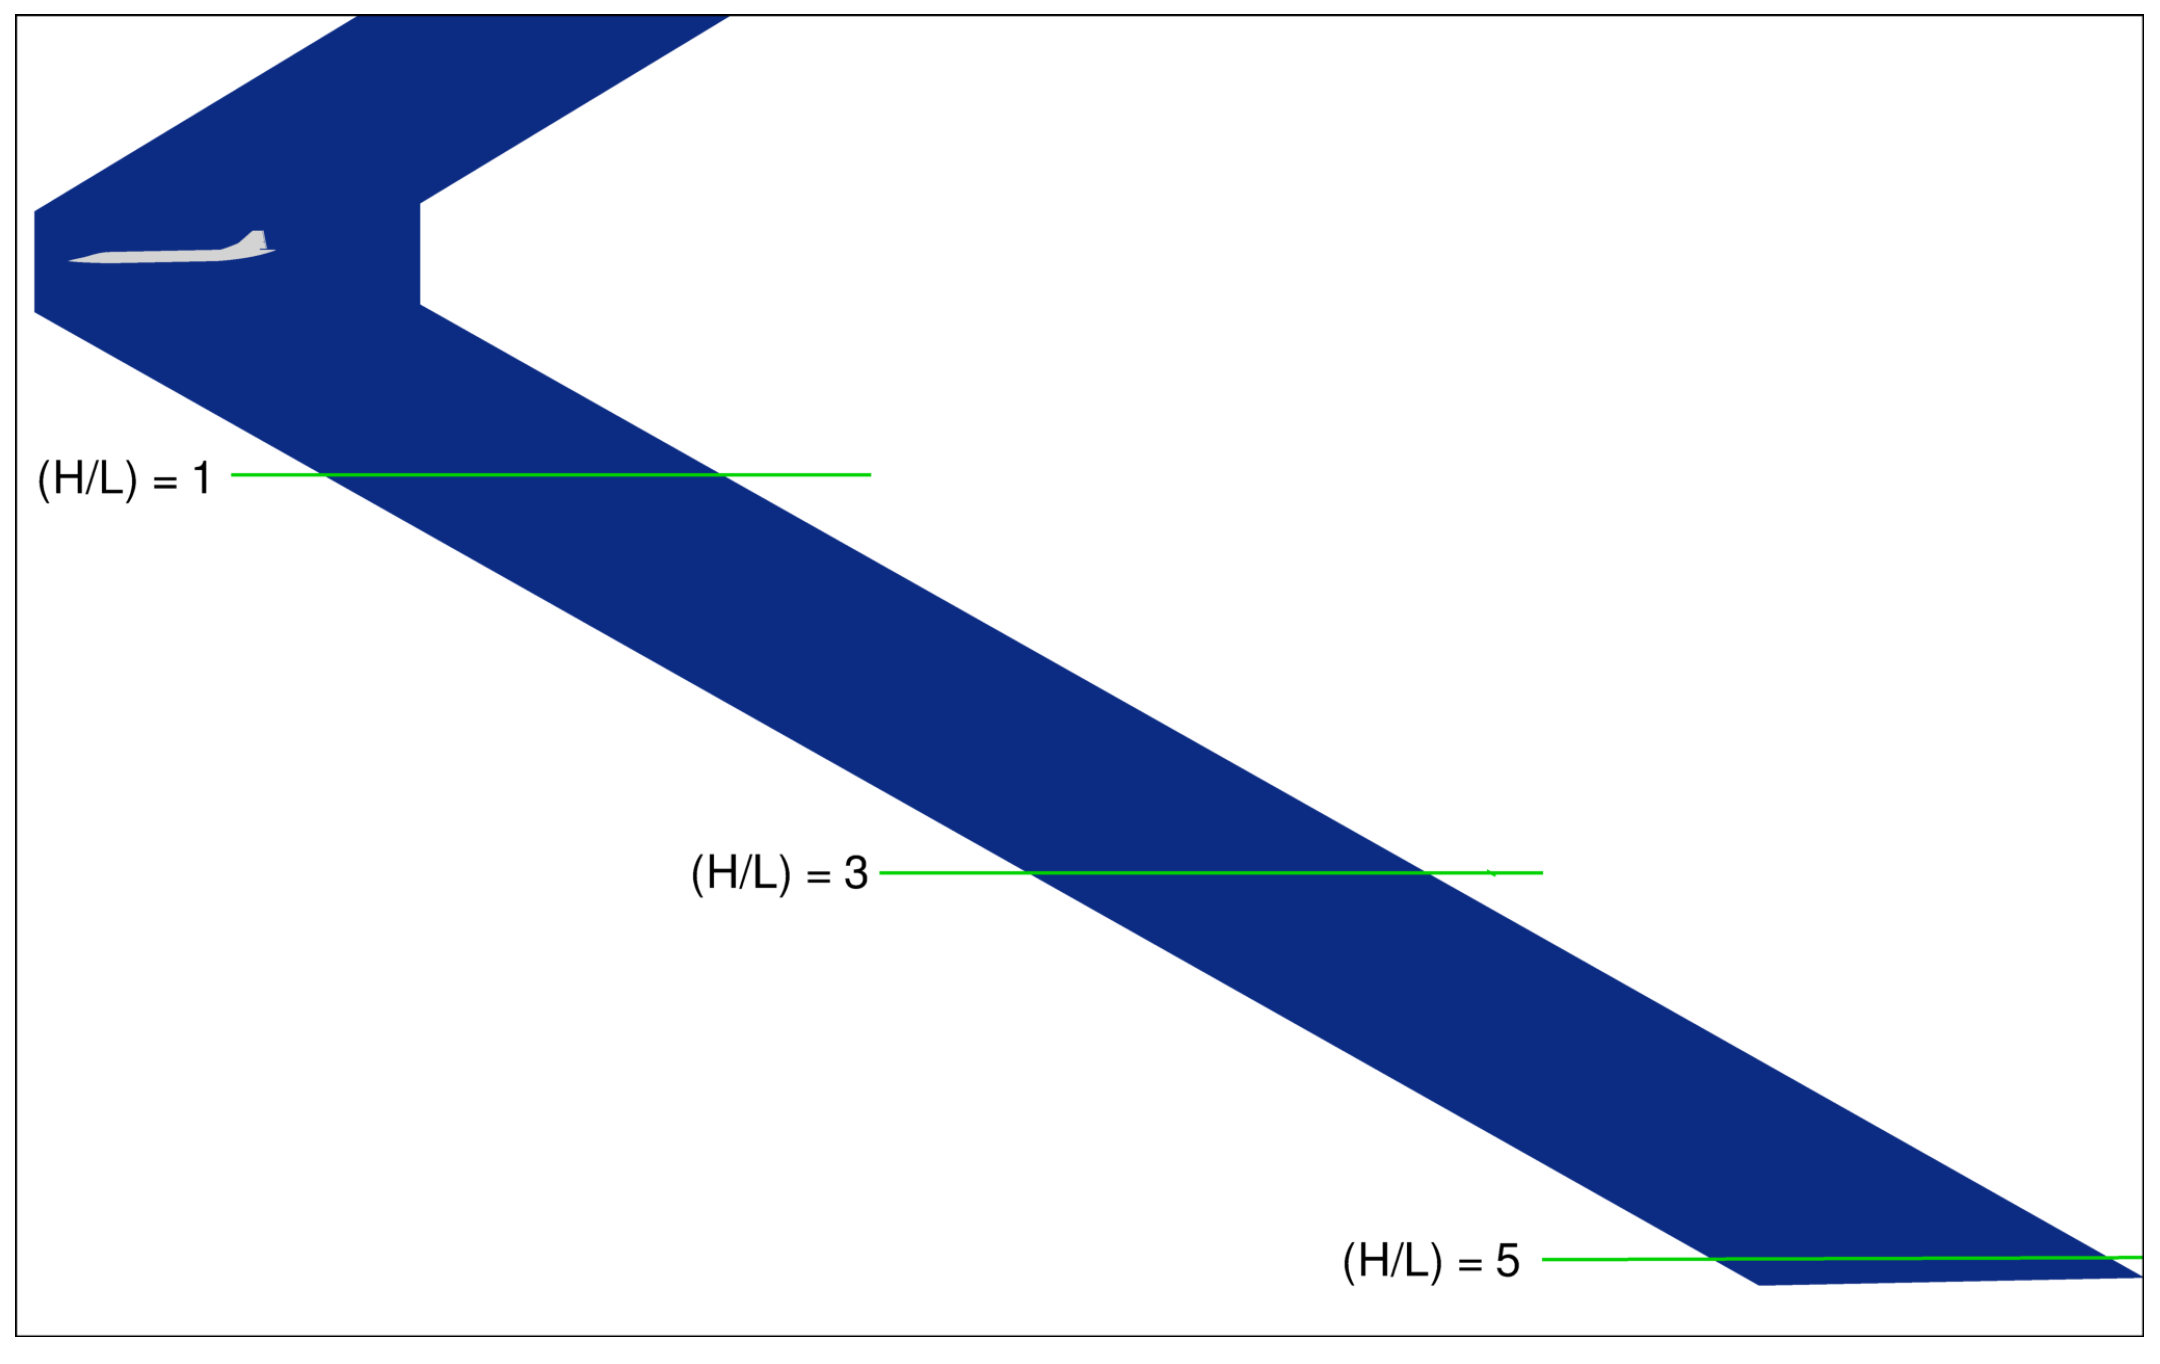
The pressure signatures used for validation were provided directly by the SBPW. These signatures were extracted at different locations far from the body, corresponding to distances of one, three, and five times the body length, as shown in Figure 3 ( H / L = 1 , 3, and 5). The extraction lines are positioned on a horizontal plane for the 2D simulations and on a vertical slice intersecting the fuselage in the 3D cases.
Among these reference values, the pressure profile extracted at a distance of three times the length of the body (H/L = 3) was considered the most representative and was therefore used as a reference for validation. Two main sources of reference data were used: the dataset provided in the SBPW and the numerical results reported by the ANSYS team in [33]. The datasets are plotted and compared in Figure 4. Although there are small discrepancies in the curves, a good match is visible, especially in the peak regions, and both datasets show identical peak positions and amplitudes.
In the present study, the pressure signature of [33] was selected as the reference curve due to its smoother nature, which facilitates a more reliable comparison with the calculated pressure variations. Despite the geometric simplification of the AXIE model, the resulting pressure signature remains complex and representative of realistic supersonic scenarios, making it suitable for validating numerical approaches aimed at sonic boom prediction.
The pressure signature in aeroacoustic problems is typically evaluated using the following formulation:
d p / p = p s p 0 p 0
In Equation (1), the variable p 0 is the freestream static pressure, while p s is the variation in the pressure extracted in a specific location H L , where H is the vertical distance from the aircraft and L is the length of the vehicle.

2.4. AXIE Geometry

2.4.1. AXIE 2D Test Case

The AXIE test case presents a challenge for sonic boom prediction, even when using simplified assumptions. As illustrated in Figure 2, the AXIE model features a 3D axisymmetric fuselage-like shape. For the 2D simulation at an angle of attack α = 0 ° , an axisymmetric configuration was obtained by constructing a two-dimensional domain derived from the 3D geometry and applying boundary conditions to simulate axisymmetric flow.
Figure 5 shows an example of the structured mesh used in this study. Two grid refinements were designed: the coarser one has approximately 34k nodes, and the finer one has approximately 122k nodes. The latter allows for a better resolution of the flow field in the shock wave regions.
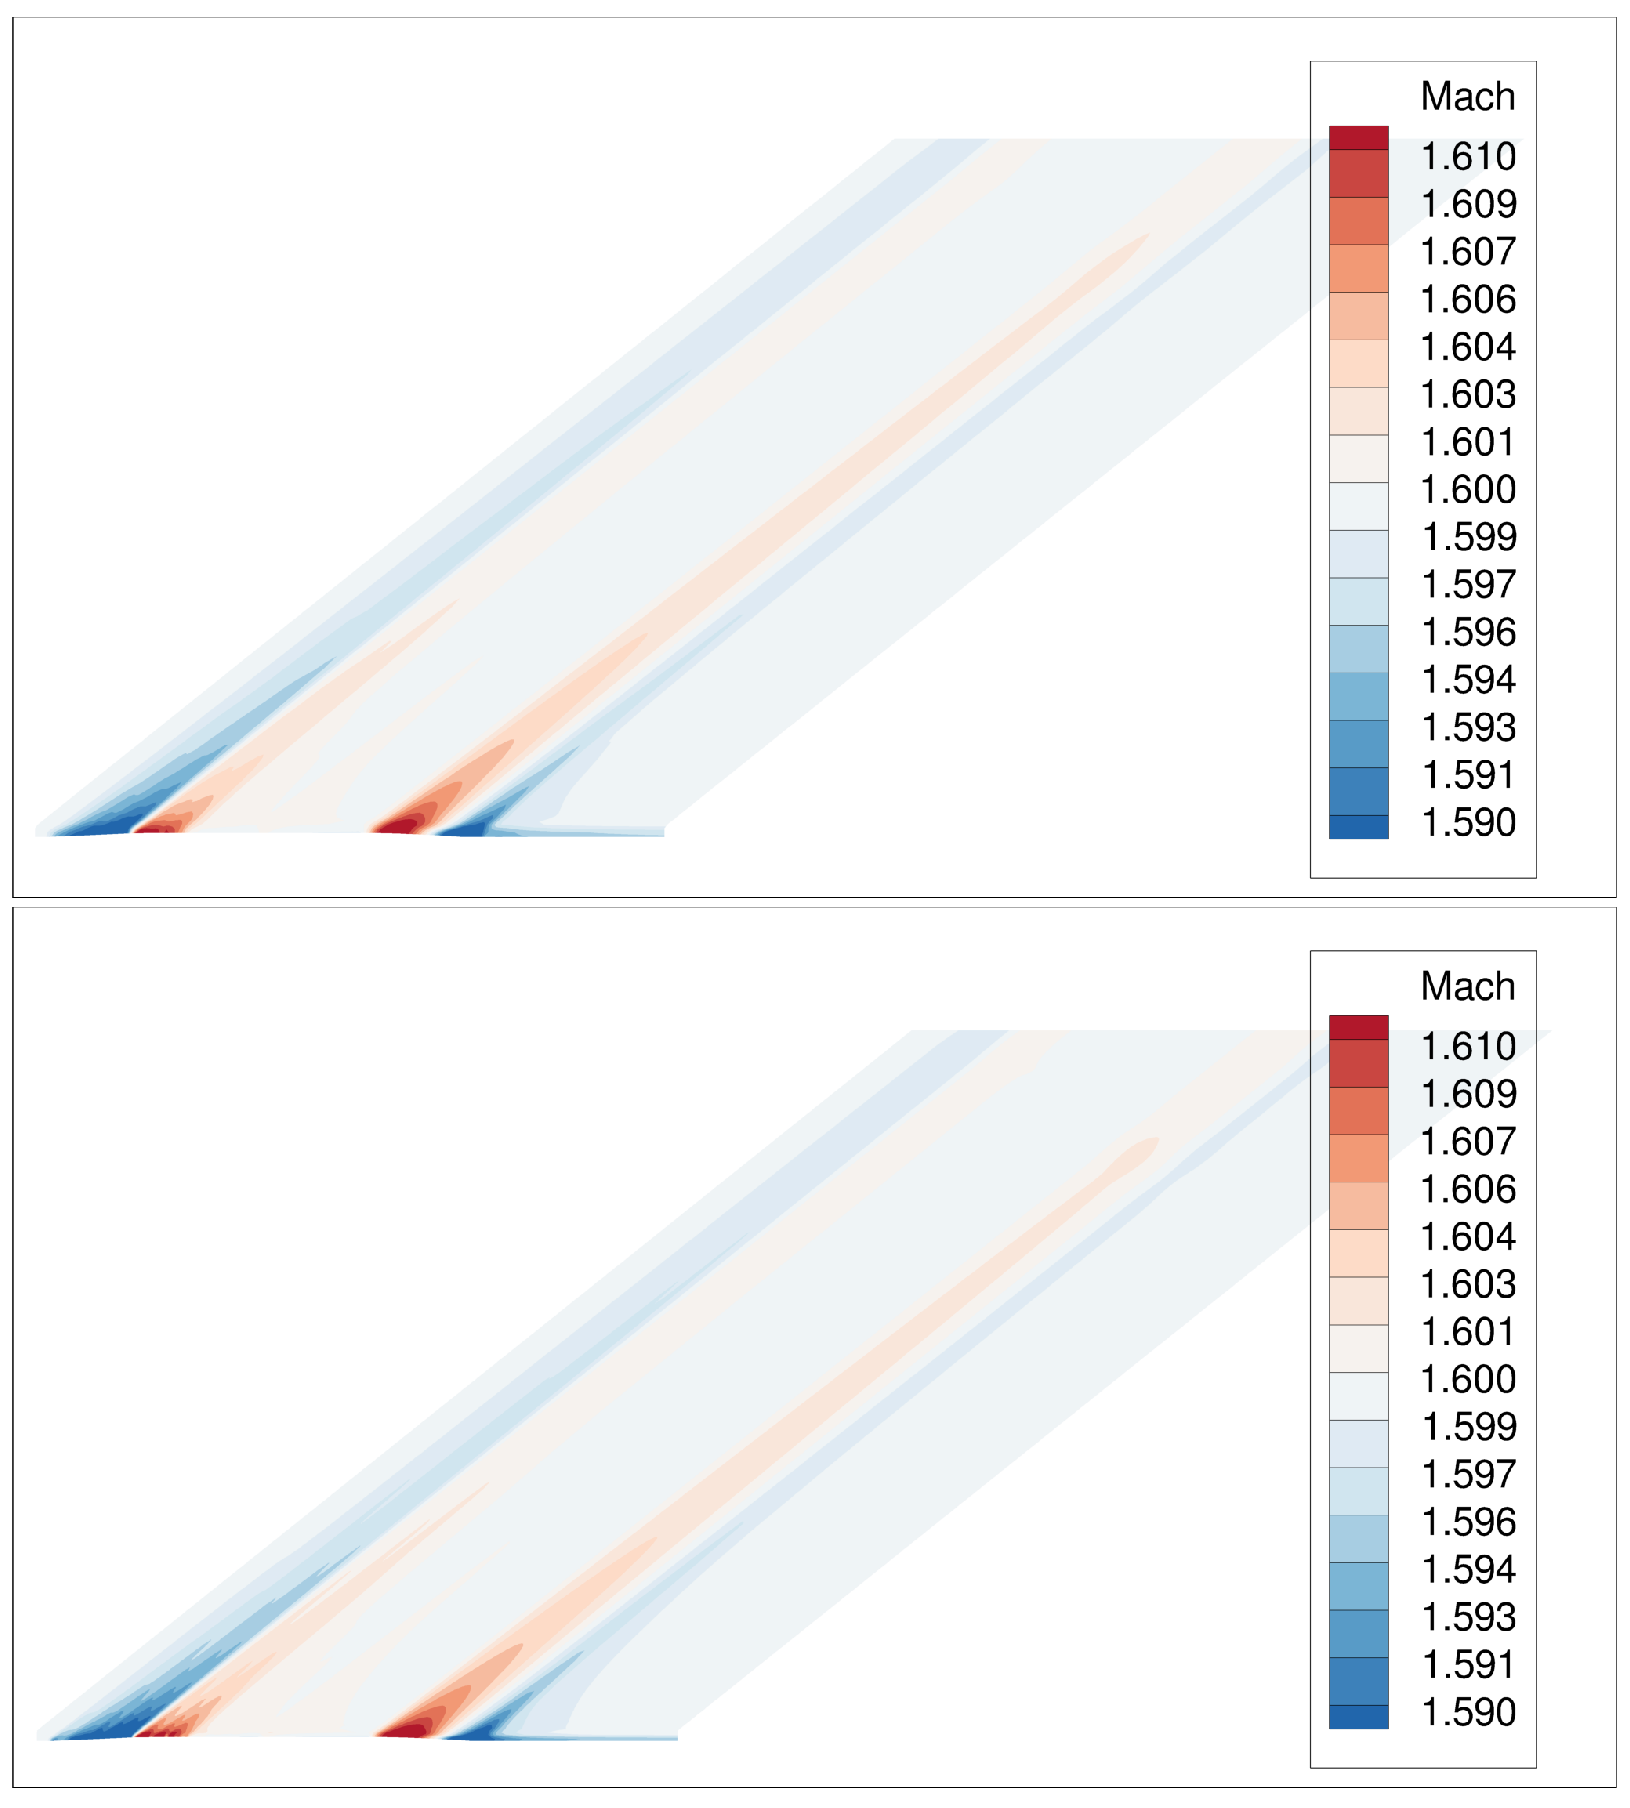
The corresponding Mach number fields computed using ANSYS Fluent are reported in Figure 6. The effect of grid refinement on the shock resolution is visible; a finer grid yielded a slightly more detailed and extended velocity field.
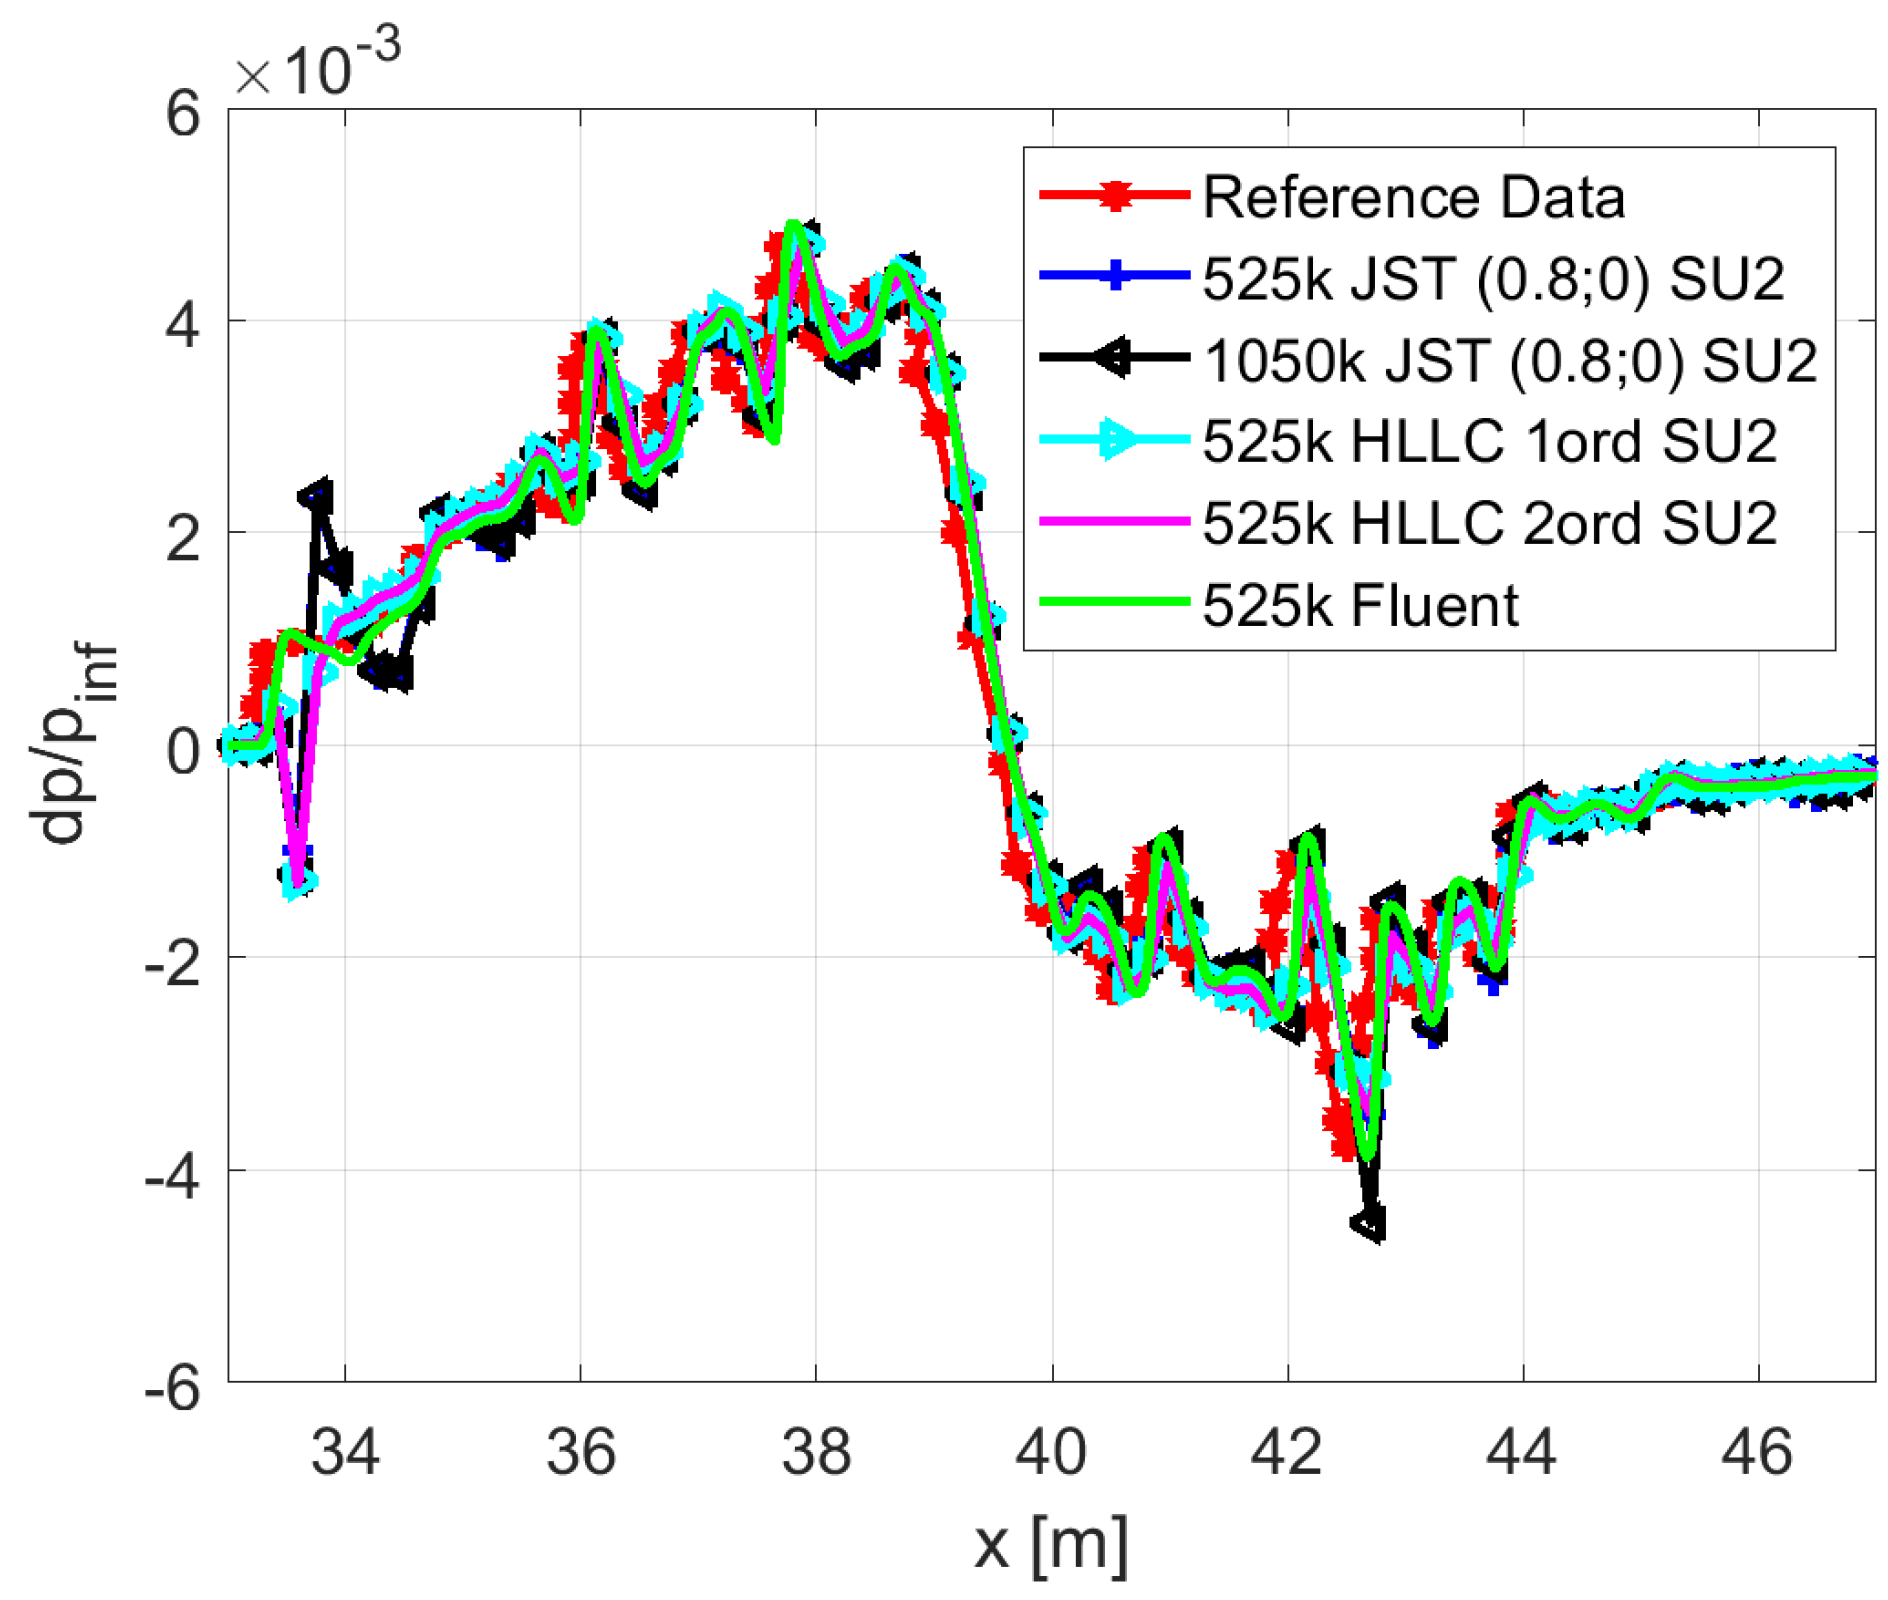
The pressure signature extraction was performed along the lines described previously. Figure 7 compares the best Fluent result with the SU2 prediction and the reference data, particularly the results of the 525k and 1.05M nodes. As the grid resolution increased, the shock structures were captured more accurately, as can be observed in the improved agreement of the 1.05M case with the reference curve.
The best Fluent and SU2 results on the intermediate 525K grid are shown in Figure 8, demonstrating excellent consistency. Due to the structured grid, discrepancies between the solvers were minimized, confirming the benefit of 2D high-resolution meshes for accurate sonic boom evaluation.

2.4.2. AXIE 3D Test Case

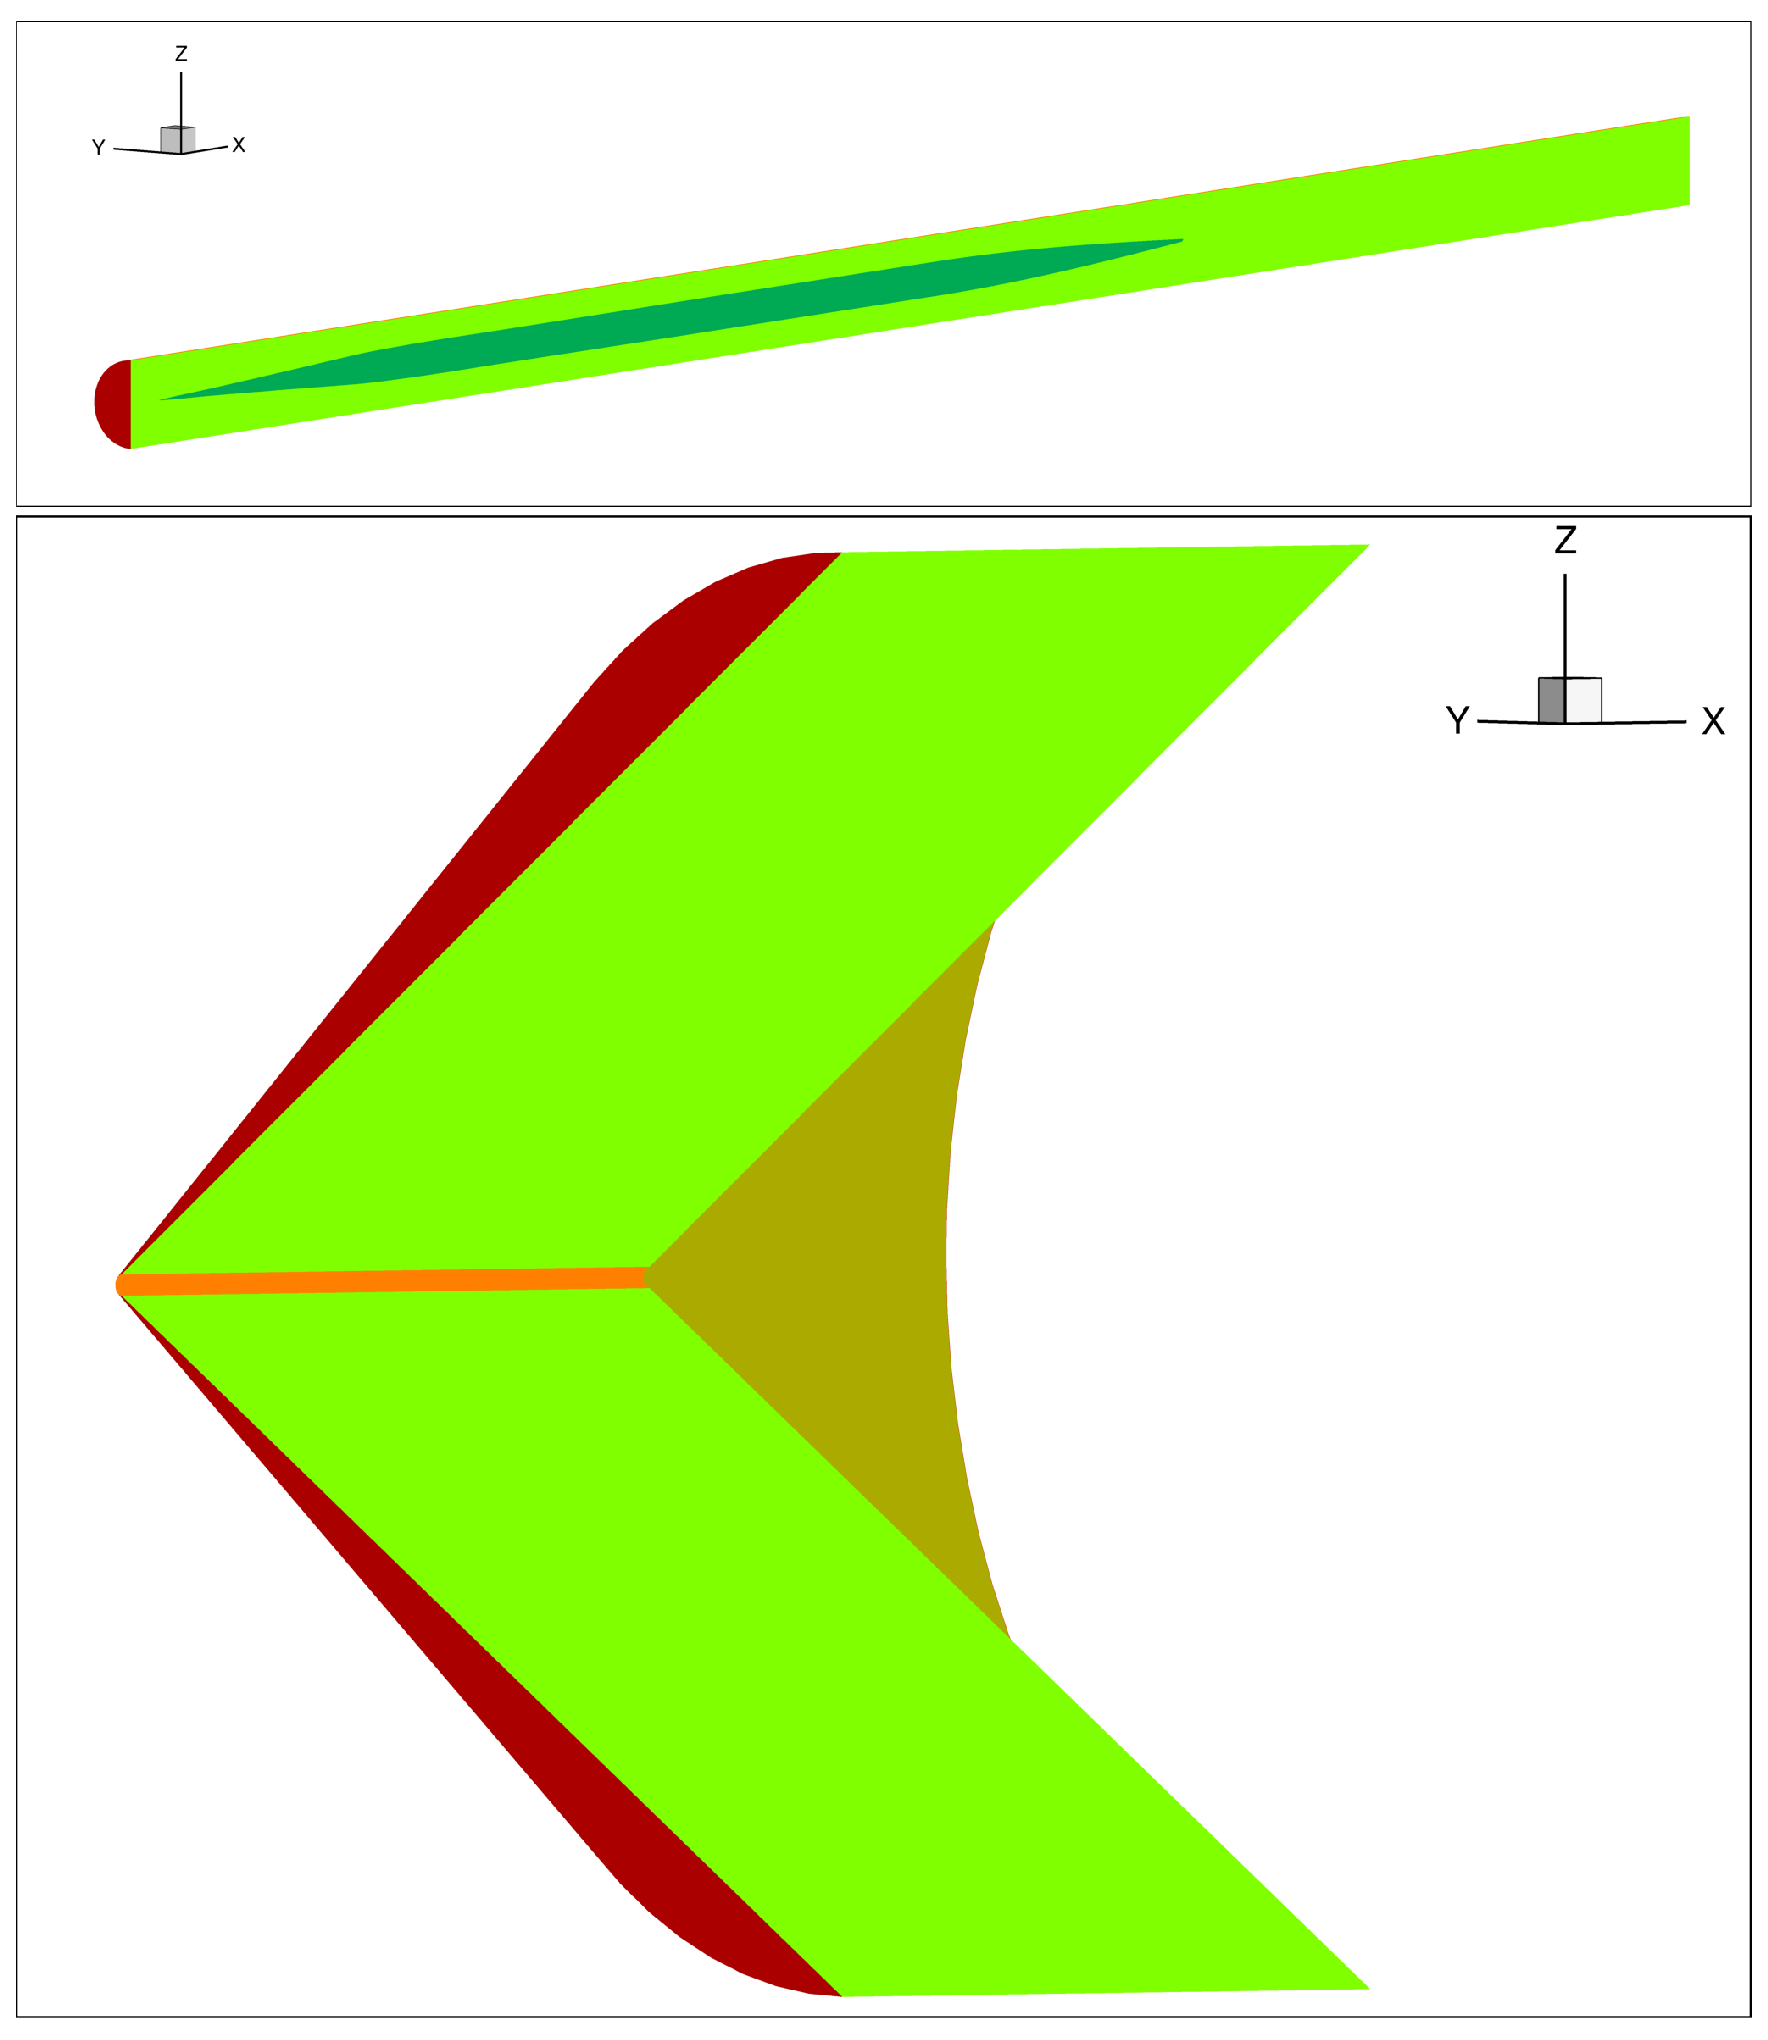
To further assess the methodology, the full 3D configuration of the AXIE model was simulated. Unstructured meshes were created using ANSYS ICEM CFD. An example of a 3D domain is shown in Figure 9, where the domain is a cone. Two levels of refinement were used: a coarse mesh with approximately 10.8 million cells and a finer mesh with 14.9 million cells.
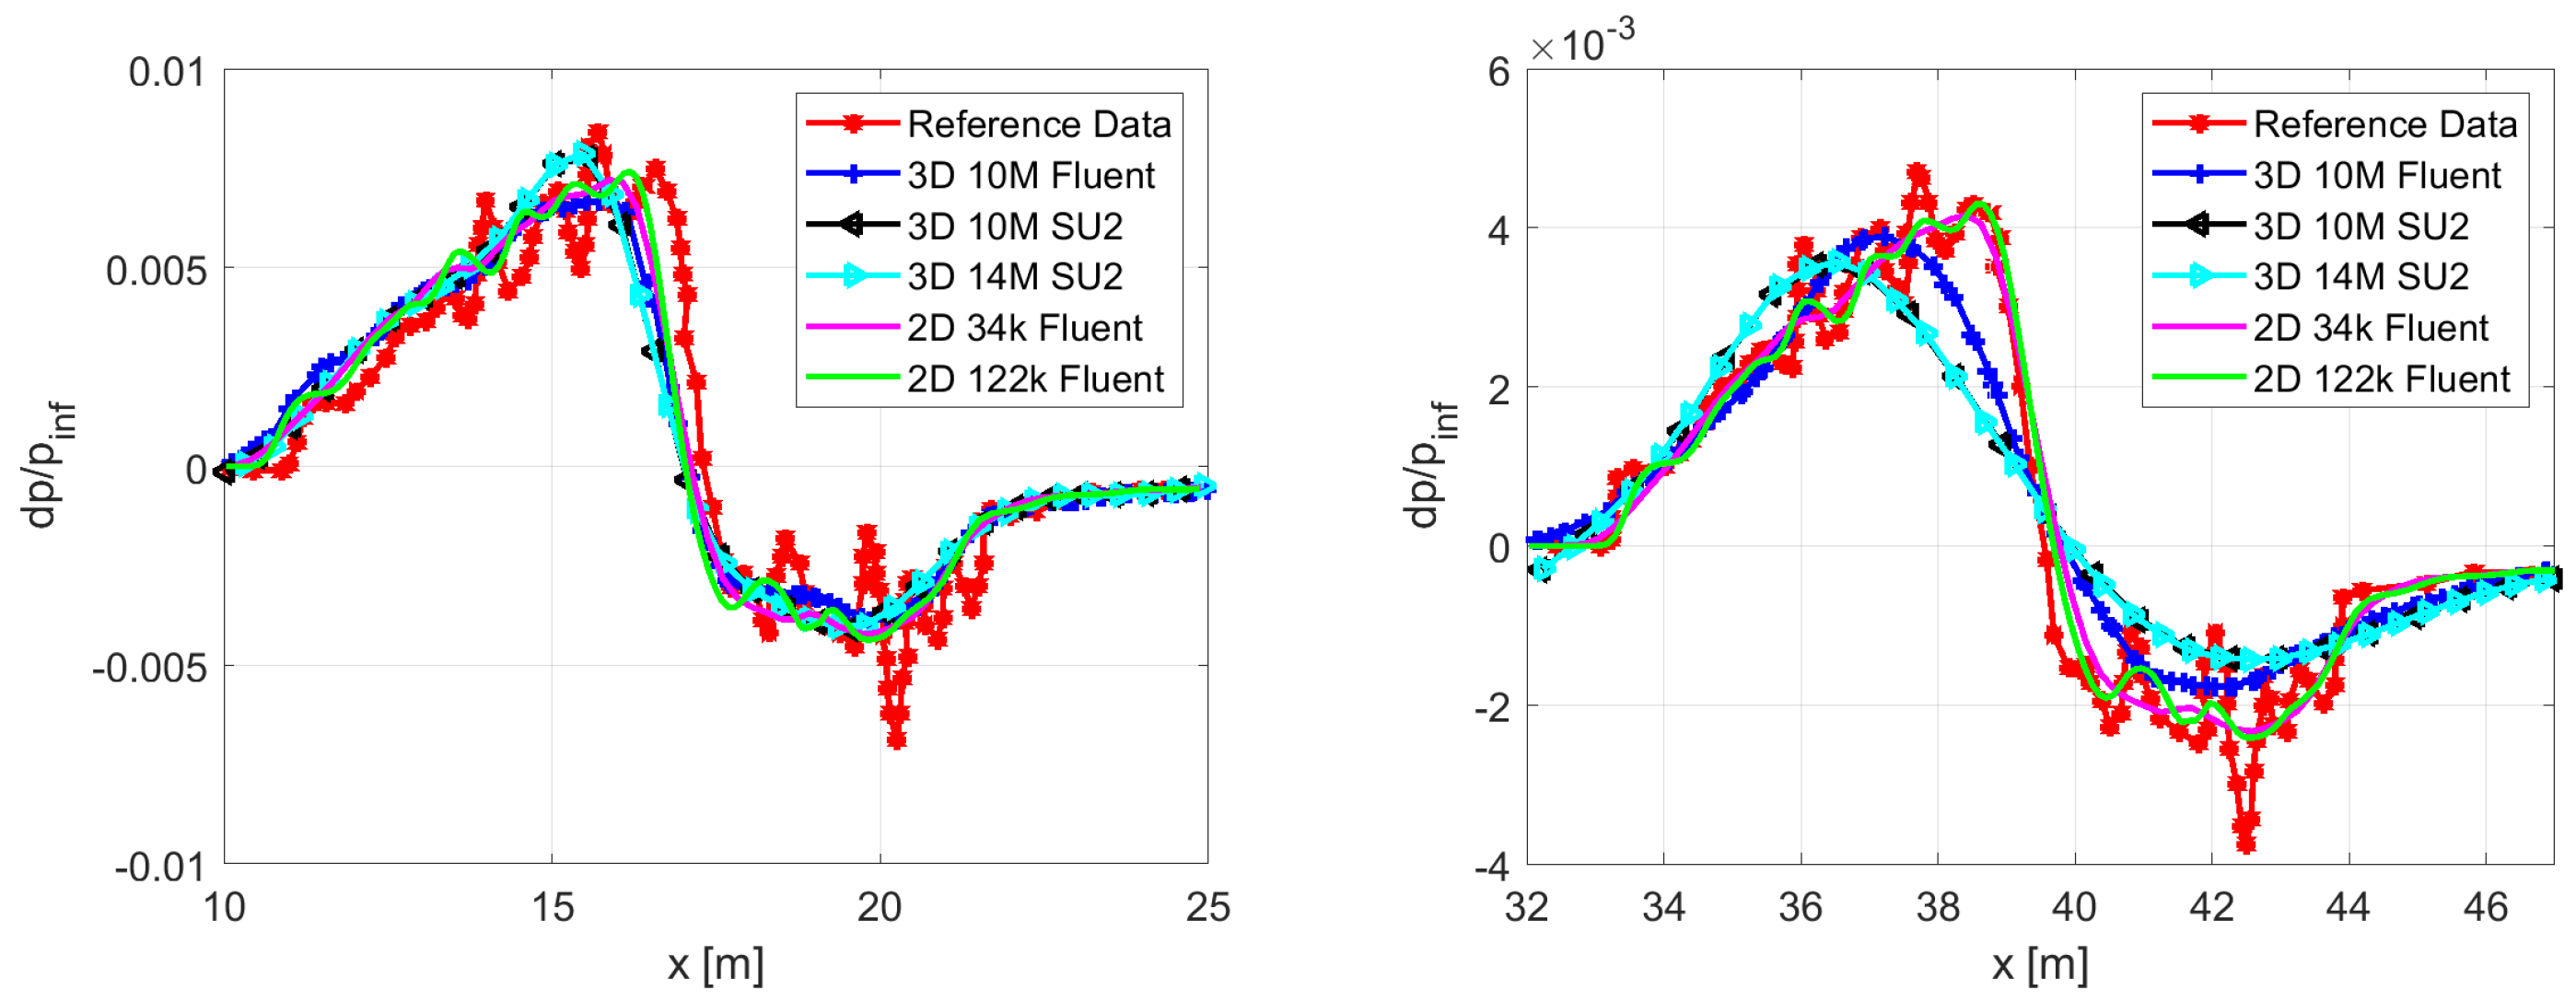
The Mach number contours of the Fluent and SU2 solvers are shown in Figure 10. Compared to the 2D results, the shock resolution was clearly degraded in the 3D simulations, particularly between the coarse and fine grids and the Fluent and SU2 solvers. This may be attributed to the refinement strategy; 3D refinement boxes are introduced based on 2D shock locations, but they fail to preserve axial symmetry.
Figure 11 compares the results of the 3D and 2D pressure signature at ( H L ) 1 and ( H L ) 3 . Although the 2D simulations closely reproduced the reference data, the 3D predictions, even in the finer mesh, diverged considerably at three body lengths, ( H L ) 3 . Between the two solvers, SU2 yielded slightly lower peak amplitudes but followed the trend better.

2.4.3. AXIE 3D Hybrid Grid

Some limitations of the unstructured 3D mesh strategy were observed; therefore, a hybrid strategy was introduced to overcome these limitations. Structured grids offer high accuracy but are complicated and hard-working for complex geometries, whereas unstructured meshes are more flexible but tend to yield worse results. The hybrid approach merges the strengths of both by combining a structured mesh in the outer domain, which is simpler to mesh, with an unstructured mesh near the geometry, which is more complicated to mesh.
The hybrid mesh consisted of two main components: a structured grid covering the far field and an unstructured half-cylinder region surrounding the AXIE body. Figure 9 illustrates the mesh composition.
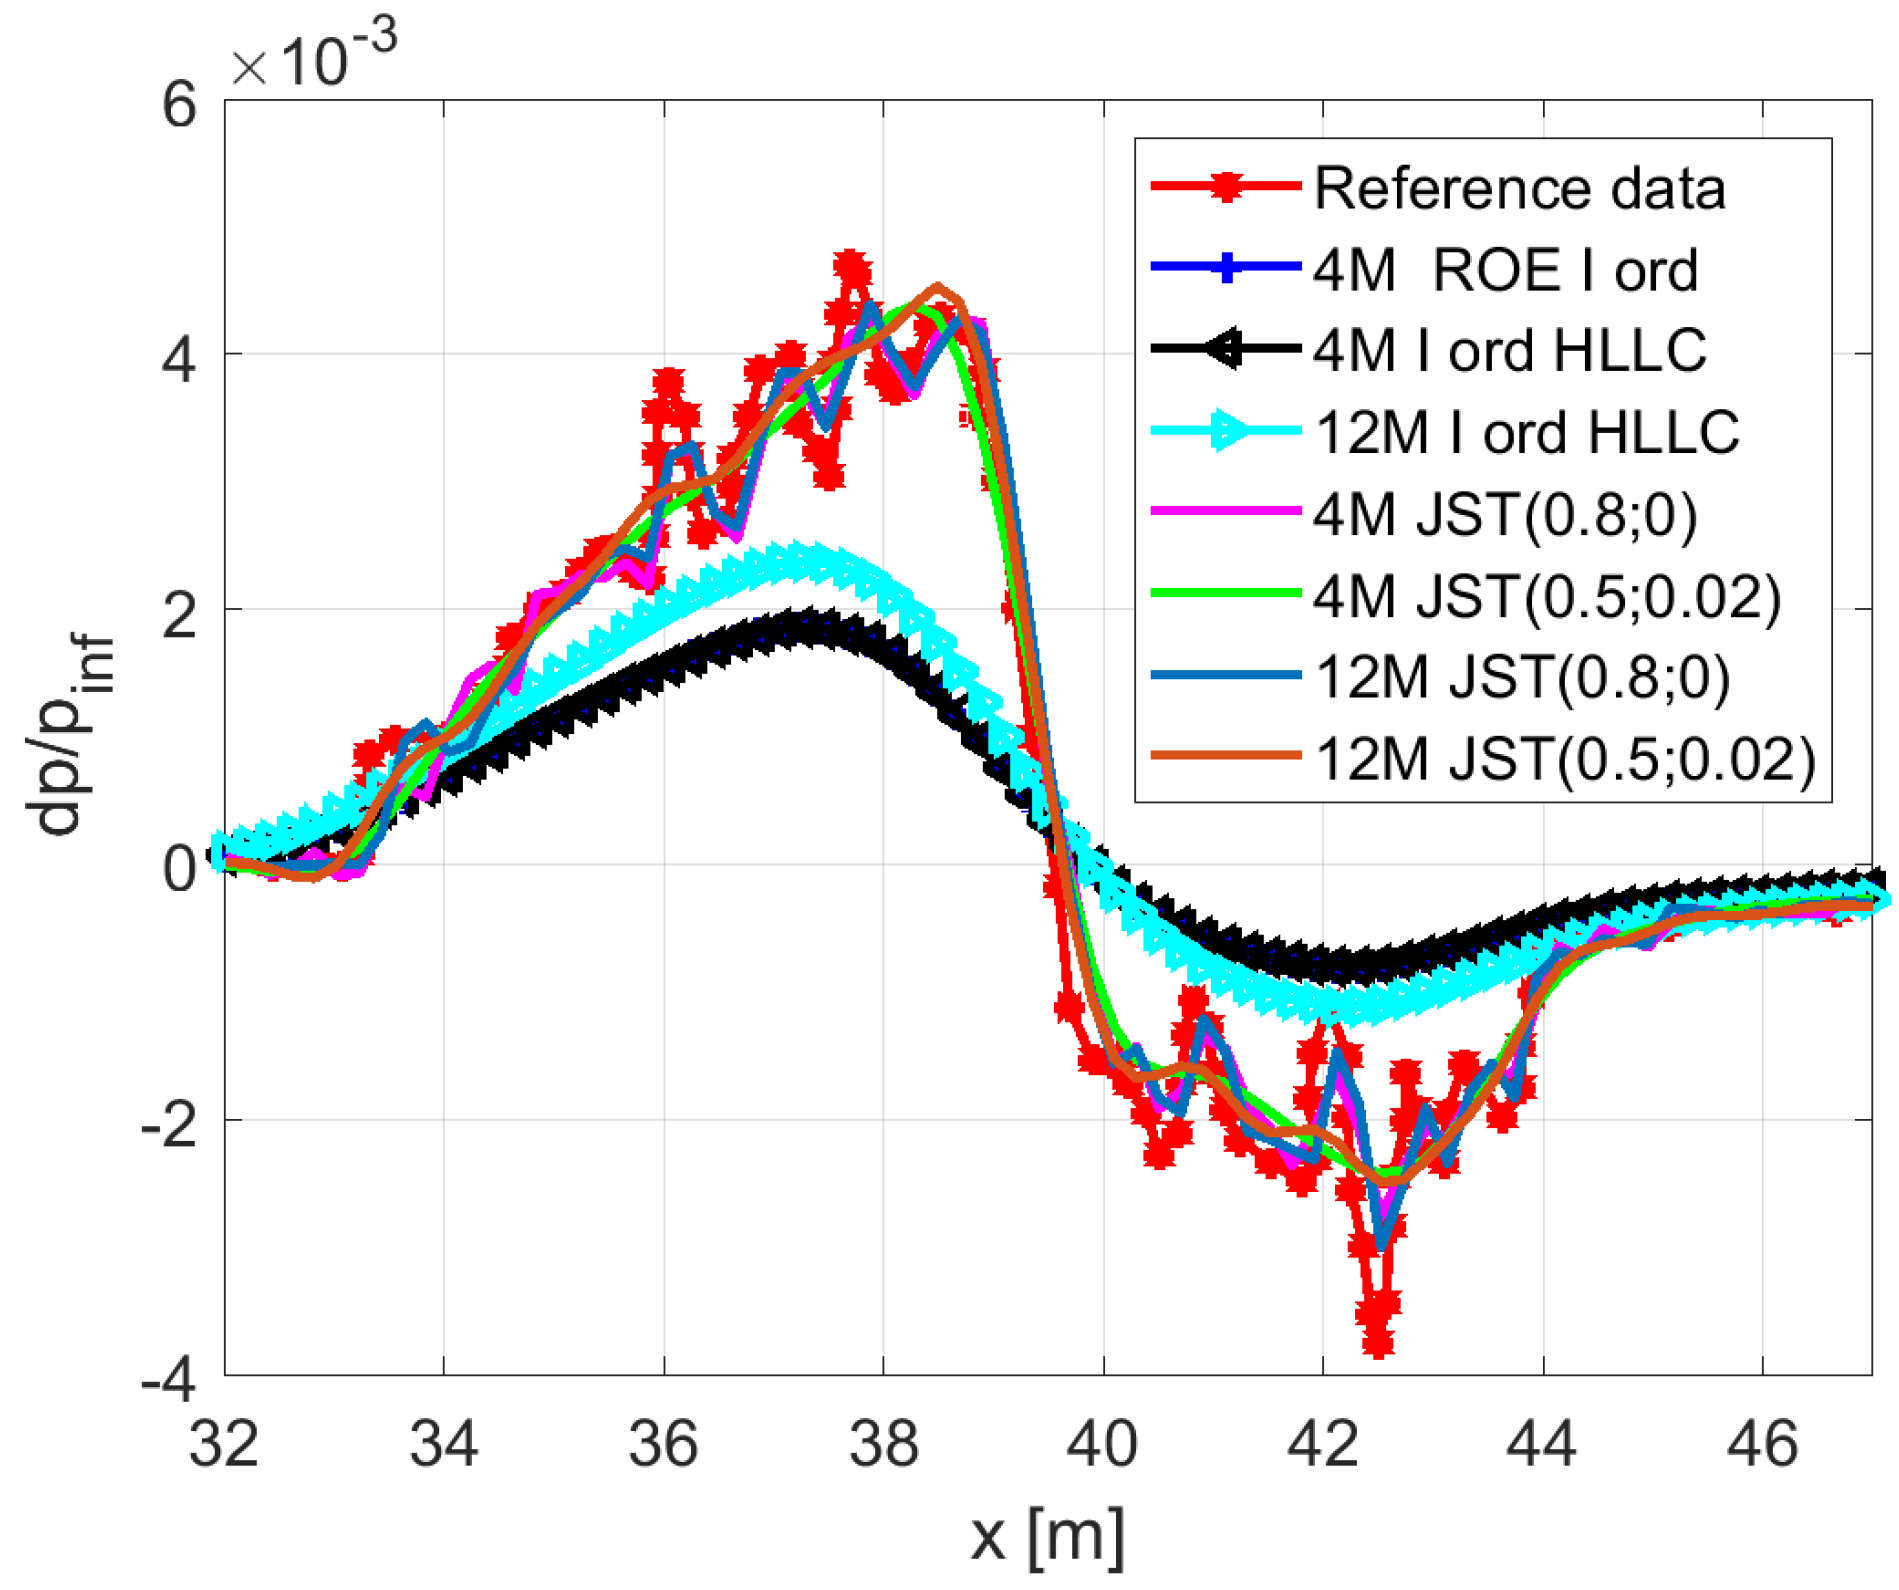
Figure 12 shows the pressure signature predictions obtained using SU2 for hybrid meshes with 4.5 and 12 million elements. Several numerical schemes were tested. Upwind schemes, such as the ROE and HLLC schemes, produced overly smoothed signatures that lacked shock definition. The JST central scheme, despite its inherent diffusivity, captured the shock structures more reliably. The second-order schemes improved the accuracy across the board, as shown in Figure 13.
The hybrid strategy significantly improved the accuracy of the results while maintaining a manageable computational cost, suggesting that it is a viable compromise for realistic aerospace geometries.

2.4.4. Different Refinement Laws

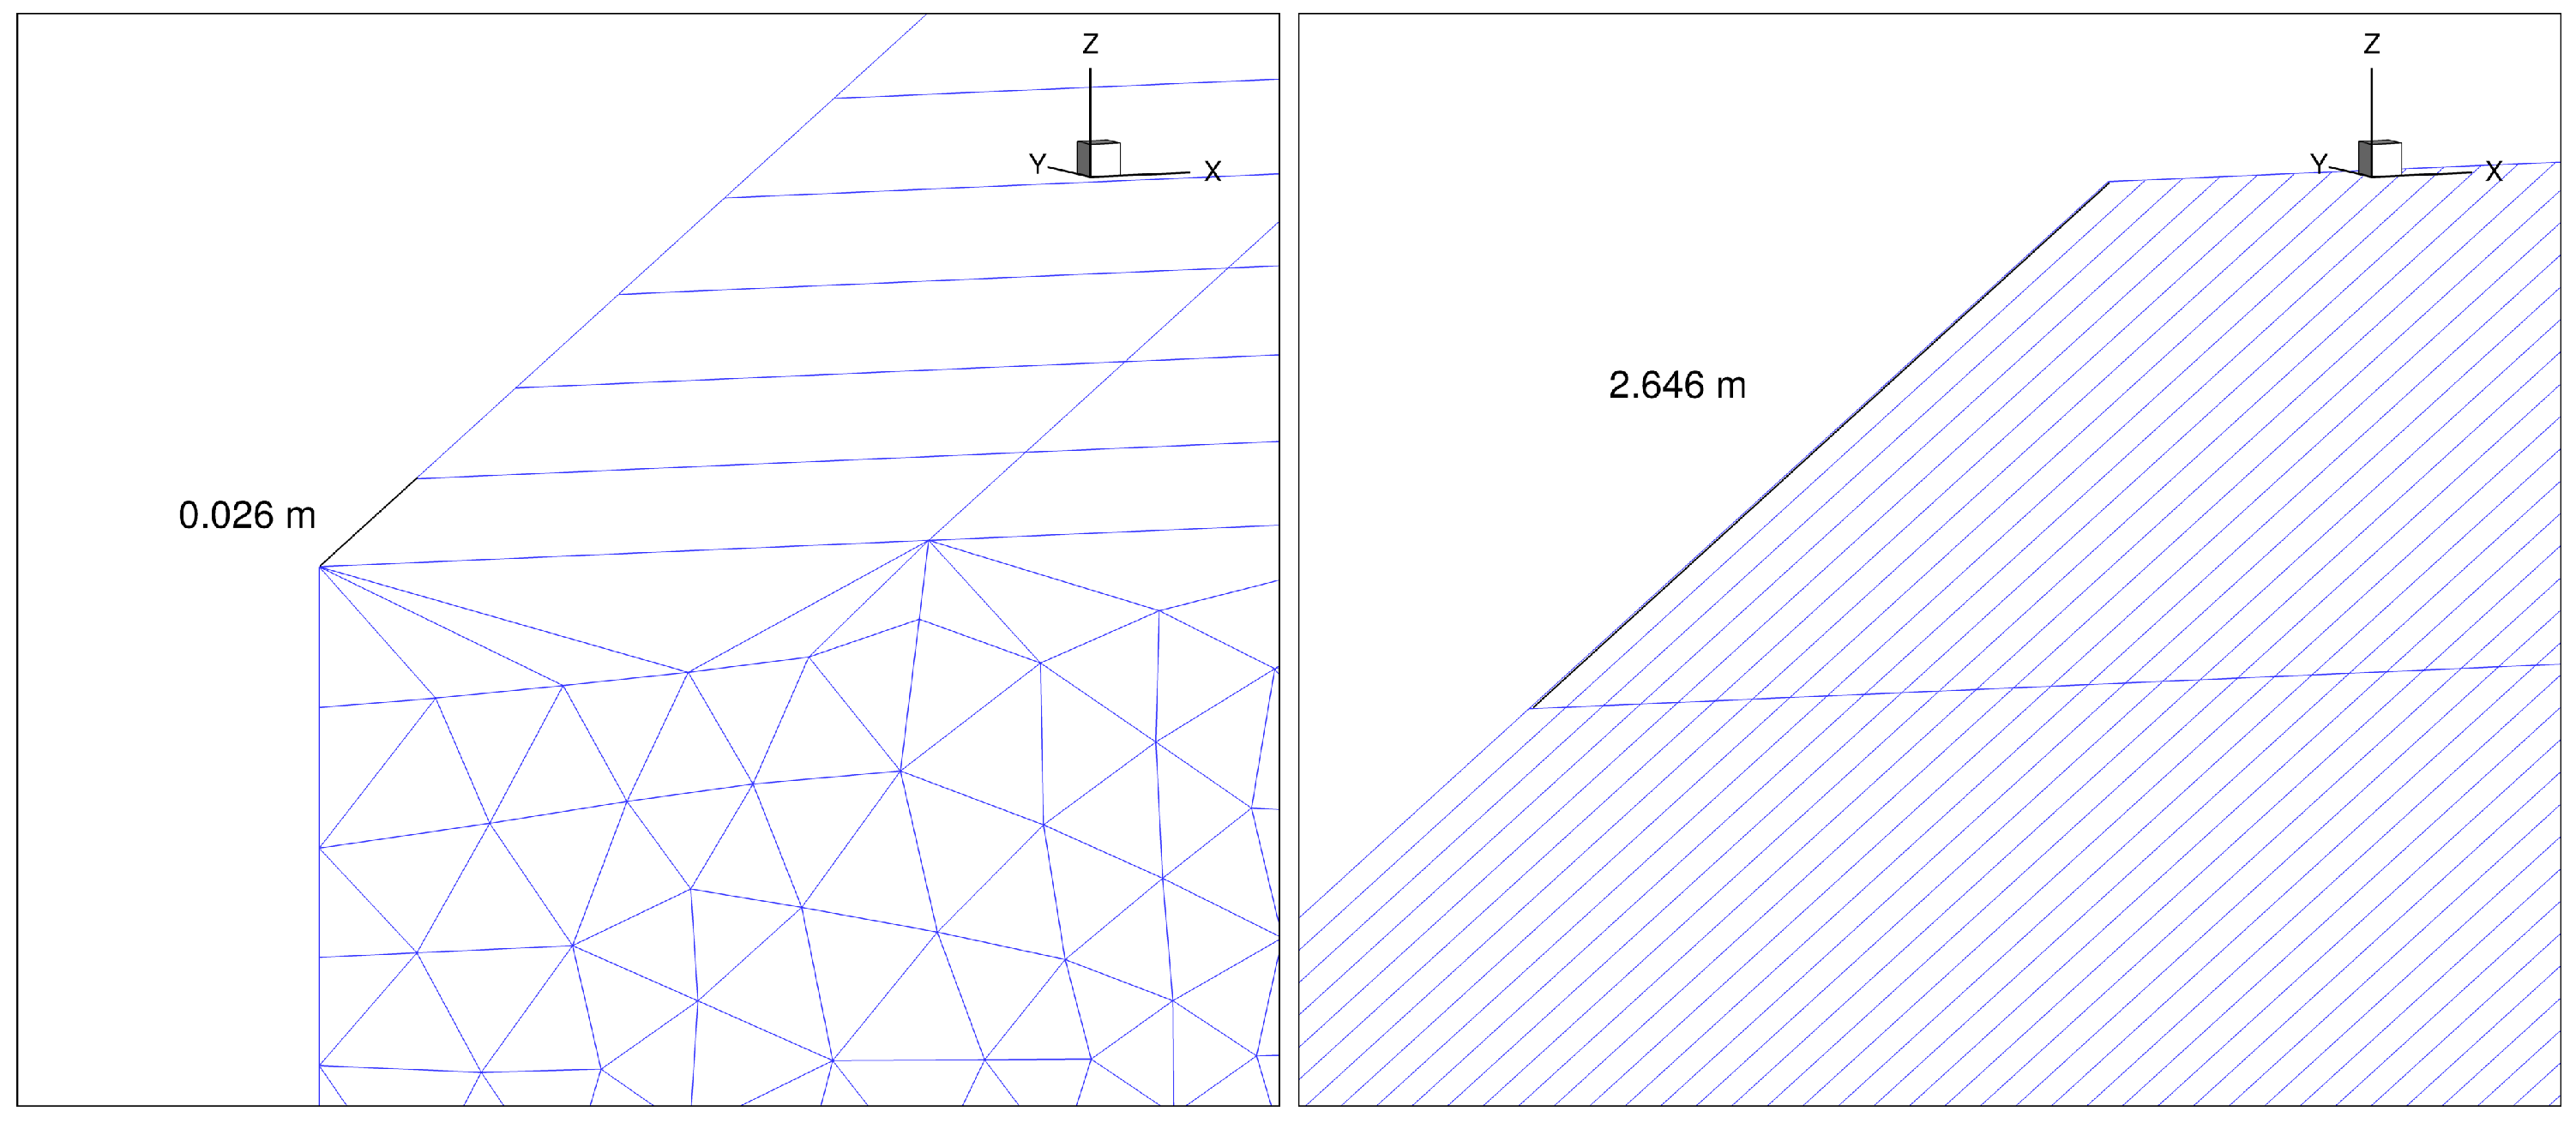
The final investigation focused on how the spacing law used to define the cell distribution in the structured region affects the pressure signature prediction. Two spacing laws were tested:
  • Uniform law: All cells have the same size along the radial direction.
  • Geometric law: Cell sizes increase progressively using a constant growth rate from the geometry outward.
Figure 14 illustrates the difference in cell distribution between the two approaches.
The results were always extracted at three distances, as before, but only the distance at three body lengths is shown in Figure 15. At ( H L ) 3 , both spacing strategies yielded nearly identical signatures. At ( H L ) 1 , the geometric spacing law performed slightly better in matching the reference signature. At ( H L ) 5 , the uniform spacing appeared to be more accurate.
The labels “hard” and “smooth” refer to grids with uniform and geometric spacing laws, respectively. No evident or strong differences were observed when comparing the two curves with each other and with the reference data. Summarizing the results for the three distances, the grid with geometric spacing law was more efficient near the aircraft, ( H L ) 1 , where the pressure signature calculated is closer to the reference data; on the contrary, the mesh with the uniform spacing law was more convenient at the stations further away from the geometry, such as ( H L ) 3 and ( H L ) 5 . Smaller elements led to a more accurate solution at each position but involved a large number of points and therefore required more computational resources and time to achieve a good numerical solution.
This study confirms that the grid design influences the accuracy of the prediction. Therefore, the best solution should be a grid refinement that is adapted to the region of interest. Obviously, this is expensive in terms of time and computational resources, and the uniform spacing law is a good compromise.

2.5. JWB Geometry

2.5.1. JWB 3D Test Case

To further evaluate the numerical methodology, simulations were performed on the full three-dimensional geometry of the JWB configuration [32]. The JWB aircraft is a wing–body aeroshape designed by JAXA to have the same equivalent area as the C25D and the same pressure signature at H L 3 . This configuration presents a strong expansion close to the lower fuselage to interfere with the shock wave in the rear zone of the fuselage. The details of this expansion differ for the RANS simulations, but this is not the focus of this study.
A hybrid meshing strategy was directly adopted, combining structured and unstructured zones. Specifically, the mesh comprised an unstructured region surrounding the geometry and a structured far-field region. The size of the computational mesh used was approximately 18 million elements.
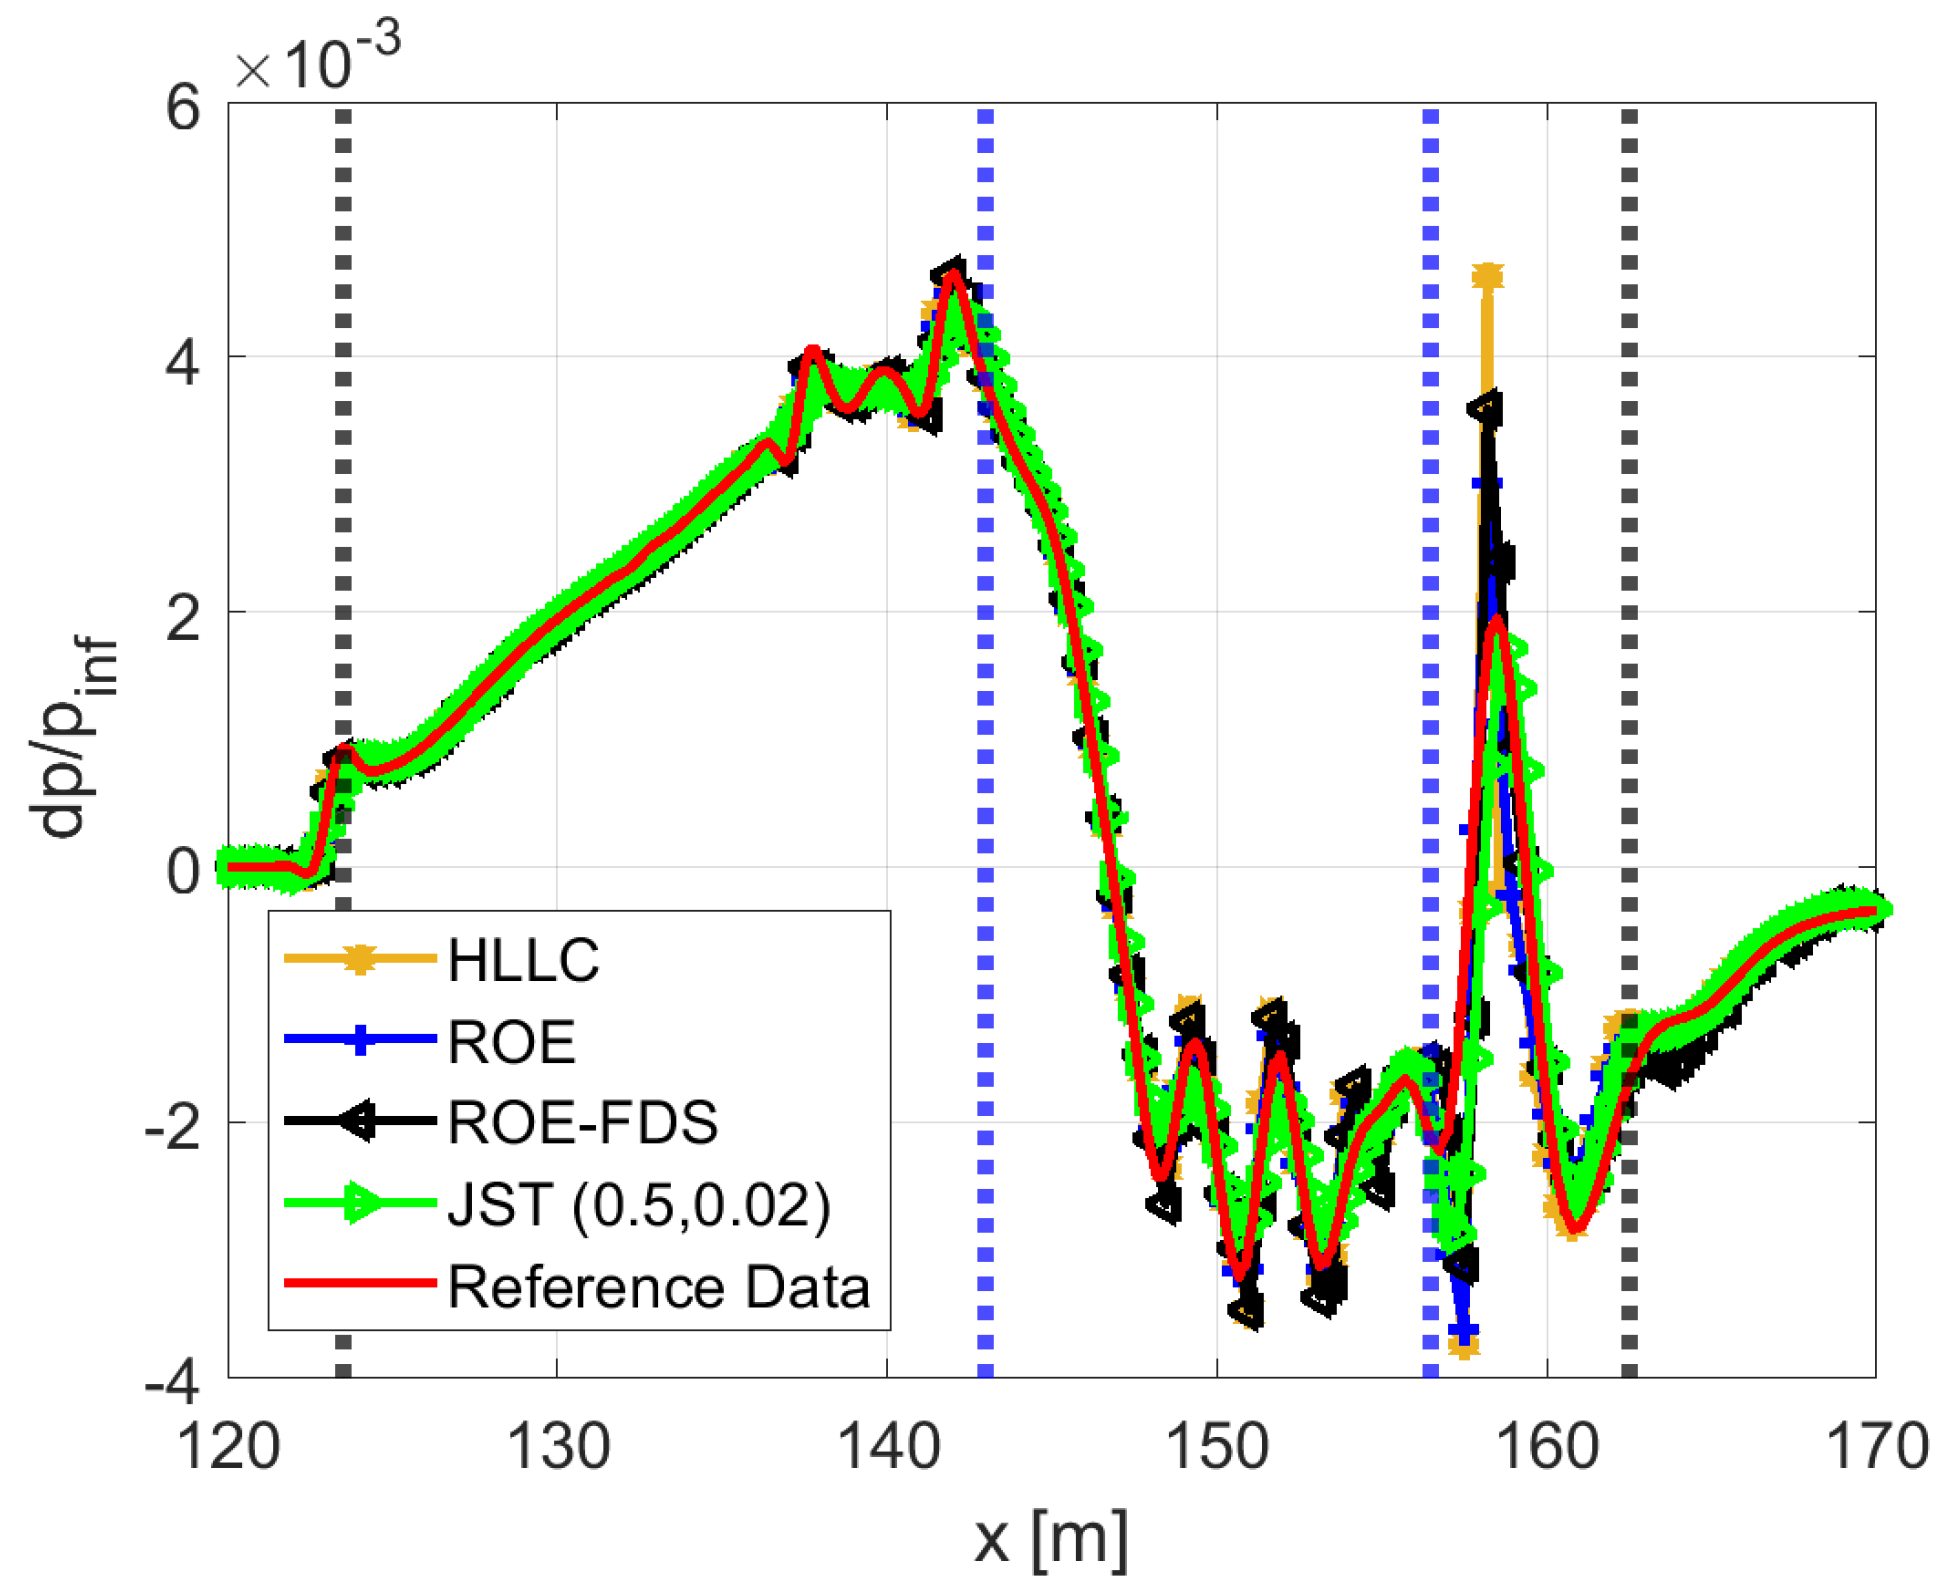
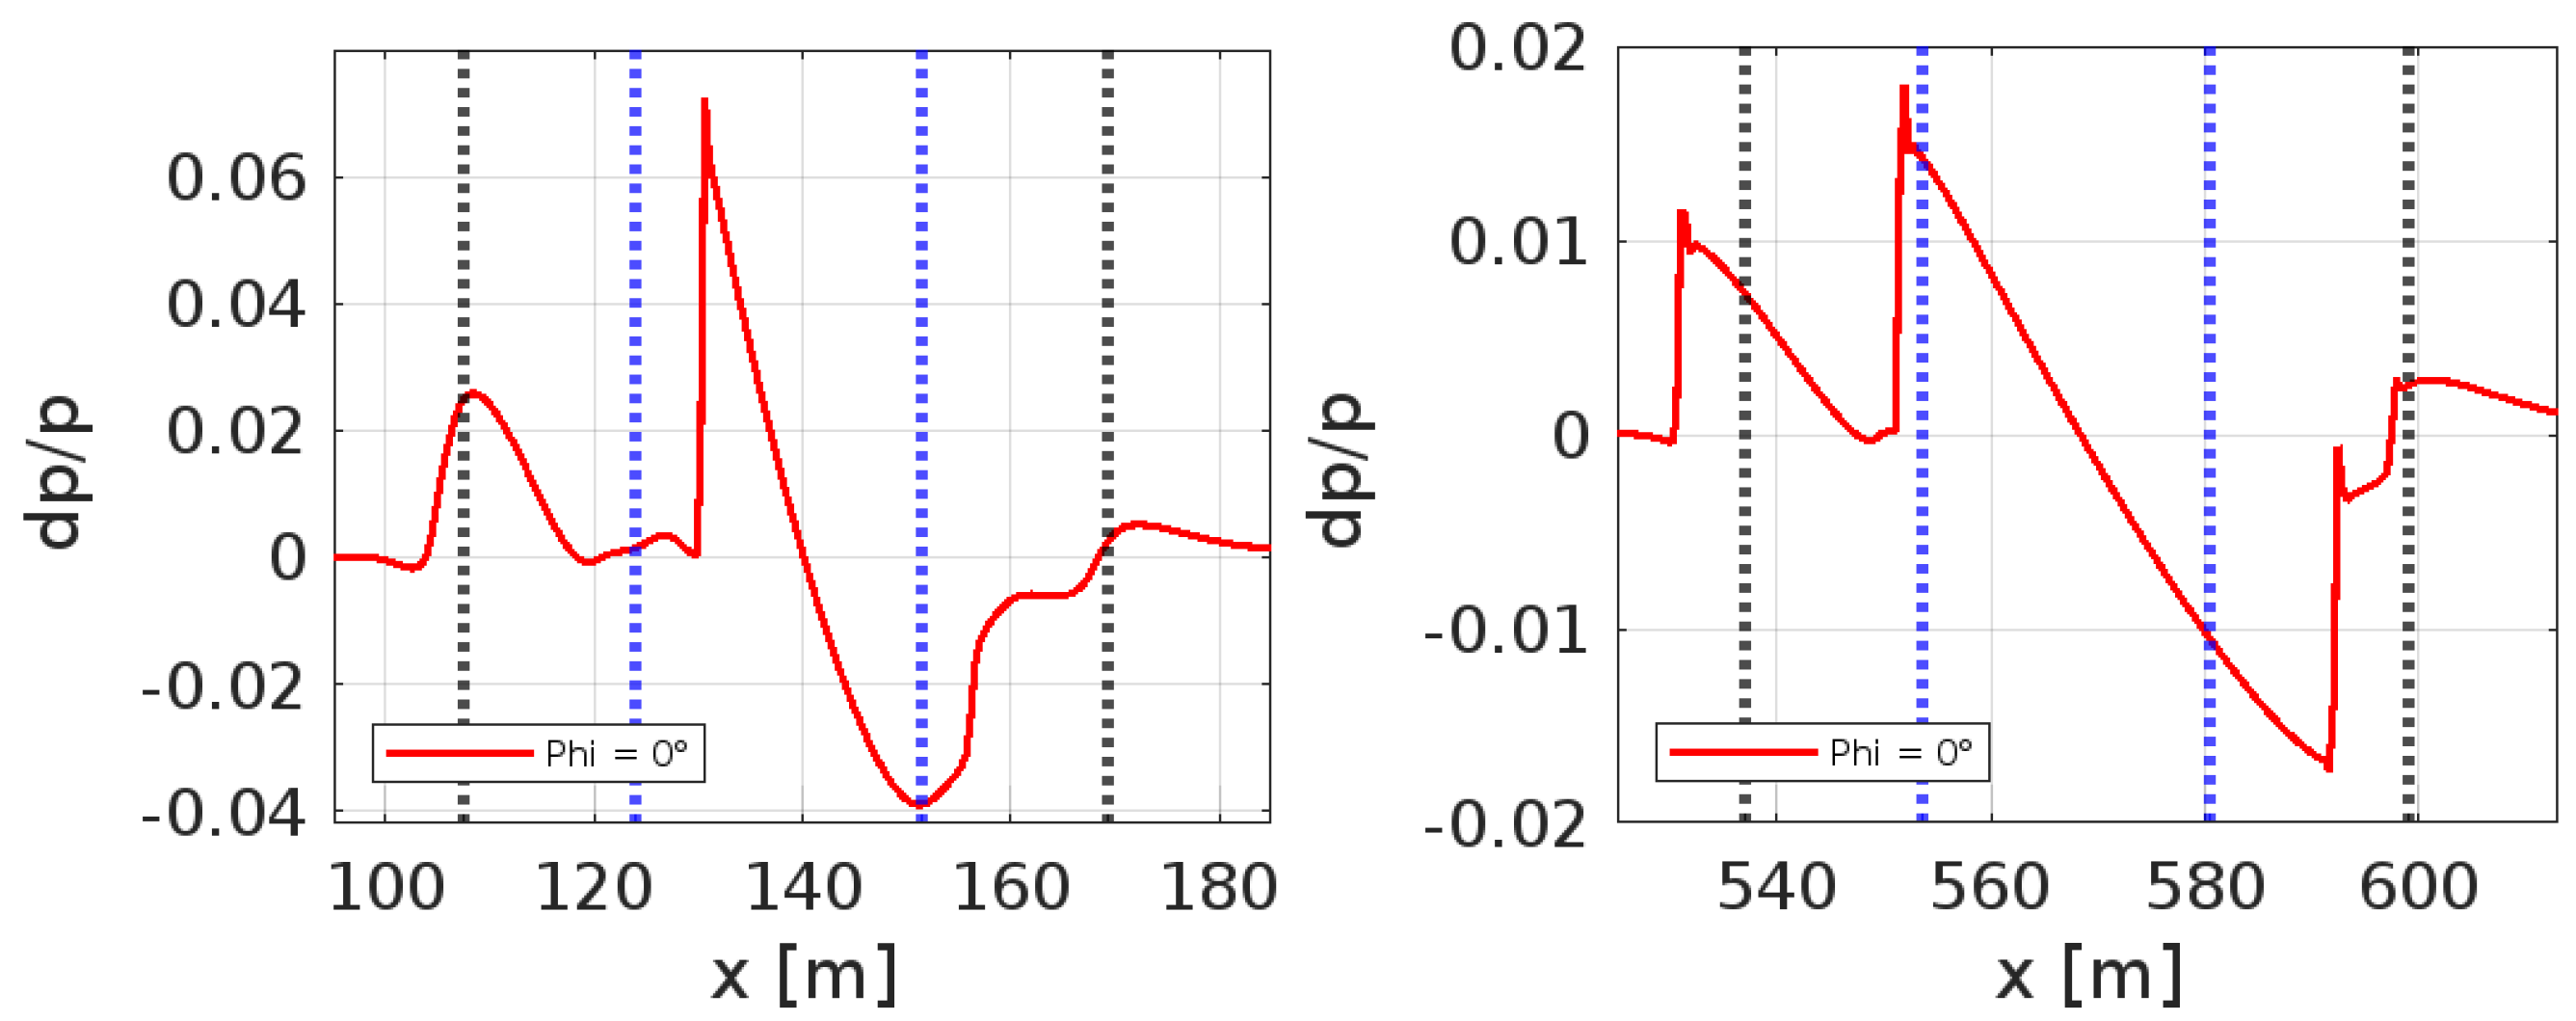
Simulations for the prediction of the sonic boom were carried out using second-order numerical models, and the results were extracted at position ( H L ) = 3 using the ANSYS Fluent and SU2 solvers. The simulation results were compared with the reference data from JAXA available in the second SBPW, as shown in Figure 16. To highlight the results in the best way, the beginning and end of the aircraft are marked by a black dashed line, and the wing is marked by a blue dashed line.
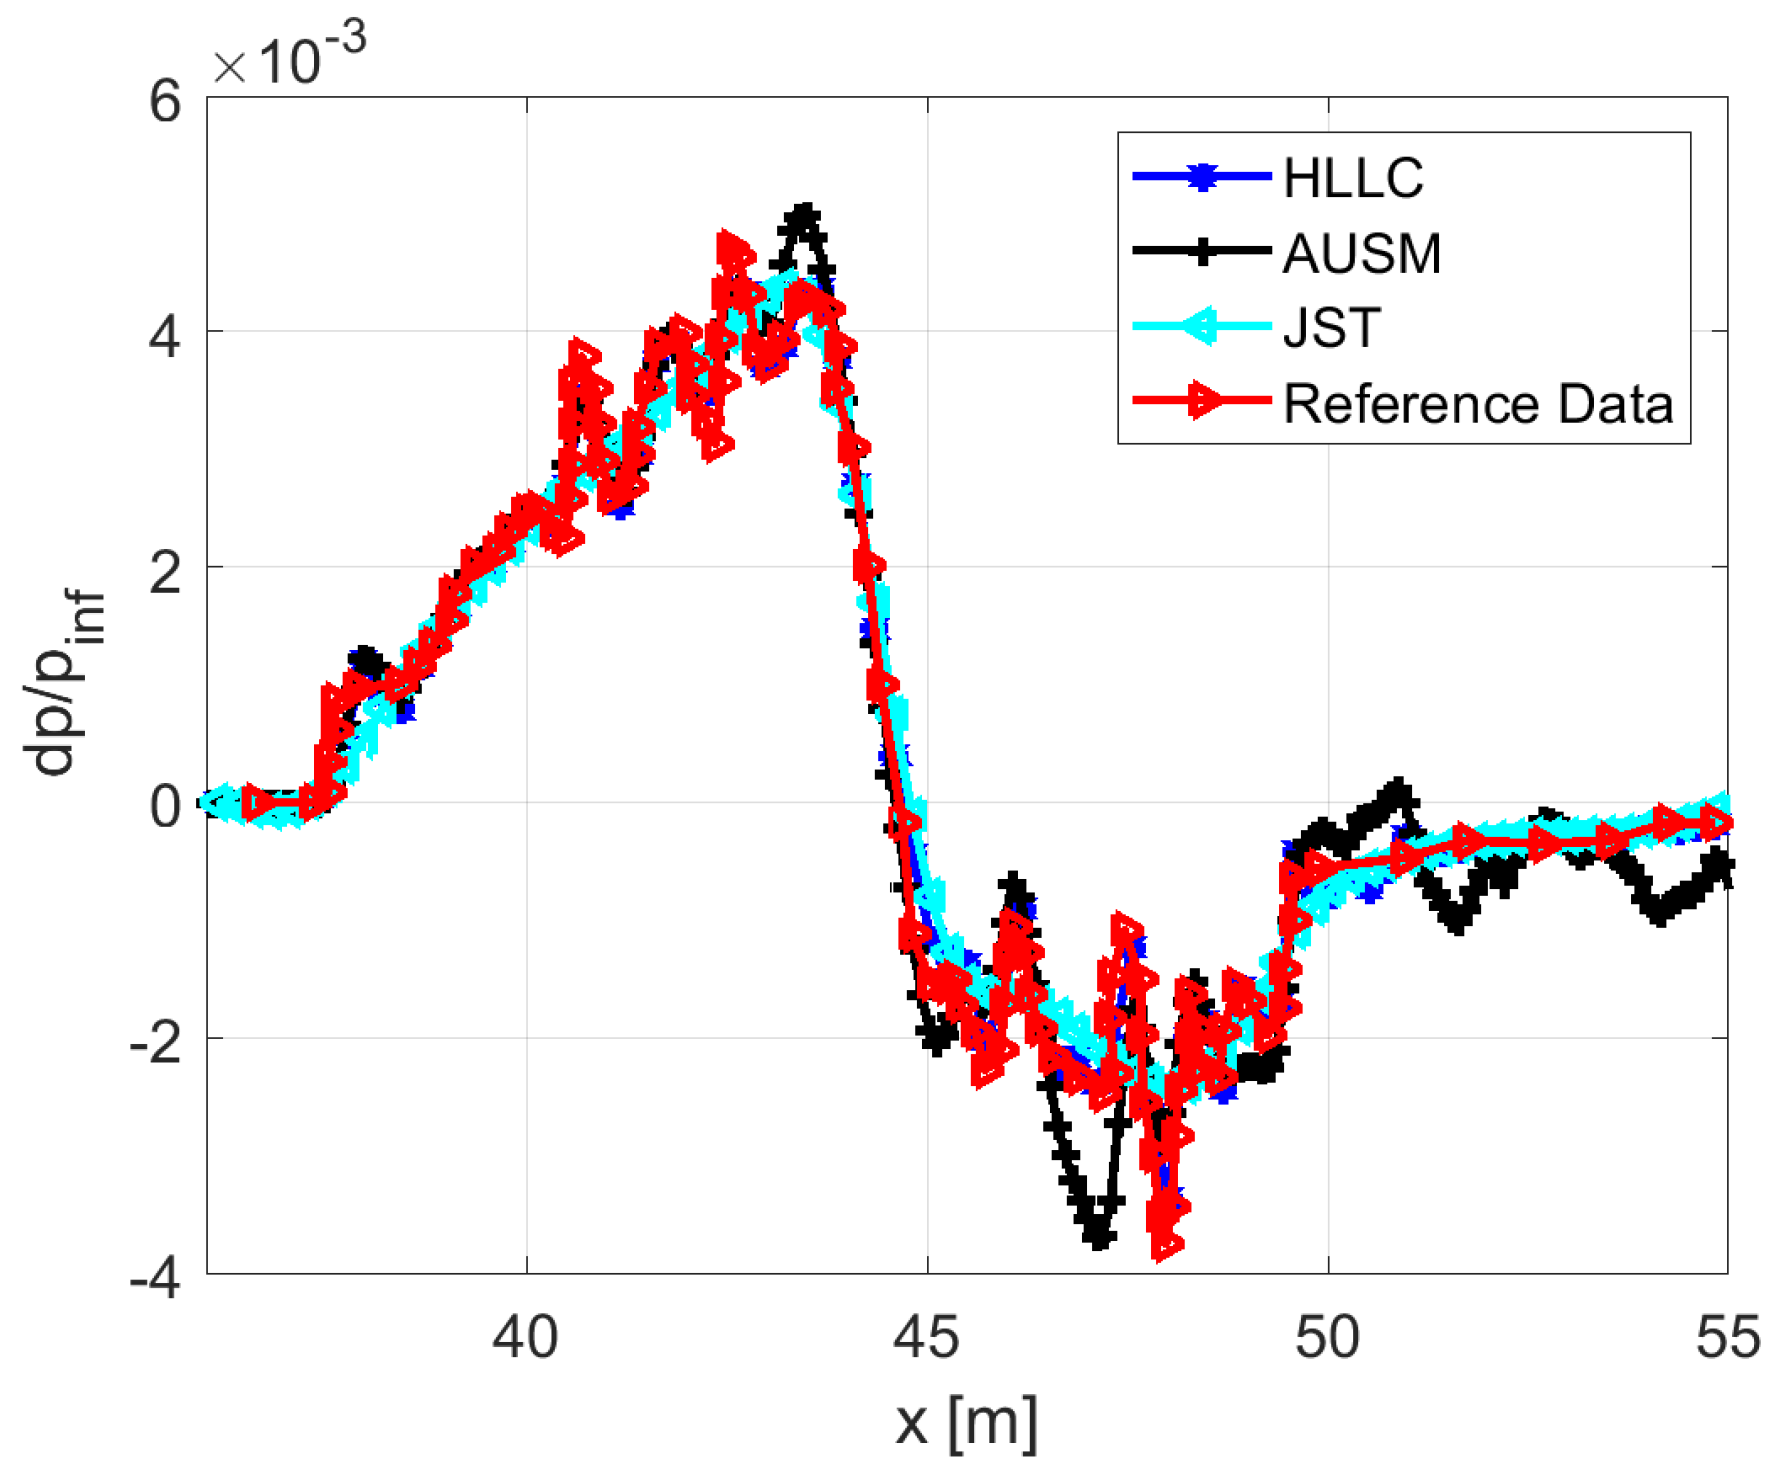
All the schemes used in the investigation showed good agreement with the reference data, as shown in Figure 16. The final part of the curve presents a high peak due to the absence of air viscosity, as also observed in the SBPW [16]. In addition, the details of the comparison are shown in Figure 17, where the HLLC scheme has a trend close to the reference data and presents a lower numerical diffusion effect than the other schemes, whereas the ROE scheme seems to be more dissipative. Finally, in the last image, the peaks are due to the Eulerian simulations, as mentioned earlier.
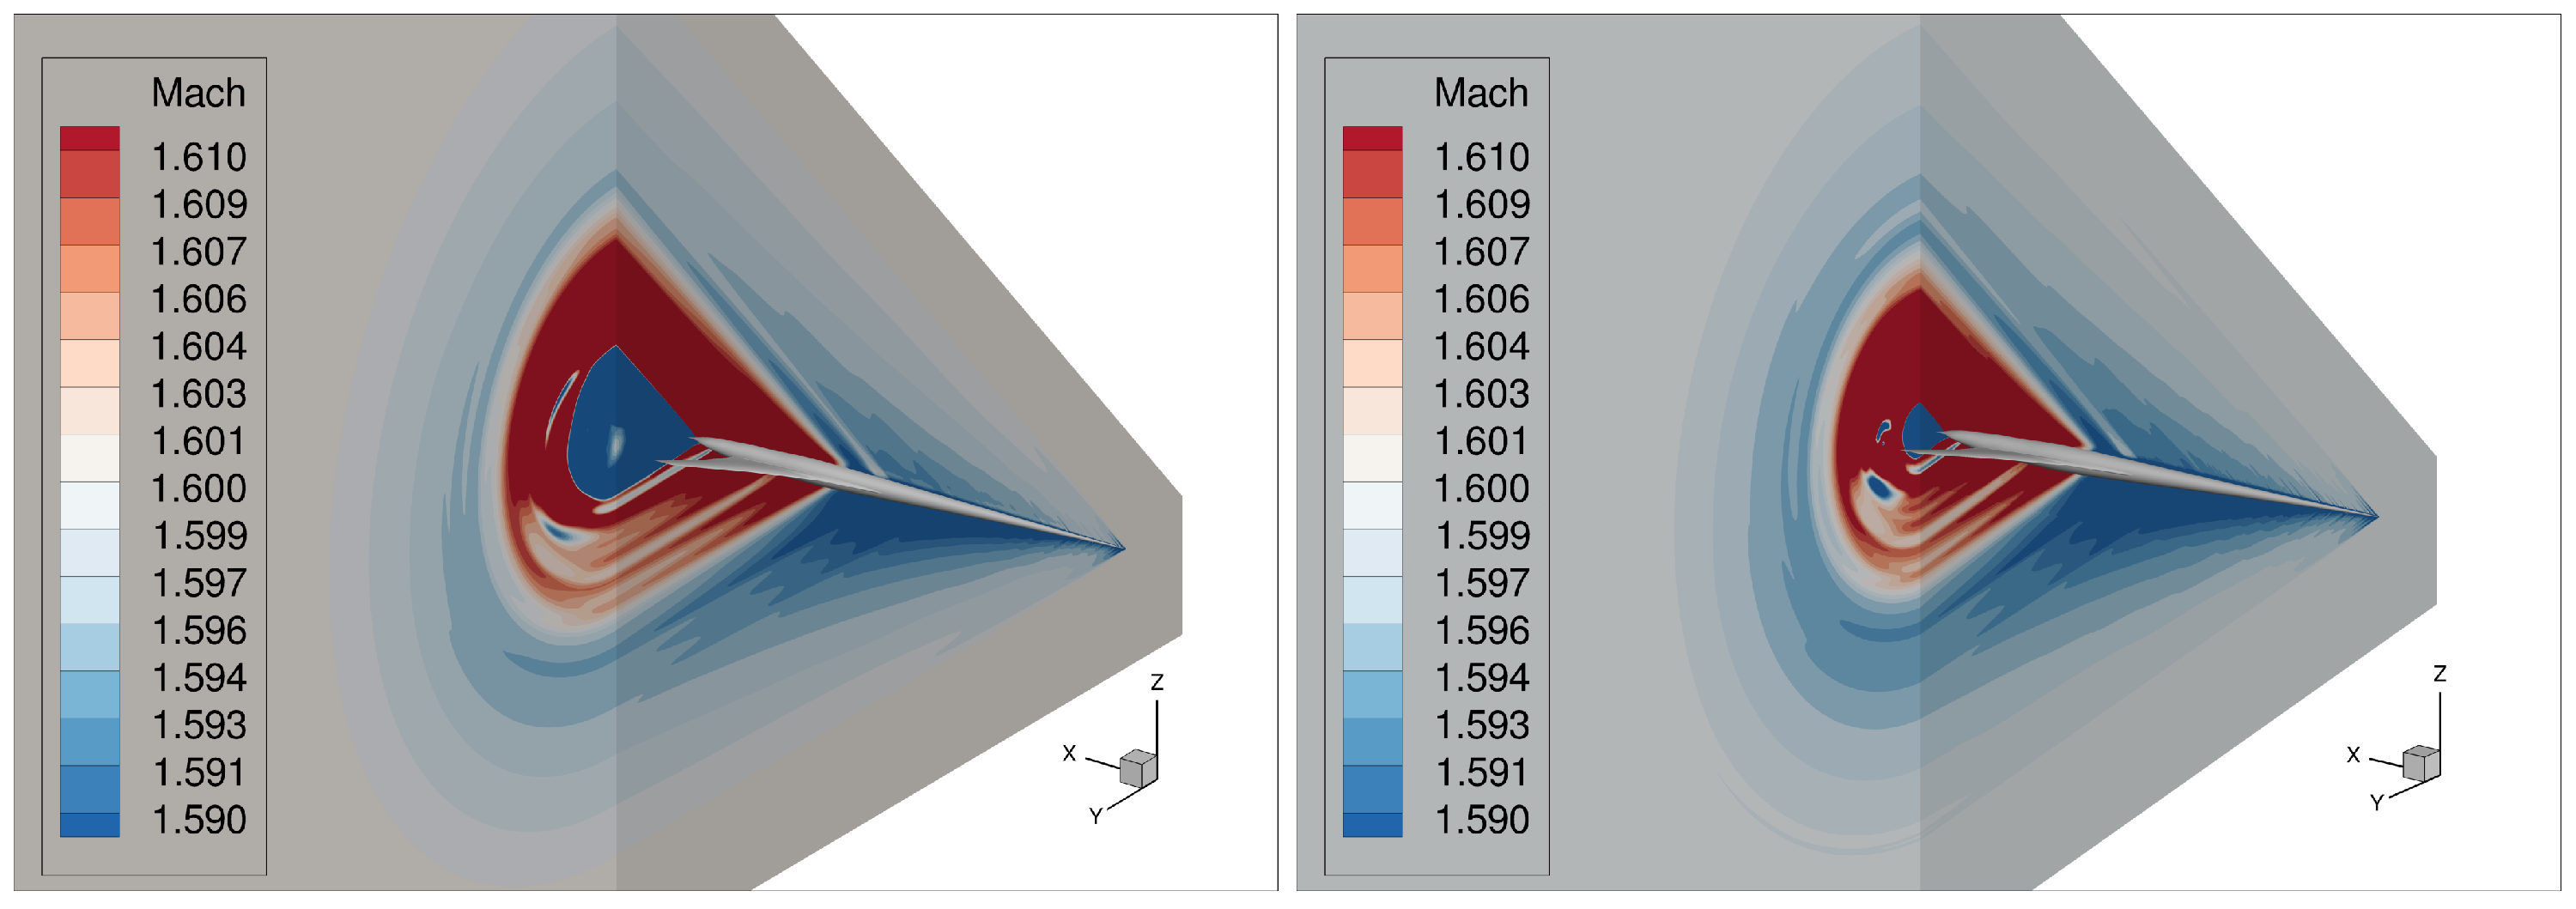
The Mach contours, shown in Figure 18, reveal the presence of complex flow phenomena and strong shock waves, particularly in the front and rear sections of the aircraft. These complexes were captured in both solvers, although subtle differences in shock sharpness were observed depending on the grid resolution and numerical scheme.
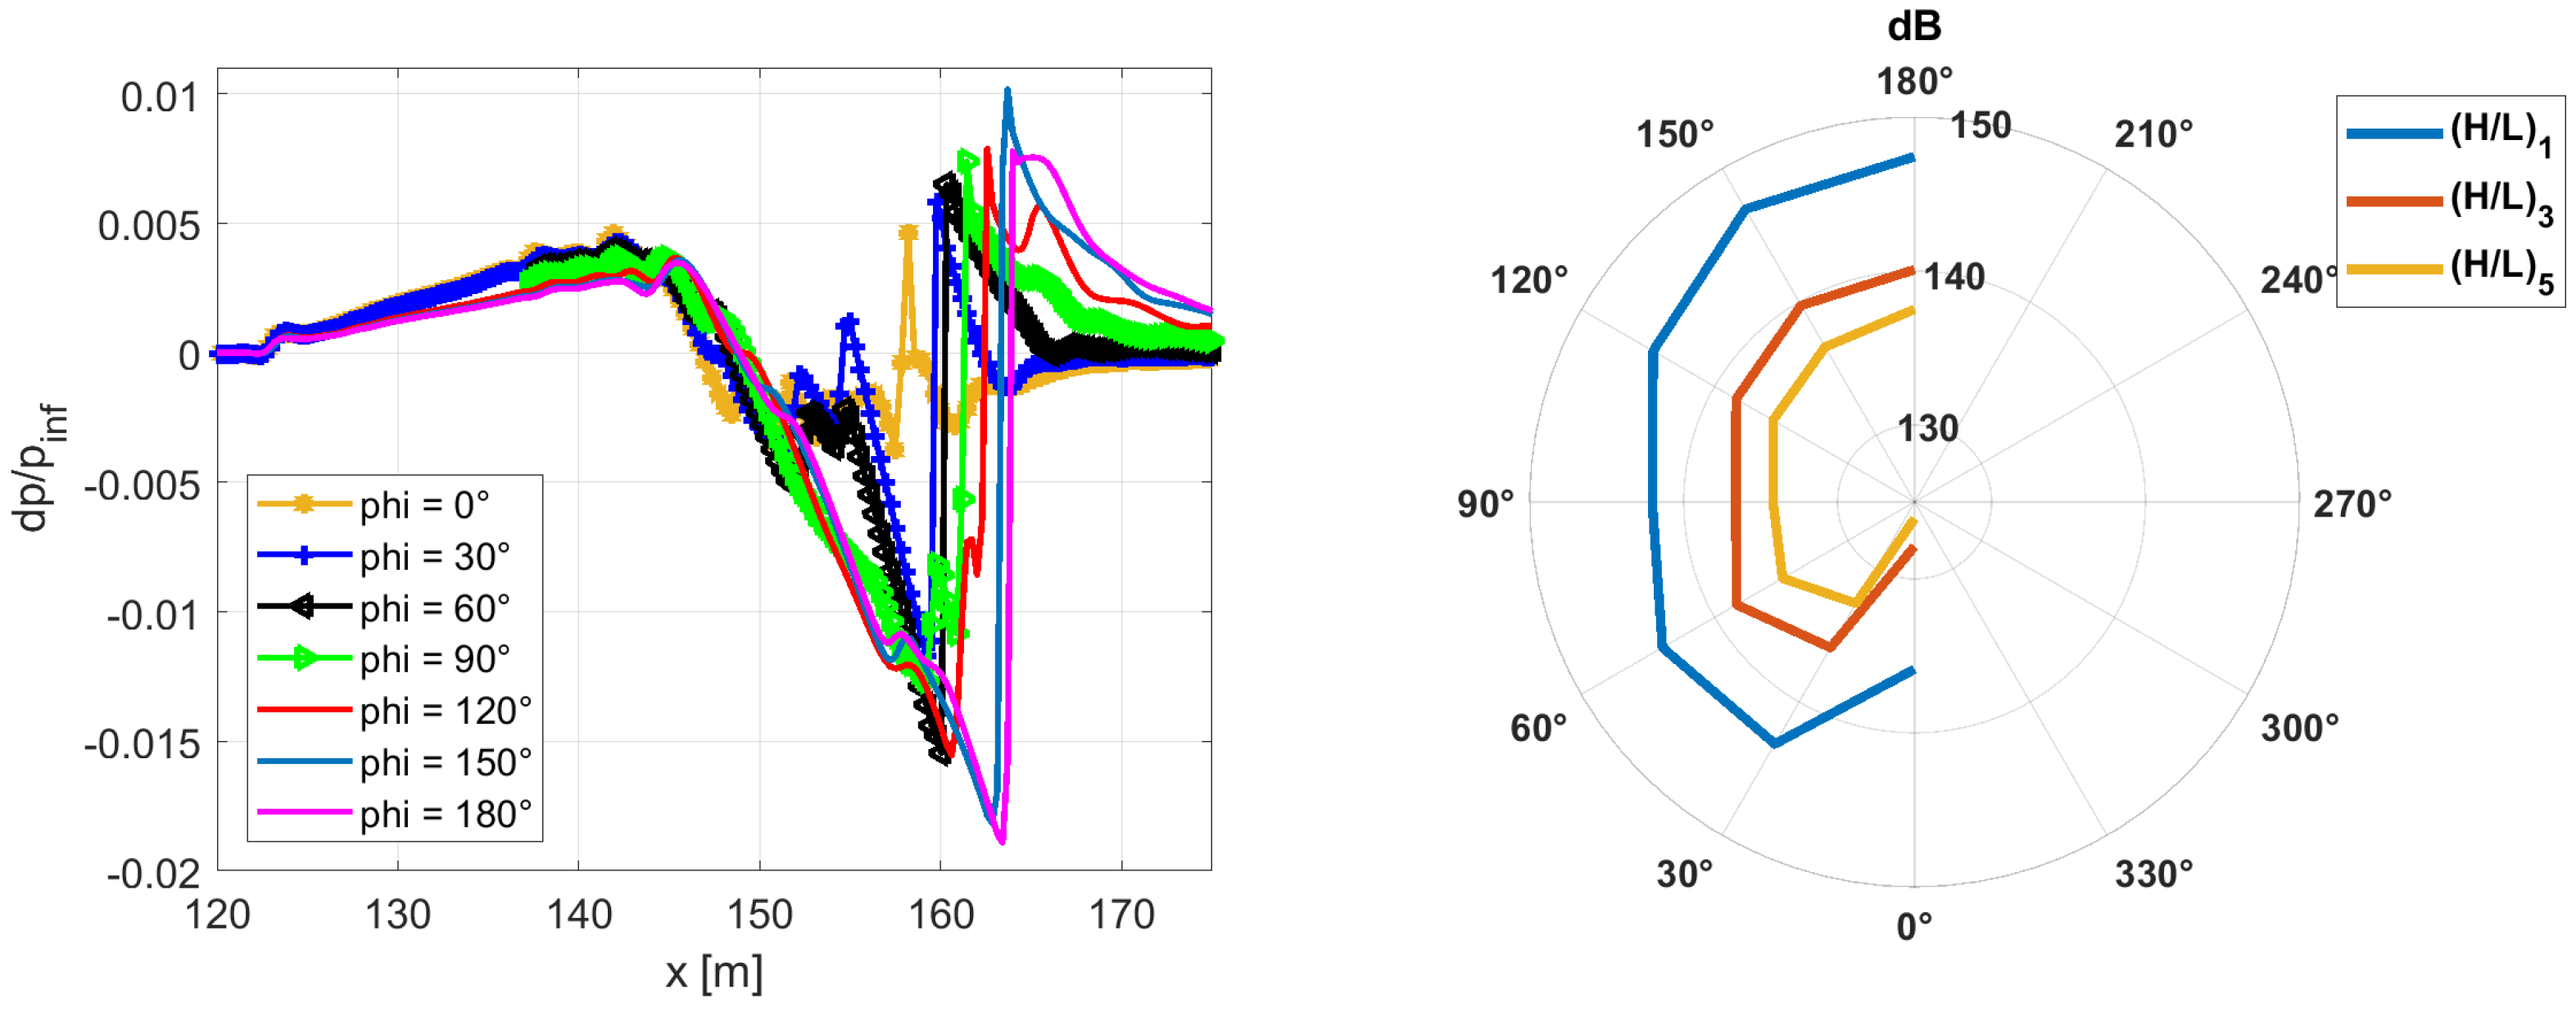
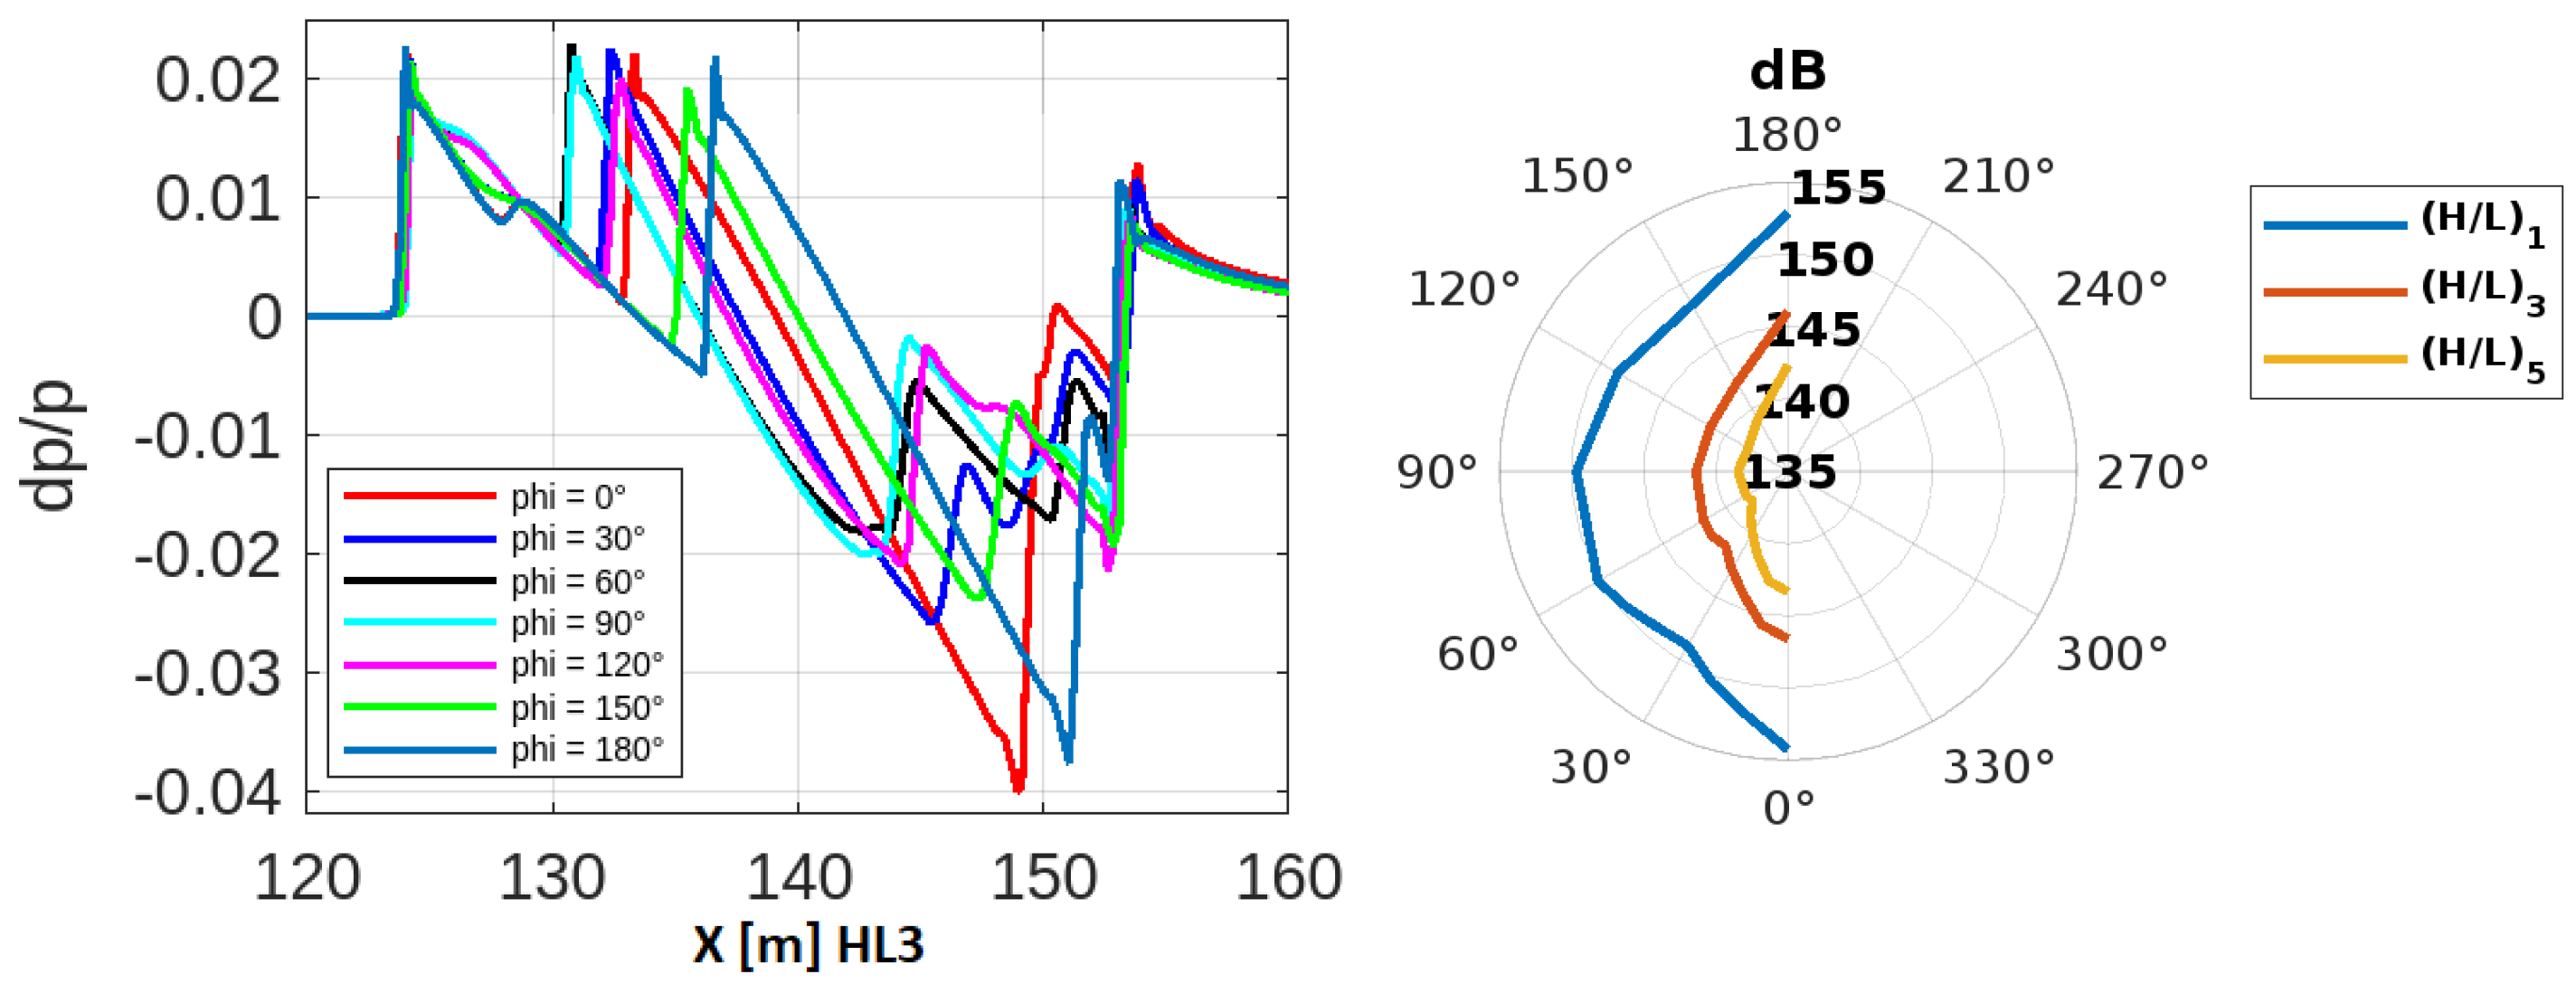
Further analysis was carried out, and the pressure signature was extracted in the radial direction to analyze the effect of the wing. The analysis was performed for angles starting from 0 ° (i.e., under the aircraft) to 180 ° (i.e., above the aircraft) using the solution for the HLLC scheme, and the angle scheme is shown in Figure 19. Moreover, Figure 20 shows the pressure signatures in the left image, and, for each curve, the highest peak in absolute value is converted to dB and plotted in the polar plot on the right, that is, at 0 ° , 30 ° , 60 ° , 90 ° , 120 ° , 150 ° , and 180 ° .
It is worth noting that the noise values below the aircraft are lower than the other angles, which is consistent with the construction of the JWB, which is optimized to reduce noise in the direction of the ground.
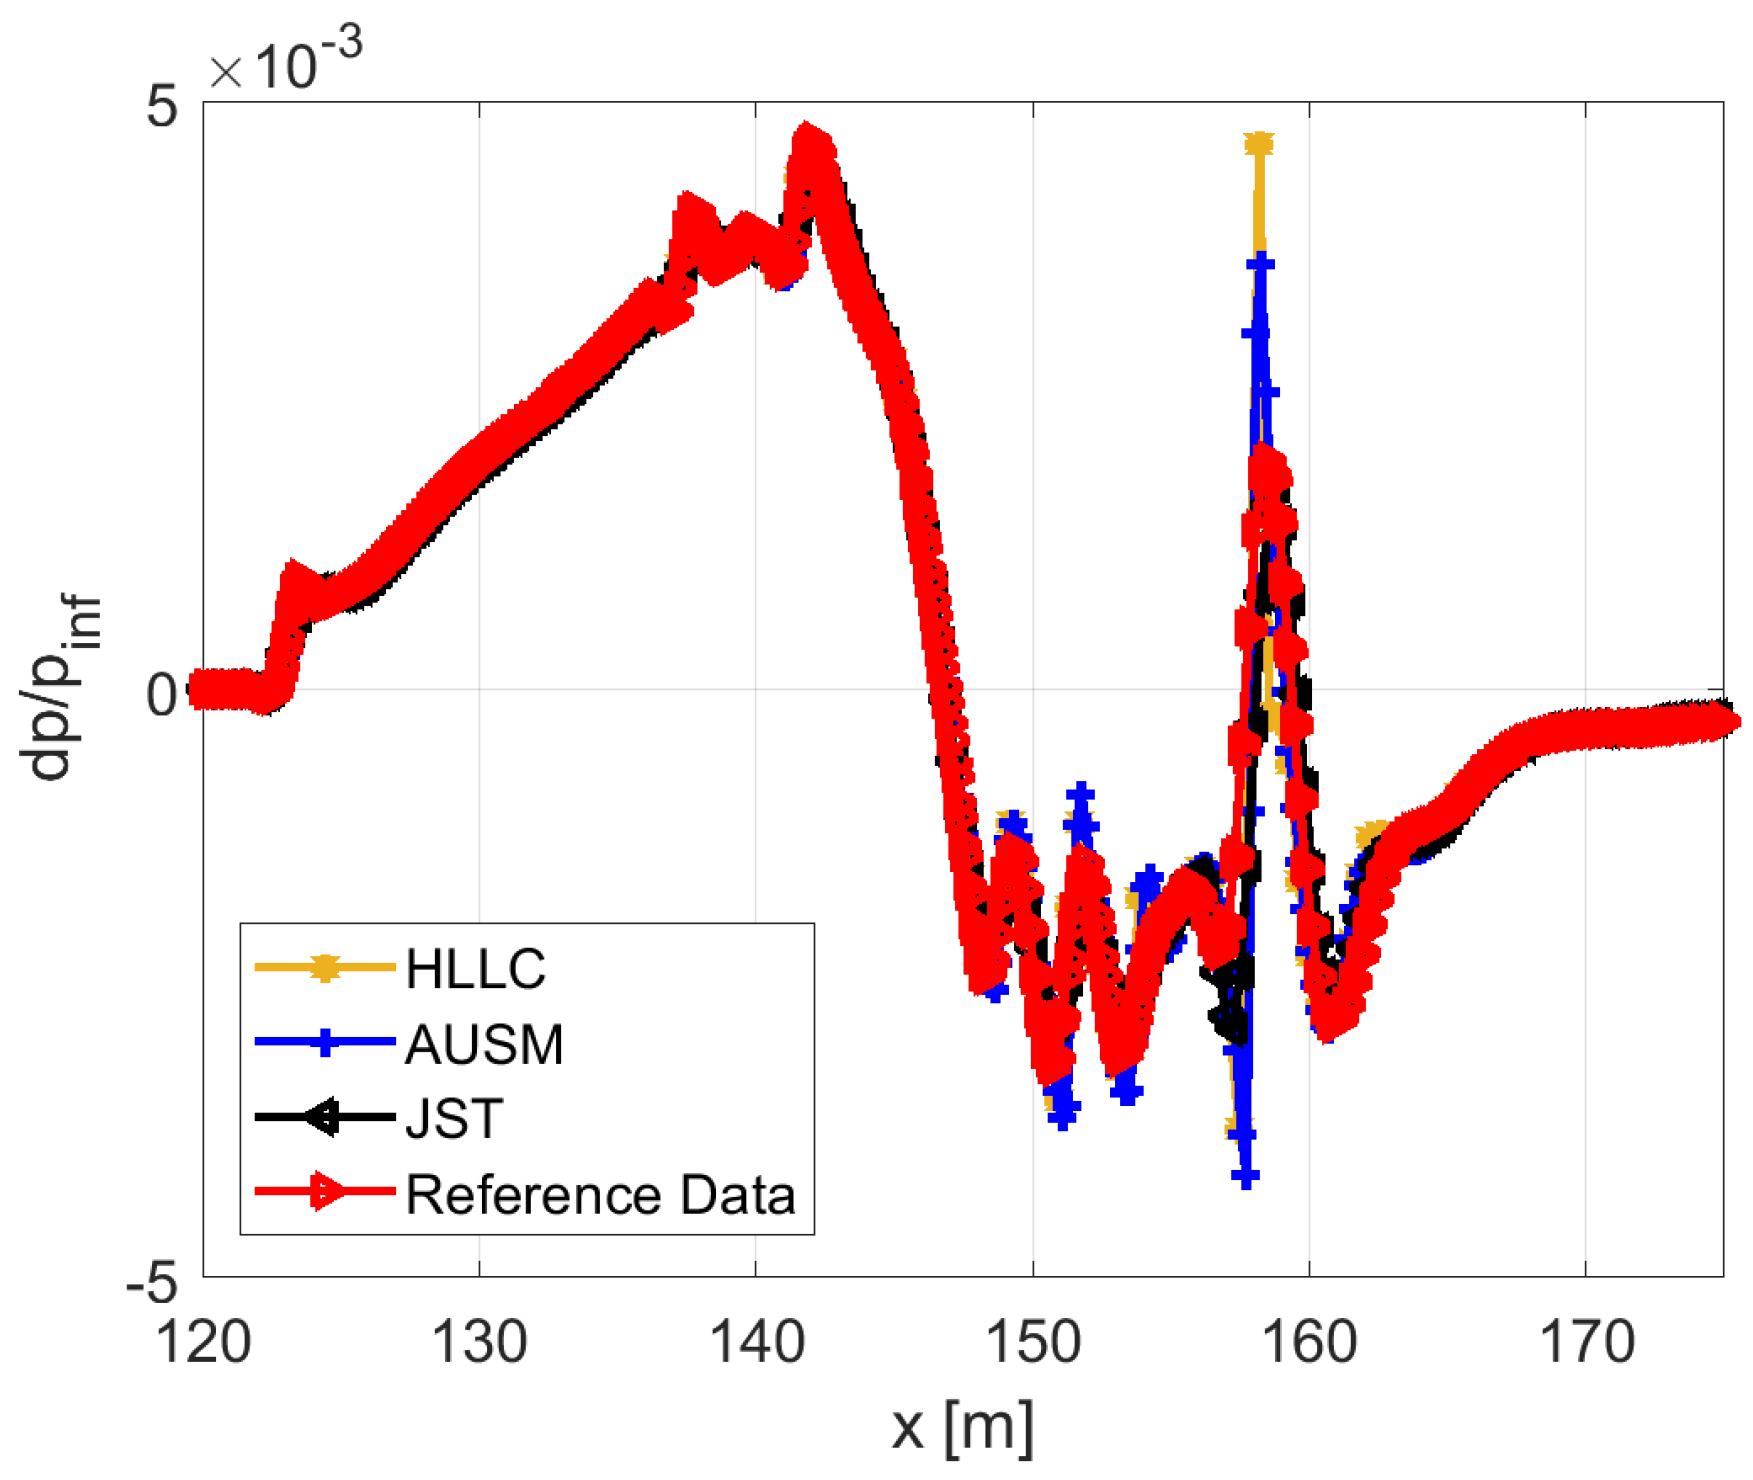
The AUSM scheme was also applied to the Eulerian simulations. Figure 21 shows the comparison at distance ( H L ) 3 . The AUSM scheme also agreed well with the reference data but underestimated some peaks.
The HLLC scheme showed a greater variation in pressure than the other schemes, as expected from the reference data, and, where no reference data are available, it can be considered the most suitable for predicting the pressure signature.

2.5.2. Refinement Strategy Effects for JWB

Two grid spacing laws were tested for the structured part of the domain and the JWB using the same criteria as for the AXIE.
Figure 22 shows the pressure signature results for the two grids constructed at a distance ( H L ) 3 from the JWB geometry. A slight difference between the two approaches is highlighted, and the geometric refinement achieves better agreement with the reference data, especially in capturing the amplitude and sharpness of the secondary peaks. The pressure peak downstream of the body shows a major difference and is higher than that of the reference data. This behavior is always due to the absence of viscosity, as previously explained.
In conclusion, the geometric spacing law provides superior results near the aircraft, whereas uniform spacing offers a more regular resolution in the far field. Therefore, a balanced refinement strategy is critical to ensure high fidelity in sonic boom prediction across multiple observation distances.

3. Conceptual Supersonic Aircraft

Owing to the expertise gained in the previous validation phase of the numerical methodology, the same approach was used to evaluate the pressure signatures generated by three conceptual supersonic aircraft, CS1, CS2, and CS3, developed within the framework of the European MORE&LESS project. These three configurations were developed with different characteristics and purposes; therefore, it is interesting to compare and study them. The shapes and geometric dimensions are different, and these aspects highlight their impact on the pressure signature.
Aerodynamic simulations were previously performed within the project to estimate the lift and drag characteristics for only the CS1 configuration. Reference aeroacoustic data are not available for this specific configuration; therefore, aerodynamic results are necessary primarily to verify the numerical stability and convergence of the aeroacoustic computations.
Although these aerodynamic results are useful for checking consistency, they are not directly applicable to aeroacoustic analyses. This is mainly due to the distinct mesh strategies adopted in these two simulations. For the aeroacoustic grid, a hybrid meshing strategy was used to obtain a mesh of approximately 21.5 million elements, whereas the aerodynamic grid is an unstructured mesh with approximately 2 million elements.
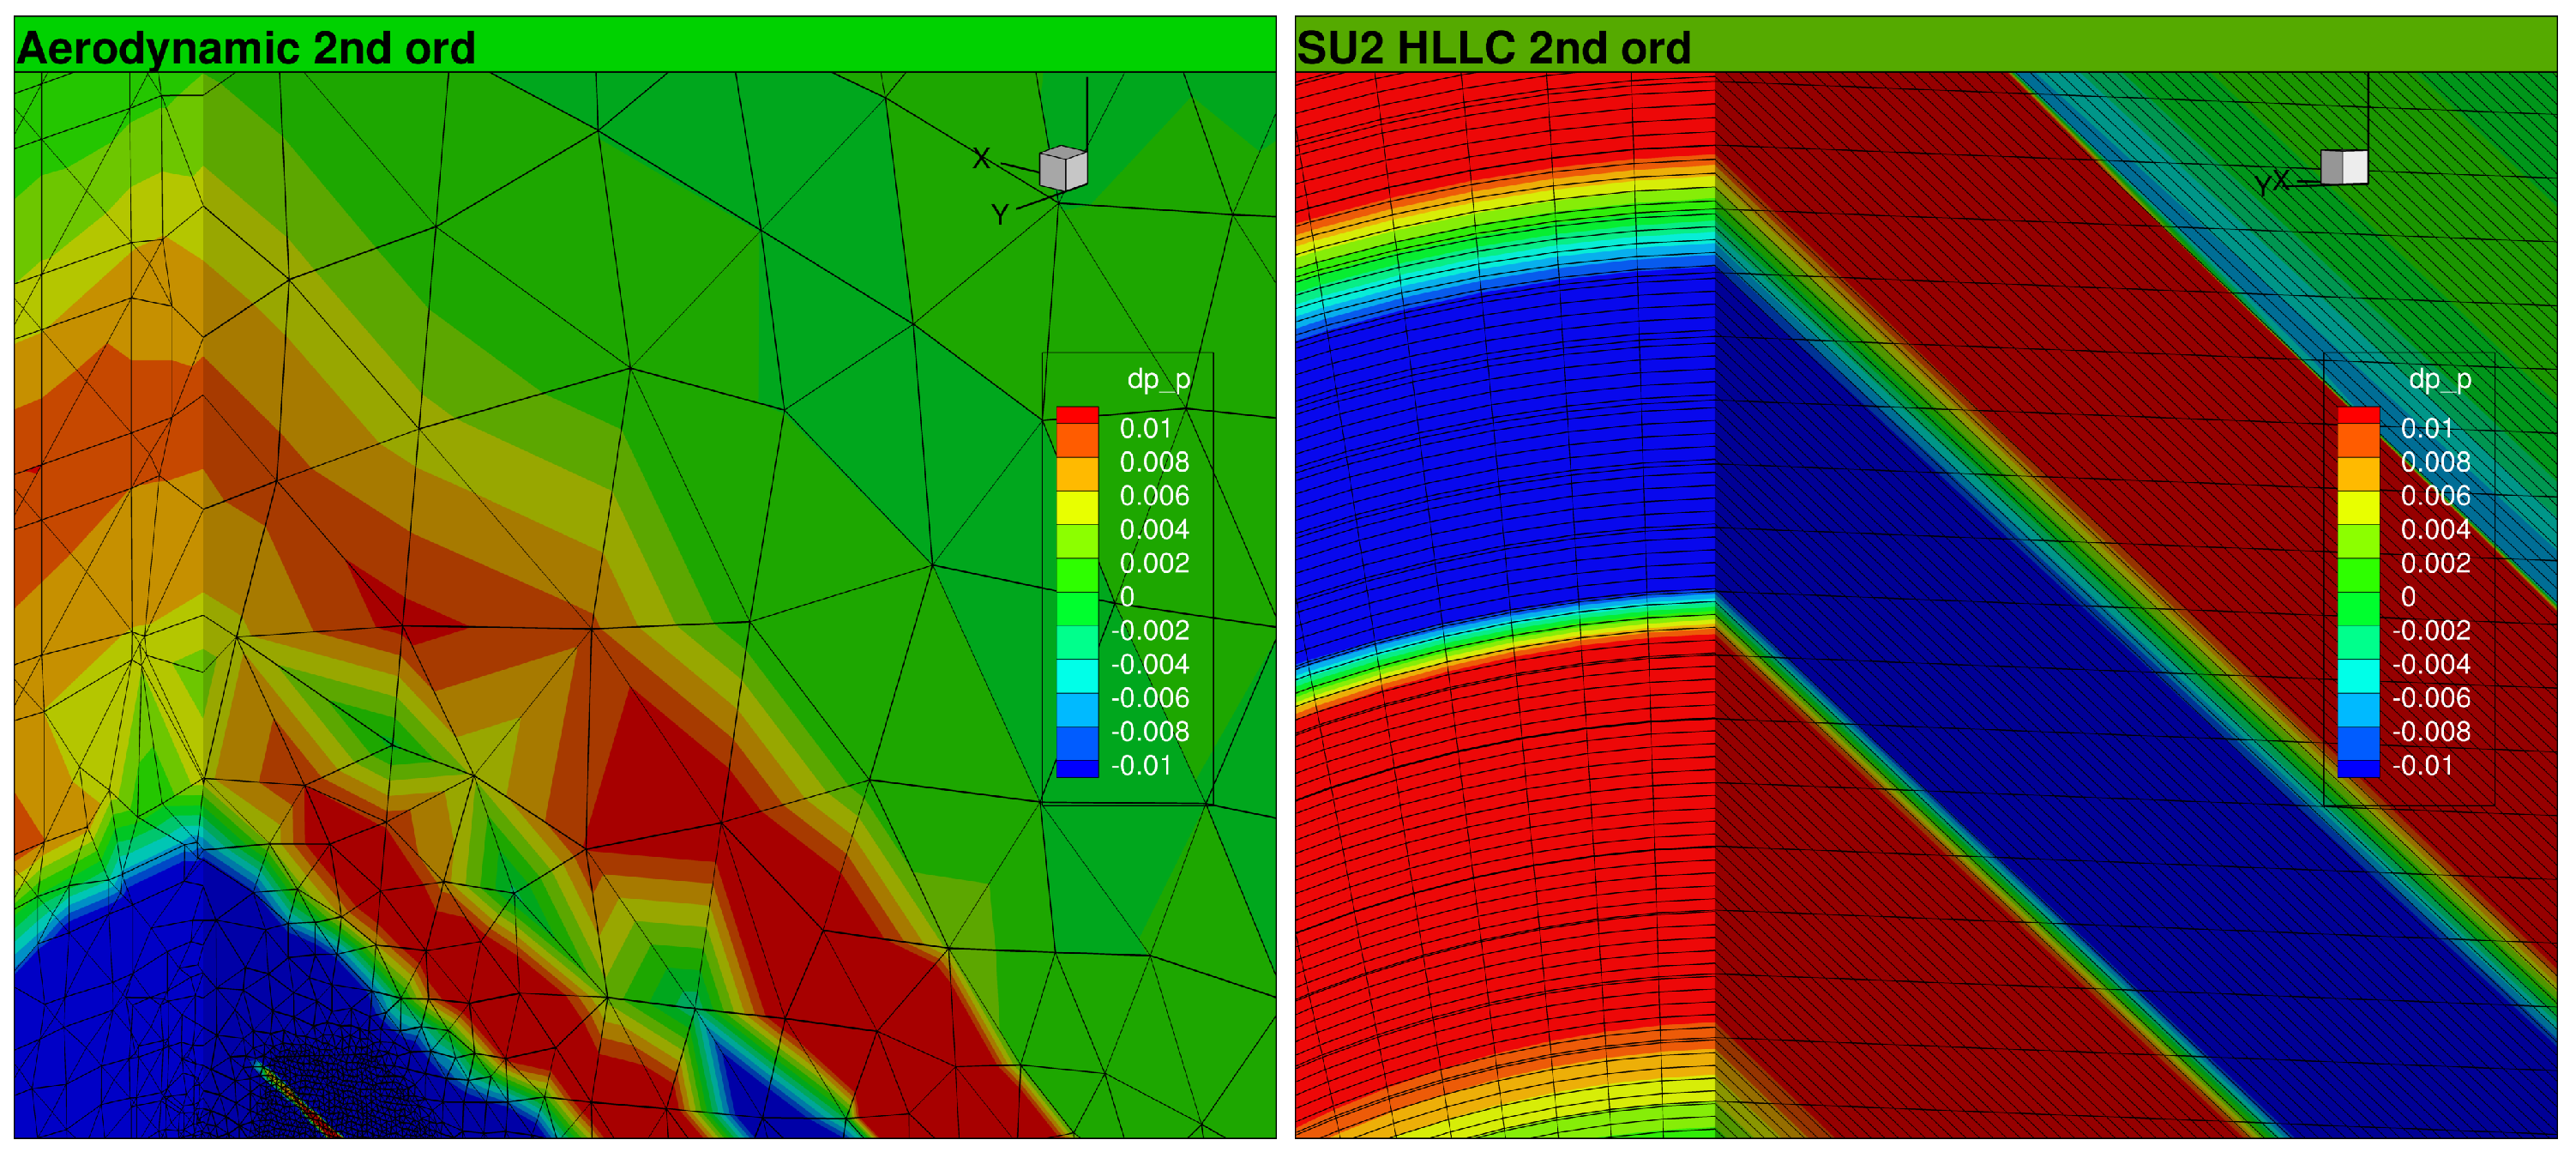
The limitations of the aerodynamic grid in resolving pressure fluctuations are clearly evident in Figure 23, which compares the pressure fields derived from the two different meshes. The aerodynamic grid introduced significant dissipation, distorting the pressure signal as it propagated away from the aircraft.
Simulations were performed using the HLLC scheme [27] following the procedures previously described for the AXIE and JWB test cases. The three aircraft were simulated under the operating conditions summarized in Table 2 to directly compare their acoustic performances.
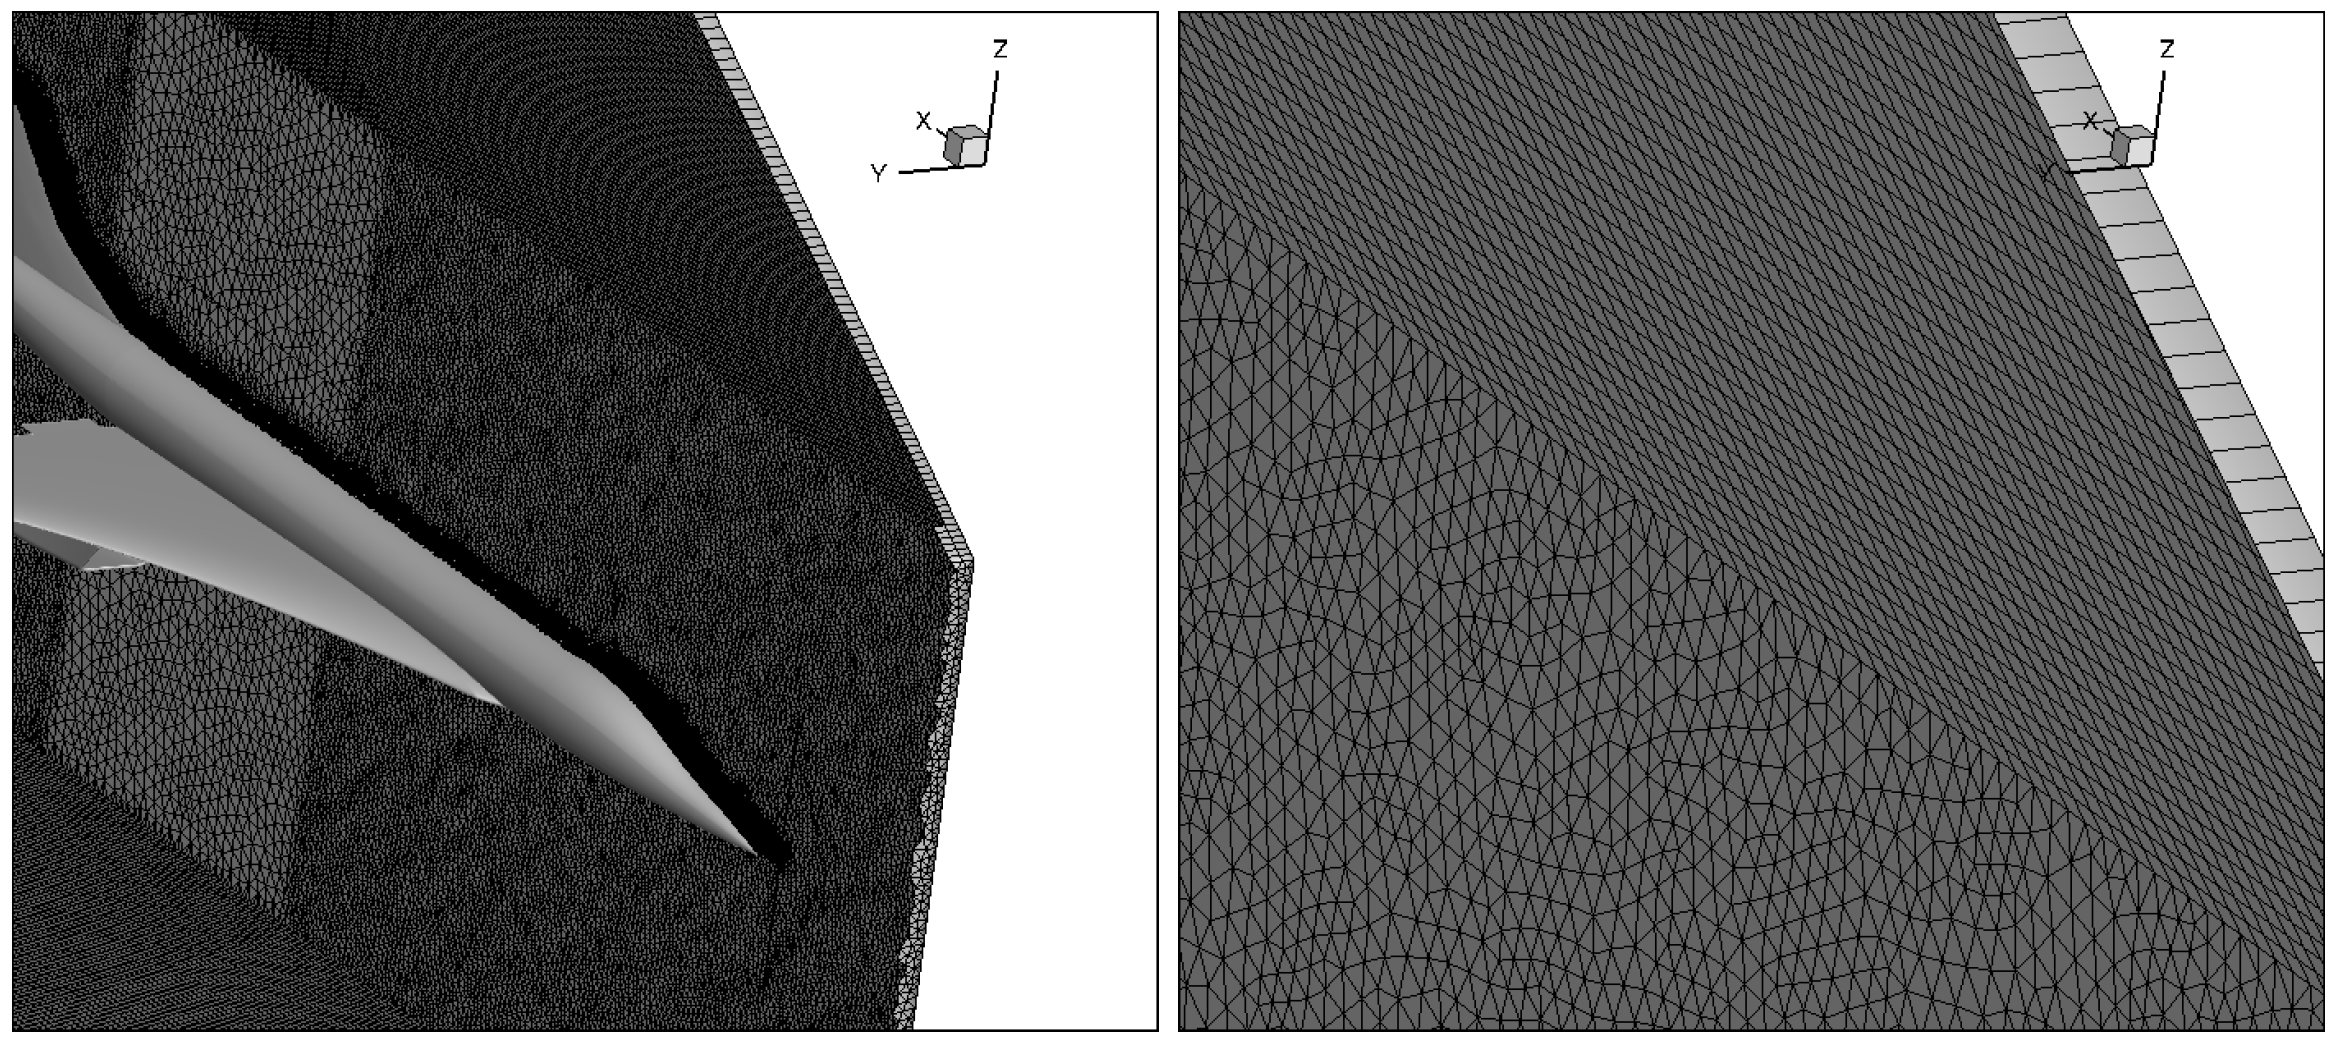
The hybrid grid used for the aeroacoustic analysis was generated according to the guidelines discussed in the earlier sections. As shown in Figure 24, the mesh consists of an unstructured inner region near the aircraft and a structured outer region aligned with the expected Mach cone for the specified flight conditions.

3.1. CS1 Geometry

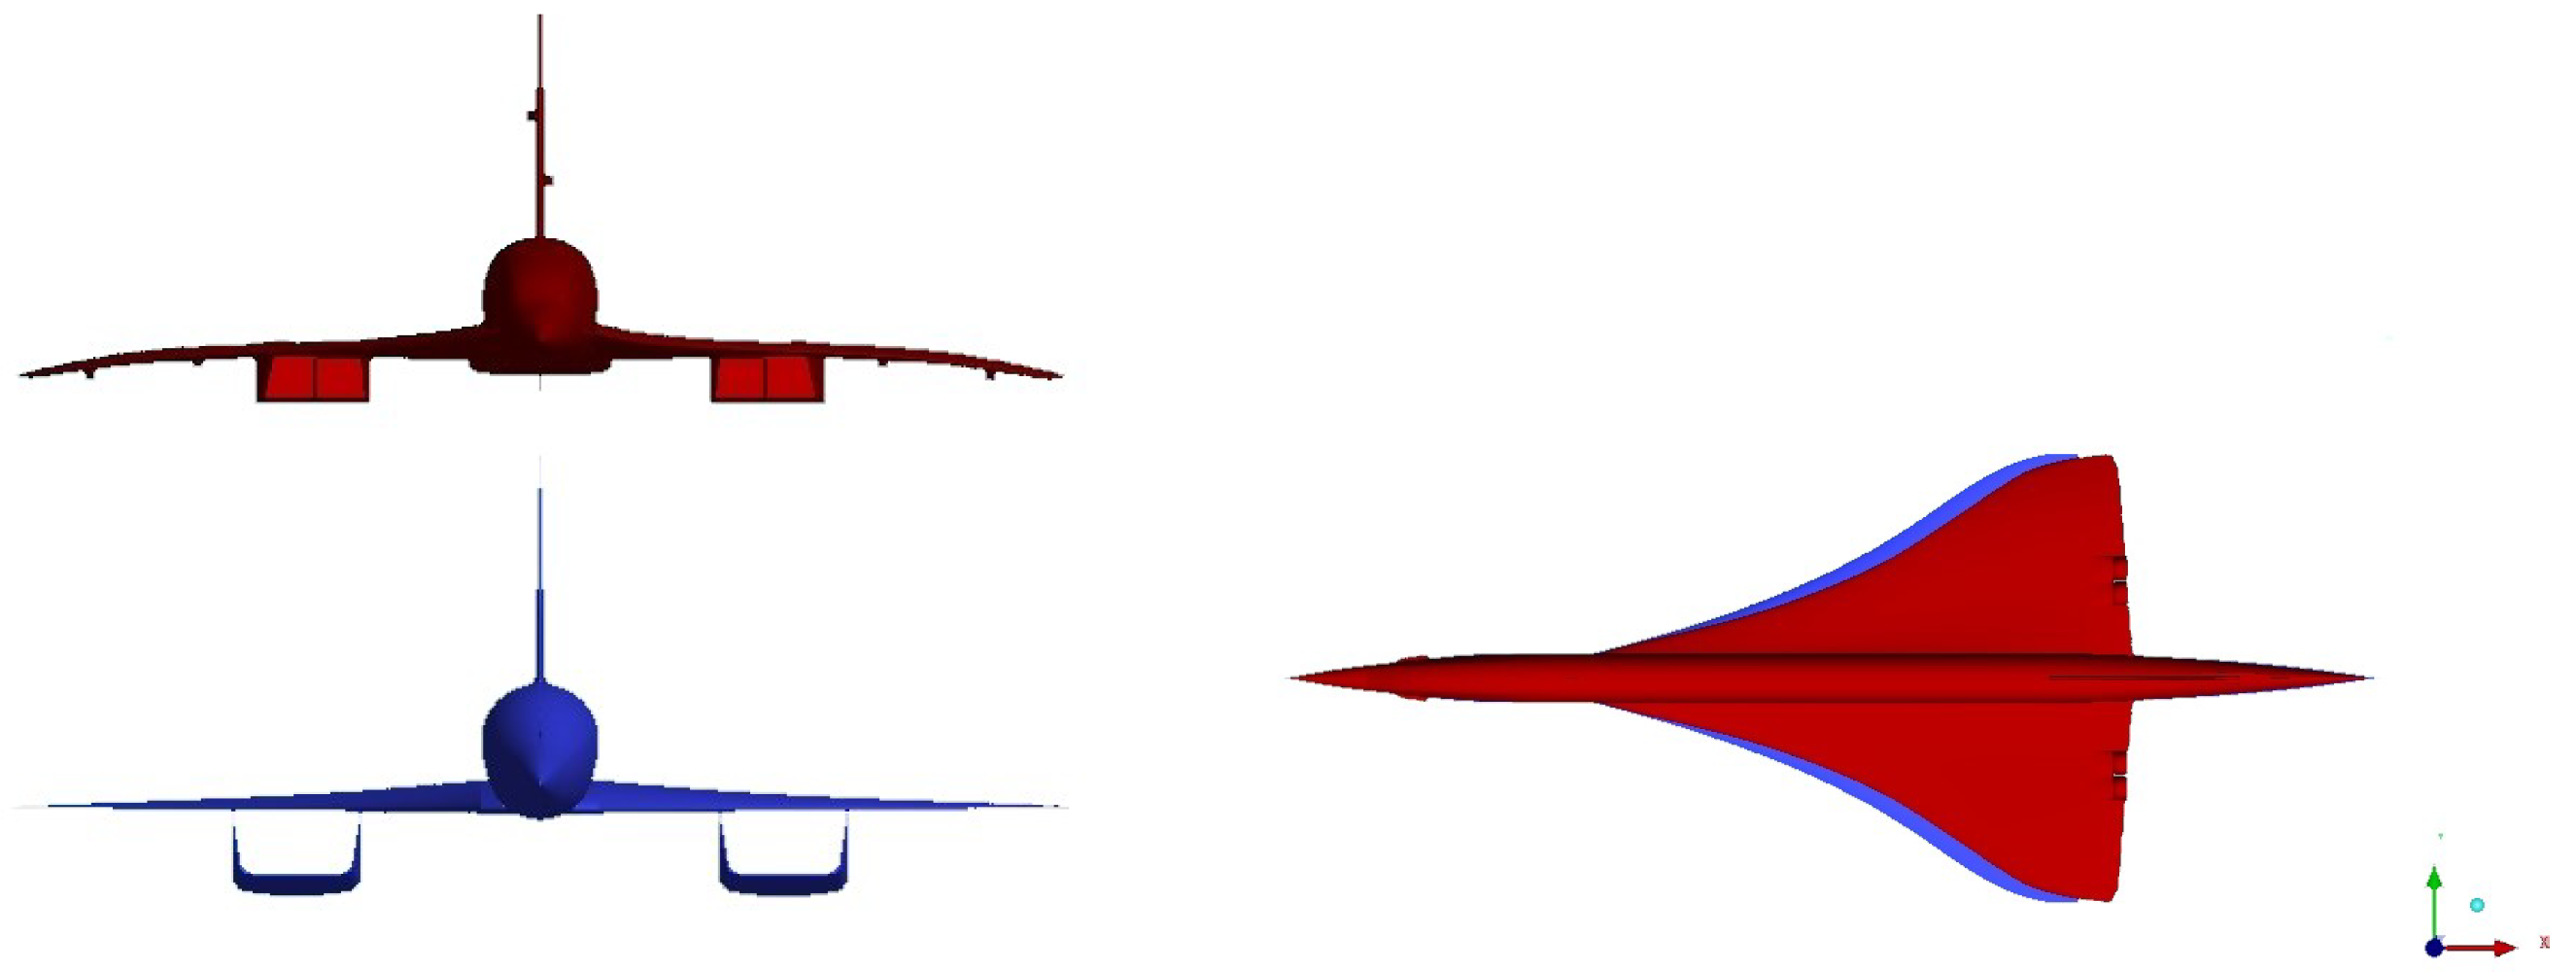
The first configuration under investigation, labeled CS1 and depicted in Figure 25, was developed as a conceptual design inspired by the Concorde. A side-by-side comparison of CS1 and the original Concorde is shown in Figure 26. The key geometric differences include a larger wing and a revised engine nacelle layout. The CS1 has a total length of 62 m and a wings surface area of 166.3 m2.
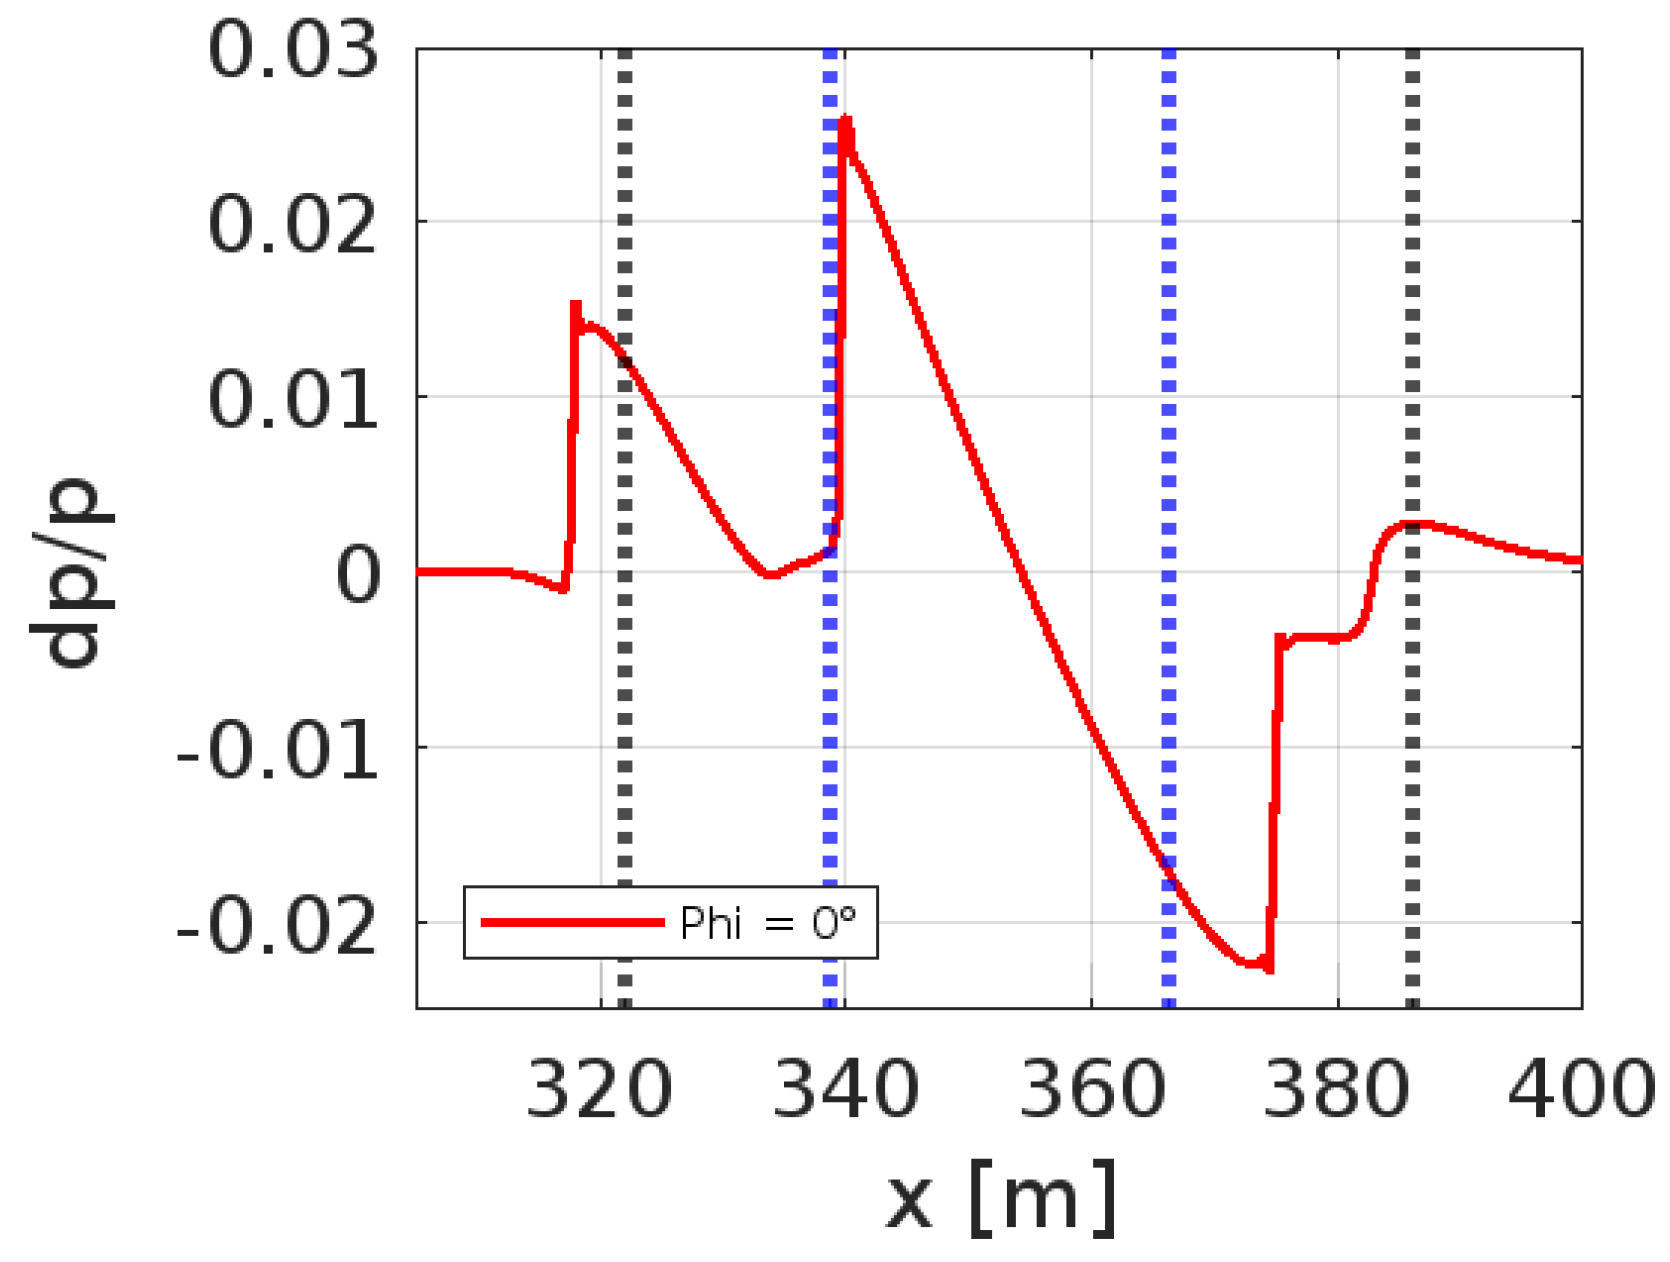
The computational mesh for the near-field aerodynamic simulations contained approximately 26.5 million elements. The pressure signature extracted at a distance of ( H L ) = 3 below the aircraft is shown in Figure 27. Similar to the JWB, the CS1 is marked by black lines for the nose and tail locations, while blue lines indicate the leading and trailing edges of the wings. Three primary pressure peaks were observed: two compression peaks from the nose and wing leading edge and a third expansion peak near the wing trailing edge.
Figure 28 presents similar profiles at ( H L ) = 1 and ( H L ) = 5 . Although the general structure was preserved, the amplitude of the pressure fluctuations changed with increasing distance from the aircraft, reflecting the typical propagation behavior.
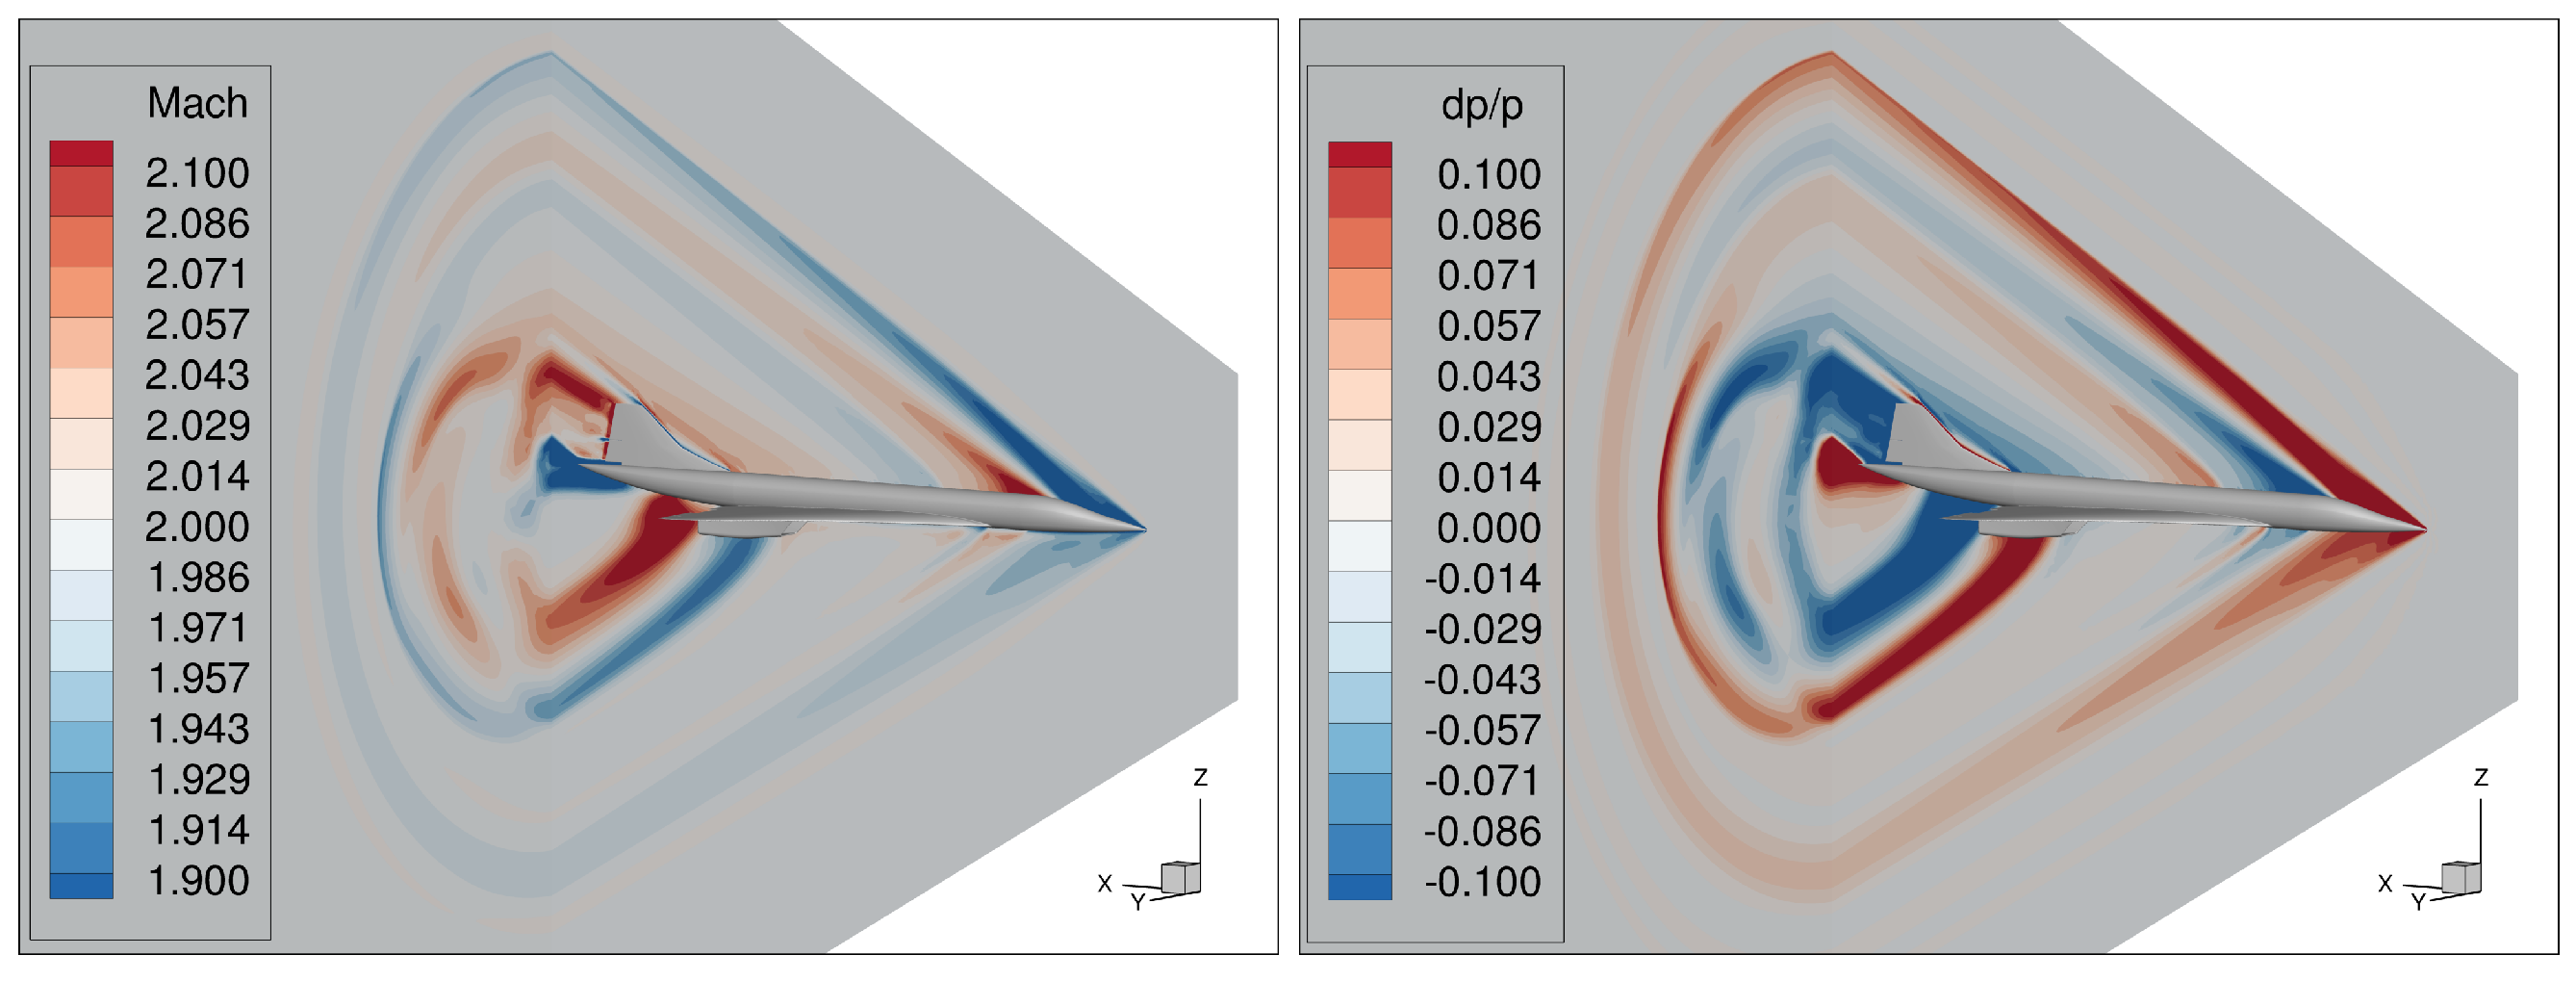
The contours of the Mach number and normalized pressure variation ( d p p ) are shown in Figure 29. The shock structures evident in the flow field are consistent with the pressure signature curves.
A detailed azimuthal analysis of the pressure field was also performed. Figure 30(left) illustrates the pressure signatures at different radial positions ϕ , where ϕ = 0 ° is below the aircraft and ϕ = 180 ° is above. The pressure distribution reveals significant asymmetries due to the complexity of the airframe, including the wings, nacelles, and empennage. The plot on the right of Figure 30 shows the maximum pressure values in dB in a polar plot, confirming both the geometric influence and the expected decay of noise intensity with distance.

3.2. CS2 Geometry

The second configuration considered in this study, identified as CS2, is depicted in Figure 31. This aircraft represents the second design iteration developed within the framework of the European MORE&LESS project. It features a fuselage length of approximately 24.53 m and a wing planform area of 40.77 m2.
CS2 was designed by Reaction Engines, a project partner, as a platform for testing advanced supersonic and hypersonic propulsion systems. For the purposes of the present analysis, the model was evaluated in a clean configuration without additional engine installations above the fuselage.
The computational grid used for the simulations has roughly 11.6 million elements. Figure 32 presents the pressure distribution extracted below the aircraft at a non-dimensional distance of ( H L ) = 3 . As in the CS1 case, the beginning and end of the fuselage are marked by vertical black lines, and the blue line represents the leading and trailing edges of the main wing.
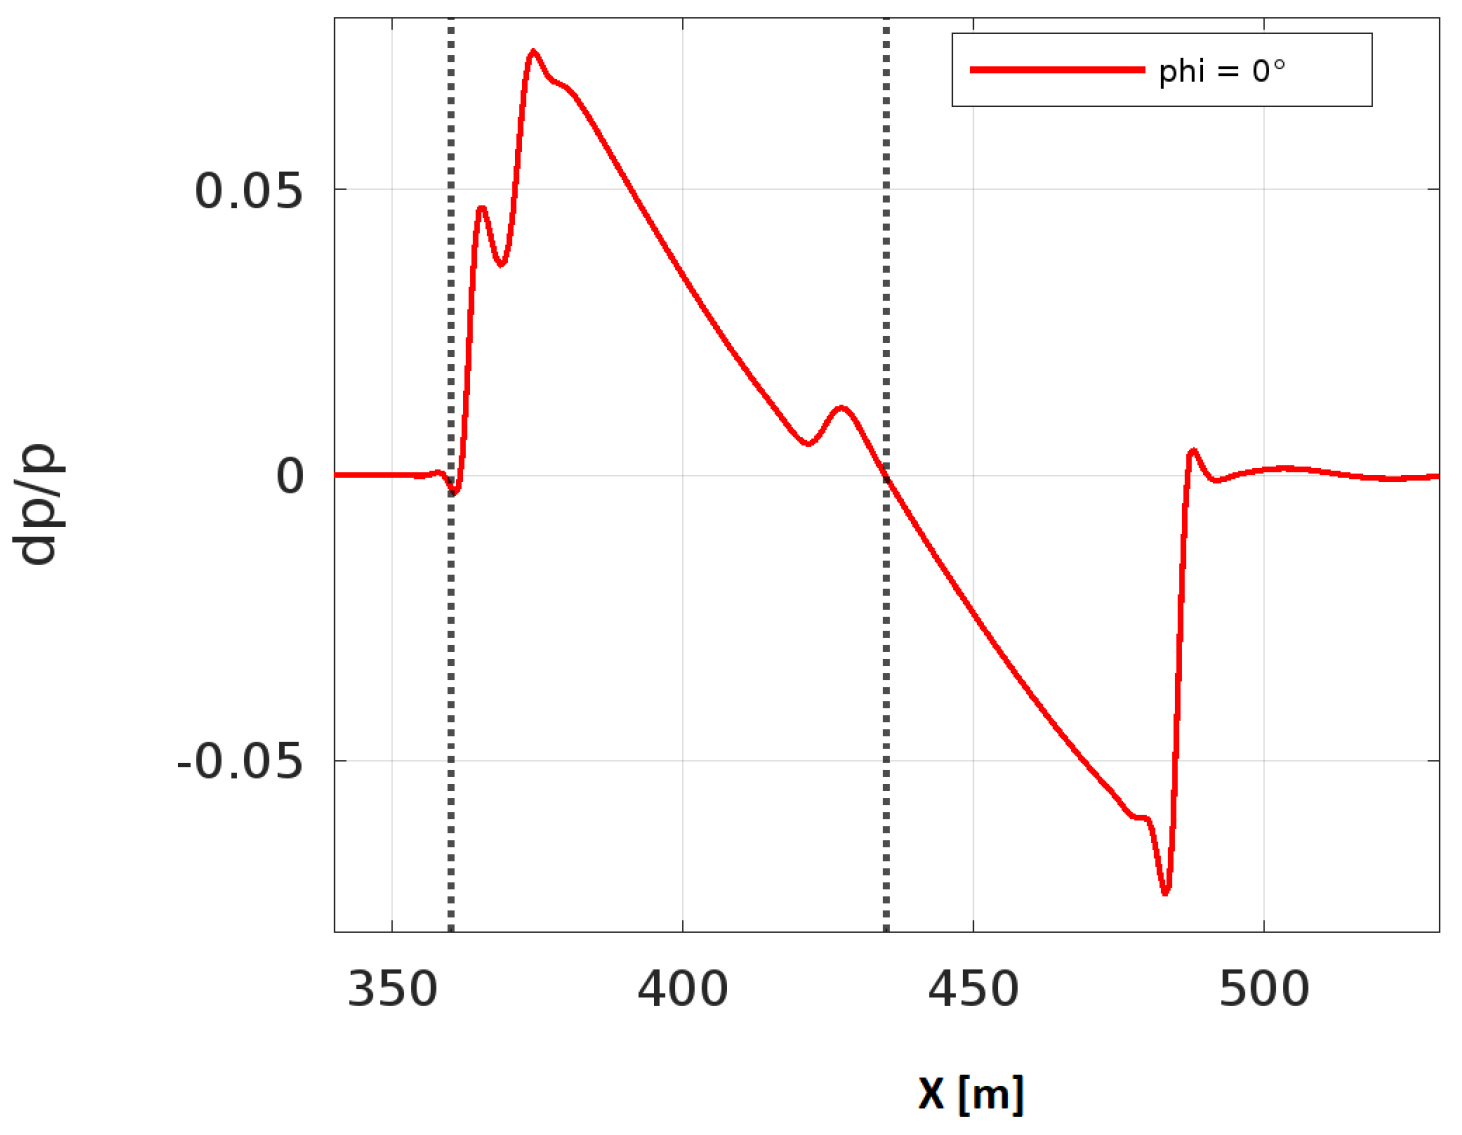
The waveform exhibits three minimum expansion peaks and two compression peaks. The initial peak corresponds to the nose and canard surfaces, the second is associated with the beginning of the main wing, and the final pressure variation is linked to the rear part of the fuselage, as well as the recovery and return to the freestream flow.
Additional pressure profiles at ( H L ) = 1 and ( H L ) = 5 are shown in Figure 33. The qualitative shape of the waveform remains similar at all distances, but the magnitude of pressure fluctuations varies because of the different propagation distances, as expected due to the physics of the problem.
The flow field around the CS2 airframe is further detailed in Figure 34, which shows the contours of the Mach number (left) and the relative normalized pressure gradient d p p (right). These visualizations confirm the presence of well-defined expansion and compression regions, which is consistent with the pressure profiles discussed above. Overall, the flow characteristics observed around CS2 are in line with those observed around CS1, and these results reflect similarities in the aerodynamic configurations; both have a streamlined fuselage, main wings, and additional aerodynamic surfaces.
The same methodology that was applied for CS1 was adopted to evaluate the pressure signature along different azimuthal directions. Figure 35 shows the variation in the pressure signature at different radial angles from ϕ = 0 ° to ϕ = 180 ° , extracted at ( H L ) = 3 . As expected, the strongest pressure disturbances occurred below and above the aircraft, depending on the angle of the radial extraction.
The plot on the right of Figure 35 presents the peak pressure values converted to dB at the three reference distances used throughout this work. As previously observed for CS1, the acoustic field around CS2 was asymmetric, and the sound intensity decayed with distance due to wave spreading and numerical viscous attenuation effects.

3.3. CS3 Geometry

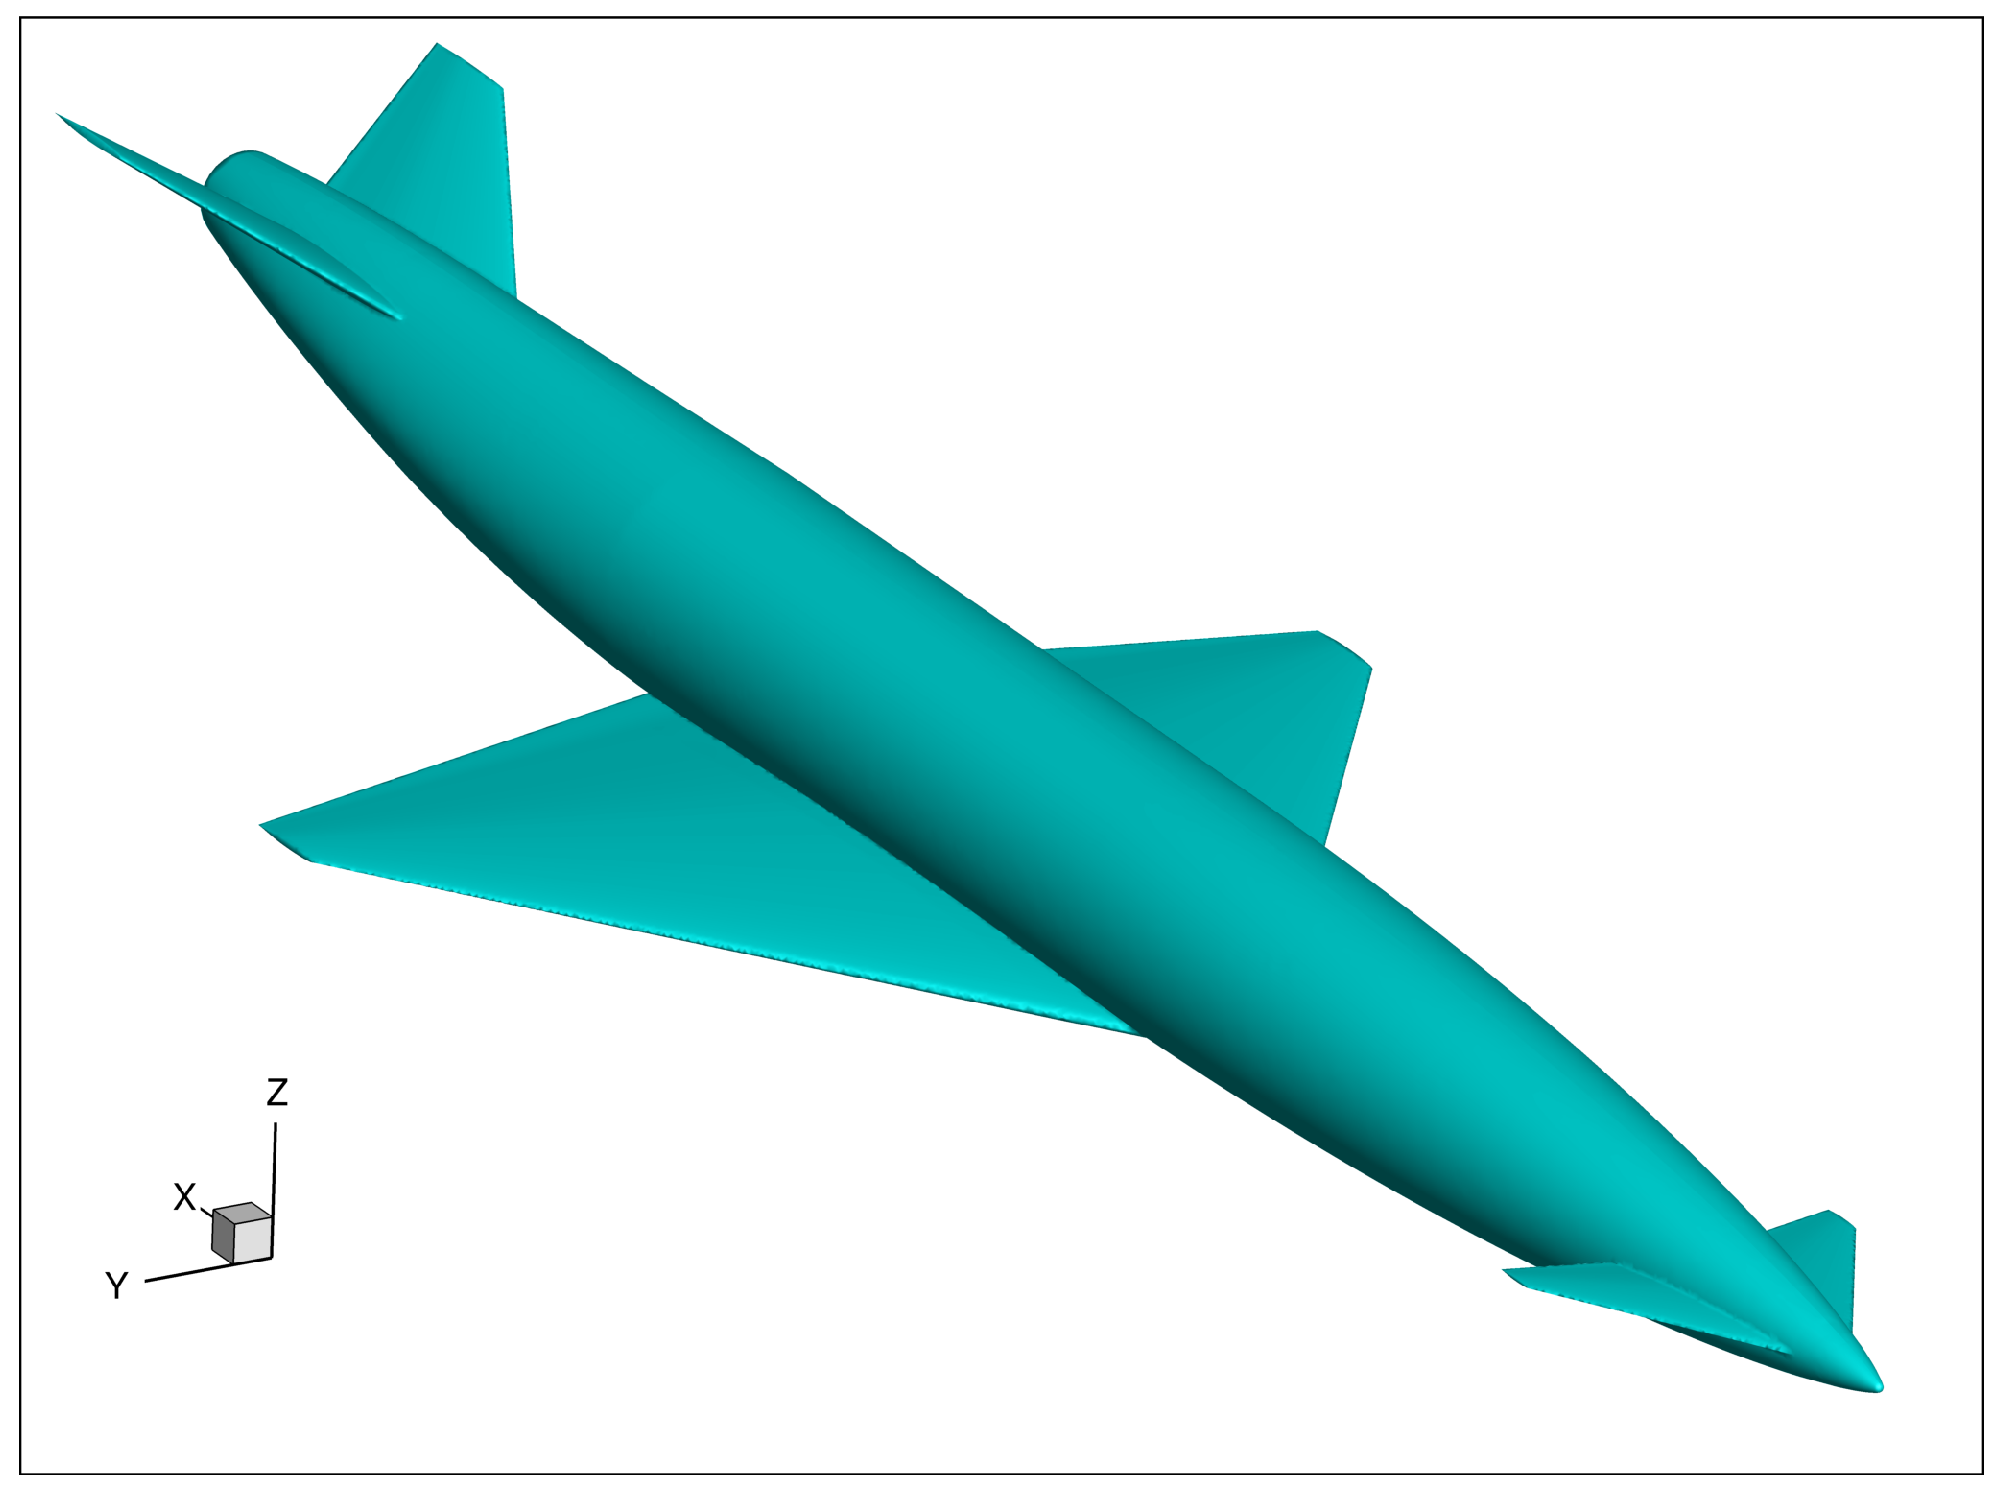
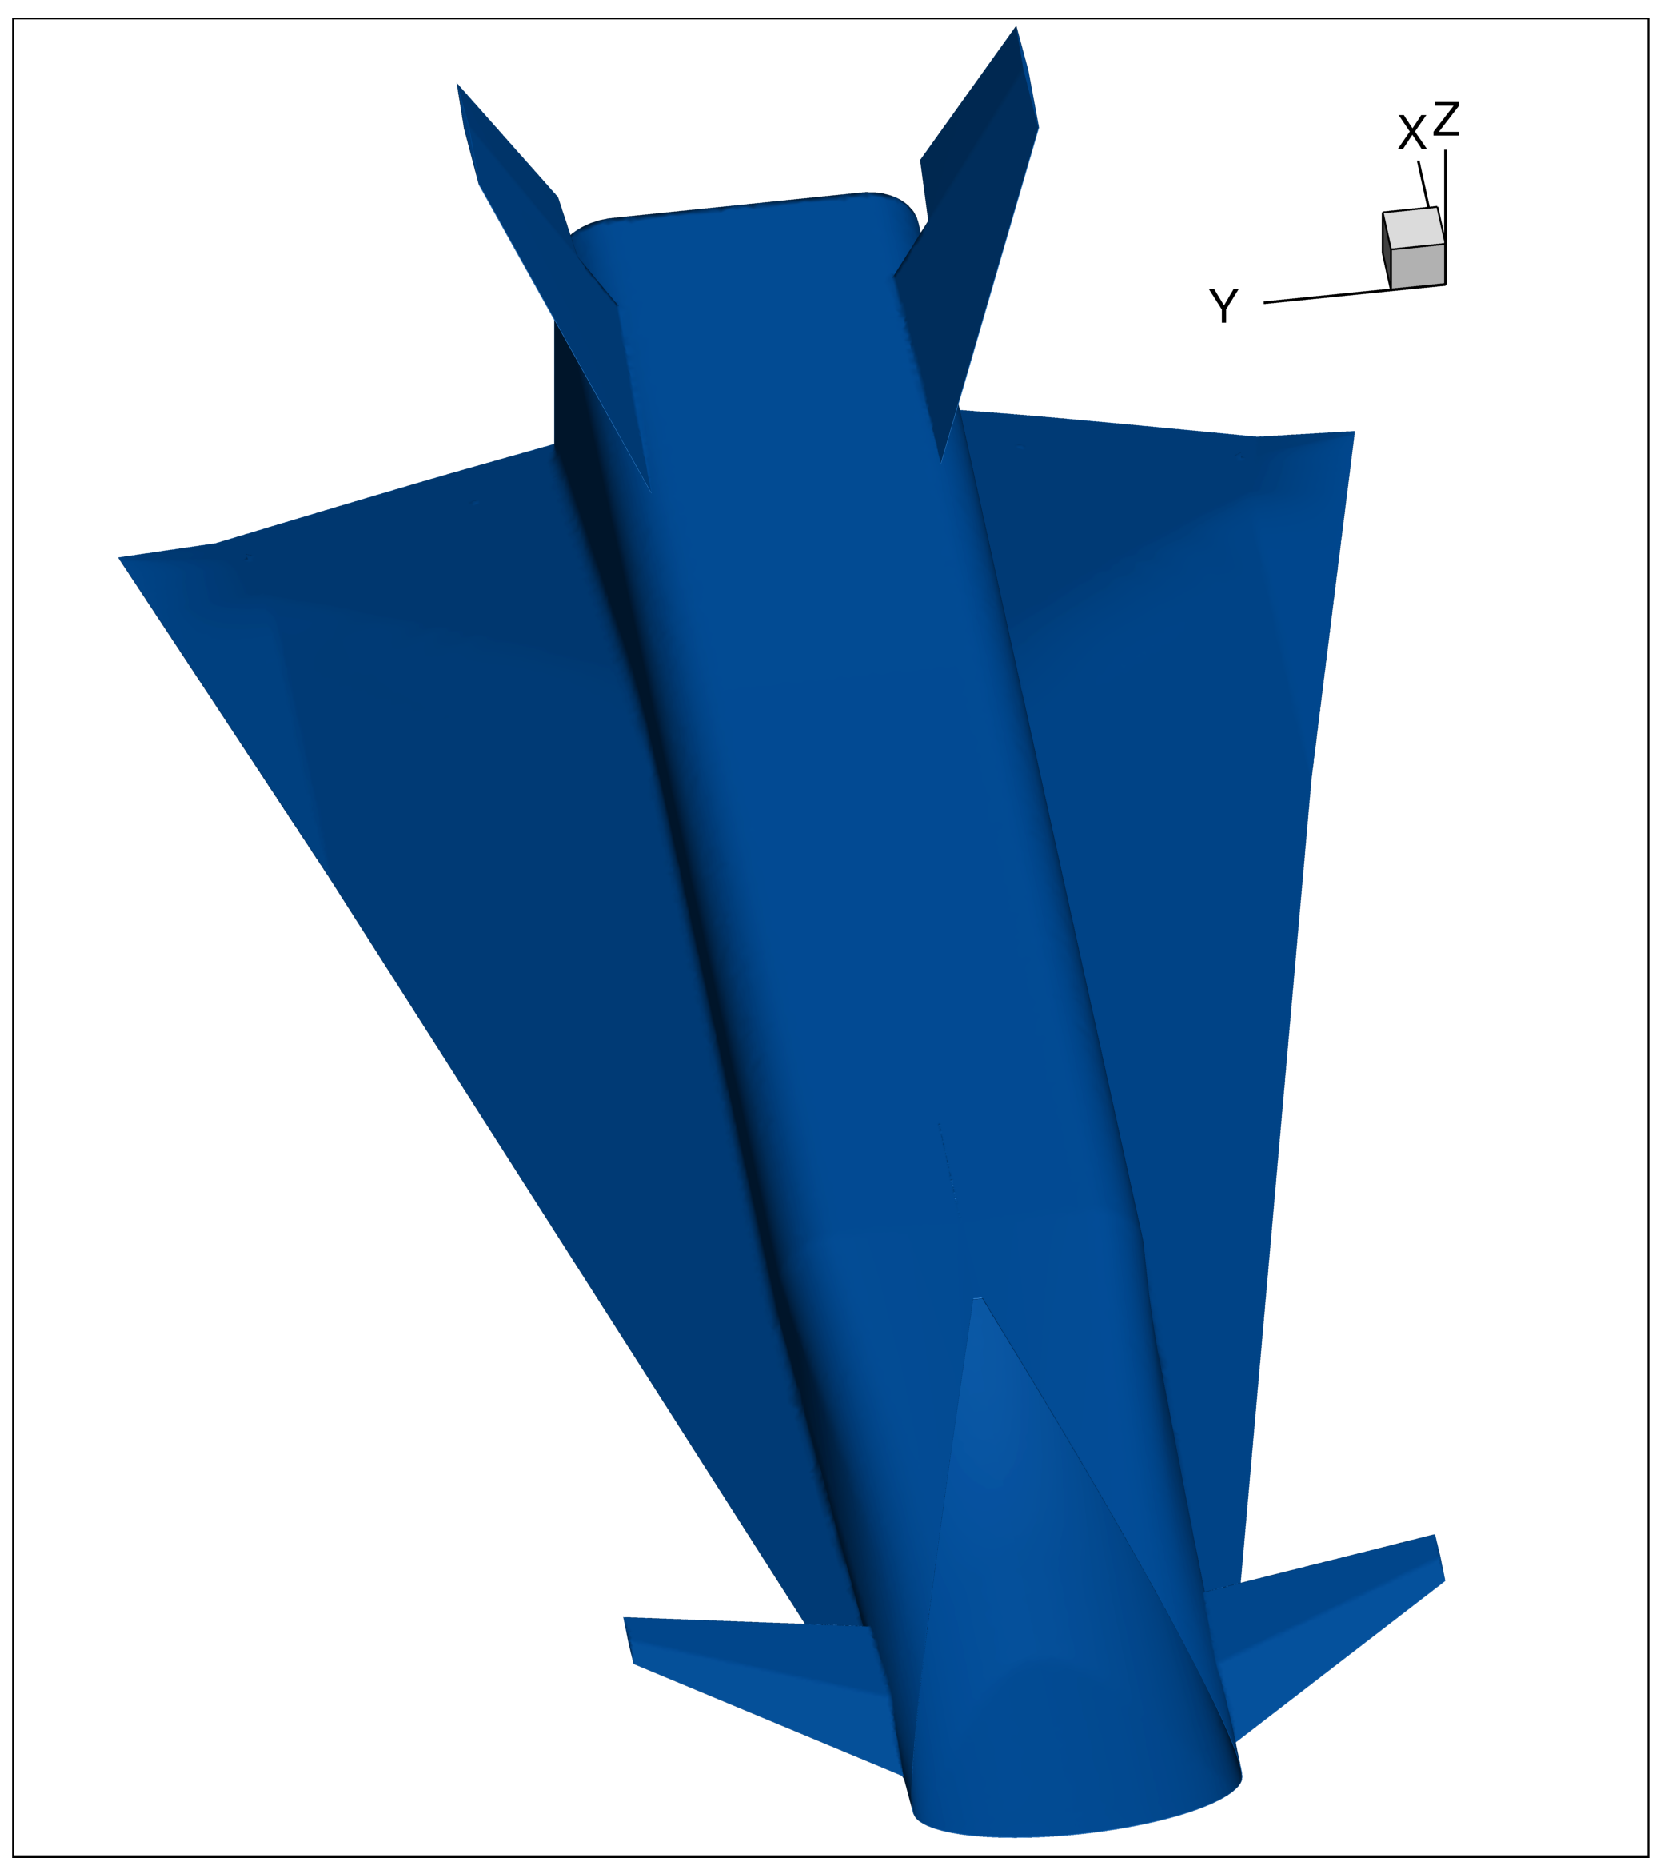
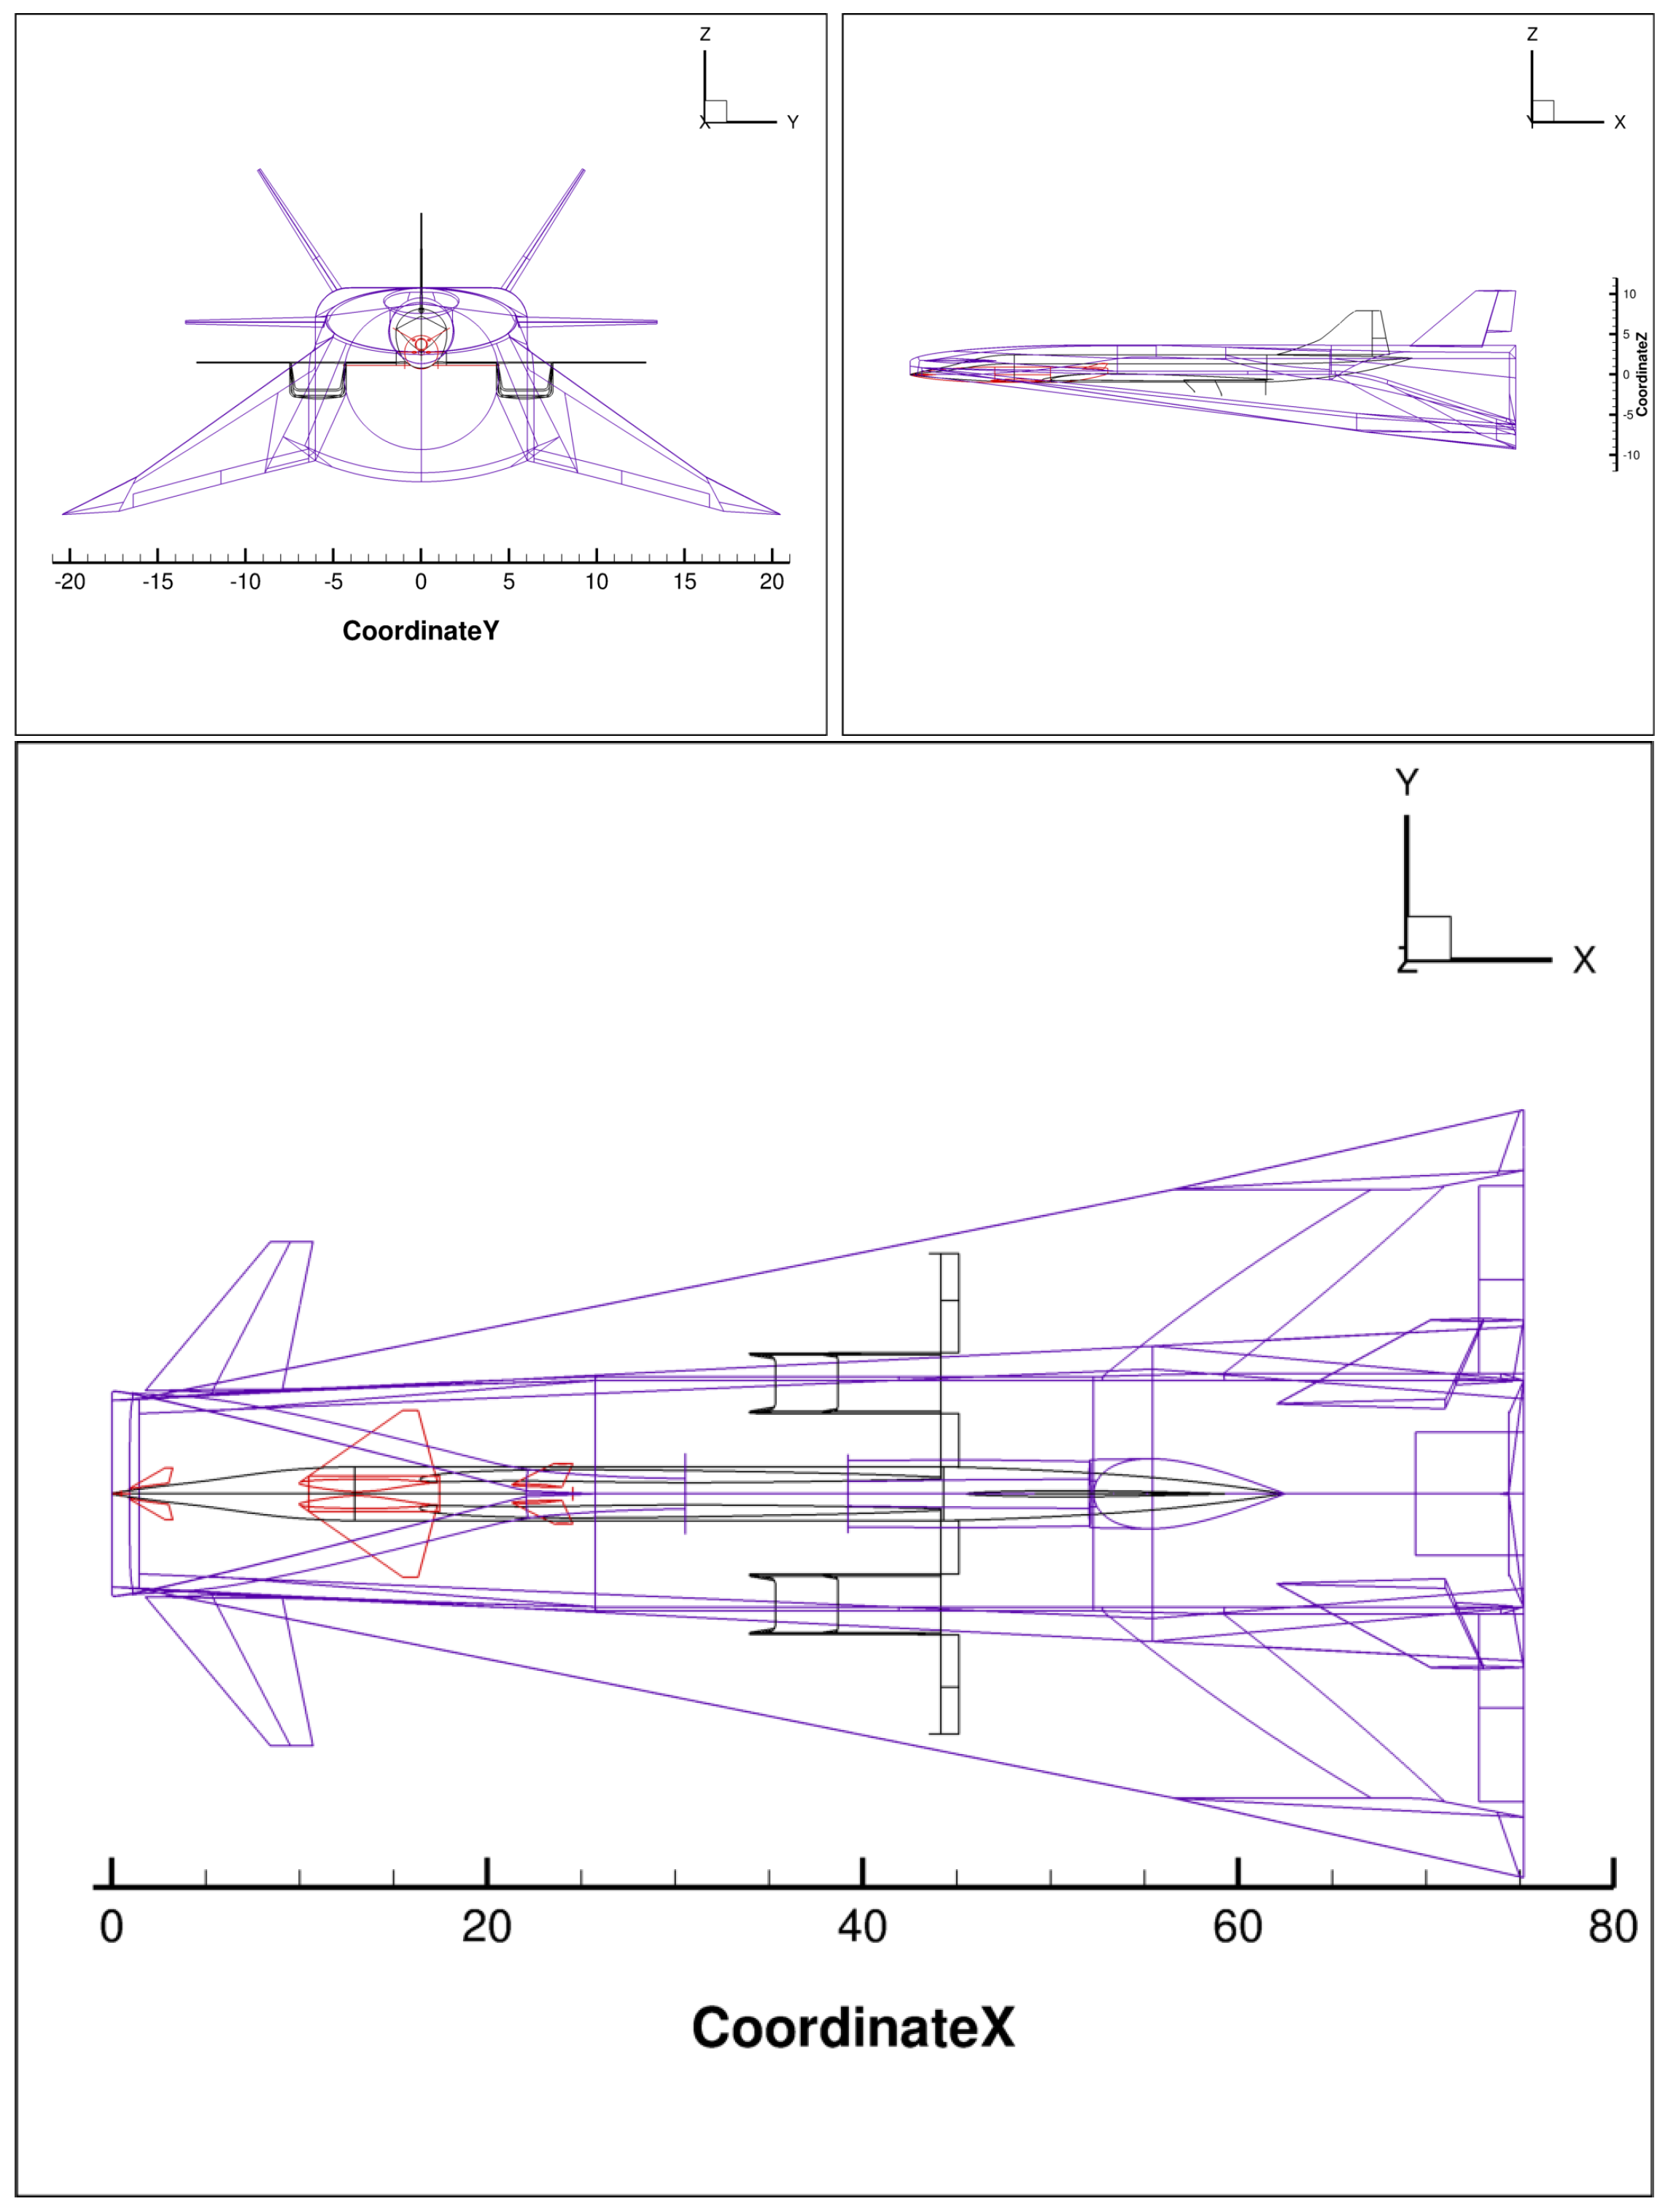
The third and final aircraft configuration analyzed, labeled CS3, is shown in Figure 36. This vehicle is derived from a hypersonic platform originally designed within the STRATOFLY project [34], where it was intended to operate at speeds up to Mach 8. The design was adapted to meet the performance requirements of the MORE&LESS project. CS3 features a total body length of 75 m and a reference wing area of 1000 m2.
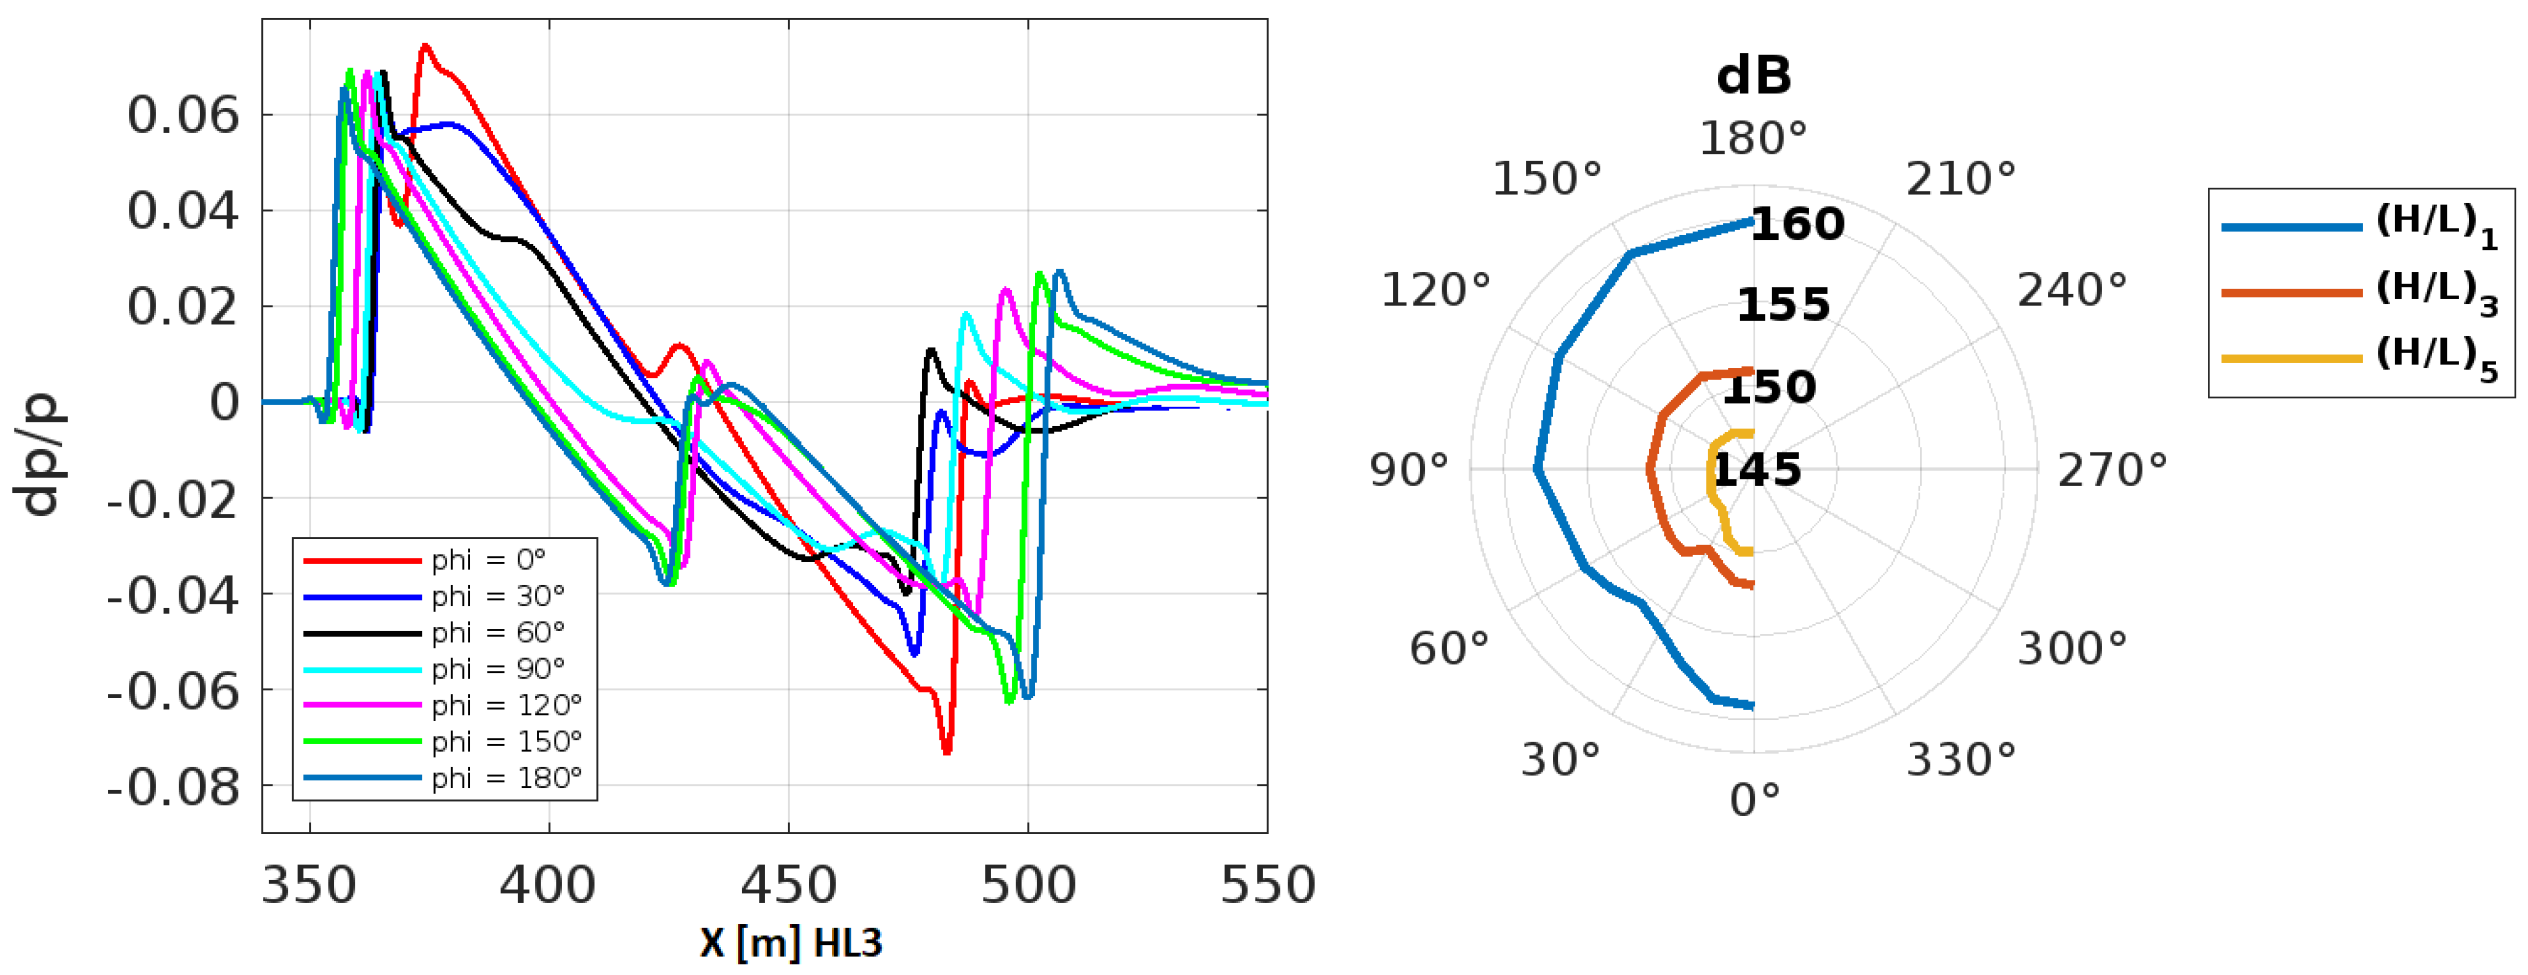
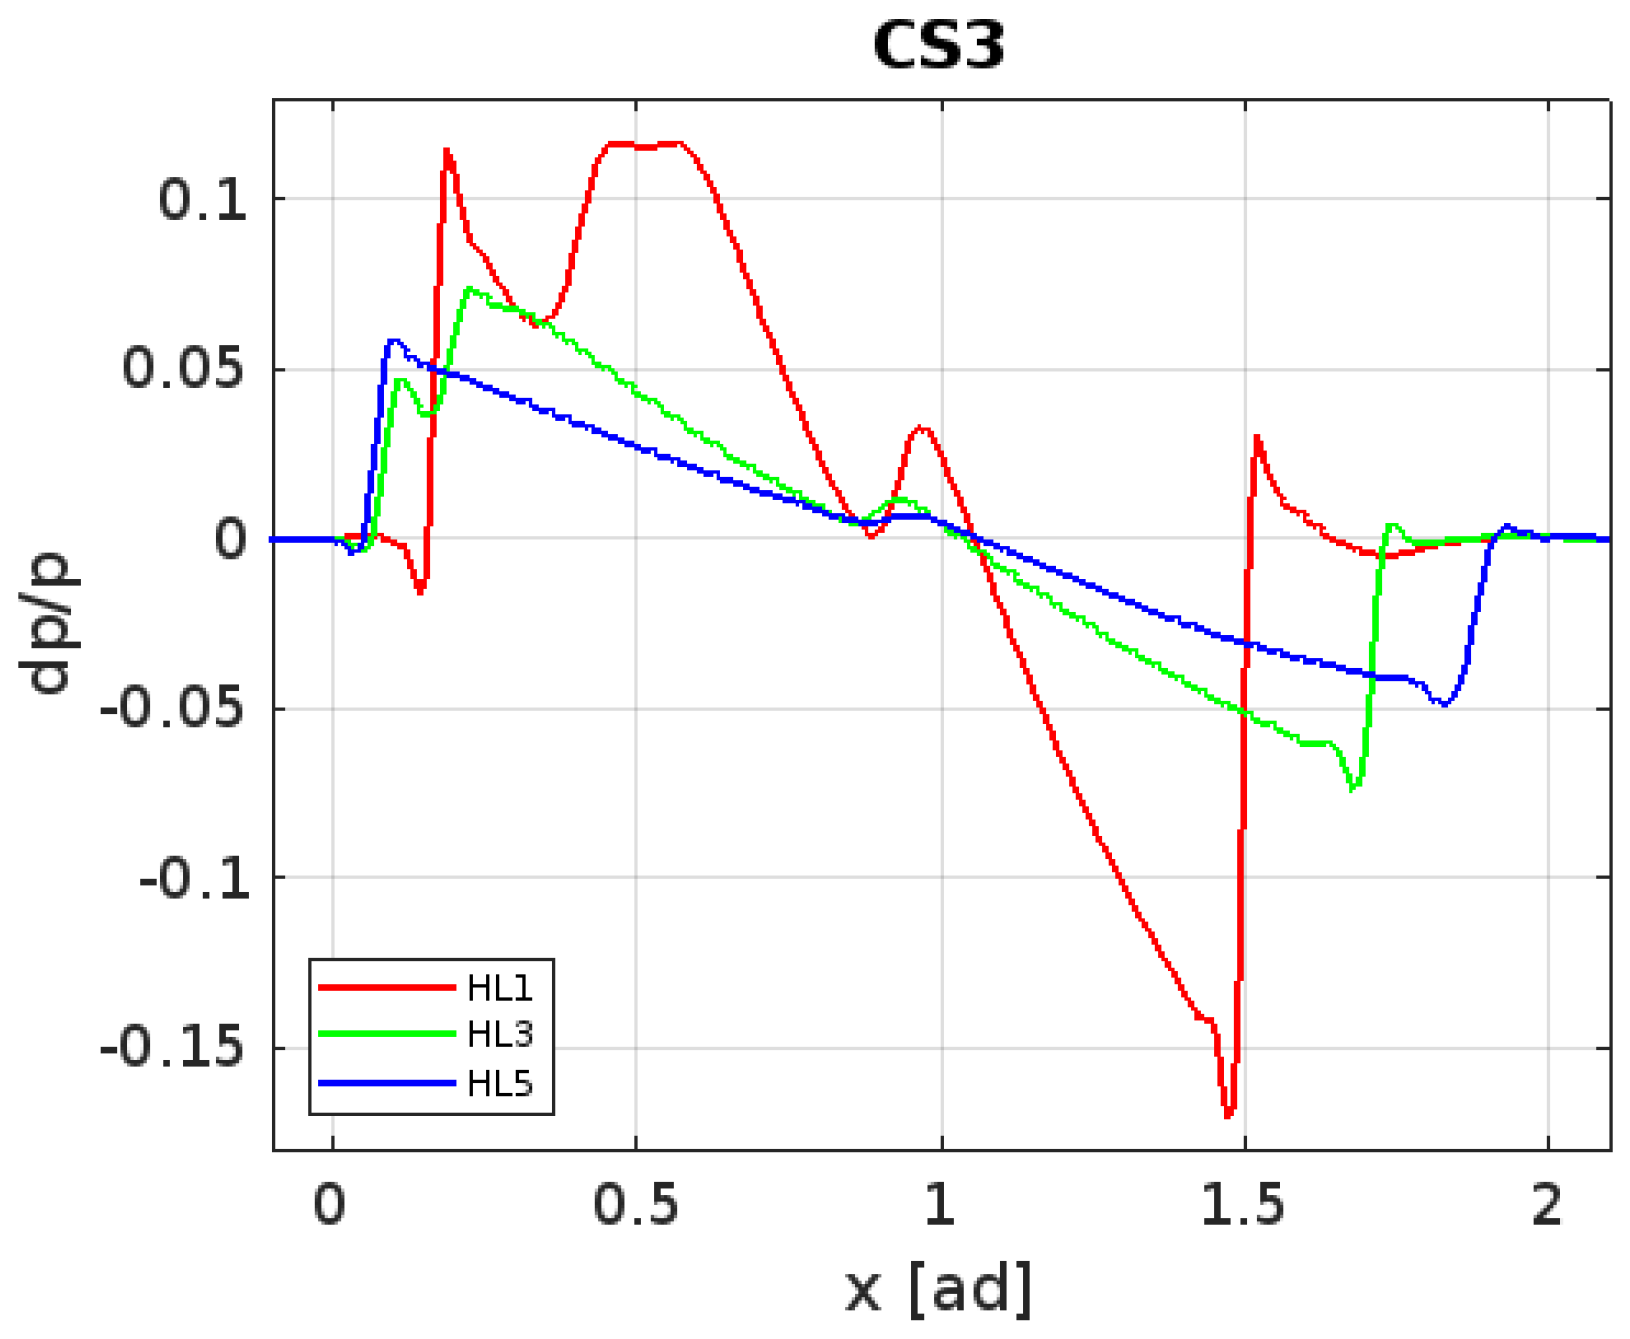
The simulations were performed using a computational mesh with approximately 13 million elements. As with the previous configurations, CS3 was analyzed under identical flow conditions as for the distances of the extracted results. Because CS3 is a wing–body aircraft, only the black line is visible in the plot since the black and blue lines are coincident. Figure 37 presents the resulting pressure signature, which shows the typical N-wave shape that is characteristic of slender high-speed vehicles. Minor secondary peaks appear near the principal compression and expansion regions and are attributable to the canard surfaces in the forward part of the fuselage.
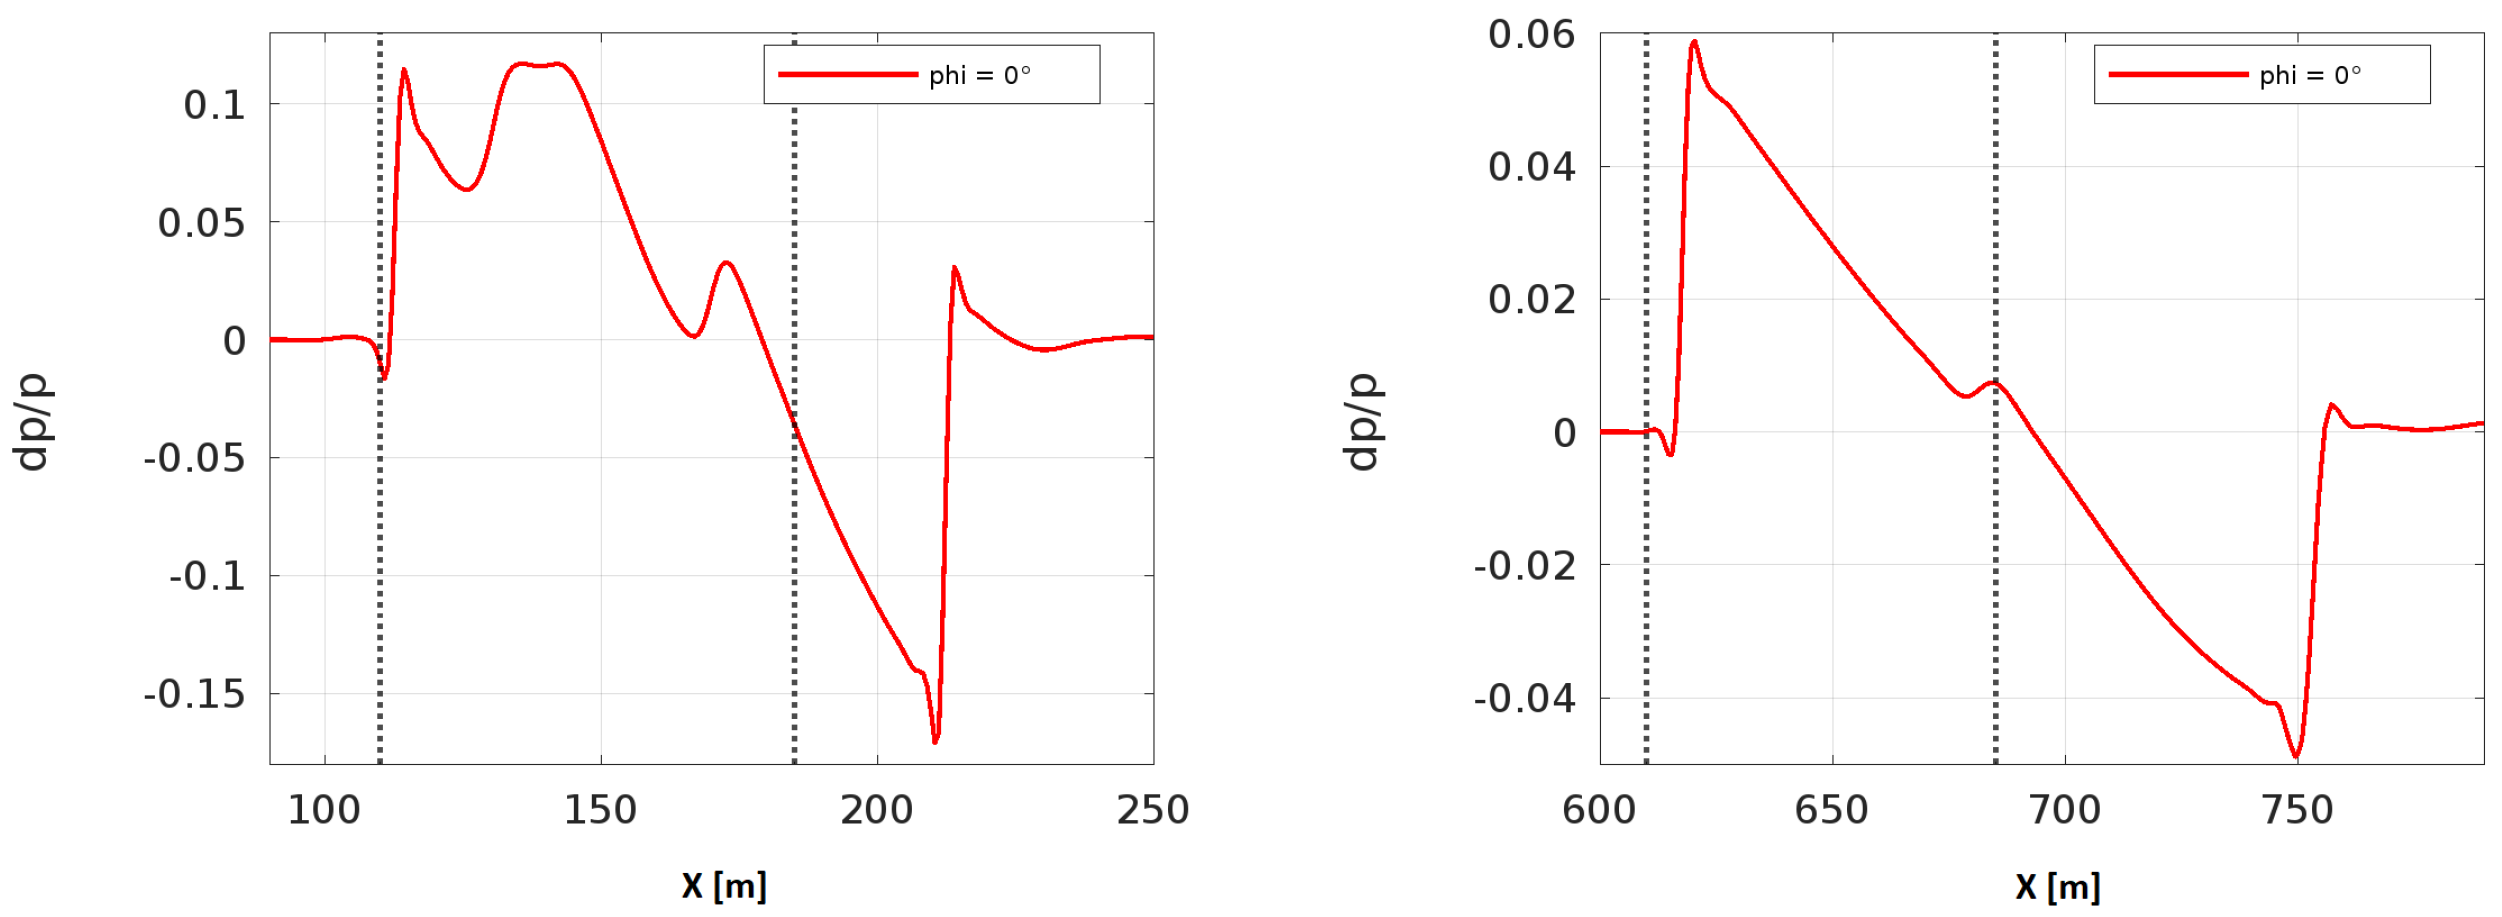
Figure 38 shows the behavior of the pressure signal at closer and farther distances, specifically, at ( H L ) = 1 and ( H L ) = 5 . At ( H L ) = 1 , the signature began to resemble an N-wave, but was still affected by the proximity to the aircraft, where the flow was not fully developed. At the farther location, ( H L ) = 5 , shock dissipation and wave coalescence produced a more regular and smoothed N-wave profile.
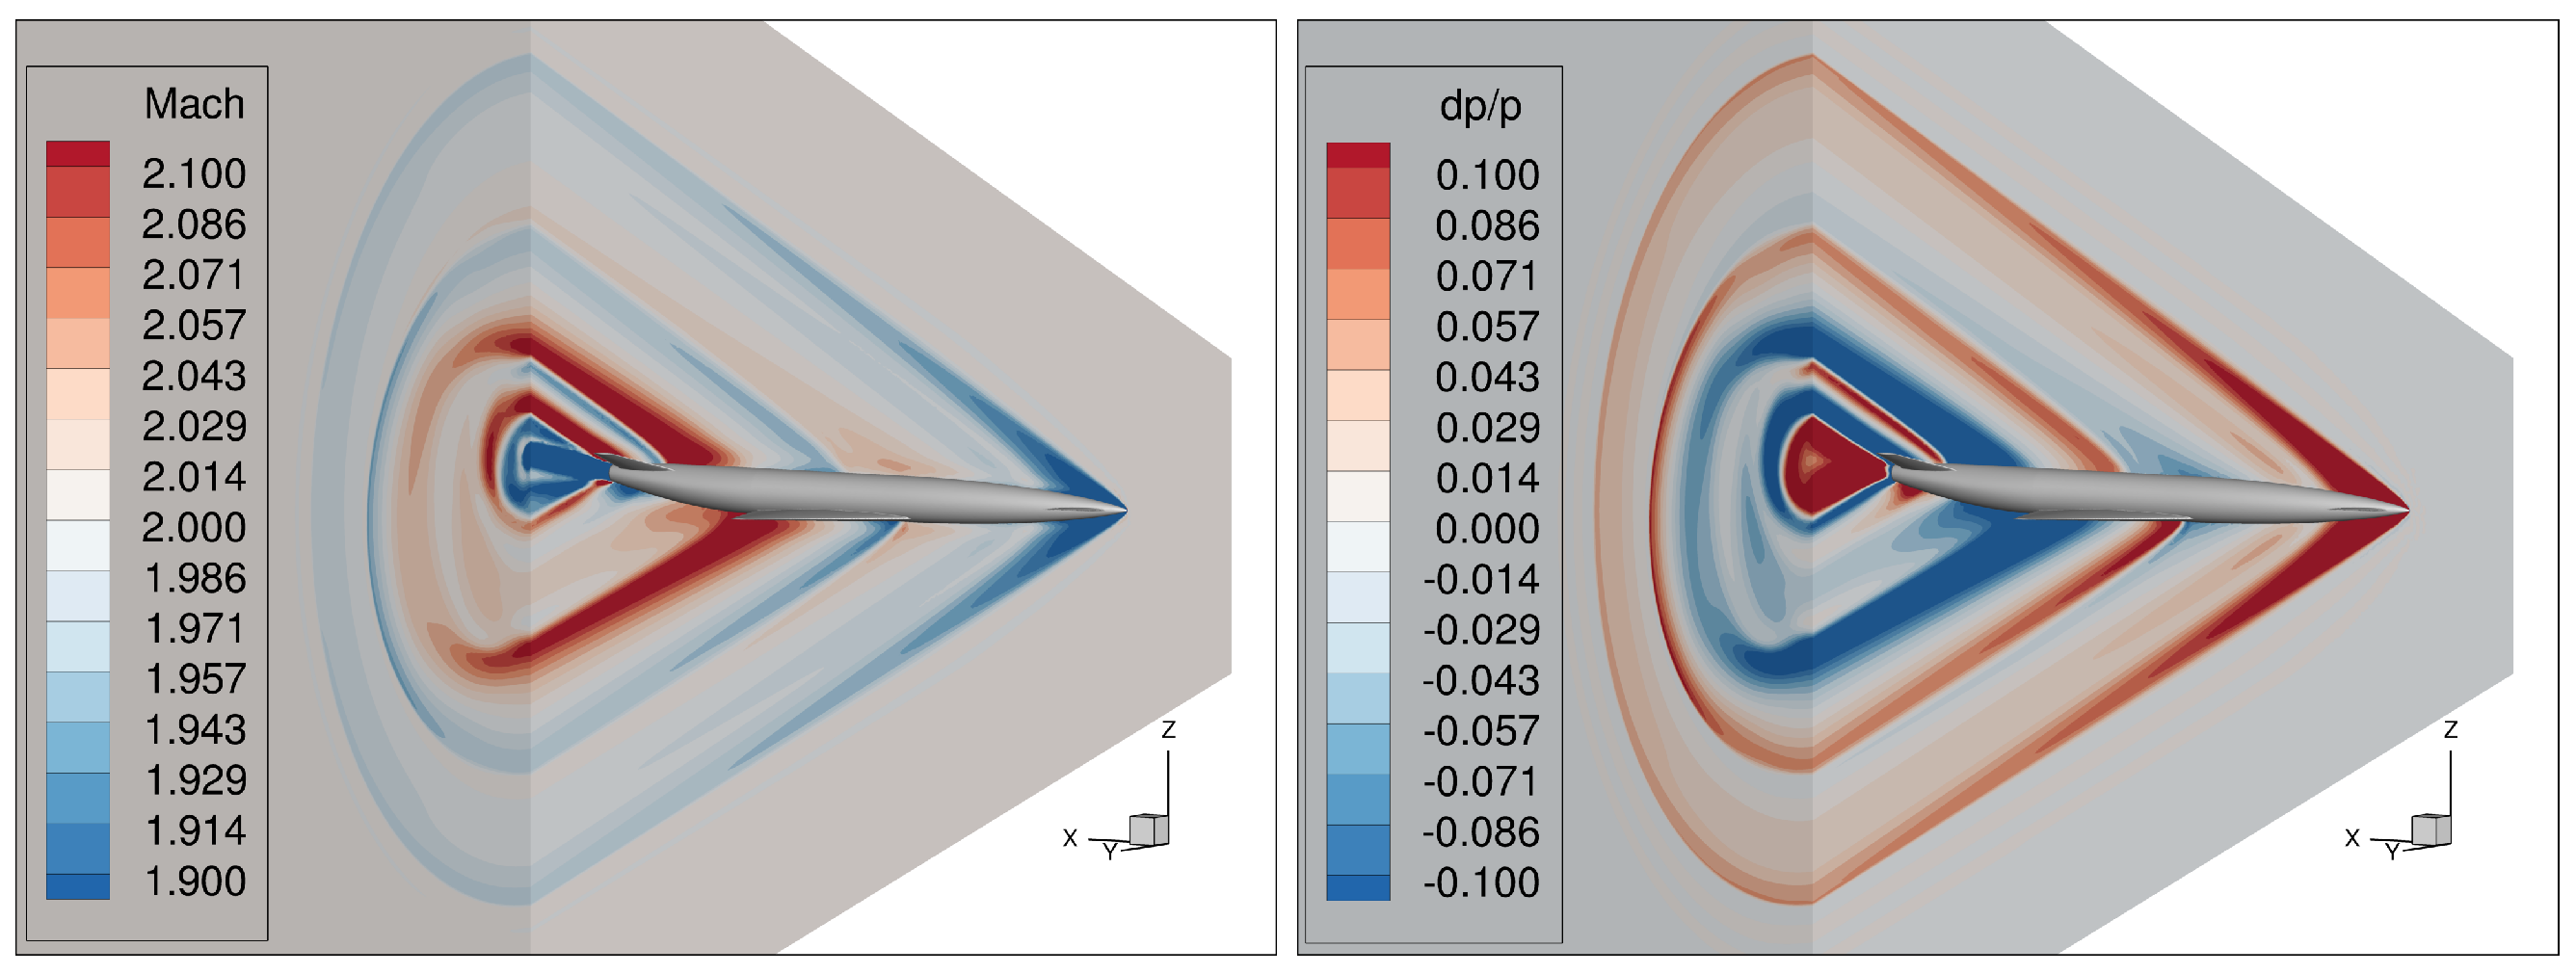
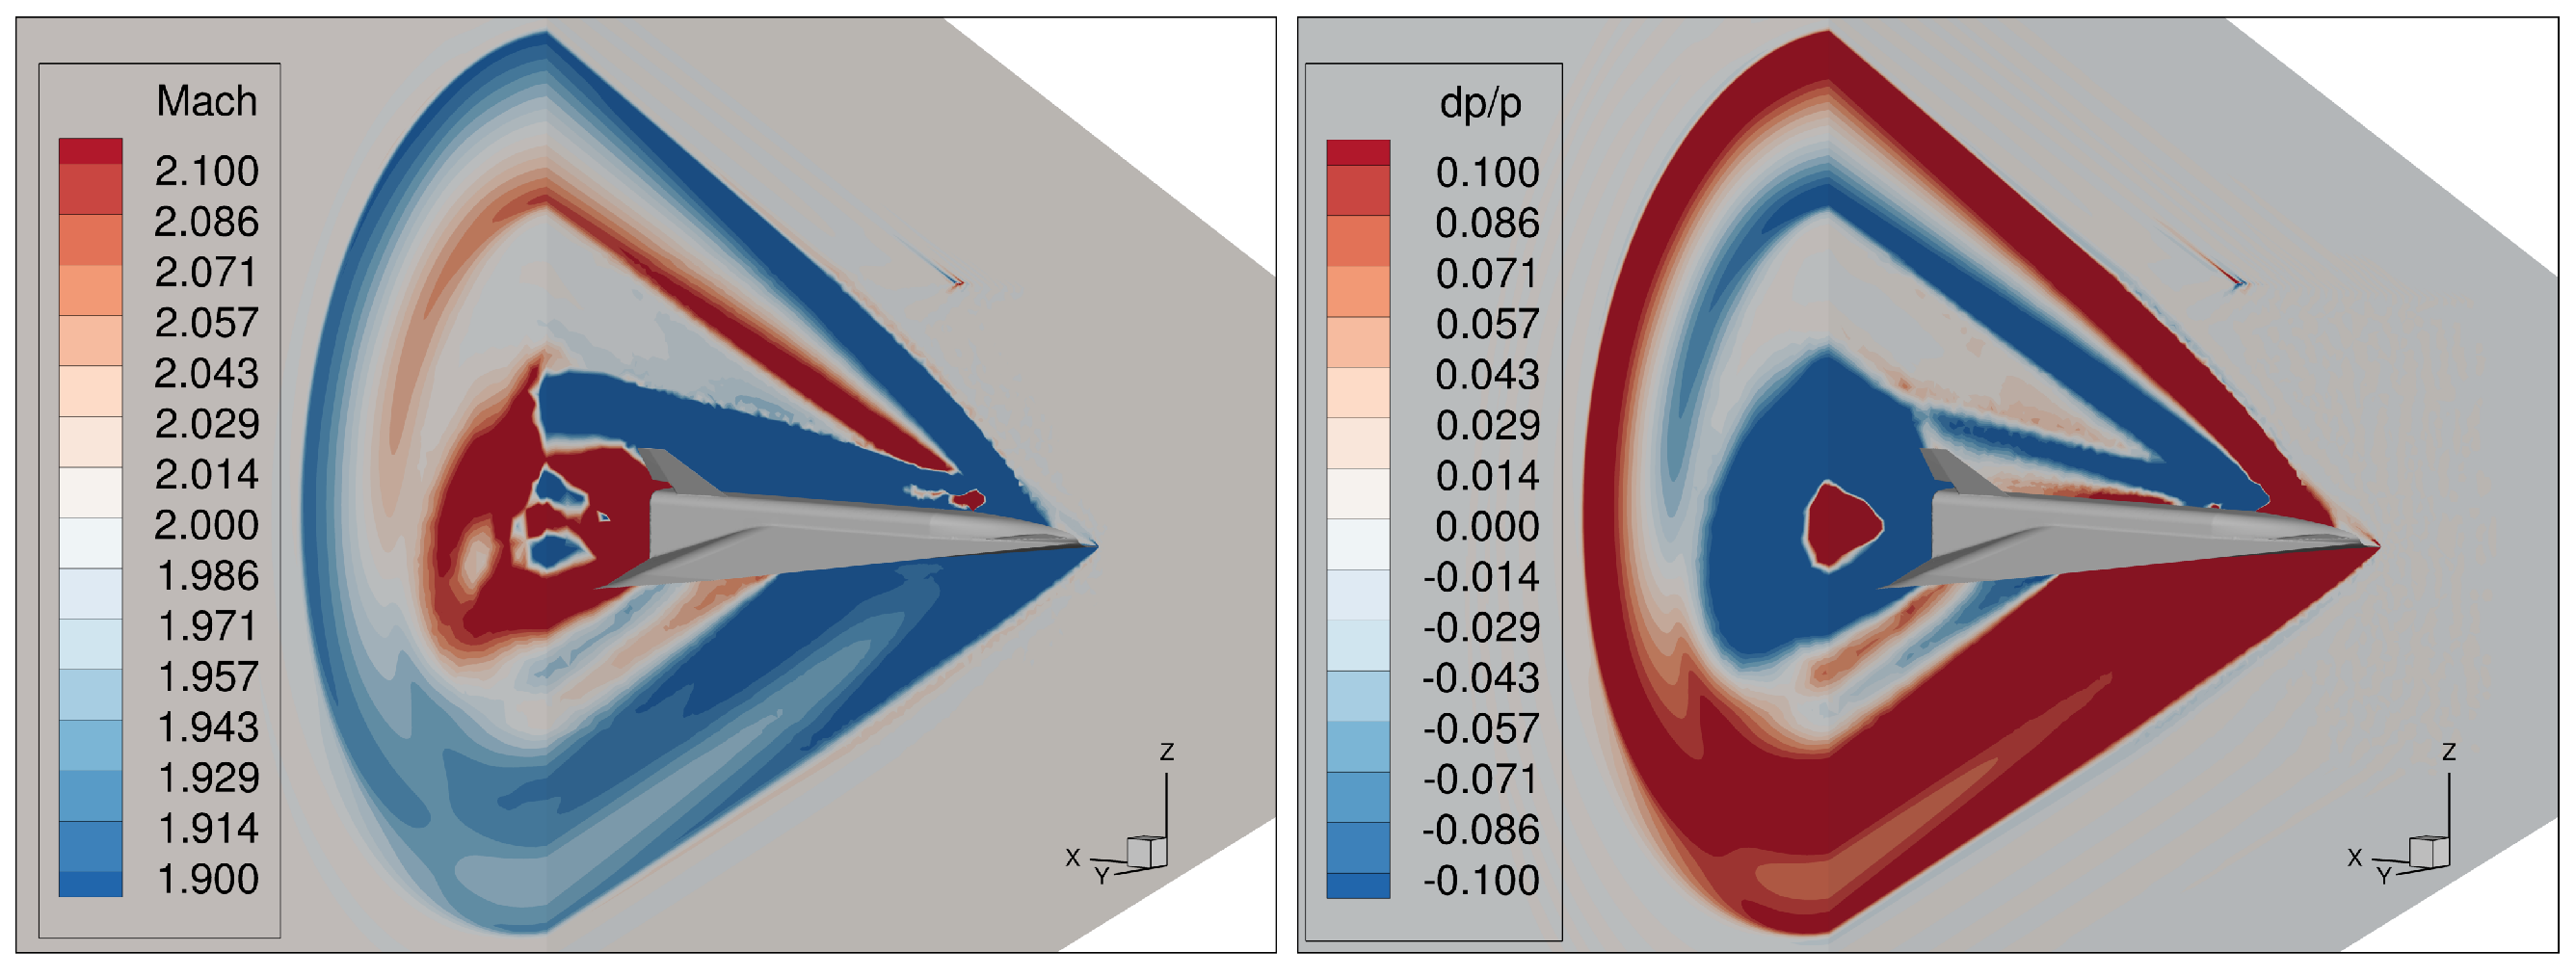
The flow field contours of CS3 are shown in Figure 39, which shows the contours of the Mach number and pressure gradient d p p . Unlike the other aircraft configurations, CS3 generated a dominant and well-defined shock structure with fewer minor discontinuities. This is consistent with the continuous lifting body shape of the aircraft.
Radial variations in the pressure signature were analyzed for CS1 and CS2. Figure 40 shows the pressure signals at various radial angles around the vehicle at ( H L ) = 3 . The largest pressure amplitudes were found at ϕ = 0 ° , directly below the vehicle, where the shock was strongest.
The plot on the right of Figure 40 shows the peak pressure values expressed in dB at each radial position and for the three reference distances. Similar to the other configurations, the acoustic field was asymmetric with respect to the aircraft, and the noise intensity decreased as the distance from the source increased, as expected.

3.4. Comparison of Noise Performances

The final section of this study compares the three previously described aircraft designs. A preliminary geometric comparison is shown in Figure 41, where the outlines of CS1, CS2, and CS3 are overlapped. CS1 is represented in black, CS2 is in red, and CS3 is in purple. The image highlights the substantial dimensional differences between the designs. Table 3 summarizes the key geometric parameters of the study. CS1 maintains a conventional supersonic configuration, CS2 represents a hybrid concept blending classical and modern design elements, and CS3, which is inspired by hypersonic applications, adopts a full wing–body layout with canards. In addition, CS2 is significantly shorter than CS1 and CS3, which have comparable lengths.

3.4.1. Noise Assessment at Non-Dimensionalized Distances

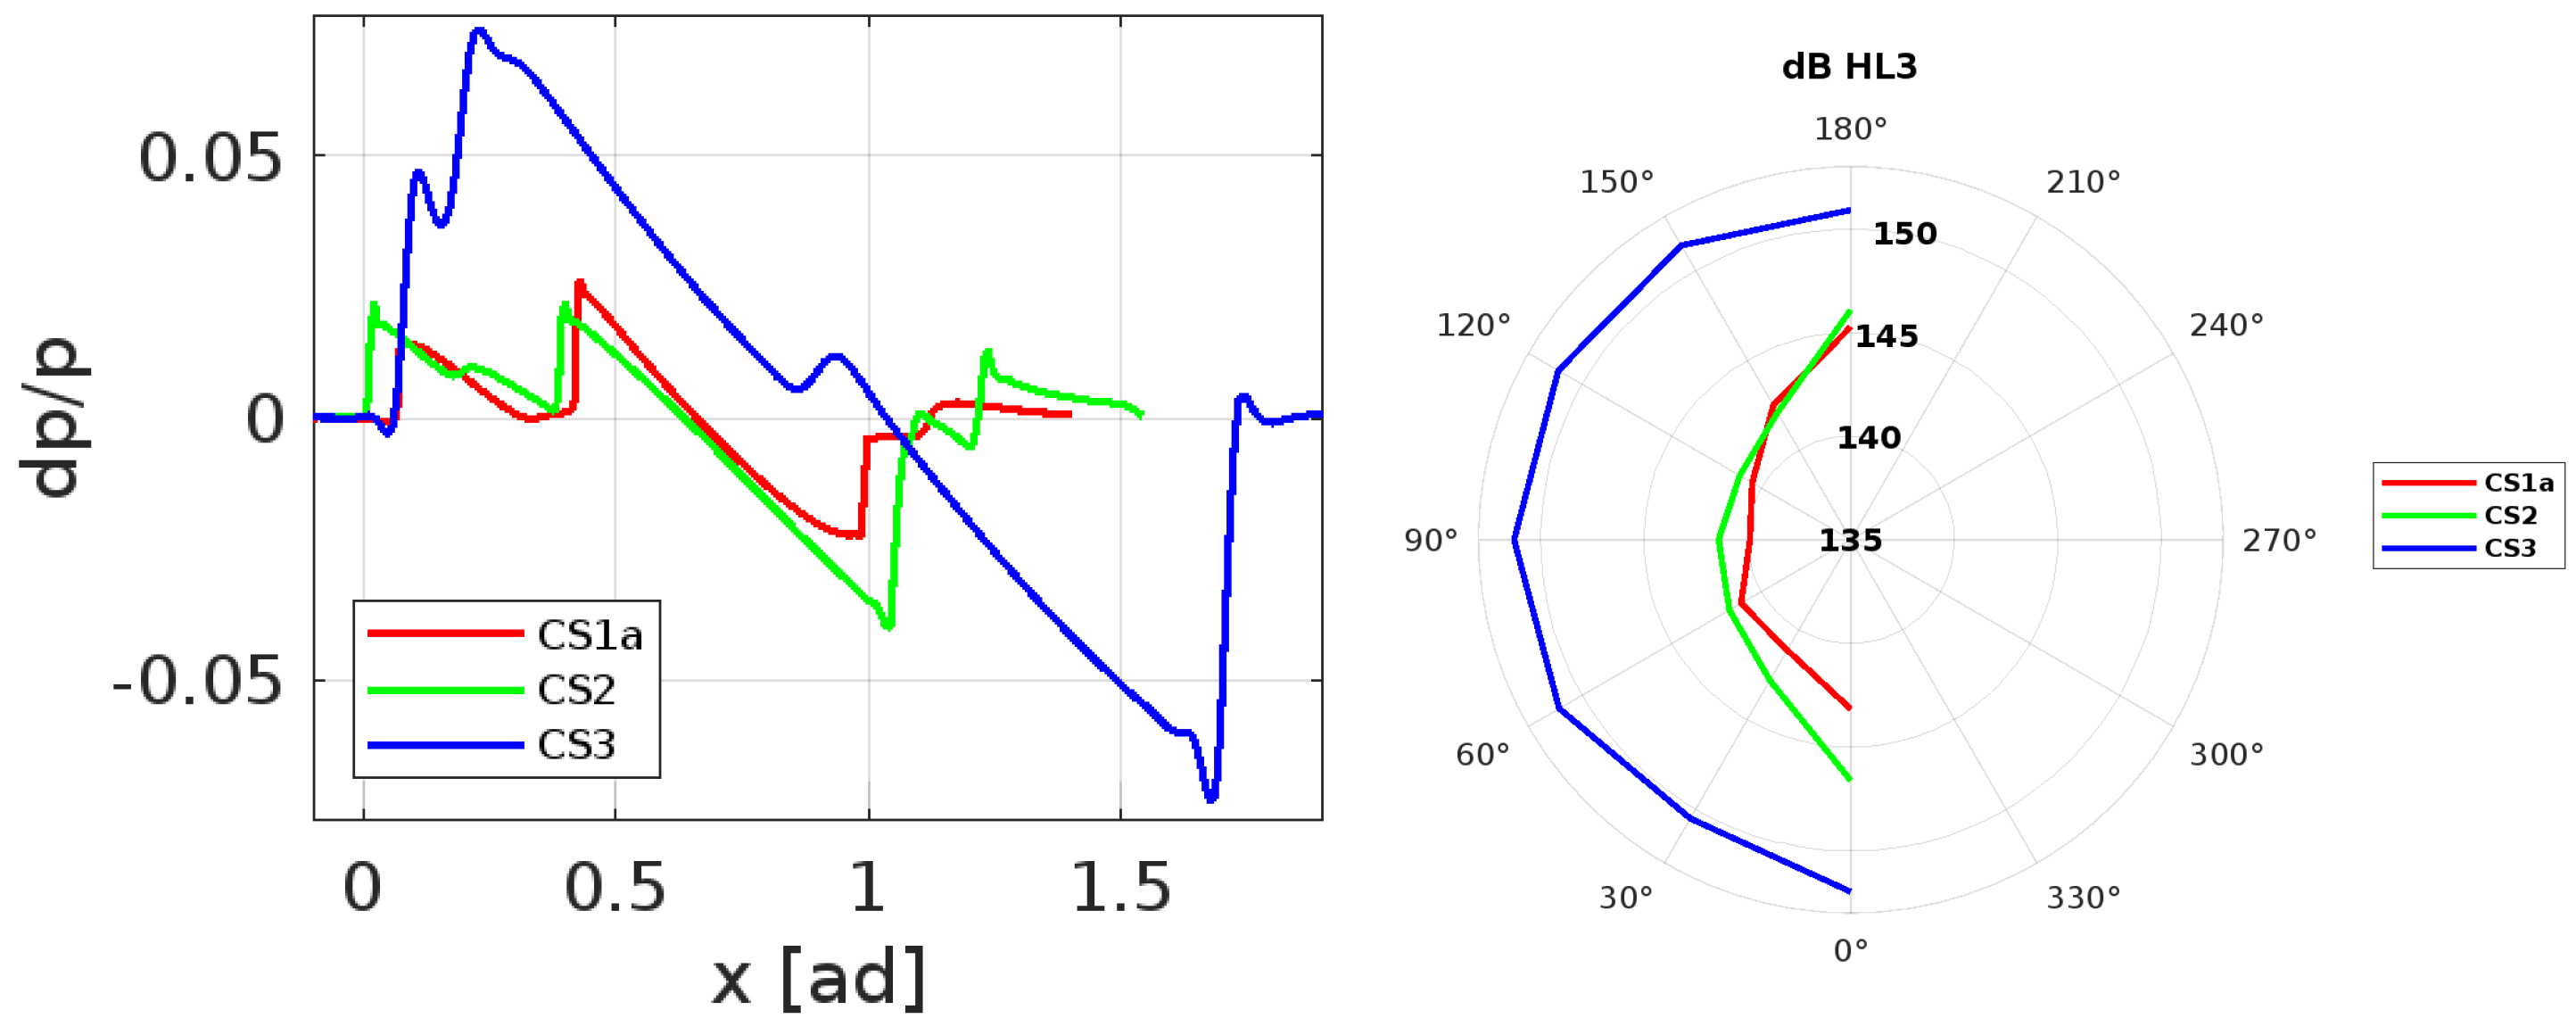
Figure 42, Figure 43 and Figure 44 show a direct comparison of the pressure signatures for the three configurations at normalized distances ( H L ) = 1 , 3 , and 5. The horizontal axis in these plots was non-dimensionalized by dividing the physical length of the extracted pressure profile by the respective aircraft length. This normalization facilitates shape-based comparisons while considering scale differences.
The CS1 and CS2 configurations have significantly similar profiles characterized by an initial pressure increase from the nose and a classic N-wave structure over the wings. In contrast, CS3 produced a more extended and intense pressure, particularly at shorter distances. The corresponding acoustic intensity plots (right-hand side of each figure) show that, while CS1 and CS2 maintained comparable sound levels, CS3 exhibited peak values that are approximately 10 dB higher, due to its larger dimensions.
These results suggest that CS1 offers the most favorable trade-off between size and acoustic impact. Despite having a fuselage length close to that of CS3, its noise levels are comparable to those of the more compact CS2.

3.4.2. Noise Assessment at Equivalent Physical Distances

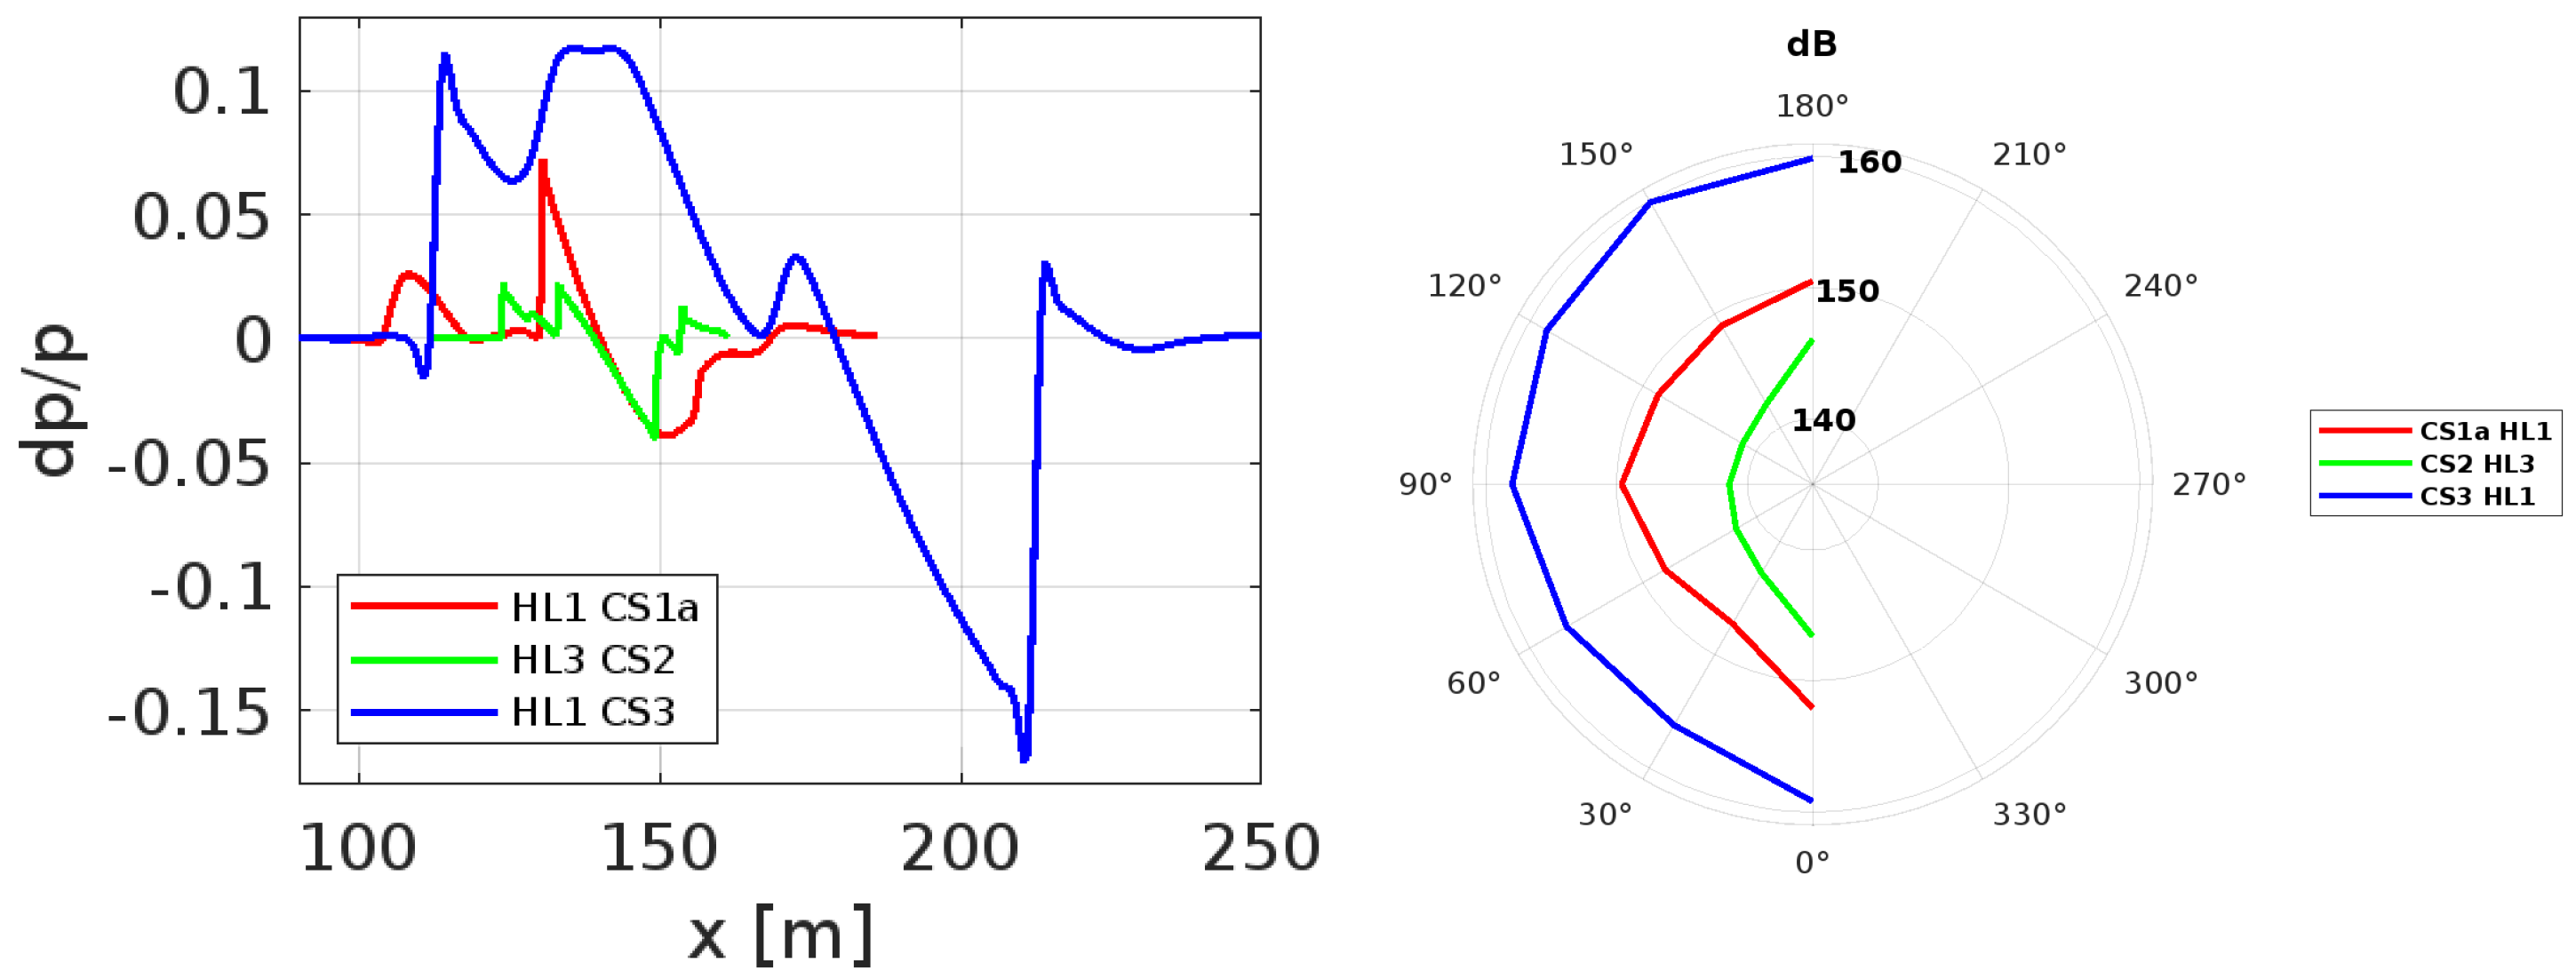
To provide a more intuitive comparison of the perceived noise levels, the pressure signatures were analyzed at equivalent dimensional distances from the aircraft. These distances corresponded to ( H L ) = 1 for CS1 and CS3 and ( H L ) = 3 for CS2, which corresponds to a fixed physical offset. The results are presented in Figure 45.
In this scenario, CS3 generated the most intense pressure profile, followed by CS1 and CS2. The decibel plot on the right shows a noise difference of approximately 10 dB between CS3 and CS1 and approximately 5 dB between CS1 and CS2. Although CS2 has the lowest noise levels, the small difference from CS1, despite their size disparity, underscores the effectiveness of the aerodynamic shaping of CS1.

3.4.3. Propagation Effects in the Near-Field Domain

Although this study is limited to near-field simulations, the influence of the propagation effects is clearly visible. Figure 46 shows the evolution of the CS3 pressure profile across the three reference distances. As expected, the amplitude of the pressure peaks decreased, and the waveform was elongated as it traveled farther from the vehicle. At ( H L ) = 5 , the pressure curve exhibits the shape of a canonical N-wave, with multiple peaks merging into a single front and rear shock. The same results were observed for CS1 and CS2, but, with lower pressure variations than those of the CS3 configuration, this effect was less marked.
These attenuations are quantitatively confirmed in Figure 47, which reports the maximum decibel values at three radial angles ( ϕ = 0 ° , 30 ° , and 60 ° ). Below the aircraft ( ϕ = 0 ° ), the noise level dropped by approximately 7 dB from ( H L ) = 1 to 3, and by an additional 3 dB from 3 to 5. Similar trends were observed at other angles, starting from lower peak values.

3.5. Influence of Geometry on the Pressure Signature

Different variables influence the sonic boom phenomenon, and the main parameters are the geometry of the aircraft, flight conditions, and atmospheric conditions. In this study, the atmospheric conditions were kept constant, and two Mach numbers were considered: M = 1.6 for the validation and M = 2 for the conceptual supersonic aircraft. However, all configurations presented different geometric parameters; therefore, the influence of the geometries was analyzed to determine their impact on the pressure signature.
The fuselage plays the most important role in the pressure signature, with the bow shock at the nose and tail shock at the aft end generating the initial and final pressure jumps, respectively. All pressure signatures show an initial drop at the beginning and another at the end of the curve to represent the initial compression and the expansion wave returning to the ambient condition. Geometric discontinuities produce small intermediate fluctuations in the pressure signature; this behavior is mitigated by viscous effects that are not accounted for in this study. Therefore, the AXIE geometry presents many small fluctuations compared with other configurations, as shown in Figure 13. Moderate changes in the cross-sectional area yield smoother and more extended pressure variations, with a slower amplitude rise owing to their longer nose, as shown in the JWB figure (Figure 16).
The wings are the second main contributor, generating strong compression at the leading edge and a second drop at the trailing edge, as highlighted by the blue vertical markers in the JWB, CS1, CS2, and CS3 configurations in Figure 13, Figure 27, Figure 32, and Figure 37.
These elements define the near-field waveform, which subsequently coalesces into a characteristic N-wave during propagation to the ground.
An interesting result is provided by the CS3 pressure signature; the configuration exhibits a classical N-wave shape in the near-field region, particularly at ( H / L ) = 5 , due to its body–wing shape. The small fluctuation visible at the beginning of the curve was generated by the fore canards, whose shocks locally perturbed the pressure distribution. This behavior is only shown by CS3 because it is the only one designed as a wing–body aircraft.

4. Conclusions

This study investigated the near-field pressure signatures of three conceptual supersonic aircraft to characterize their sonic boom behavior using CFD techniques. The analysis was conducted using two different flow solvers: the open-source SU2 and the commercial ANSYS Fluent software. Validation was performed through numerical reconstruction of benchmark cases from NASA’s Sonic Boom Prediction Workshops, which established the best practices in grid topology and scheme selection.
This study highlighted the importance of an optimized computational mesh, revealing that a hybrid grid structure provides the most accurate results. Specifically, an unstructured tetrahedral mesh was employed near the aircraft body, whereas a structured hexahedral mesh was used in the far field, aligned with the Mach lines to minimize numerical dissipation. In addition, various numerical schemes were evaluated to identify the most accurate and least dissipative approach. Among the tested schemes, the JST, AUSM, and HLLC schemes demonstrated adequate accuracy; in particular, the HLLC scheme consistently offered the best trade-off between stability and shock resolution.
Further investigations were conducted to examine the influence of different transition strategies between the unstructured inner mesh and the structured outer mesh. Two approaches were compared: smooth variation in cell dimensions and uniform cell spacing. The comparison revealed significant differences between the two strategies; the smooth transition performed better near the aircraft, while uniform spacing offered greater accuracy in the far field. In more complex configurations, these differences were less evident, probably because of intricate flow field interactions.
Three aircraft configurations, labeled CS1, CS2, and CS3, were analyzed in terms of their respective sonic boom characteristics. Among the three concepts, CS1 (an evolution of the Concorde layout) exhibited the most favorable sonic boom characteristics, balancing the wave amplitude and duration while producing lower peak overpressures. The CS2 aircraft, conceived as a supersonic test bench for engines, produced comparable pressure variations despite its smaller size compared with CS1. In contrast, the CS3 hypersonic configuration exhibited the highest near-field pressure amplitudes, which was attributed to its large surface area and sharp compression regions.
The propagation of the sonic boom signatures at different distances from the aircraft confirmed the expected coalescence of the pressure peaks into a more defined N-wave pattern with a progressive reduction in amplitude. This behavior validates the numerical methodology adopted, reinforcing its effectiveness in predicting the sonic boom characteristics.
The present analysis is subject to certain limitations. The simulations were performed under inviscid conditions, thus neglecting viscous effects that may influence the shocks. Furthermore, the analyses were restricted to the near-field region, without propagating the pressure signature to the ground, where atmospheric absorption, refraction, and weather conditions could further modify the shape and intensity of the signal. Future work could incorporate a viscous flow model and propagation analyses to the ground, thereby improving the accuracy and applicability of the methodology to more realistic operational scenarios.
In conclusion, this study established a robust numerical procedure for evaluating the sonic boom performance of supersonic aircraft. The proposed methodology demonstrated high reliability in assessing near-field pressure signatures and predicting noise propagation. Furthermore, the open-source code SU2, together with the SBPW benchmark, ensures full accessibility of the workflow and facilitates the replication of the methodology, allowing its application to more complex aircraft, such as CS1, CS2, and CS3. These findings have significant strategic implications for the development of next-generation supersonic aircraft, providing a robust basis for designing low-boom configurations. They not only enable the achievement of acoustic performance targets but also address the challenges posed by emerging environmental regulations. This dual focus ensures that future designs are positioned to meet and potentially shape future regulatory standards, thereby accelerating the path toward commercially viable and environmentally responsible supersonic transportation.

Author Contributions

Conceptualization, F.P.; methodology, A.G. and F.P.; software, M.B. and A.G.; validation, A.G. and M.B.; formal analysis, F.P.; investigation, A.G.; resources, M.B. and G.P.; writing—original draft preparation, A.G.; writing—review and editing, F.P.; supervision, G.P.; project administration, M.B. All authors have read and agreed to the published version of the manuscript.

Funding

This research received no external funding.

Data Availability Statement

The raw data supporting the conclusions of this article will be made available by the authors on request.

Conflicts of Interest

The authors declare no conflicts of interest.

Abbreviations

The following abbreviations are used in this manuscript:
dBDecibel
PLdBPerceived Level of Noise in Decibels
FAAFederal Aviation Administration
ICAOInternational Civil Aviation Organization
CFDComputational Fluid Dynamics
SPLSound Pressure Level
SELSound Exposure Level
OASPLOverall Sound Pressure Level
SBPWSonic Boom Prediction Workshop
C p Pressure Coefficient
MMach Number
RANSReynolds-Averaged Navier–Stokes
CFLCourant Number

References

  1. Liebhardt, B.; Lütjens, K. An Analysis of the Market Environment for Supersonic Business Jets. In Proceedings of the DLRK Tagungsband 2011: 60. Deutscher Luft- und Raumfahrtkongress in Bremen, Bremen, Germany, 27–29 September 2011; Available online: https://elib.dlr.de/75275/ (accessed on 3 September 2025).
  2. Herbert, S.R.; Hubbard, H.H. Sonic Boom Symposium. J. Acoust. Soc. Am. 1972, 51, 671. [Google Scholar] [CrossRef]
  3. Sparrow, V.W. Sonic Boom Symposium. J. Acoust. Soc. Am. 2002, 111, 479. [Google Scholar] [CrossRef]
  4. Maglieri, D.J. Some Effects of Airplane Operations and the Atmosphere on Sonic-Boom Signatures. J. Acoust. Soc. Am. 1966, 39, S36–S42. [Google Scholar] [CrossRef]
  5. Henderson, L.F.; Moore, F.K. The Approach to Far-Field Sonic Boom; NASA Conference Publication: Washington, DC, USA, 1968; p. 180. [Google Scholar]
  6. Caughey, D.A.; Gardner, J.H.; Hayes, W.D.; Weiskopf, F.B., Jr. Theoretical Problems Related to Sonic Boom; NASA Conference Publication: Washington, DC, USA, 1971; p. 255. [Google Scholar]
  7. Christine, M.D.; Powell, C.A. Status of Sonic Boom Methodology and Understanding; NASA Conference Publication: Washington, DC, USA, 1988; p. 3027. [Google Scholar]
  8. Giofriddo, T.A. Analysis of Sonic Boom Data to Quantify Distortions of Shock Profiles; NASA Conference Publication: Washington, DC, USA, 1992; p. 3172. [Google Scholar]
  9. Pierce, A.D. Progress in Modeling Atmospheric Propagation of Sonic Booms; NASA Conference Publication: Washington, DC, USA, 1993; p. 10132. [Google Scholar]
  10. Robinson, L.D. An Evaluation of Rise Time Characterization and Prediction Methods; NASA Conference Publication: Washington, DC, USA, 1994; p. 3279. [Google Scholar]
  11. Maglieri, D.J.; Bobbitt, P.J.; Plotkin, K.J.; Shepherd, K.P. Sonic Boom, Six Decades of Research; NASA, SP-2014-622; NASA Conference Publication: Washington, DC, USA, 2014. [Google Scholar]
  12. Kelly, R.; Laflin, S.M.K. A Hybrid Computational Fluid Dynamics Procedure for Sonic Boom Prediction. In Proceedings of the 24th Applied Aerodynamics Conference, San Francisco, CA, USA, 5–8 June 2006. [Google Scholar]
  13. El Din, I.S.; Carrier, G.; Grenon, R.; Le Pape, M.C.; Minelli, A. Overview of Sonic Boom CFD Prediction Methodology in Use at ONERA and its Application to Supersonic Business Jet Configuration Design. In Proceedings of the 11th ONERA-DLR Aerospace Symposium, Toulouse, France, 9–11 February 2011. [Google Scholar]
  14. Park, M.A.; Nemec, M. Numerical and Mesh Resolution Requirements for Accurate Sonic Boom Prediction. J. Aircr. 2009, 46. [Google Scholar] [CrossRef]
  15. Park, M.; Morgenstern, J. Summary and Statistical Analysis of the First AIAA Sonic Boom Prediction Workshop. J. Aircr. 2014, 53, 578–598. [Google Scholar] [CrossRef]
  16. Park, M.A.; Nemec, M. Nearfield Summary and Statistical Analysis of the Second AIAA Sonic Boom Prediction Workshop. J. Aircr. 2019, 56, 851–875. [Google Scholar] [CrossRef]
  17. Park, M.A.; Carter, M.B. Nearfield Summary and Analysis of the Third AIAA Sonic Boom Prediction Workshop C608 Low Boom Demonstrator. In Proceedings of the 3rd AIAA Sonic Boom Workshop Report-Out II: Nearfield CFD Cases, Virtual Event, 11–15 & 19–21 January 2021. [Google Scholar] [CrossRef]
  18. Park, M.A.; Carter, M.B. Near Field Summary and Analysis of the Third AIAA Sonic Boom Prediction Workshop Shock-Plume Interaction Case. In Proceedings of the AIAA Scitech 2021 Forum, Virtual Event, 11–15 & 19–21 January 2021. [Google Scholar] [CrossRef]
  19. Glorioso, A.; Petrosino, F.; Aprovitola, A.; Barbarino, M.; Pezzella, G. Sonic Boom generation using open source CFD approach. In Proceedings of the AIAA Aviation 2023 Forum, San Diego, CA, USA, 12–16 June 2023. [Google Scholar] [CrossRef]
  20. Glorioso, A.; Petrosino, F.; Barbarino, M.; Pezzella, G.; Viviani, A. Improvement on Open Source CFD Methodology To Evaluate Near-Field Sonic Boom. In Proceedings of the 30th AIAA/CEAS Aeroacoustics Conference, Rome, Italy, 4–7 June 2024. [Google Scholar] [CrossRef]
  21. Glorioso, A.; Petrosino, F.; Barbarino, M.; Pezzella, G.; Viviani, A. Sonic Boom Analysis of Different Supersonic Aircraft. In Proceedings of the 34th ICAS Congress 2024, Firenze, Italy, 9–13 September 2024. [Google Scholar]
  22. Economon, T.D.; Palacios, F.; Copeland, S.R.; Lukaczyk, T.W.; Alonso, J.J. SU2: An Open-Source Suite for Multiphysics Simulation and Design. AIAA J. 2016, 54, 828–846. [Google Scholar] [CrossRef]
  23. Ansys Fluent Fluid Simulation Software, ANSYS, Inc.: Canonsburg, PA, USA, 2018.
  24. Horizon2020. MDO and REgulations for Low-boom and Environmentally Sustainable Supersonic aviation. Grant Agreem. 2021. [Google Scholar] [CrossRef]
  25. Roe, P.L. Characteristic-Based Schemes for the Euler Equations. Annu. Rev. Fluid Mech. 1986, 18, 337–365. [Google Scholar] [CrossRef]
  26. Jameson, A. Origins and Further Development of the Jameson–Schmidt–Turkel Scheme. AIAA J. 2017, 55, 1487–1510. [Google Scholar] [CrossRef]
  27. Toro, E.F.; Spruce, M.; Speares, W. Restoration of the contact surface in the HLL-Riemann solver. Shock Waves 1994, 4, 25–34. [Google Scholar] [CrossRef]
  28. Roe, P. Approximate Riemann solvers, parameter vectors, and difference schemes. J. Comput. Phys. 1981, 43, 357–372. [Google Scholar] [CrossRef]
  29. Liou, M.S. Evolution of Advection Upstream Splitting Method Schemes. Def. Sci. J. 2010, 60, 606–613. [Google Scholar] [CrossRef]
  30. Palacios, F.; Lulaczyk, T.; Alonso, J.; Carrier, G.; Loselle, A. Stanford-Onera-INRIA contribution. In Proceedings of the 1st AIAA Sonic Boom Prediction Workshop, National Harbour, MA, USA, 11 January 2014. [Google Scholar]
  31. Ozoroski, L. Third AIAA Sonic Boom Prediction Workshop – Introduction. In Sonic Boom Prediction Workshop; NASA Langley Research Center: Hampton, VA, USA, 2020. [Google Scholar]
  32. Ueno, A.; Kanamori, M.; Makino, Y. Robust Low-Boom Design Based on Near-Field Pressure Signature in Whole Boom Carpet. J. Aircr. 2017, 54, 918–925. [Google Scholar] [CrossRef]
  33. Zore, K.; Ozcer, I.; Munholand, L.; Stokes, J. ANSYS CFD Simulations of Supersonic and Hypersonic Flows. In Proceedings of the 6th National Symposium on Shock Waves, Chennai, India, 26–28 February 2020. [Google Scholar]
  34. Viola, N.; Fusaro, R.; Gori, O.; Marini, M.; Roncioni, P.; Saccone, G.; Saracoglu, B.; Ispir, A.C.; Fureby, C.; Nilson, T.; et al. STRATOFLY MR3—How to reduce the environmental impact of high-speed transportation. In Proceedings of the AIAA Scitech 2021 Forum, Virtual, 11–21 January 2021. [Google Scholar] [CrossRef]
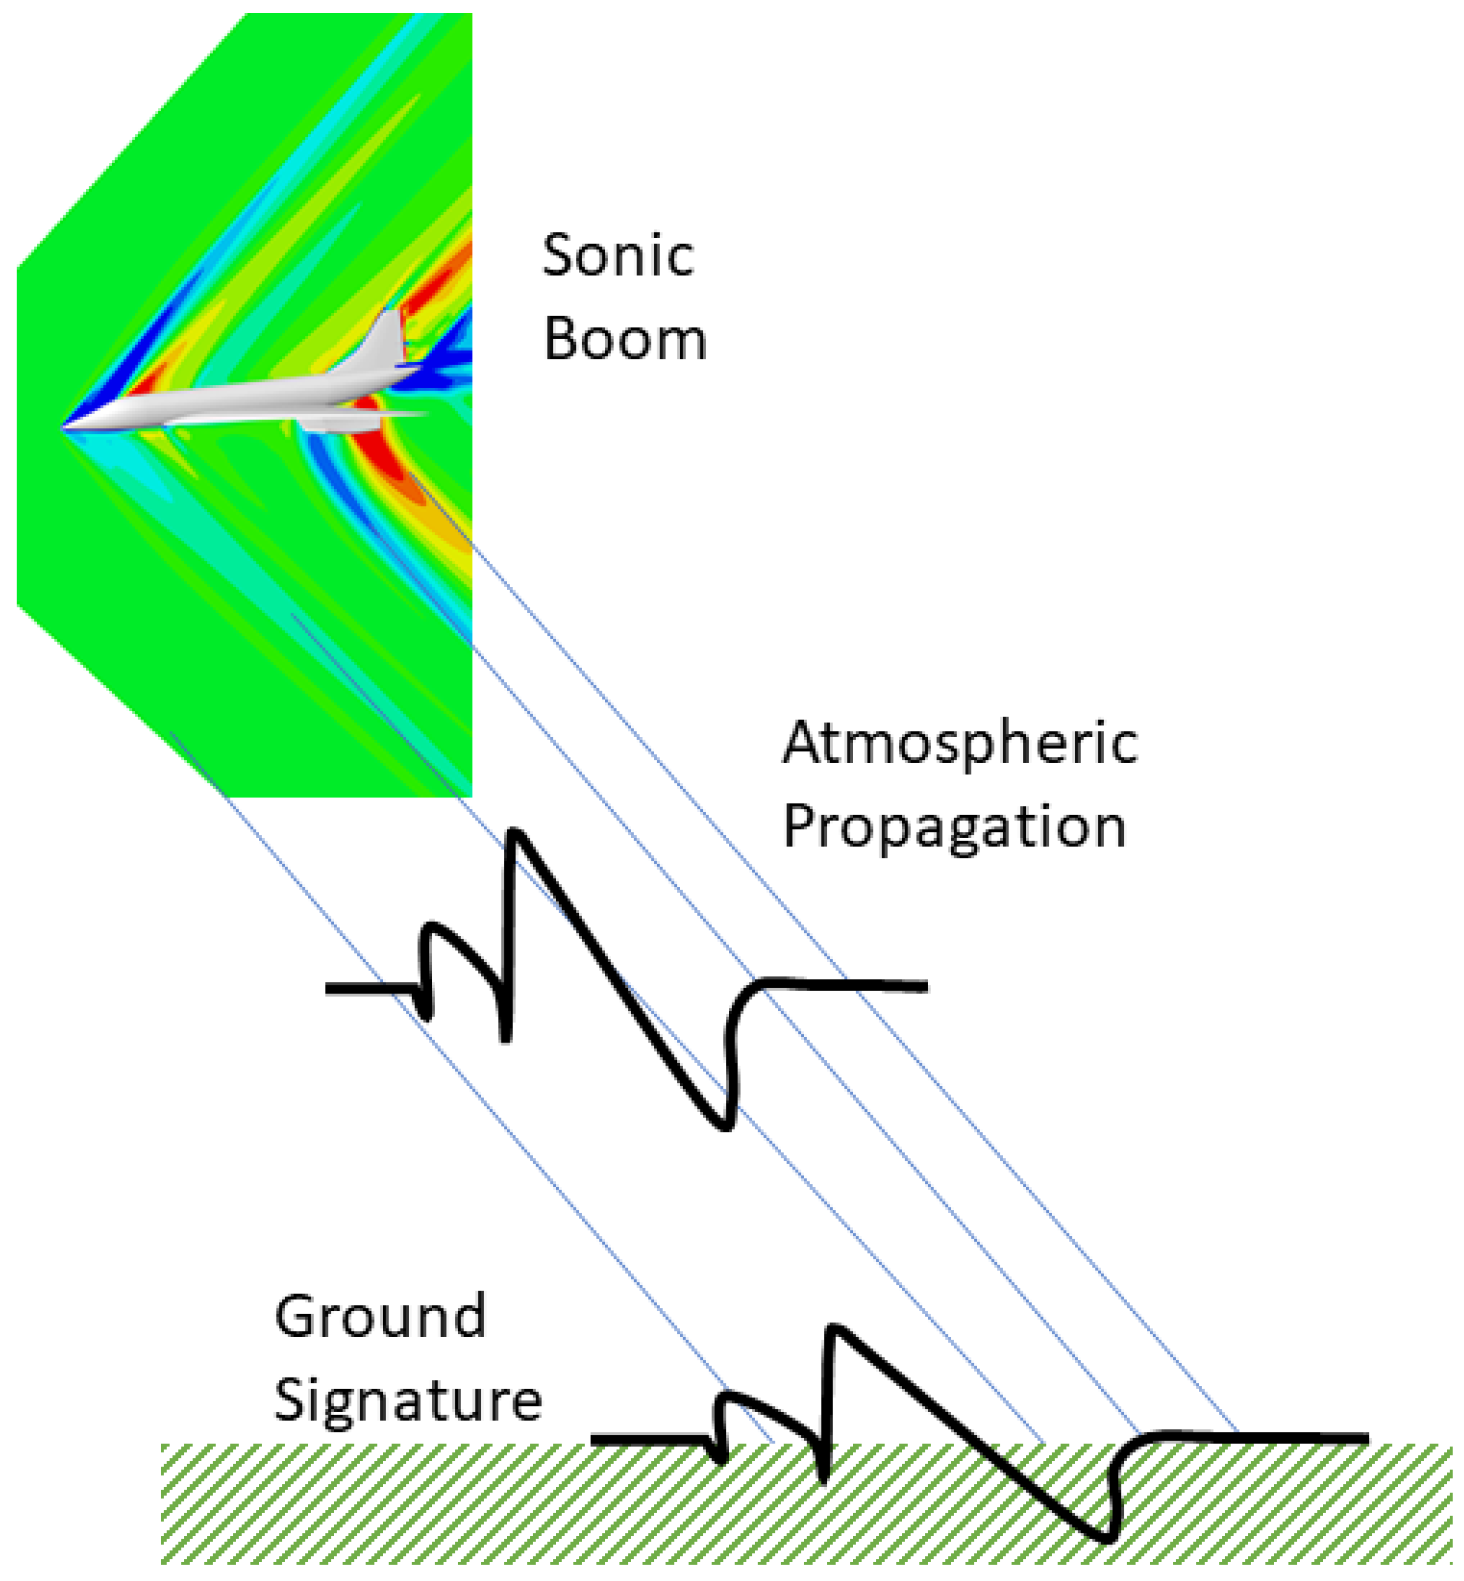
Figure 1. Sonic boom propagation from the near field to the ground.
Sci 07 00127 g001
Figure 2. AXIE, JWB, and C25D geometries provided in the SBPW.
Sci 07 00127 g002
Figure 3. Pressure signature extraction positions.
Sci 07 00127 g003
Figure 4. Reference values, position H/L = 3.
Sci 07 00127 g004
Figure 5. Computational mesh for 2D simulation, details on the right.
Sci 07 00127 g005
Figure 6. Contour of Mach number for 2D Fluent simulations: 36K (top) and 122K (bottom) nodes.
Sci 07 00127 g006
Figure 7. Pressure signature results for 2D cases, position H/L = 3.
Sci 07 00127 g007
Figure 8. Best results Δ p p obtained with Fluent and SU2 with 2D mesh and 525K elements.
Sci 07 00127 g008
Figure 9. Unstructured domain (top); structured domain (bottom).
Sci 07 00127 g009
Figure 10. Contours of Mach number for 3D simulations: 10.78M Fluent (left) and SU2 (middle), and 14M SU2 (right).
Sci 07 00127 g010
Figure 11. Comparison pressure signature results for 2D and 3D cases, position H / L = 1 (left) and H / L = 3 (right).
Sci 07 00127 g011
Figure 12. Pressure signature results for 3D hybrid grid cases, position H/L = 3.
Sci 07 00127 g012
Figure 13. AXIE geometry: pressure signature compared to reference data and numerical schemes HLLC, JST, and AUSM, position H/L = 3.
Sci 07 00127 g013
Figure 14. AXIE case: dimension of elements in the structured grid.
Sci 07 00127 g014
Figure 15. AXIE case: results of grid with smooth and hard transition, distance ( H L ) 3 .
Sci 07 00127 g015
Figure 16. JWB second-order simulations, position H/L = 3.
Sci 07 00127 g016
Figure 17. JWB details of second-order simulations, position H/L = 3.
Sci 07 00127 g017
Figure 18. JWB contours of Mach number: second-order HLLC scheme (left) and ROE-FDS (right).
Sci 07 00127 g018
Figure 19. JWB radial reference.
Sci 07 00127 g019
Figure 20. JWB radial noise, pressure signatures, and PLdB.
Sci 07 00127 g020
Figure 21. JWB geometry: pressure signature compared to reference data and numerical schemes HLLC, JST, and AUSM, position ( H L ) 3 .
Sci 07 00127 g021
Figure 22. JWB case: results of grid with smooth and hard transition, distance ( H L ) 3 .
Sci 07 00127 g022
Figure 23. Comparison of CS1 pressure field using an aerodynamic mesh (left) and an aeroacoustic mesh (right).
Sci 07 00127 g023
Figure 24. Hybrid mesh for CS1: close-up views of the unstructured and structured zones.
Sci 07 00127 g024
Figure 25. CS1 aircraft geometry.
Sci 07 00127 g025
Figure 26. Comparison of CS1 geometry (blue) with Concorde (red).
Sci 07 00127 g026
Figure 27. CS1 pressure signature at ( H L ) = 3 .
Sci 07 00127 g027
Figure 28. CS1 pressure signature at ( H L ) = 1 (left) and ( H L ) = 5 (right).
Sci 07 00127 g028
Figure 29. CS1: Mach number contours (left) and normalized pressure variation ( d p p ) (right).
Sci 07 00127 g029
Figure 30. CS1 acoustic analysis: pressure signatures at various radial positions (left) and peak dB levels (right).
Sci 07 00127 g030
Figure 31. CS2 configuration.
Sci 07 00127 g031
Figure 32. Pressure signature of CS2 at ( H L ) = 3 , extracted below the aircraft.
Sci 07 00127 g032
Figure 33. CS2 pressure signature extracted at ( H L ) = 1 (left) and ( H L ) = 5 (right).
Sci 07 00127 g033
Figure 34. CS2 near-field contours of Mach number (left) and d p p (right).
Sci 07 00127 g034
Figure 35. CS2 sonic boom results: radial pressure traces (left) and corresponding maximum dB levels (right).
Sci 07 00127 g035
Figure 36. CS3 configuration.
Sci 07 00127 g036
Figure 37. Pressure signature of CS3 at distance ( H L ) = 3 .
Sci 07 00127 g037
Figure 38. CS3 pressure profiles at ( H L ) = 1 (left) and ( H L ) = 5 (right).
Sci 07 00127 g038
Figure 39. CS3 near-field contours of Mach number (left) and d p p (right).
Sci 07 00127 g039
Figure 40. CS3 sonic boom results: radial pressure traces (left) and maximum dB values (right).
Sci 07 00127 g040
Figure 41. Overlay of the three conceptual aircraft geometries.
Sci 07 00127 g041
Figure 42. Comparison at ( H L ) = 1 : normalized pressure signatures (left) and radial noise levels (right).
Sci 07 00127 g042
Figure 43. Comparison at ( H L ) = 3 : normalized pressure signatures (left) and radial noise levels (right).
Sci 07 00127 g043
Figure 44. Comparison at ( H L ) = 5 : normalized pressure signatures (left) and radial noise levels (right).
Sci 07 00127 g044
Figure 45. Pressure signature comparison at matched dimensional distances (left) with corresponding dB values (right).
Sci 07 00127 g045
Figure 46. CS3 pressure signature evolution across increasing distances.
Sci 07 00127 g046
Figure 47. Sonic boom attenuation with distance for CS1 (left), CS2 (center), and CS3 (right) at ϕ = 0 ° , 30 ° , and 60 ° .
Sci 07 00127 g047
Table 1. CFD Simulation parameters.
Operating ConditionsValue
Mach number1.6
Angle of attack [deg]0
Altitude [m]15,760
Pressure [Pa]10,684.3
Temperature [K]216.6
Table 2. CFD simulation parameters.
Operating ConditionsValue
Mach number2.0
Angle of attack [deg]0
Altitude [m]15,760
Pressure [Pa]10,684.3
Temperature [K]216.6
Table 3. Comparison of aircraft dimensions.
DimensionsCS1CS2CS3
Body Length [m]62 24.56 75
Body Height [m]10 3.81 19.3
Wing Span [m]26 8.67 40.5
S r e f [m2] 166.3 40.77 1000
Disclaimer/Publisher’s Note: The statements, opinions and data contained in all publications are solely those of the individual author(s) and contributor(s) and not of MDPI and/or the editor(s). MDPI and/or the editor(s) disclaim responsibility for any injury to people or property resulting from any ideas, methods, instructions or products referred to in the content.