Article

Sex-Specific Metabolic, Immunologic, and Behavioral Effects of Perfluorooctane Sulfonic Acid (PFOS) in BTBR-mtB6 Mice

by
Danielle Qiu Yun Jiang
1,
Fatma Eldefrawy
1,
Jarissa Isabel Navarro
2 and
Tai L. Guo
1,*
1
Department of Veterinary Biomedical Sciences, University of Georgia, Athens, GA 30602, USA
2
Department of Biological Sciences, University of Georgia, Athens, GA 30602, USA
*
Author to whom correspondence should be addressed.
Sci 2025, 7(3), 118; https://doi.org/10.3390/sci7030118
Submission received: 28 June 2025 / Revised: 5 August 2025 / Accepted: 25 August 2025 / Published: 1 September 2025

Abstract

Perfluorooctane sulfonate (PFOS), a member of the per- and polyfluoroalkyl substance (PFAS) family, has been associated with adverse health effects, including potential links to autism spectrum disorder (ASD). This study investigates the impact of PFOS on metabolic, immunologic and behavioral profiles in BTBR-mtB6 mice, a mouse strain that models ASD, to provide insights into the role of PFOS in ASD development and related health concerns. Three-month-old male and female BTBR-mtB6 mice were divided into two groups (n = 6) and received daily administration of either 1 mg/kg PFOS or vehicle over a three-month period by gavage. Metabolic assessments included measurements of body weight and weekly blood glucose levels, glucose and insulin tolerance tests, organ weights, and body compositions (free fluid, fat and lean tissue). Immune profiling was conducted via flow cytometric analysis of splenic leukocytes, while behavioral evaluations included grooming, sniffing, and three-chamber social interaction tests. PFOS exposure disrupted glucose homeostasis, with both sexes exhibiting elevated blood glucose levels. Male mice showed impaired glucose tolerance, delayed glucose level recovery, and increased insulin resistance, while females displayed decreased insulin resistance. Additionally, PFOS exposure led to liver enlargement in both sexes. Behavioral assessments revealed heightened grooming in PFOS-treated males, commonly interpreted as stress- or ASD-related repetitive behaviors, whereas females exhibited reduced grooming, reflecting altered behavioral responses to exposure. Immune alterations were also sex specific. PFOS-treated males exhibited decreased granulocytes, increased macrophages, and enhanced surface expressions of B220 and CD40L. PFOS-treated females showed increased macrophages, B-cells, cytotoxic T-cells and CD25+ T-cell subsets, with enhanced surface expression of B220 and CD8, and reduced surface expression of Mac-3. In addition, PFOS exposure reduced spleen weight in females. Taken together, PFOS exposure induced significant physiological and behavioral changes in BTBR-mtB6 mice, with sex-specific differences observed. These results raise concern that PFASs may contribute to the development or exacerbation of metabolic, immune and neurodevelopmental disorders, highlighting the need for sex-specific human risk assessment in environmental toxicology.

1. Introduction

Perfluorooctane sulfonate (PFOS), a prominent member of the “forever chemicals” family, is one of the 15,000 synthetic compounds classified under the extensive group of per- and polyfluoroalkyl substances (PFASs) [1]. Structurally, PFOS consists of an eight-carbon chain fully saturated with fluorine atoms and terminated with a sulfonic acid group. PFOS has been widely utilized in the production of stain-resistant fabrics, firefighting foams, non-stick cookware, and various paper and packaging products. Due to its environmental persistence and bioaccumulative properties, PFOS has raised significant concerns among the public and regulatory agencies. Consequently, government bodies have prioritized the investigation of PFOS to comprehend its health effects and to develop regulations aimed at mitigating its environmental impact [1,2].
Many studies have investigated the toxic effects of PFOS, which often manifest as behavioral impairments. It has been reported that PFOS-treated C57BL/6 mice exhibit anxiety, deficits in exploratory and spatial memory, enhanced inflammatory responses, and suppressed cellular responses [3,4,5,6]. However, it was unknown how PFOS might affect a mouse strain with pre-existing neurodevelopmental abnormalities, particularly autism spectrum disorder (ASD), which has been estimated to affect ~2% of children in the U.S., with the incidence rising [7,8,9]. Metabolic and immunologic dysregulations are increasingly recognized as significant contributors to the condition of ASD.
As PFASs have been reported to potentially contribute to the onset and exacerbation of ASD symptoms [10,11,12,13,14,15,16,17,18,19,20,21,22,23], it was hypothesized that PFOS would exacerbate physiological and behavioral abnormalities in a mouse model of ASD. However, despite growing interest in environmental contributors to ASD, few studies have integrated metabolic, immunologic, and behavioral assessments within a single experimental framework, particularly in animal models of ASD. To address this gap, we employed the BTBR-mtB6 mouse model, a conplastic strain which possesses the nuclear DNA of BTBR T+ Itpr3tf/J (also known as BTBR) mice and the mitochondria of C57BL/6 mice [24]. The classic BTBR strain is widely used in ASD research due to its characteristic impairments in social behaviors, elevated repetitive self-grooming, atypical ultrasonic vocalization, and partial or complete agenesis of the corpus callosum [25,26,27,28]. Importantly, clinical and genetic studies have implicated mitochondrial dysfunction as a contributing factor in ASD pathophysiology [7,9,29]. The BTBR-mtB6 model offers a novel approach to studying PFOS effects in an ASD-relevant genetic background with an improved mitochondrial profile. This design reduces confounding due to inherent mitochondrial dysfunction and may reveal how mitochondrial background influences susceptibility to PFOS-induced metabolic, immunologic, and behavioral disruptions.

2. Materials and Methods

2.1. Animal Husbandry and Housing

Three-month-old male and female BTBR-mtB6 mice were used for this study. The BTBR-mtB6 strain was gifted by the Lawrence Lab at the Wadsworth Center, New York State Department of Health, Albany, NY, USA. Briefly, the strain was created through 12 backcross generations from C57BL/6 females and BTBR males. The resulting BTBR-mtB6 strain possesses the nuclear DNA of BTBR mice with mitochondria from the C57BL/6 mice [24].
The mice were housed in ventilated cages at the Coverdell Rodent Vivarium of the University of Georgia. The room temperature was maintained at 22–25 °C, with relative humidity at 50 ± 20%, and a 12 h light/dark cycle. Red light was provided for illumination during the dark cycle. Irradiated laboratory animal bedding was provided, along with a red plastic house and Bed-r’Nest (The Andersons Inc., Maumee, OH, USA) for enrichment. Water and regular chow (5053 PicoLab diet, LabDiet, St. Louis, MO, USA) were provided ad libitum. All animals were treated humanely, and all procedures were conducted under an approved Animal Use Protocol by the UGA Institutional Animal Care and Use Committee.

2.2. Animal Exposure

Male and female mice were stratified by baseline body weight (BW) and blood glucose level (BGLs), and randomly assigned to PFOS and vehicle (VH) control groups (n = 6/group) to ensure comparable starting conditions across treatment groups. A 50 mL stock solution of PFOS (10 mg/mL) was prepared by dissolving 0.50 g of PFOS (Sigma-Aldrich, St. Louis, MO, USA) with 49.75 mL of autoclaved double-distilled water (DDH2O) and 0.25 mL of 20% (v/v) Tween-20, resulting in a final Tween-20 concentration of 0.1% (v/v). Each week, dosing aliquots were prepared by diluting 100 µL of the stock solution into 9.90 mL of autoclaved DDH2O to achieve a final PFOS concentration of 0.1 mg/mL, corresponding to a dose of 1 mg/kg in mice when they were dosed at 100 µL/10 g BW. The selected dose of 1 mg/kg was chosen to induce acute effects, based on its established use in toxicological studies, its ability to produce biologically and environmentally relevant serum concentrations, and its suitability for sustained administration without causing undue distress to the animals [30,31,32]. Mice dosed with 1 mg/kg PFOS exhibited 2150 ng/mL PFOS serum concentration, a level that is within the range observed in occupationally exposed humans, such as chemical plant workers [31,33,34,35]. This concentration is significantly higher than levels typically seen in the general population, whose exposure is estimated to be approximately 40 ng/day (or 0.57 ng/kg/day) for adults [36]. In our study, the volume of dosing solution was adjusted weekly based on the average body weight of the mice in each cage (0.1 mL/10 g BW). Mice received their respective treatment solutions daily via gavage for three months. A total of 24 BTBR-mtB6 mice were treated, and various measurements were taken at different time points throughout the study (Figure 1).

2.3. Measurement of Body Weight and Blood Glucose Levels

Body weight and non-fasting BGLs were measured weekly. The venous blood samples from a tail nick were taken to test BGLs using the Prodigy AutoCode® blood glucose meter (Prodigy Diabetes Care, LLC., Charlotte, NC, USA) with a no coding blood glucose test strip (Prodigy).

2.4. Measurement of Free Body Fluid, Fat and Lean Tissue

At the end of the study, before euthanization, the body compositions of free fluid, fat and lean tissues were measured and quantified using the Minispec Whole Body Composition Analyzer TD-NMR (Bruker Corporation, Billerica, MA, USA).

2.5. Glucose and Insulin Tolerance Tests Following Intraperitoneal Injection

To conduct the glucose tolerance tests (GTTs), mice were fasted overnight (15 h), before baseline BW and BGLs were determined. The mice were then injected intraperitoneally (i.p.) with 2 g/kg of glucose (Sigma). BGLs were subsequently measured at 15-, 30-, 60-, and 120 min time points post-injection. To conduct the insulin tolerance tests (ITTs), mice were fasted for 4 h prior to measuring baseline BW and BGLs. The mice were then injected i.p. with 1.5 IU/kg of insulin (Sigma), and BGLs were measured at 15, 30, 60, and 120 min time points post-injection. Area under the curve (AUC) for both GTTs and ITTs was calculated using JMP Pro 18 software (SAS Institute Inc., Cary, NC, USA, 1989–2024).

2.6. Behavioral Tests and Analysis

Behavior tests were conducted at the two- and third-month time points during the study period. The tests included the three-chamber sociality test, sniffing test, and grooming test. All tests were recorded and analyzed with ANY-maze (Stoeltling Co., Wood Dale, IL, USA). To minimize bias, animals were assigned unique identification numbers, and the treatment information was concealed from cages and testing records. Experimenters conducting the behavioral tests were blinded to treatment groups throughout the study.
The three-chamber sociality test measured social interaction, following the protocol by Rein et al. (2020) [37]. Three chambers, e.g., social, empty and object chambers, were created using two dividers in a black container (62 cm length, 38 cm width, 35 cm height). Stainless steel net cups (10 cm diameter, 9 cm height) served as the cage holders. Novel C57BL/6 mice were used as the social stimuli in the social chamber, and a wooden block cube was used as a novel object in the object chamber. Before the test, mice were acclimated in a dark behavior room with red light for one hour. The test consisted of three 10 min phases: habituation, pre-test, and social preference. During the habituation phase, each mouse was allowed to freely explore all chambers, with the cups placed in both the social and object chambers. In the pre-test phase, a ping pong ball was placed inside each cup, and the test mouse was allowed to explore the chambers. During the social preference phase, the test mouse was allowed to explore the chambers with a novel mouse in the social chamber’s cup and a wooden block cube in the object chamber’s cup. Recordings were made during the social preference phase, and the time spent exploring each chamber was analyzed using ANY-maze. Mice that spent less time in the social chamber were considered to exhibit impaired social interactions.
The sniffing test assessed direct social interaction with the novel mouse [24]. ANY-maze calculated the time the test mouse spent sniffing the novel mouse when its head was oriented toward and in close proximity to the cup (≤2 cm from the cup edge). To confirm the accuracy of automated measurements from ANY-maze, manual scoring was conducted using hand-held timers. The recorded sniffing durations were checked against ANY-maze outputs to ensure consistency. Mice that spent less time sniffing the novel mouse were considered to show reduced interest in novelty and increased anxiety.
The grooming test evaluated repetitive behaviors. Each mouse was placed individually in a standard mouse cage with a thin layer of bedding (0.5 cm) to reduce neophobia. The test mouse was allowed to explore freely for 5 min, and spontaneous grooming was recorded with hand-held timers over a 10 min test period [24]. Mice that spent more time grooming were considered to exhibit increased anxiety and repetitive behaviors.

2.7. Necropsy and Flow Cytometric Analysis of Splenic Leukocytes

At the end of the study period, the mice were humanely euthanized using C O 2 asphyxiation. During necropsy, organs including the spleen, thymus, gastrointestinal tract, liver, lungs, heart, pancreas, kidneys with adrenals, and brain were collected and weighed. The spleens were immediately placed into 3 mL of PBS (phosphate-buffered saline). They were then homogenized on ice by gently mashing them between the frosted ends of two microscopic slides to release the cells. The resulting cells were washed and stained with antibodies of interest, and analyzed using Novocyte Quanteon (Agilent, Santa Clara, CA, USA). The first combination of antibodies included cluster of differentiation (CD)3e (PerCPCy5; Cat# 551163, BD), CD4 (PE; Cat# 12–0041-83; eBioscience, San Diego, CA, USA), CD8a (APC-H7; Cat# 560182; BD), CD25 (APC; Cat# 557192, BD), CD45R (PE-CF594; Cat# 562290; BD), and Mac-3 (FITC; Cat# 01784D, BD). The second combination included CD45R/B220 (FITC; Cat# 11–0452-85, eBioscience) and CD40L (PE; Cat# 12–1541-83, eBioscience). The third combination included CD5 (PE; Cat# 01035B; BD) and CD24 (FITC; Cat# 01574D; BD). The fourth combination included CD40 (FITC; Cat# 09664D, BD), CD44 (PE; Cat# 12–0441-83, eBioscience), and CD4 (PerCP; Cat# 553052, BD). The fifth combination included Gr-1 (Ly-6C and Ly-6G, FITC; Cat# 553127, BD) and F4/80 (PE; Cat# 12-4801-82, eBioscience). Isotype-matched irrelevant antibodies were used as controls. Flow cytometric analysis was conducted to detect potential changes in the percentage of cells and mean fluorescence intensity of each surface marker of interest using FlowJo v10.10.0 (FlowJo, LLC., Ashland, OR, USA).

2.8. Statistical Analysis

The data were presented as mean ± SEM. Statistical analyses were conducted using JMP Pro 17. For each sex group, unequal variance analysis (normality and homogeneity check) was first conducted with Barlett test. If the Barlett test was not significant, Dunnett’s test was used for comparison with VH group as the control. If the Bartlett test was significant, the non-parametric Wilcoxon test was performed. Results were considered significant with p ≤ 0.05. GraphPad Prism 10.2.2 software (San Diego, CA, USA) was used for data visualization.

3. Results

3.1. Effects on Body Weights, Organ Weights, and Body Compositions

Over the three-month period, body weights for both male and female mice showed no significant differences between the VH and PFOS groups (Figure 2). The absolute and relative organ weights (% body weight) were analyzed for the liver, spleen, brain, gastrointestinal tract, kidneys with adrenals, heart, lungs, thymus, and pancreas (Table 1 and Table 2). For the liver, both PFOS males and females showed significant increases in both absolute and relative weights compared to the VH groups (p < 0.001) (Table 1 and Table 2). For the spleen, only the PFOS females exhibited a significant reduction in absolute weight (p < 0.05) and relative weight (p < 0.01) (Table 1 and Table 2). No significant differences were observed in other organs analyzed (Table 1 and Table 2). Body composition analysis revealed no significant differences in the absolute weights of lean tissue, fat tissue, or free fluid across treatment groups in both sexes (Figure 2B). However, in the females, the percentage of lean tissue relative to body weight was significantly lower in PFOS group (p < 0.01). All other relative body composition changes were not statistically significant (Figure 2C).

3.2. Effects on Blood Glucose Homeostasis

Both male and female PFOS groups exhibited significantly elevated blood glucose levels compared to VH groups. In males, significant differences were noted on days 42 and 56 after treatment, while in females, significant differences were observed on days 28, 35, 49 and 56 following PFOS treatment (Figure 3A,B).
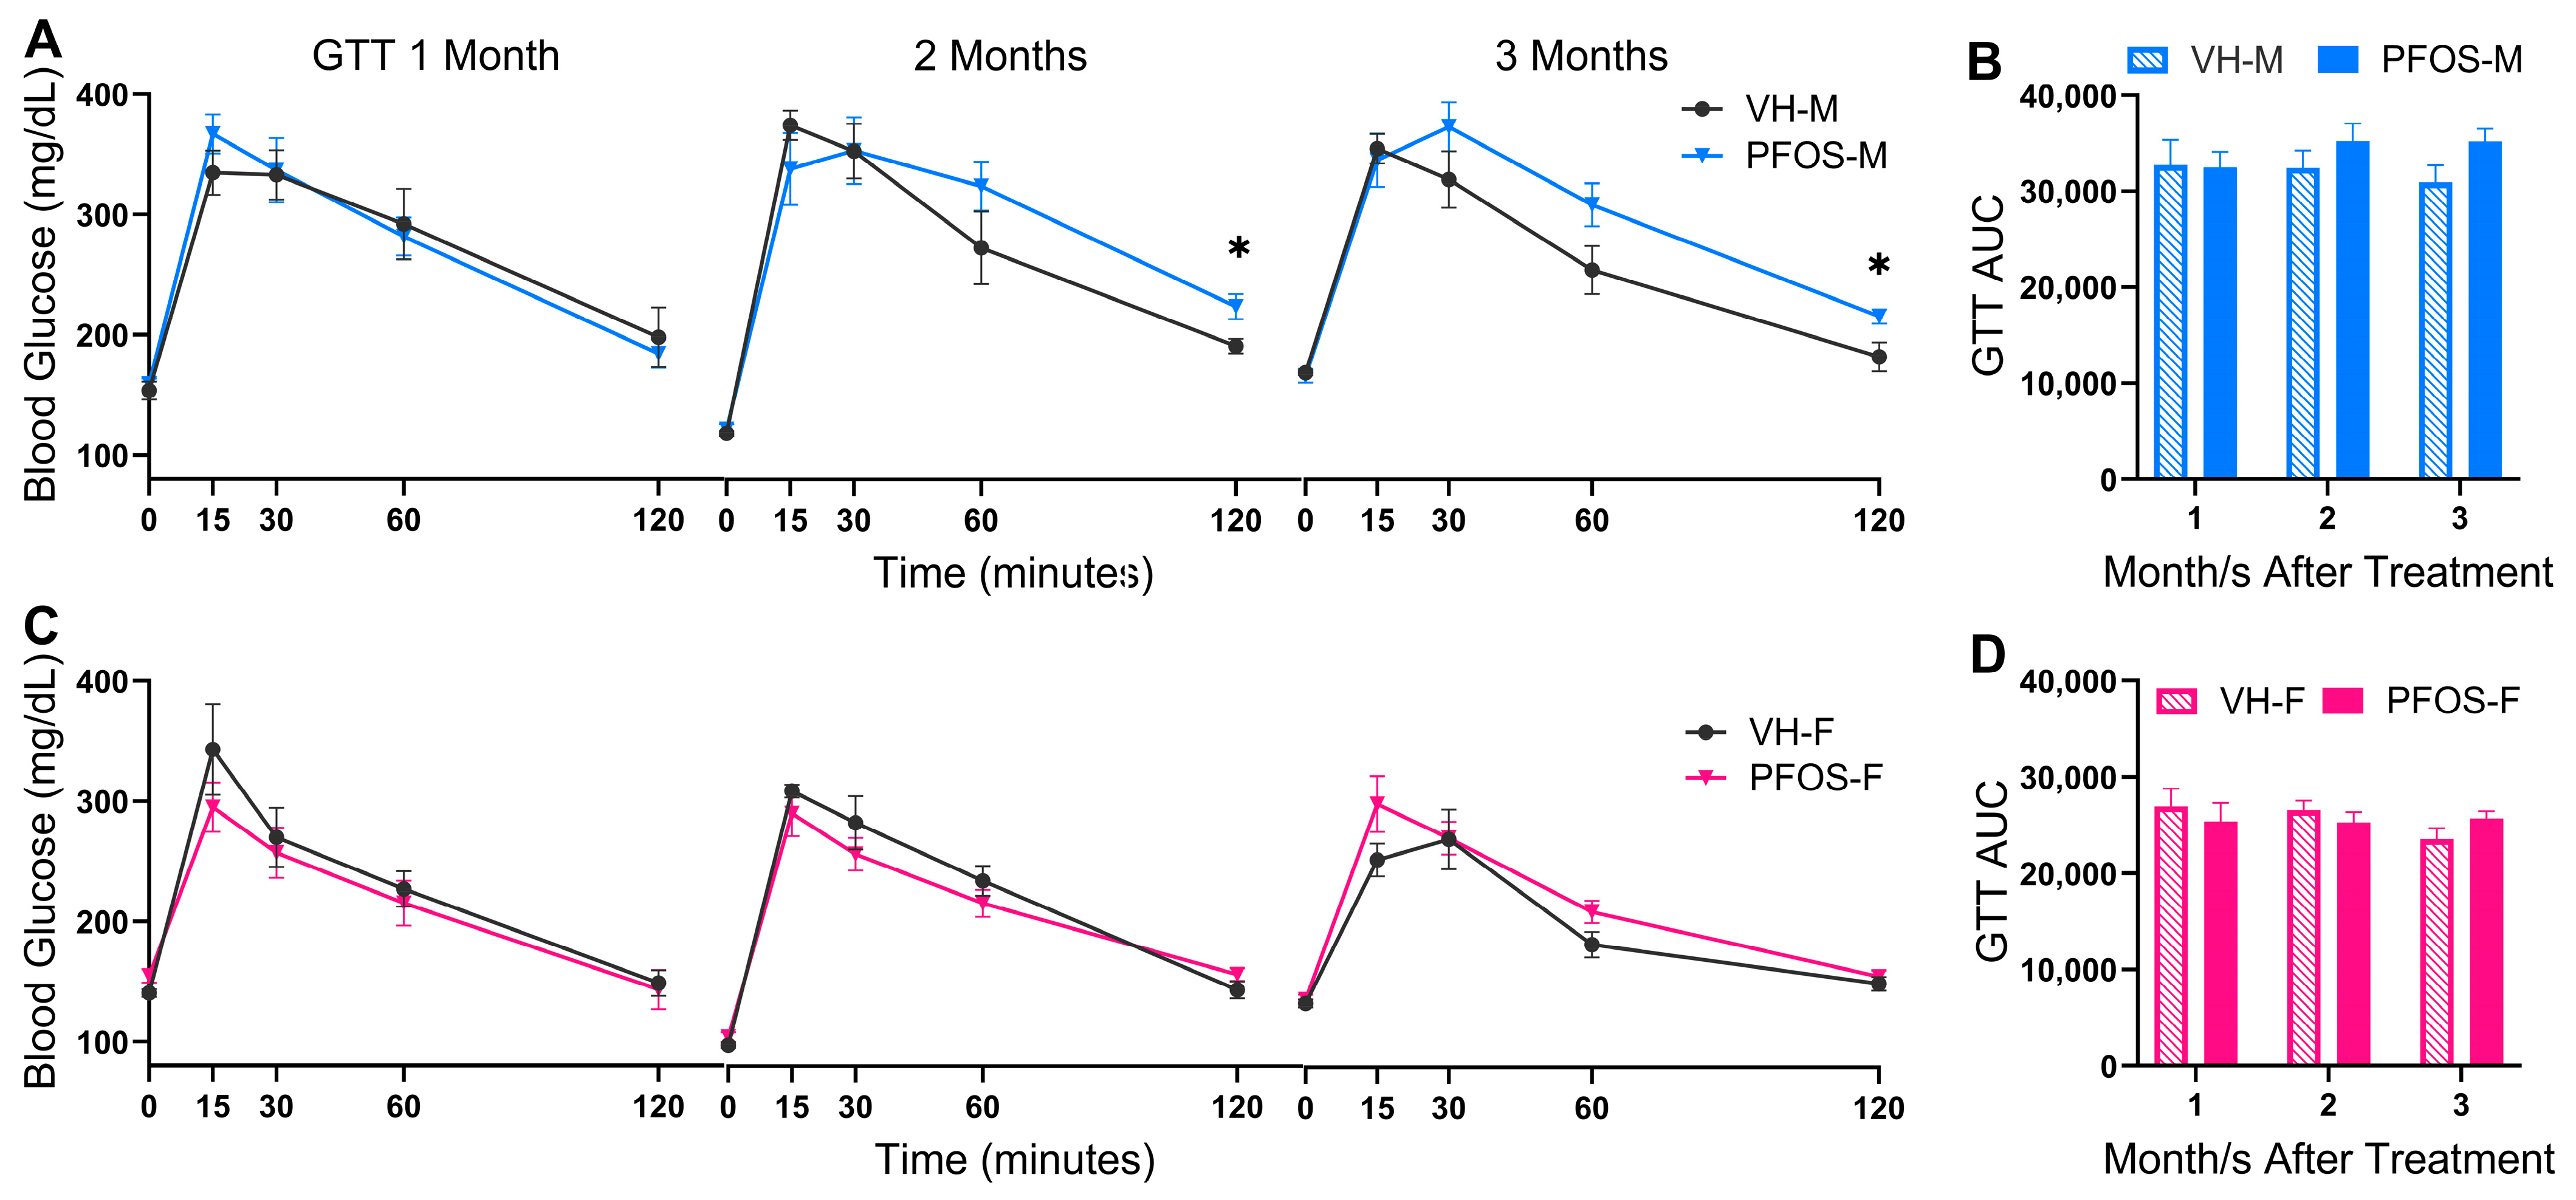
For GTTs, no significant differences between the groups were observed in male mice after one month of treatment. However, at the 120 min mark in both the second and third months, PFOS males exhibited significantly impaired glucose tolerance as higher BGLs than the VH groups were observed (p < 0.05 for both) (Figure 4A). Despite that, area under the curve showed no significant differences for all three GTTs (Figure 4B). In contrast, female groups did not exhibit significant differences in the GTTs and their associated area under the curve throughout the study period (Figure 4C,D), suggesting a sex-specific disruption in glucose metabolism.
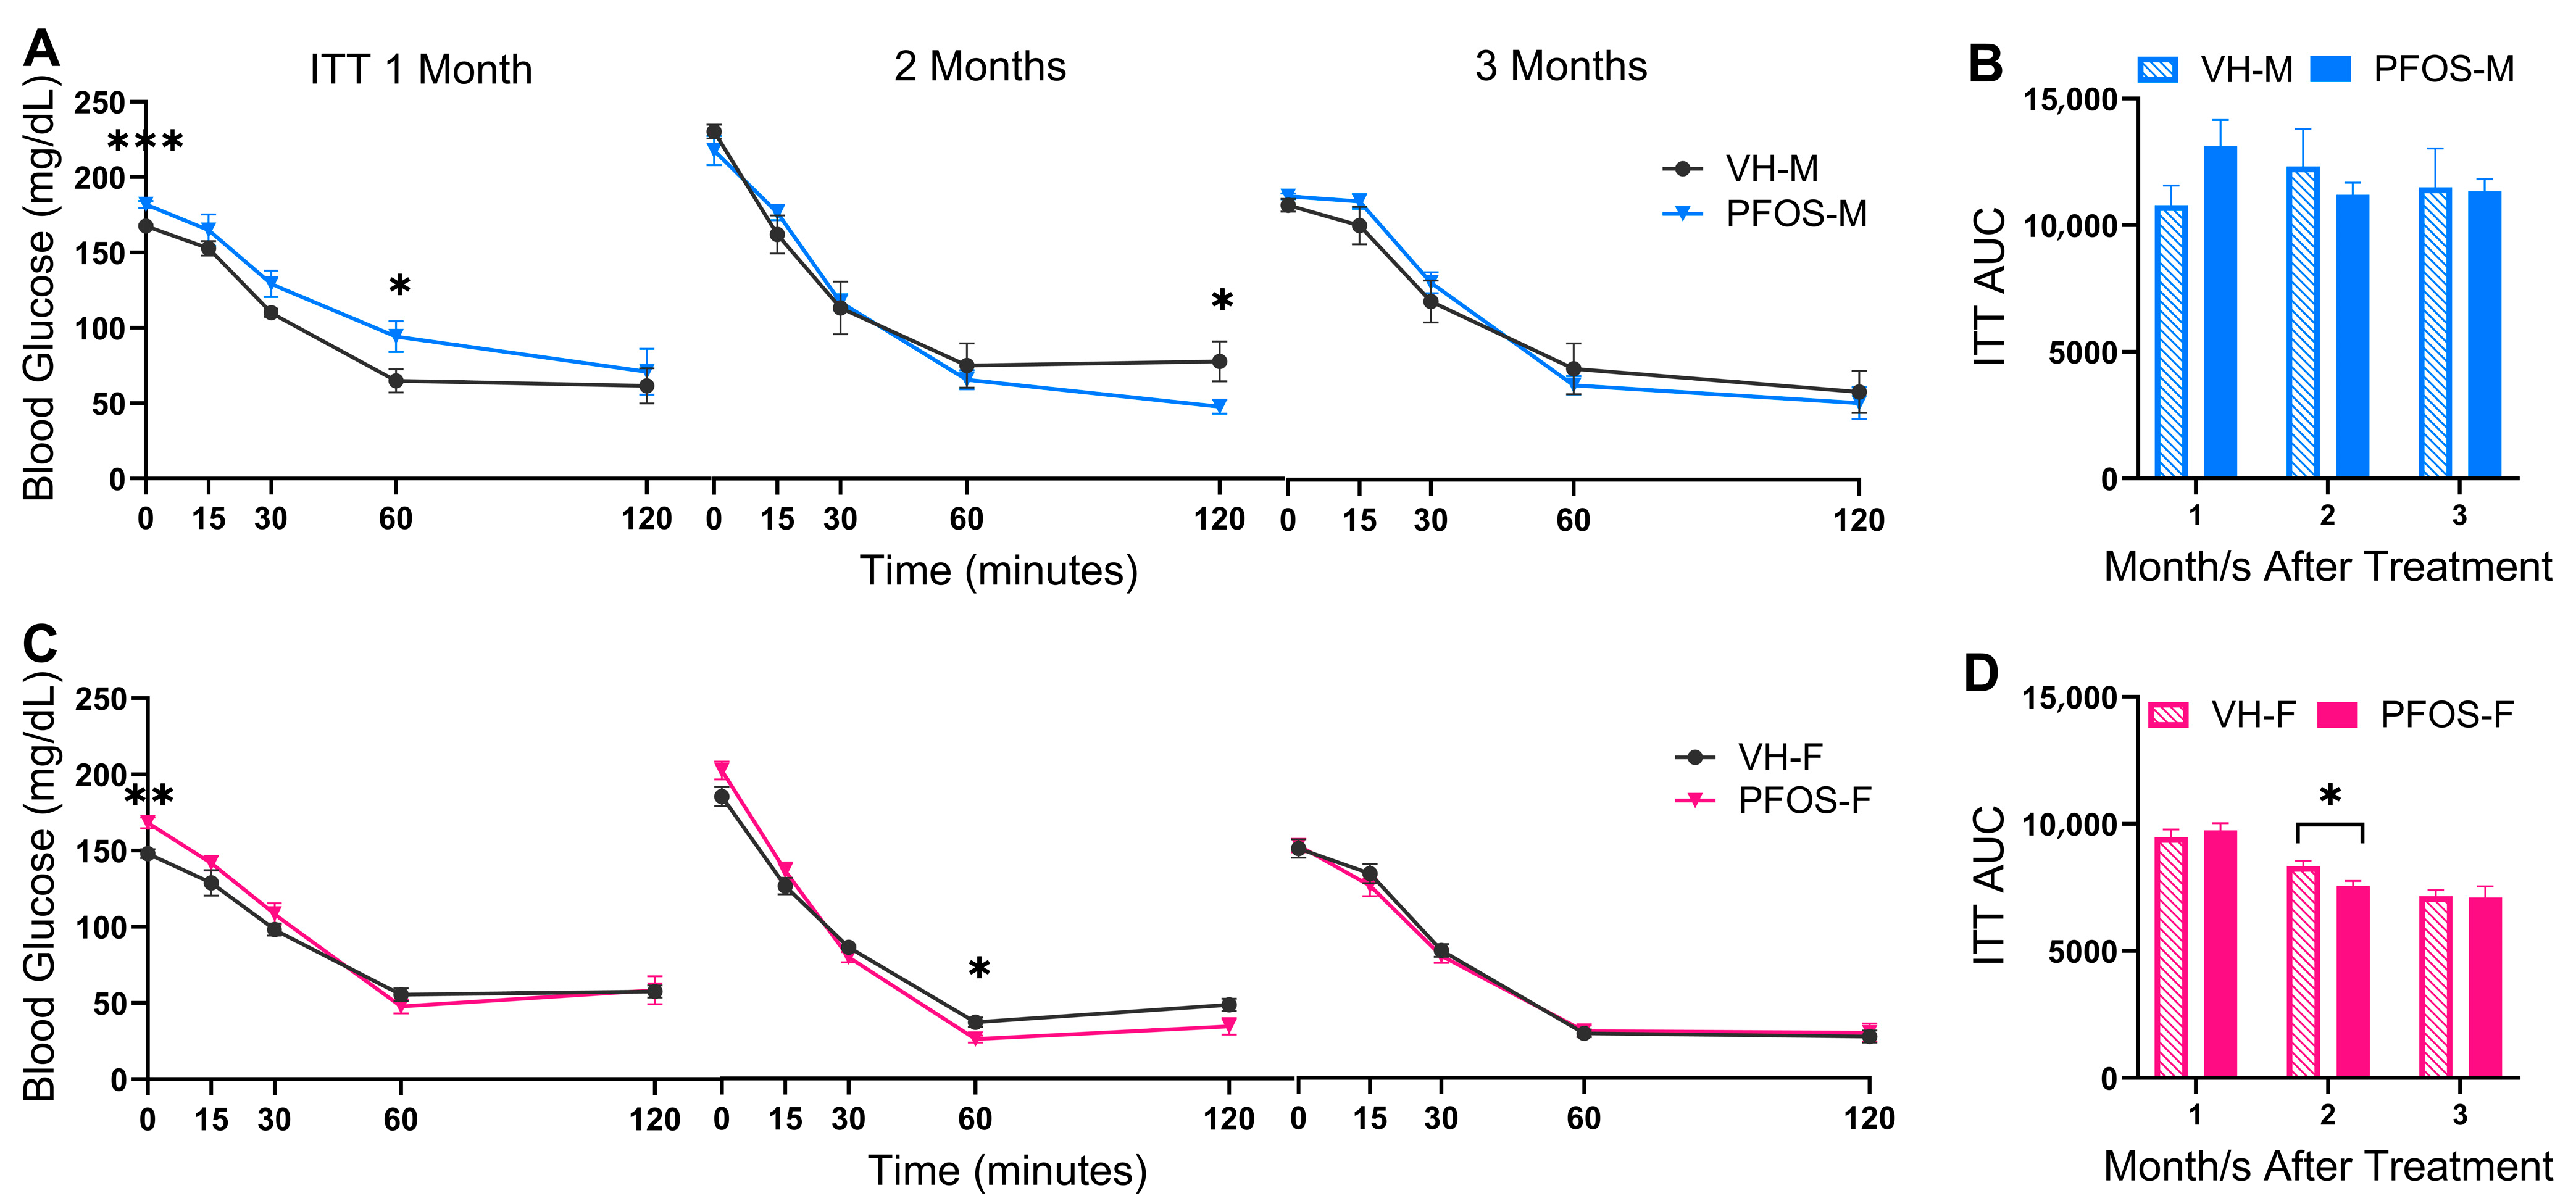
For ITTs, when compared to the VH group, significantly higher blood glucose levels were detected at the baseline (0 min) (p < 0.001) and 60 min (p < 0.05) marks in male mice after one month of treatment with PFOS, suggesting increased insulin tolerance (Figure 5A). However, significantly lower blood glucose levels at the 120 min mark were observed after two months of treatment with PFOS (p < 0.05), while no differences were found after three months of treatment. Additionally, no significant differences were observed in the associated area under the curves (Figure 5B).
For ITTs in female mice, a significant increase in fasting blood glucose levels was noted at baseline after one month of treatment in PFOS females (p < 0.01) (Figure 5C). After two months of treatment, PFOS females showed a significant delay in glucose recovery at the 60 min mark (p < 0.05). In the associated area under the curves after two months of treatment, PFOS females showed significantly decreased insulin tolerance (Figure 5C,D). No significant differences were observed in female ITTs after three months of treatment (Figure 5C).

3.3. Effects on Behaviors

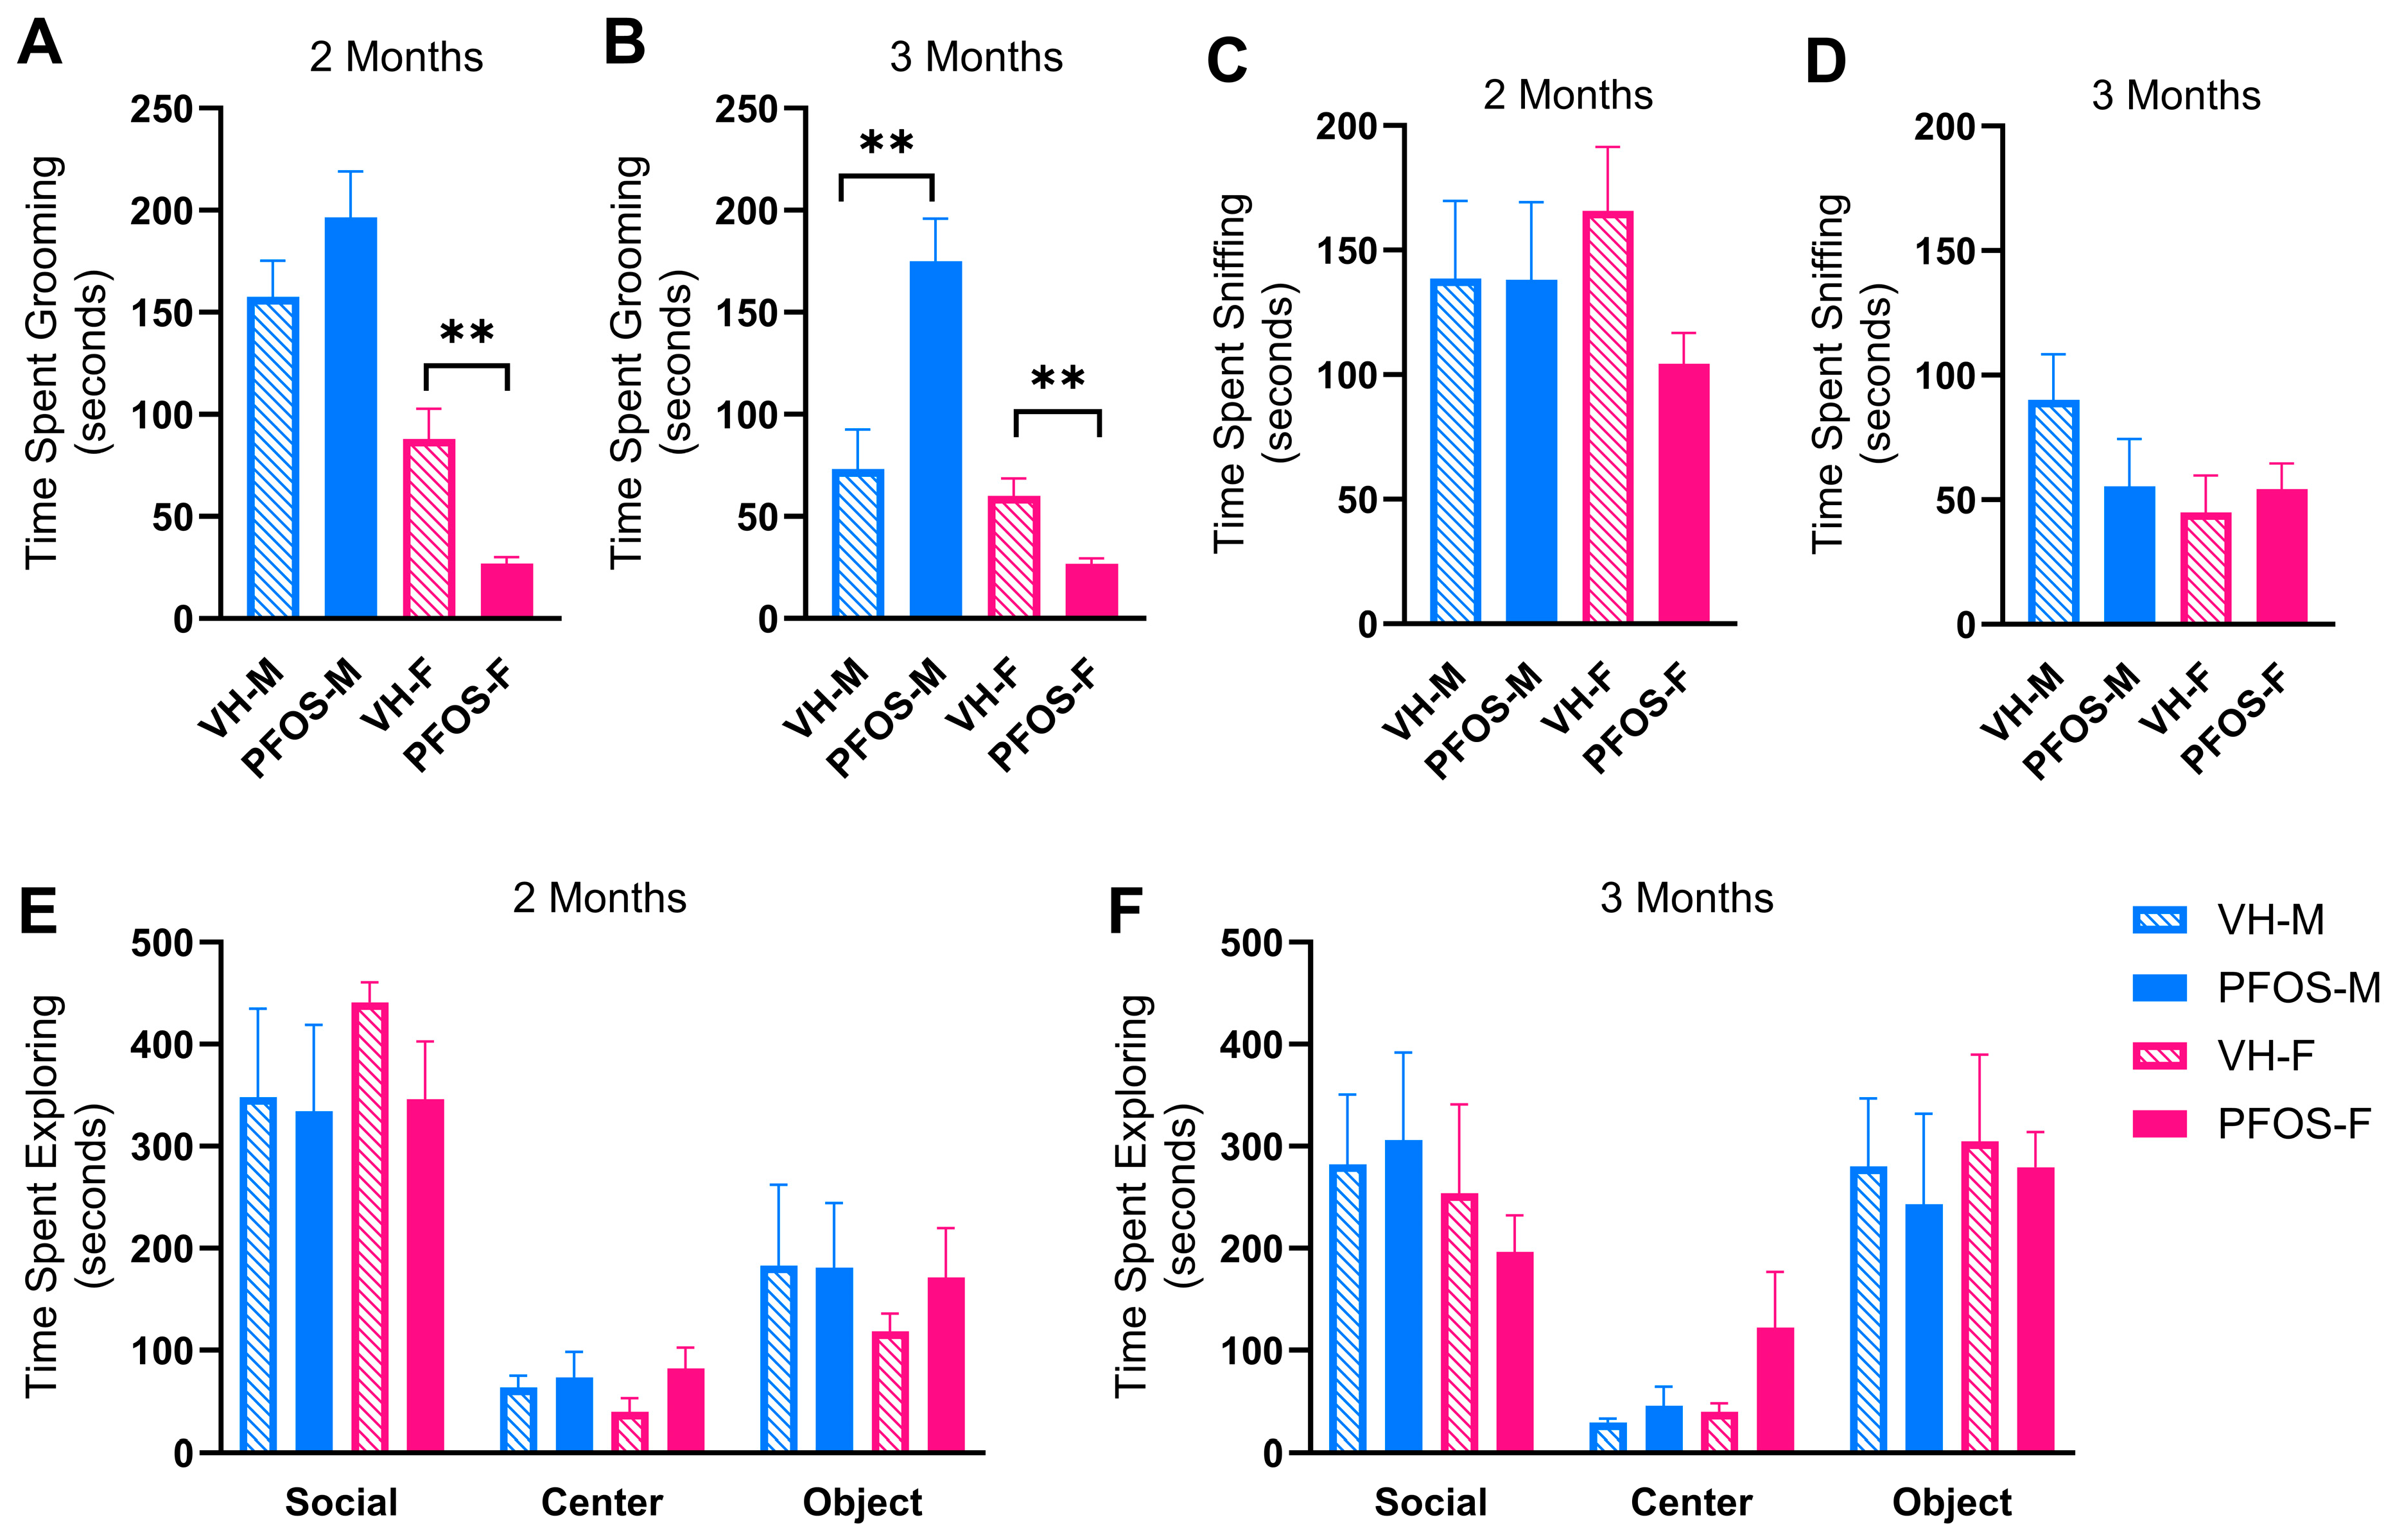
In male mice, the grooming behavior did not differ significantly between PFOS and VH groups after two months of treatment (Figure 6A). However, by the third month, PFOS males displayed a marked increase in grooming time compared to VH males (p < 0.005) (Figure 6B). In contrast, PFOS females exhibited a significant reduction in grooming time compared to VH females after two months of treatment (p < 0.005), an effect that persisted through the third month (p < 0.005) (Figure 6A,B).
The sniffing test showed no significant changes in social interaction behaviors in both male and female mice throughout the treatment period (Figure 6C,D). Similarly, in the three-chamber sociality test, no significant differences were observed across the three chambers (social, empty, and object) in either male or female mice after two and three months of treatment (Figure 6E,F).

3.4. Effects on Immunity

Flow-cytometric analysis of splenic leukocytes was employed to assess the immunomodulatory effects of PFOS treatment. In male mice, PFOS exposure significantly altered the percentages of splenic granulocytes and macrophages (Table 3). The %GR1+F480 granulocytes was significantly reduced (p < 0.05). In contrast, %Mac-3+ macrophages (p < 0.01) and %Mac-3+CD45R+ subset (p < 0.05) were significantly increased. In males, PFOS exposure also significantly increased the mean fluorescence intensity (MFI) of B220 on B220+CD40L+ cells (p < 0.001; Figure 7A) and B220+CD40L cells (p < 0.01; Figure 7B). Additionally, the MFI of CD40L was also increased in these two populations. Furthermore, the MFIs of CD45R and CD3 were increased in the CD45RCD3+ population (p < 0.01; Figure 7C).
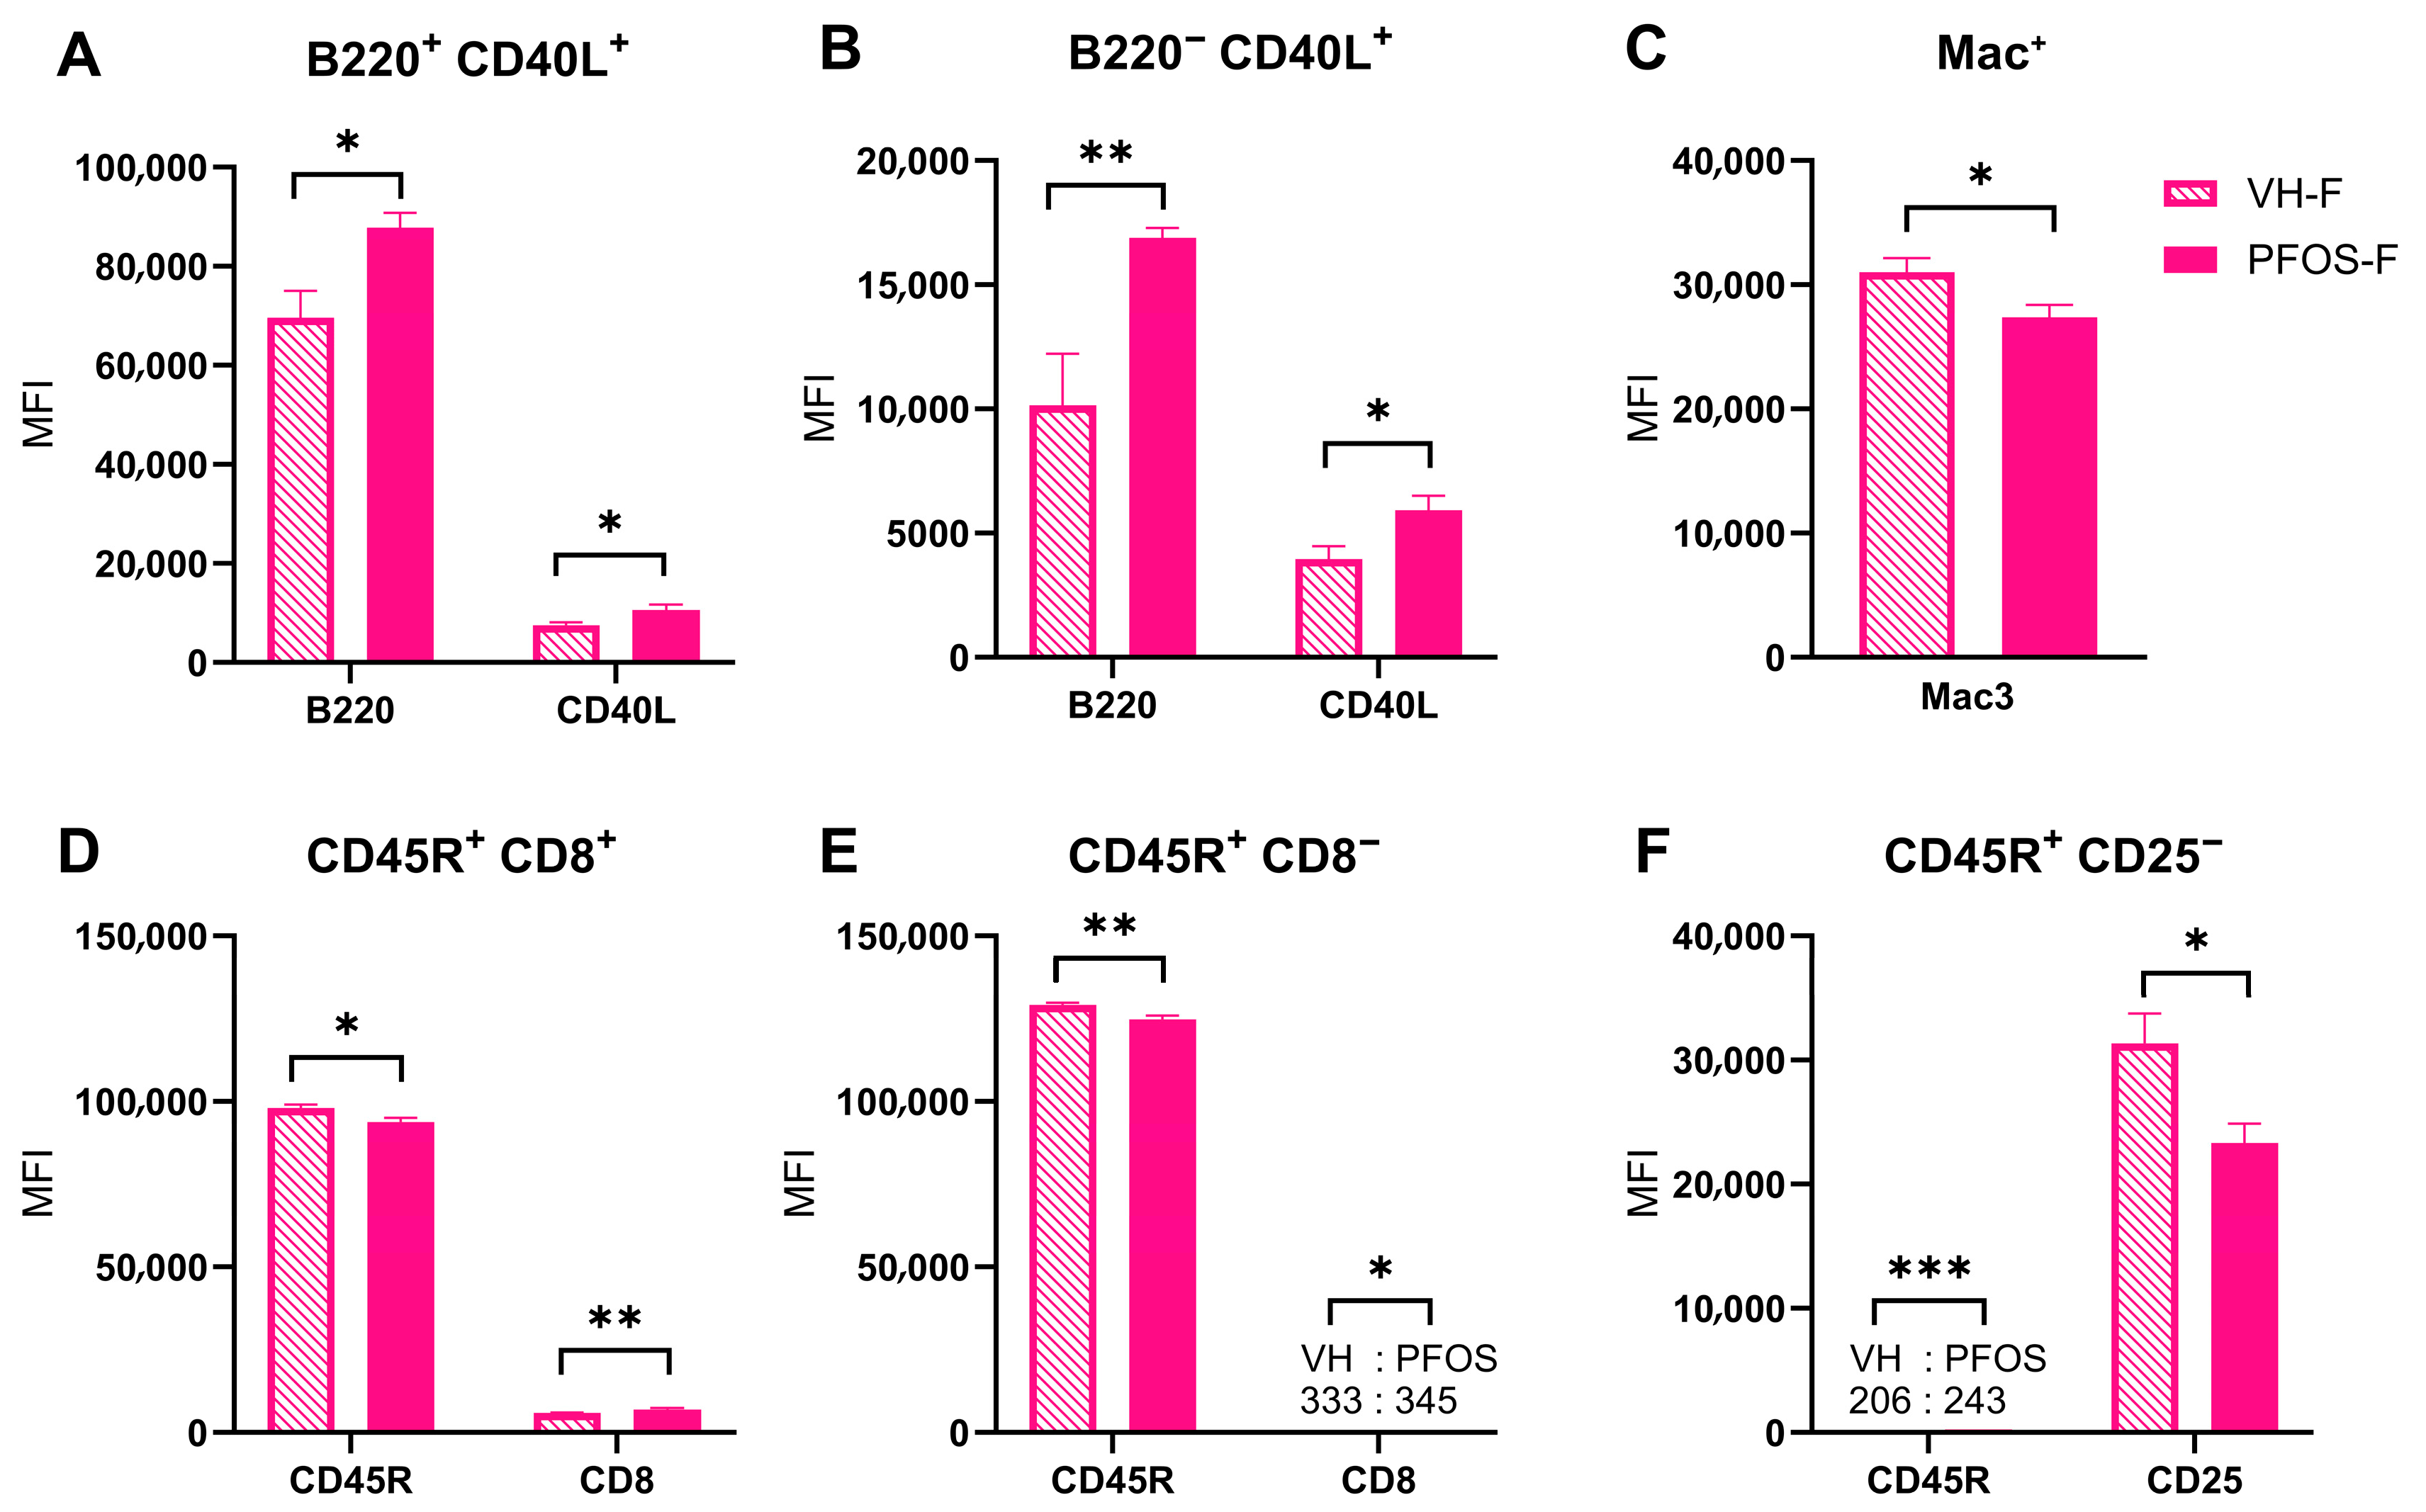
Similar to males, a significant increase in %Mac-3+ macrophages was also observed in PFOS-exposed females (p < 0.05, Table 4). Additionally, PFOS exposure significantly increased the percentages of CD4+CD8 T cells and B220+CD40L B cells (p < 0.05). Among T cells (CD3+), the percentages of following subsets were significantly elevated: CD8+CD25+ (p < 0.05), CD4+CD25+ (p < 0.01), and CD3+CD25+ (p < 0.05). In particular to CD25+ subsets, there were additional elevations in CD4CD25+ (p < 0.01), CD8CD25+ (p < 0.01), CD45R+CD25+ (p < 0.01), CD45RCD25+ (p < 0.01), and CD3CD25+ (p < 0.01) cells. MFI analysis in females further revealed increased surface expressions of B220 and CD40L on B220+CD40L+ (p < 0.05; Figure 8A) and B220CD40L+ (p < 0.01; Figure 8B) cells, while the MFI of Mac-3+ cells was reduced (p < 0.05; Figure 8C). Additionally, there were increased surface expressions of CD8 (p < 0.01) by CD45R+CD8+ and CD45R+CD8 cells; however, the MFI of CD45R was decreased in these two populations (Figure 8D,E). Additionally, there was increased surface expression of CD45R and decreased expression of CD25 by CD45R+CD25 cells (Figure 8F).

4. Discussion and Conclusions

This study presents the first integrated metabolic, immunologic, and behavioral profiling of PFOS exposure in BTBR-mtB6 mice, a murine model for ASD. Our aim was to investigate how PFOS, a well-known environmental pollutant, might differentially affect males and female BTBR-mtB6 mice in ways relevant to ASD pathophysiology. Consistent with previously reported PFOS-induced hepatotoxicity, we observed increased liver weights in both male and female BTBR-mtB6 mice. This might be due to liver hypertrophy or lipid accumulation, both of which are associated with PFOS-induced activation of peroxisome proliferator-activated receptor alpha (PPAR-α) [38,39,40]. Several additional PFOS-induced effects were observed in both sexes, including increased % macrophages, elevated surface expressions of B220 and CD40L, dysregulated glucose homeostasis, and altered insulin resistance. However, sex-specific differences emerged in ASD-relevant outcomes: male mice generally exhibited exacerbated responses to PFOS exposure, while females displayed a more complex interplay between immune modulation and behavioral outcomes.
PFOS disrupted blood glucose homeostasis in both sexes under non-fasting conditions, beginning between one and two months of treatment. The overall trends suggest metabolic dysregulation—particularly in males, who displayed slower glucose clearance and delayed return to baseline glucose levels. In PFOS-treated females, delayed glucose recovery was also observed. Notably, BGLs were lowered at the 120 min time point in the 2-month ITT in PFOS females compared to VH females. This might reflect altered counter-regulatory mechanisms that are known to take place at that time post-insulin injection [41]. Although most changes in GTTs and ITTs did not reach statistical significance for the area under the curve, the consistent directional trends suggest potentially meaningful disruptions in glucose regulation. Subtle shifts such as delayed glucose clearance and altered recovery dynamics can be functionally significant and biologically relevant, even in the absence of statistical significance. Taken together, prolonged PFOS exposure may impair glucose metabolism, potentially contributing to insulin resistance, particularly in the earlier phases of exposure. However, when comparing both sexes, PFOS might have a more pronounced impact on glucose regulation in males than females.
Through behavioral studies, it was found that PFOS had differential effects across sexes. PFOS-treated male mice exhibited increased grooming behaviors, suggestive of heightened anxiety and repetitive behaviors commonly associated with ASD. In contrast, PFOS exposure caused female mice to groom less, suggestive of an altered behavioral regulation. Previous studies have shown that PFAS compounds are amphiphilic and tend to accumulate in lipid-rich tissues, such as adipose tissue [42] and potentially the myelin sheath, the oligodendroglial membrane wrapped around long projecting axons [43]. Disruption of myelin integrity could impair signal transmission in the central and peripheral nervous systems. Additionally, as well-known endocrine disruptors, PFAS compounds may interfere with thyroid hormone signaling [44], which is critical for oligodendrocyte maturation and myelination. These effects may contribute to disrupted sensory integration, inter-regional brain communication, and overall brain function, potentially leading to the exacerbation of ASD-like behaviors in male mice [45]. This is especially relevant considering that males are diagnosed with ASD at a rate approximately three times higher than females.
In females, PFOS exposure led to a significant reduction in relative lean tissue in females, accompanied by decreased relative weights of most organs except for the liver, brain and kidneys. In particular, the spleen exhibited a significant reduction in weight, which might suggest a potential immunotoxicity, as decreased spleen size can be associated with impaired immune function [46,47]. To explore this further, immune cell populations were profiled to assess potential immune alterations. PFOS-exposed females exhibited increased percentages of CD8+CD25+, CD4+CD25+ and CD3+CD25+ T cells. While CD25 (IL-2 receptor α chain) is associated with T cell activation, elevated CD25 expression across T cell subsets may indicate the induction of a regulatory T cell-like phenotype, as CD25 plays a central role in immunosuppression and immune regulation [48]. Furthermore, female B cell compartments showed increased B220+CD40L cells, possibly representing less activated or transitional B cells [49]. While %Mac-3+ macrophages was increased, reduced surface expression of Mac-3 by these macrophages suggested decreased phagocytic activity or metabolic suppression. In other words, despite numeric expansion, macrophage functionality may be impaired by PFOS in females. Whether this dampened innate immune activation contributes to improved behavioral outcomes in females—potentially by reducing neuroinflammation via significantly decreased macrophage/microglial activation—warrants further investigation.
Sex-specific immune changes were particularly notable. In males, GR1+F4/80 granulocyte populations were suppressed, suggesting weakened innate immune defenses against pathogens. At the same time, pro-inflammatory Mac-3+ or Mac-3+CD45R+ macrophage populations were expanded, indicating compensatory activation of myeloid cells. It has been shown that elevated CD45R expression on macrophages was associated with increased inflammatory phenotype [50]. These findings suggest that PFOS exposure in males may impair the initial barrier response (innate immune cells like granulocytes) while activating downstream inflammatory responses (macrophages, B cells, T cells), resulting in persistent chronic inflammation or ineffective pathogen clearance. Additional immune alterations in males included increased surface expressions of B220 and CD40L, indicating activation and/or expansion of both naïve and activated B cells [51]. Furthermore, PFOS-mediated elevation of CD40L and CD3 expression might reflect enhanced B-T cell interaction and greater antigen presentation potential, which could promote aberrant humoral responses or autoantibody production—findings consistent with previous reports of PFOS-induced immune dysregulation in animal models [6,31,52]. Finally, increased CD3 expression supports enhanced T cell activation, particularly within the cytotoxic T cell compartment. These findings align with previous reports demonstrating PFOS-driven immune hyperactivation, particularly in male rodents [6,31].
In conclusion, PFOS exposure produced sex-specific effects on metabolic profiles, immunity, and behaviors in the BTBR-mtB6 mice. Males exhibited impaired glucose metabolism and insulin tolerance, heightened inflammatory responses (e.g., altered innate and adaptive immune cell populations, including granulocytes, macrophages, B cells, and T cells), and exacerbated ASD-like behaviors. In contrast, females exhibited impaired insulin tolerance, decreased relative lean tissue and spleen weights, and differential immune modulation. The latter might result in immune dysregulation, and potentially, immunosuppression through T regulatory cells that may contribute to neurobehavioral improvement.

5. Future Directions

As part of our ongoing efforts to further characterize the BTBR-mtB6 mice, several future directions are being considered. Given that PFOS is a known endocrine-disrupting chemical, it may have influenced the observed outcomes through hormonal signaling pathways. For example, a recent study demonstrated that exposure to a PFAS mixture (2 nM PFHxS, 7 nM PFOA, 10 nM PFOS) increased basal progesterone secretion in human granulosa cells [53]. Progesterone and its neuroactive metabolite, allopregnanolone, are known to exert anxiolytic effects through GABAA receptor activation to produce calming effects, suggesting a potential mechanism underlying the behavioral changes observed [54]. Additionally, estrogen receptor β (ERβ) has been implicated in mediating PFOS-induced hepatotoxicity [55], and its higher expression in the cortex and hippocampus of female mice may contribute to sex-specific behavioral responses seen in this study [56,57]. To elucidate the role of ovarian hormones in PFOS metabolism and neuronal responses, future work could employ ovariectomy models. However, as circulating hormones were not measured in this study, interpretations regarding hormonal mediation remain speculative and should be interpreted with caution. Furthermore, c-Fos immunostaining may be employed to verify potential inactivation of the septal nucleus, paraventricular thalamus, and locus coeruleus by PFOS in female mice—brain regions implicated in anxiety-like behaviors and are known to be activated by PFOS [58]. Given the well-established links between chronic stress, hypothalamic–pituitary–adrenal axis dysregulation and autism-like behaviors [59], cortisol measurements could offer further insight into how PFOS modulates stress-related neuroendocrine signaling.
The gut microbiota represents another promising area for exploration. It plays a critical role in neurotransmitter synthesis, such as γ-aminobutyric acid (GABA) and serotonin (5-hydroxytryptamine), both of which are involved in mood regulation and the attenuation of compulsive and anxiety-like behaviors [17,60]. Changes in the microbial composition, particularly increases in short-chain fatty acid (SCFA)-producing bacteria, may strengthen gut barrier function, regulate immune responses, and promote anti-inflammatory effects [61,62]. These microbial shifts could help explain the reduced grooming behavior observed in PFOS-treated females and support a role for gut–brain axis in mitigating ASD-like symptoms. To better understand the differential inflammatory responses between sexes, profiling of multiple cytokines and chemokines would be considered. Intracellular staining of Foxp3 in CD4+CD25+ T cells would further validate the regulatory T-cell-mediated suppression suggested by our data. The creation of BTBR-mtB6 strain, by replacing BTBR mitochondria with maternally inherited mitochondria from C57BL/6 mice, was crucial in understanding the role of mitochondria in ASD and studying mitochondrion-mediated functions. However, improved mitochondrial function in this model may have attenuated some of the PFOS-induced effects [63]. Therefore, further studies of PFOS toxicity in other ASD models are warranted. Finally, integrative approaches combining transcriptomics and untargeted metabolomics would provide comprehensive insights into the gene expression changes and metabolic pathways disrupted by PFOS exposure.

Supplementary Materials

The following supporting information can be downloaded at: https://www.mdpi.com/article/10.3390/sci7030118/s1. Table S1: Percentage (%) of various immune cell populations identified by flow cytometry in male mice; Table S2: Percentage (%) of various immune cell populations identified by flow cytometry in female mice.

Author Contributions

D.Q.Y.J., methodology, formal analysis, investigation, data curation, visualization, writing—original draft, writing—reviewing and editing. F.E., data curation. J.I.N., data curation. T.L.G., validation, resources, supervision, and writing—reviewing and editing. All authors have read and agreed to the published version of the manuscript.

Funding

This work was supported in part by UGA Interdisciplinary Toxicology Program, NIH R21ES24487 and USDA National Institute of Food and Agriculture [Grant #2016-67021-24994/project accession no. 1009090].

Acknowledgments

The authors appreciate David A. Lawrence (Wadsworth Center, New York State Department of Health, Albany, NY, USA) for his critical comments.

Conflicts of Interest

The authors declare no conflict of interest.

References

  1. NIH. Perfluoroalkyl and Polyfluoroalkyl Substances (PFAS). 2024. Available online: https://www.niehs.nih.gov/health/topics/agents/pfc (accessed on 31 May 2025).
  2. EPA. Key EPA Actions to Address PFAS. Available online: https://www.epa.gov/pfas/key-epa-actions-address-pfas (accessed on 2 July 2024).
  3. Fuentes, S.; Vicens, P.; Colomina, M.T.; Domingo, J.L. Behavioral effects in adult mice exposed to perfluorooctane sulfonate (PFOS). Toxicology 2007, 242, 123–129. [Google Scholar] [CrossRef]
  4. Dong, G.-H.; Liu, M.-M.; Wang, D.; Zheng, L.; Liang, Z.-F.; Jin, Y.-H. Sub-chronic effect of perfluorooctanesulfonate (PFOS) on the balance of type 1 and type 2 cytokine in adult C57BL6 mice. Arch. Toxicol. 2011, 85, 1235–1244. [Google Scholar] [CrossRef]
  5. Wan, H.T.; Cheung, L.Y.; Chan, T.F.; Li, M.; Lai, K.P.; Wong, C.K.C. Characterization of PFOS toxicity on in-vivo and ex-vivo mouse pancreatic islets. Environ. Pollut. 2021, 289, 117857. [Google Scholar] [CrossRef]
  6. Zheng, L.; Dong, G.-H.; Jin, Y.-H.; He, Q.-C. Immunotoxic changes associated with a 7-day oral exposure to perfluorooctanesulfonate (PFOS) in adult male C57BL/6 mice. Arch. Toxicol. 2009, 83, 679–689. [Google Scholar] [CrossRef]
  7. Giulivi, C.; Zhang, Y.-F.; Omanska-Klusek, A.; Ross-Inta, C.; Wong, S.; Hertz-Picciotto, I.; Tassone, F.; Pessah, I.N. Mitochondrial Dysfunction in Autism. JAMA 2010, 304, 2389. [Google Scholar] [CrossRef]
  8. Yui, K.; Sato, A.; Imataka, G. Mitochondrial Dysfunction and Its Relationship with mTOR Signaling and Oxidative Damage in Autism Spectrum Disorders. Mini-Rev. Med. Chem. 2015, 15, 373–389. [Google Scholar] [CrossRef] [PubMed]
  9. Valiente-Pallejà, A.; Torrell, H.; Muntané, G.; Cortés, M.J.; Martínez-Leal, R.; Abasolo, N.; Alonso, Y.; Vilella, E.; Martorell, L. Genetic and clinical evidence of mitochondrial dysfunction in autism spectrum disorder and intellectual disability. Hum. Mol. Genet. 2018, 27, 891–900. [Google Scholar] [CrossRef] [PubMed]
  10. Foguth, R.M.; Flynn, R.W.; De Perre, C.; Iacchetta, M.; Lee, L.S.; Sepúlveda, M.S.; Cannon, J.R. Developmental exposure to perfluorooctane sulfonate (PFOS) and perfluorooctanoic acid (PFOA) selectively decreases brain dopamine levels in Northern leopard frogs. Toxicol. Appl. Pharmacol. 2019, 377, 114623. [Google Scholar] [CrossRef] [PubMed]
  11. Johansson, N.; Fredriksson, A.; Eriksson, P. Neonatal exposure to perfluorooctane sulfonate (PFOS) and perfluorooctanoic acid (PFOA) causes neurobehavioural defects in adult mice. Neuro Toxicol. 2008, 29, 160–169. [Google Scholar] [CrossRef]
  12. Yu, N.; Wei, S.; Li, M.; Yang, J.; Li, K.; Jin, L.; Xie, Y.; Giesy, J.P.; Zhang, X.; Yu, H. Effects of Perfluorooctanoic Acid on Metabolic Profiles in Brain and Liver of Mouse Revealed by a High-throughput Targeted Metabolomics Approach. Sci. Rep. 2016, 6, 23963. [Google Scholar] [CrossRef]
  13. Shi, L.; Zheng, J.; Yan, S.; Li, Y.; Wang, Y.; Liu, X.; Xiao, C. Exposure to Perfluorooctanoic Acid Induces Cognitive Deficits via Altering Gut Microbiota Composition, Impairing Intestinal Barrier Integrity, and Causing Inflammation in Gut and Brain. J. Agric. Food Chem. 2020, 68, 13916–13928. [Google Scholar] [CrossRef]
  14. Patel, R.; Bradner, J.; Stout, K.; Caudle, W. Alteration to Dopaminergic Synapses Following Exposure to Perfluorooctane Sulfonate (PFOS), in Vitro and in Vivo. Med. Sci. 2016, 4, 13. [Google Scholar] [CrossRef]
  15. Long, Y.; Wang, Y.; Ji, G.; Yan, L.; Hu, F.; Gu, A. Neurotoxicity of Perfluorooctane Sulfonate to Hippocampal Cells in Adult Mice. PLoS ONE 2013, 8, e54176. [Google Scholar] [CrossRef]
  16. Liu, X.; Jin, Y.; Liu, W.; Wang, F.; Hao, S. Possible mechanism of perfluorooctane sulfonate and perfluorooctanoate on the release of calcium ion from calcium stores in primary cultures of rat hippocampal neurons. Toxicol. Vitr. 2011, 25, 1294–1301. [Google Scholar] [CrossRef]
  17. Jiang, D.Q.Y.; Guo, T.L. Interaction between Per- and Polyfluorinated Substances (PFAS) and Acetaminophen in Disease Exacerbation—Focusing on Autism and the Gut–Liver–Brain Axis. Toxics 2024, 12, 39. [Google Scholar] [CrossRef]
  18. Oh, J.; Bennett, D.H.; Calafat, A.M.; Tancredi, D.; Roa, D.L.; Schmidt, R.J.; Hertz-Picciotto, I.; Shin, H.-M. Prenatal exposure to per- and polyfluoroalkyl substances in association with autism spectrum disorder in the MARBLES study. Environ. Int. 2021, 147, 106328. [Google Scholar] [CrossRef] [PubMed]
  19. Choi, J.W.; Oh, J.; Bennett, D.H.; Calafat, A.M.; Schmidt, R.J.; Shin, H.-M. Prenatal exposure to per- and polyfluoroalkyl substances and child behavioral problems. Environ. Res. 2024, 251, 118511. [Google Scholar] [CrossRef] [PubMed]
  20. Shin, H.-M.; Bennett, D.H.; Calafat, A.M.; Tancredi, D.; Hertz-Picciotto, I. Modeled prenatal exposure to per- and polyfluoroalkyl substances in association with child autism spectrum disorder: A case-control study. Environ. Res. 2020, 186, 109514. [Google Scholar] [CrossRef] [PubMed]
  21. Oh, J.; Shin, H.-M.; Kannan, K.; Busgang, S.A.; Schmidt, R.J.; Schweitzer, J.B.; Hertz-Picciotto, I.; Bennett, D.H. Childhood exposure to per- and polyfluoroalkyl substances and neurodevelopment in the CHARGE case-control study. Environ. Res. 2022, 215, 114322. [Google Scholar] [CrossRef]
  22. Mascari, M.; Cohen, N.; Yao, M.; Huang, J.; Lane, J.; Reeves, K.W.; Balasubramanian, R.; Liu, Z.; Laouali, N.; Daniel, L.M.; et al. Associations of cord blood concentrations of perfluoroalkyl substances with autistic traits in Singaporean children: The growing up in Singapore towards healthy outcomes study. Chemosphere 2025, 371, 144040. [Google Scholar] [CrossRef]
  23. Lin, L.-Z.; Jin, N.; He, W.-T.; Zhang, Y.-T.; Huang, J.-W.; Liang, L.-X.; Zhou, J.-X.; Zhang, Z.-Q.; Wang, X.; Gui, Z.-H.; et al. Associations of childhood per- and polyfluoroalkyl substances with autistic traits and symptom severities among children with and without autism spectrum disorder. Hyg. Environ. Health Adv. 2025, 15, 100131. [Google Scholar] [CrossRef]
  24. Yao, Y.; Uddin, M.N.; Manley, K.; Lawrence, D.A. Improvements of autism-like behaviors but limited effects on immune cell metabolism after mitochondrial replacement in BTBR T Itpr3/J mice. J. Neuroimmunol. 2022, 368, 577893. [Google Scholar] [CrossRef]
  25. Heo, Y.; Zhang, Y.; Gao, D.; Miller, V.M.; Lawrence, D.A. Aberrant Immune Responses in a Mouse with Behavioral Disorders. PLoS ONE 2011, 6, e20912. [Google Scholar] [CrossRef] [PubMed]
  26. Zhang, Y.; Gao, D.; Kluetzman, K.; Mendoza, A.; Bolivar, V.J.; Reilly, A.; Jolly, J.K.; Lawrence, D.A. The maternal autoimmune environment affects the social behavior of offspring. J. Neuroimmunol. 2013, 258, 51–60. [Google Scholar] [CrossRef] [PubMed]
  27. Silverman, J.L.; Tolu, S.S.; Barkan, C.L.; Crawley, J.N. Repetitive Self-Grooming Behavior in the BTBR Mouse Model of Autism is Blocked by the mGluR5 Antagonist MPEP. Neuropsychopharmacology 2010, 35, 976–989. [Google Scholar] [CrossRef] [PubMed]
  28. Stephenson, D.T.; O’Neill, S.M.; Narayan, S.; Tiwari, A.; Arnold, E.; Samaroo, H.D.; Du, F.; Ring, R.H.; Campbell, B.; Pletcher, M.; et al. Histopathologic characterization of the BTBR mouse model of autistic-like behavior reveals selective changes in neurodevelopmental proteins and adult hippocampal neurogenesis. Mol. Autism 2011, 2, 7. [Google Scholar] [CrossRef]
  29. Al-Kafaji, G.; Jahrami, H.A.; Alwehaidah, M.S.; Alshammari, Y.; Husni, M. Mitochondrial DNA copy number in autism spectrum disorder and attention deficit hyperactivity disorder: A systematic review and meta-analysis. Front. Psychiatry 2023, 14, 1196035. [Google Scholar] [CrossRef]
  30. EPA. Final Toxicity Assessment for Perfluorooctane Sulfonic Acid (PFOS); U.S. Environmental Protection Agency: Washington, DC, USA, 2024.
  31. Peden-Adams, M.M.; Keller, J.M.; Eudaly, J.G.; Berger, J.; Gilkeson, G.S.; Keil, D.E. Suppression of Humoral Immunity in Mice following Exposure to Perfluorooctane Sulfonate. Toxicol. Sci. 2008, 104, 144–154. [Google Scholar] [CrossRef]
  32. Xing, J.; Wang, G.; Zhao, J.; Wang, E.; Yin, B.; Fang, D.; Zhao, J.; Zhang, H.; Chen, Y.Q.; Chen, W. Toxicity assessment of perfluorooctane sulfonate using acute and subchronic male C57BL/6J mouse models. Environ. Pollut. 2016, 210, 388–396. [Google Scholar] [CrossRef]
  33. Olsen, G.W.; Burris, J.M.; Ehresman, D.J.; Froehlich, J.W.; Seacat, A.M.; Butenhoff, J.L.; Zobel, L.R. Half-Life of Serum Elimination of Perfluorooctanesulfonate, Perfluorohexanesulfonate, and Perfluorooctanoate in Retired Fluorochemical Production Workers. Environ. Health Perspect. 2007, 115, 1298–1305. [Google Scholar] [CrossRef]
  34. Olsen, G.W.; Burris, J.M.; Mandel, J.H.; Zobel, L.R. Serum Perfluorooctane Sulfonate and Hepatic and Lipid Clinical Chemistry Tests in Fluorochemical Production Employees. J. Occup. Environ. Med. 1999, 41, 799–806. [Google Scholar] [CrossRef]
  35. Olsen, G.W.; Burris, J.M.; Mandel, J.H.; Zobel, L.R. Epidemiologic Assessment of Worker Serum Perfluorooctanesulfonate (PFOS) and Perfluorooctanoate (PFOA) Concentrations and Medical Surveillance Examinations. J. Occup. Environ. Med. 2003, 45, 260–270. [Google Scholar] [CrossRef]
  36. East, A.; Egeghy, P.P.; Hubal, E.A.C.; Slover, R.; Vallero, D.A. Computational estimates of daily aggregate exposure to PFOA/PFOS from 2011 to 2017 using a basic intake model. J. Expo. Sci. Environ. Epidemiol. 2023, 33, 56–68. [Google Scholar] [CrossRef]
  37. Rein, B.; Ma, K.; Yan, Z. A standardized social preference protocol for measuring social deficits in mouse models of autism. Nat. Protoc. 2020, 15, 3464–3477. [Google Scholar] [CrossRef] [PubMed]
  38. Wang, L.; Cao, H.; Zhou, Z.; Pan, Y.; Liu, G.; Wang, T.; Wang, Y.; Xiao, M.; Chen, S.; Liang, Y. Perfluorooctanesulfonate Induces Hepatomegaly and Lipoatrophy in Mice through Phosphoenolpyruvate Carboxykinase-Mediated Glyceroneogenesis Inhibition. Environ. Sci. Technol. Lett. 2020, 7, 185–190. [Google Scholar] [CrossRef]
  39. Wan, H.T.; Zhao, Y.G.; Wei, X.; Hui, K.Y.; Giesy, J.P.; Wong, C.K.C. PFOS-induced hepatic steatosis, the mechanistic actions on β-oxidation and lipid transport. Biochim. Biophys. Acta BBA-Gen. Subj. 2012, 1820, 1092–1101. [Google Scholar] [CrossRef] [PubMed]
  40. Curran, I.; Hierlihy, S.L.; Liston, V.; Pantazopoulos, P.; Nunnikhoven, A.; Tittlemier, S.; Barker, M.; Trick, K.; Bondy, G. Altered Fatty Acid Homeostasis and Related Toxicologic Sequelae in Rats Exposed to Dietary Potassium Perfluorooctanesulfonate (PFOS). J. Toxicol. Environ. Health Part A 2008, 71, 1526–1541. [Google Scholar] [CrossRef] [PubMed]
  41. Reno, C.M.; Litvin, M.; Clark, A.L.; Fisher, S.J. Defective Counterregulation and Hypoglycemia Unawareness in Diabetes. Endocrinol. Metab. Clin. N. Am. 2013, 42, 15–38. [Google Scholar] [CrossRef]
  42. Lee, Y.M.; Kim, K.S.; Jacobs, D.R.; Lee, D.H. Persistent organic pollutants in adipose tissue should be considered in obesity research. Obes. Rev. 2017, 18, 129–139. [Google Scholar] [CrossRef]
  43. Butruille, L.; Jubin, P.; Martin, E.; Aigrot, M.S.; Lhomme, M.; Fini, J.B.; Demeneix, B.; Stankoff, B.; Lubetzki, C.; Zalc, B.; et al. Deleterious functional consequences of perfluoroalkyl substances accumulation into the myelin sheath. Environ. Int. 2023, 180, 108211. [Google Scholar] [CrossRef]
  44. Coperchini, F.; Croce, L.; Ricci, G.; Magri, F.; Rotondi, M.; Imbriani, M.; Chiovato, L. Thyroid Disrupting Effects of Old and New Generation PFAS. Front. Endocrinol. 2021, 11, 612320. [Google Scholar] [CrossRef]
  45. Pryweller, J.R.; Schauder, K.B.; Anderson, A.W.; Heacock, J.L.; Foss-Feig, J.H.; Newsom, C.R.; Loring, W.A.; Cascio, C.J. White matter correlates of sensory processing in autism spectrum disorders. Neuroimage Clin. 2014, 6, 379–387. [Google Scholar] [CrossRef]
  46. Qazi, M.R.; Xia, Z.; Bogdanska, J.; Chang, S.-C.; Ehresman, D.J.; Butenhoff, J.L.; Nelson, B.D.; Depierre, J.W.; Abedi-Valugerdi, M. The atrophy and changes in the cellular compositions of the thymus and spleen observed in mice subjected to short-term exposure to perfluorooctanesulfonate are high-dose phenomena mediated in part by peroxisome proliferator-activated receptor-alpha (PPARα). Toxicology 2009, 260, 68–76. [Google Scholar] [CrossRef]
  47. Torres, L.; Redko, A.; Limper, C.; Imbiakha, B.; Chang, S.; August, A. Effect of Perfluorooctanesulfonic acid (PFOS) on immune cell development and function in mice. Immunol. Lett. 2021, 233, 31–41. [Google Scholar] [CrossRef]
  48. Malek, T.R. The main function of IL-2 is to promote the development of T regulatory cells. J. Leukoc. Biol. 2003, 74, 961–965. [Google Scholar] [CrossRef] [PubMed]
  49. Kooten, C.V.; Banchereau, J. Functions of CD40 on B cells, dendritic cells and other cells. Curr. Opin. Immunol. 1997, 9, 330–337. [Google Scholar] [CrossRef] [PubMed]
  50. Audzevich, T.; Bashford-Rogers, R.; Mabbott, N.A.; Frampton, D.; Freeman, T.C.; Potocnik, A.; Kellam, P.; Gilroy, D.W. Pre/pro-B cells generate macrophage populations during homeostasis and inflammation. Proc. Natl. Acad. Sci. USA 2017, 114, E3954–E3963. [Google Scholar] [CrossRef]
  51. Liebig, T.M.; Fiedler, A.; Klein-Gonzalez, N.; Shimabukuro-Vornhagen, A.; Von Bergwelt-Baildon, M. Murine Model of CD40-activation of B cells. J. Vis. Exp. 2010, 37, 1734. [Google Scholar] [CrossRef]
  52. Huang, J.; Wang, Q.; Liu, S.; Lai, H.; Tu, W. Comparative chronic toxicities of PFOS and its novel alternatives on the immune system associated with intestinal microbiota dysbiosis in adult zebrafish. J. Hazard. Mater. 2022, 425, 127950. [Google Scholar] [CrossRef]
  53. Clark, K.L.; Shukla, M.; George, J.W.; Gustin, S.; Rowley, M.J.; Davis, J.S. An environmentally relevant mixture of per- and polyfluoroalkyl substances (PFAS) impacts proliferation, steroid hormone synthesis, and gene transcription in primary human granulosa cells. Toxicol. Sci. 2024, 200, 57–69. [Google Scholar] [CrossRef]
  54. Bitran, D.; Shiekh, M.; McLeod, M. Anxiolytic Effect of Progesterone is Mediated by the Neurosteroid Allopregnanolone at Brain GABAA Receptors. J. Neuroendocrinol. 1995, 7, 171–177. [Google Scholar] [CrossRef]
  55. Xu, C.; Jiang, Z.-Y.; Liu, Q.; Liu, H.; Gu, A. Estrogen receptor beta mediates hepatotoxicity induced by perfluorooctane sulfonate in mouse. Environ. Sci. Pollut. Res. 2017, 24, 13414–13423. [Google Scholar] [CrossRef]
  56. Zuloaga, D.G.; Zuloaga, K.L.; Hinds, L.R.; Carbone, D.L.; Handa, R.J. Estrogen receptor β expression in the mouse forebrain: Age and sex differences. J. Comp. Neurol. 2014, 522, 358–371. [Google Scholar] [CrossRef]
  57. Sharma, P.K.; Thakur, M.K. Expression of estrogen receptor (ER) α and β in mouse cerebral cortex: Effect of age, sex and gonadal steroids. Neurobiol. Aging 2006, 27, 880–887. [Google Scholar] [CrossRef]
  58. Li, Z.; Lin, Z.; Ji, S.; Lai, K.-P.; Wan, H.-T.; Wong, C.K.C.; Li, L. Perfluorooctanesulfonic acid exposure altered hypothalamic metabolism and disturbed male fecundity. Sci. Total Environ. 2022, 844, 156881. [Google Scholar] [CrossRef] [PubMed]
  59. Makris, G.; Agorastos, A.; Chrousos, G.P.; Pervanidou, P. Stress System Activation in Children and Adolescents With Autism Spectrum Disorder. Front. Neurosci. 2022, 15, 756628. [Google Scholar] [CrossRef] [PubMed]
  60. Nikolaus, S.; Antke, C.; Beu, M.; Müller, H.-W. Cortical GABA, Striatal Dopamine and Midbrain Serotonin as the Key Players in Compulsive and Anxiety Disorders-Results from In Vivo Imaging Studies. Rev. Neurosci. 2010, 21, 119–140. [Google Scholar] [CrossRef]
  61. Yue, X.; Wen, S.; Long-Kun, D.; Man, Y.; Chang, S.; Min, Z.; Shuang-Yu, L.; Xin, Q.; Jie, M.; Liang, W. Three important short-chain fatty acids (SCFAs) attenuate the inflammatory response induced by 5-FU and maintain the integrity of intestinal mucosal tight junction. BMC Immunol. 2022, 23, 19. [Google Scholar] [CrossRef]
  62. Lee, J.G.; Lee, J.; Lee, A.R.; Jo, S.V.; Park, C.H.; Han, D.S.; Eun, C.S. Impact of short-chain fatty acid supplementation on gut inflammation and microbiota composition in a murine colitis model. J. Nutr. Biochem. 2022, 101, 108926. [Google Scholar] [CrossRef] [PubMed]
  63. Yao, Y.; O’Sullivan, B.; Mondal, T.K.; Uddin, M.N.; Manley, K.; Graf, J.; Lawrence, D.A. Mitochondrion-Mediated Metabolism and Microbiome Biodiversity Influence Autism-alike Behaviors. J. Neurol. Transl. Neurosci. 2025, 10, 1100. [Google Scholar]
Figure 1. Experimental design. Male and female mice were assigned to PFOS and VH (vehicle control) groups for daily treatment (n = 6/group). Body weight and blood glucose levels were measured weekly. Metabolic measurements such as glucose and insulin tolerance tests were conducted monthly. Behavioral tests such as social behavior, grooming and sniffing tests were conducted after two and three months of treatment. After three months of treatment, body compositions of free fluid, fat and lean tissues were measured before euthanasia. Organ weights were collected during necropsy, and splenic leukocytes were prepared for flow cytometry. Created in Biorender. Danielle Jiang. (2025). https://app.biorender.com/illustrations/67e6290b587d0131dc816b3f (accessed on 24 August 2025).
Sci 07 00118 g001
Figure 2. (A) Mean body weights measured over a three-month period. No significant differences between the VH and PFOS groups. (B) Body compositions of fat tissue, free fluid, and lean tissue in absolute weight. No significant differences were found in the absolute weight of lean tissue, fat tissue and free fluid across treatment groups in either sex. (C) Body composition analysis in percentage over body (relative) weight. No significant differences were found in the % body weight of fat tissue and free fluid; however, there was a significant decrease in lean tissue in the female groups. ** indicates p < 0.01.
Sci 07 00118 g002
Figure 3. Non-fasting blood glucose levels over the course of three months. (A) In males, significant differences observed in weeks 7 and 8. (B) In females, significant differences observed in weeks 4, 5, 7 and 8. * indicates p < 0.05; ** indicates p < 0.01.
Sci 07 00118 g003
Figure 4. Glucose tolerance test (GTT) and associated area under the curve (AUC) after one, two, and three months of PFOS treatment. (A,B) GTT curves and GTT AUC in males, respectively. Significant increases in glucose levels were noted at the 120 min time point after two and three months of treatment. No significant differences in AUC were observed in all months. (C,D) GTT curves and GTT AUC in females, respectively. No significant differences were observed in all months. * indicates p < 0.05.
Sci 07 00118 g004
Figure 5. Insulin tolerance test (ITT) and associated area under the curve (AUC) after one, two, and three months of PFOS treatment. (A,B) ITT curves and ITT AUC in males, respectively. Significant differences in glucose levels were noted at the 0 and 60 min time points after one month of treatment, and at the 120 min time point after two months. No significant differences in AUC were observed at any time point. (C,D) ITT curves and ITT AUC in females, respectively. Significant differences in glucose levels were noted at the 0 min time point after one month of treatment, and 60 min time point after two months. Significant difference in AUC was observed after two months.* indicates p < 0.05; ** indicates p < 0.01; *** indicates p < 0.001.
Sci 07 00118 g005
Figure 6. (A) Grooming behavior after two months of treatment. PFOS-treated females showed a significant decrease in grooming time compared to VH females, while no significant differences were observed in males. (B) Grooming behavior after three months of treatment. PFOS-treated males showed a significant increase in grooming time, whereas PFOS females continued to show a significant decrease compared to their respective VH controls. (C,D) Novel mouse sniffing tests after two and three months of treatment. No significant differences were observed in either male or female groups. (E,F) Three-chamber social interaction test after two and three months of treatment. No significant differences were observed across the three chambers (social, center, object) in either sex. ** indicates p < 0.01.
Sci 07 00118 g006
Figure 7. Expression of different surface markers by splenic leukocytes in male mice. Mean fluorescence intensity (MFI) was examined via flow cytometric analysis. PFOS treatment induced increased surface expressions of B220 and its associated ligand CD40L by B220+CD40L+ cells (A) and B220CD40L+ cells (B). Furthermore, PFOS increased surface expressions of CD45R and CD3 by the CD45RCD3+ cells (C). * indicates p < 0.05; ** indicates p < 0.01; *** indicates p < 0.001.
Sci 07 00118 g007
Figure 8. Expression of different surface markers by splenic leukocytes in female mice. Mean fluorescence intensity (MFI) was examined via flow cytometric analysis. PFOS treatment increased surface expressions of B220 and its associated ligand CD40L by B220+CD40L+ cells (A) and B220CD40L+ cells (B). PFOS treatment decreased Mac-3 MFI on Mac-3+ macrophages (C). For CD45R+CD8+ cells (D), surface expression of CD45R decreased while that of CD8 was increased. Similarly, for CD45R+CD8 cells (E), surface expression of CD45R was decreased while that of CD8 was increased. For CD45R+CD25 cells (F), surface expression of CD45R was increased while that of CD25 was decreased. * indicates p < 0.05; ** indicates p < 0.01; *** indicates p < 0.001.
Sci 07 00118 g008
Table 1. Mean terminal body weight (g), organ weights (mg) and % body weights in male mice.
VH-MPFOS-MVH-M (%)PFOS-M (%)
Body Weight39.65 ± 1.0940.17 ± 1.62N.A.N.A.
Liver2089.50 ± 56.443042.83 ± 83.08 ***5.28 ± 0.147.60 ± 0.17 ***
Spleen95.83 ± 11.1588.17 ± 6.570.24 ± 0.020.22 ± 0.01
Brain419.50 ± 9.81423.33 ± 7.491.06 ± 0.031.06 ± 0.03
Gastrointestinal Tract4687.00 ± 118.904629.00 ± 170.5711.84 ± 0.2411.56 ± 0.37
Kidneys663.67 ± 17.02650.50 ± 32.601.68 ± 0.041.62 ± 0.02
Heart and Lungs567.83 ± 18.12643.67 ± 31.301.44 ± 0.061.61 ± 0.08
Thymus58.17 ± 4.7155.50 ± 7.610.15 ± 0.010.14 ± 0.02
Pancreas251.00 ± 15.02242.83 ± 21.440.63 ± 0.030.60 ± 0.04
Significant differences: *** indicates p < 0.001.
Table 2. Mean terminal body weight (g), organ weights (mg) and % body weights in female mice.
VH-FPFOS-FVH-F (%)PFOS-F (%)
Body Weight35.38 ± 1.3535.18 ± 0.86N.A.N.A.
Liver1806.50 ± 58.052492.80 ± 67.68 ***5.12 ± 0.127.09 ± 0.09 ***
Spleen113.17 ± 4.2797.00 ± 3.78 *0.32 ± 0.010.28 ± 0.01 **
Brain431.00 ± 6.74442.00 ± 3.001.22 ± 0.031.26 ± 0.03
Gastrointestinal Tract4465.83 ± 146.234379.20 ± 108.0712.66 ± 0.4212.47 ± 0.36
Kidneys498.00 ± 26.30511.40 ± 12.621.41 ± 0.041.45 ± 0.02
Heart and Lungs556.33 ± 27.00527.00 ± 21.001.57 ± 0.041.50 ± 0.04
Thymus59.00 ± 3.7153.00 ± 4.880.17 ± 0.010.15 ± 0.02
Pancreas253.30 ± 14.66232.20 ± 9.070.72 ± 0.030.66 ± 0.02
Significant differences: * indicates p < 0.05; ** indicates p < 0.01; *** indicates p < 0.001.
Table 3. Percentage (%) of various immune cell populations identified by flow cytometry in male mice.
AntibodiesGroup+/+ (%)+/− (%)−/+ (%)−/− (%)
B220/CD40LVH-M1.32 ± 0.2014.04 ± 2.021.14 ± 0.1183.48 ± 2.18
PFOS-M1.77 ± 0.1325.70 ± 0.721.70 ± 0.2970.85 ± 0.95 ***
CD24/CD5VH-M4.13 ± 0.1662.33 ± 1.9628.38 ± 1.795.20 ± 0.27
PFOS-M4.29 ± 0.2562.08 ± 1.3827.22 ± 1.416.40 ± 0.48 *
GR1/F480VH-M1.85 ± 0.094.28 ± 0.263.49 ± 0.2590.38 ± 0.15
PFOS-M1.99 ± 0.243.32 ± 0.32 *3.93 ± 0.2090.75 ± 0.57
CD8/CD25 (CD3+)VH-M4.55 ± 0.307.89 ± 0.3517.37 ± 1.1370.17 ± 1.10
PFOS-M6.65 ± 1.199.82 ± 1.2518.22 ± 0.6065.33 ± 1.86 *
Mac-3+/CD45RVH-M3.38 ± 0.190.19 ± 0.0237.42 ± 1.5859.03 ± 1.72
PFOS-M4.22 ± 0.23 *0.17 ± 0.0242.17 ± 2.2153.45 ± 2.39
Mac-3+VH-M3.27 ± 0.44
PFOS-M3.92 ± 0.23 **
Each population is defined by specific antibody markers, and values are reported as mean ± SEM. Significant differences: * indicates p < 0.05; ** indicates p < 0.01; *** indicates p < 0.001. Only significant results are presented. Full dataset is available in Table S1.
Table 4. Percentage (%) of various immune cell populations identified by flow cytometry in female mice.
AntibodiesGroup+/+ (%)+/– (%)–/+ (%)–/– (%)
B220/CD40LVH-F1.83 ± 0.3018.49 ± 2.641.34 ± 0.1778.35 ± 2.94
PFOS-F2.00 ± 0.3523.82 ± 0.33 *1.23 ± 0.1772.96 ± 0.75
CD8/CD4VH-F2.98 ± 0.3210.77 ± 0.6311.79 ± 0.7268.02 ± 1.43
PFOS-F3.33 ± 0.5212.92 ± 2.1614.04 ± 0.47 *62.74 ± 3.04
CD8/CD25 (CD3+)VH-F4.48 ± 0.197.39 ± 0.3615.00 ± 0.7573.10 ± 1.13
PFOS-F6.24 ± 1.14 *8.46 ± 1.0718.90 ± 0.56 **66.40 ± 1.69 **
CD4/CD25 (CD3+)VH-F17.53 ± 0.8914.23 ± 0.852.24 ± 0.0965.98 ± 1.51
PFOS-F22.48 ± 0.56 **13.42 ± 0.543.00 ± 0.19 **61.12 ± 1.07 *
CD4/CD45RVH-F6.18 ± 0.3710.61 ± 0.6231.43 ± 1.1251.78 ± 1.88
PFOS-F7.24 ± 0.6912.48 ± 0.40 *34.68 ± 1.3045.64 ± 2.05
Mac-3/CD45RVH-F4.58 ± 0.200.37 ± 0.0334.07 ± 1.4460.97 ± 1.47
PFOS-F4.74 ± 0.220.25 ± 0.02 **38.24 ± 1.7456.78 ± 1.85
CD45R/CD3VH-F8.68 ± 0.3932.92 ± 1.2315.62 ± 0.4942.80 ± 1.21
PFOS-F8.58 ± 0.3737.48 ± 1.60 *13.12 ± 0.32 **40.82 ± 1.70
CD45R/CD25VH-F24.63 ± 1.1010.65 ± 0.599.65 ± 0.5155.10 ± 1.77
PFOS-F29.72 ± 0.93 **9.80 ± 0.8112.38 ± 0.24 **48.06 ± 1.90 *
CD3/CD25VH-F4.55 ± 0.1919.93 ± 0.5237.75 ± 1.4437.80 ± 1.31
PFOS-F5.30 ± 0.15 *16.60 ± 0.16 **45.78 ± 1.03 **32.36 ± 1.08 *
Mac-3+VH-F3.96 ± 0.18
PFOS-F4.87 ± 0.34 *
Each population is defined by specific antibody markers, and values are reported as mean ± SEM. Significant differences: * indicates p < 0.05; ** indicates p < 0.01. Only significant results are presented. Full dataset is available in Table S2.
Disclaimer/Publisher’s Note: The statements, opinions and data contained in all publications are solely those of the individual author(s) and contributor(s) and not of MDPI and/or the editor(s). MDPI and/or the editor(s) disclaim responsibility for any injury to people or property resulting from any ideas, methods, instructions or products referred to in the content.