Article

Androgen receptors and Zinc finger (ZNF) Transcription Factors’ Interplay and Their miRNA Regulation in Prostate Cancer Prognosis

1
Department of Surgical, Medical, Molecular Pathology and Critical Area, University of Pisa, 56126 Pisa, Italy
2
Department of Psychology & Behavioral Neuroscience, Randolph-Macon College, Ashland, VA 23005, USA
*
Author to whom correspondence should be addressed.
Sci 2025, 7(3), 111; https://doi.org/10.3390/sci7030111
Submission received: 27 January 2025 / Revised: 28 May 2025 / Accepted: 17 June 2025 / Published: 5 August 2025

Abstract

Transcription factors play crucial roles in regulating gene expression, and any dysregulation in their levels could be involved in cancer progression. The role of androgen receptors (AR) and zinc finger (ZNF) proteins in tumors, like prostate cancer (PC), remains poorly understood. Moreover, due to the multifaceted transcriptional behavior of ARs and ZNFs, their biological role in cancer progression may also depend on the interplay with micro-RNAs (miRNAs). Based on The Cancer Genome Atlas (TCGA) database, we analyzed the expression levels of zinc finger transcripts and ARs in PC. Specifically, exploring their involvement in cancer progression and regulation by miRNAs. The analysis relied on several tools to create a multivariate combination of the original biomarkers to improve their diagnostic efficacy. Multidimensional Scaling (MDS) identified two new dimensions that were entered into a regression analysis to determine the best predictors of overall survival (OS) and disease-free interval (DFI). A combination of both dimensions predicted almost 50% (R2 = 0.46) of the original variance of OS. Kaplan–Meier survival analysis also confirmed the significance of these two dimensions regarding the clinical output. This study showed preliminary evidence that several transcription factor expression levels belonging to the zinc family and related miRNAs can effectively predict patients’ overall PC survivability.

1. Introduction

Prostate cancer (PC) is among the leading causes of worldwide cancer-related death among men and the second in terms of incidence, right after lung cancer, with almost 1.5 million cases [1]. Overall survival (OS) for patients with advanced PC remains poor due to several factors. Androgen deprivation therapy remains the reference treatment in metastatic PC. Recently, more options have become available, such as palliative radiotherapy, bisphosphonate treatment, and in some rare cases, chemotherapy [2]. Therefore, finding alternative methods to diagnose PC early is imperative. One promising diagnostic tool is micro-RNAs (miRNAs). These small, non-coding single-stranded RNA molecules regulate the expression of many genes, including oncogenes [3]. Recent evidence indicates a link between regulatory disorders in the expression of relevant miRNAs and the occurrence of various types of cancer [4]. Specifically, more studies have established the role of miRNA421, miRNA135, and miRNA145-5p in promoting the proliferation and migration of tumor cells via regulatory processes associated with the Zinc Family (ZNF) proteins. Moreover, miR-143-3p and miR-34a-5p can inhibit cell proliferation and promote apoptosis, improving immune response, metabolism, and cell signaling. A specific miRNA pattern may be characteristic of a given disease, which allows the use of selected miRNAs to monitor the physiological state of patients long before any clinical symptoms are manifested [5]. The main issue with this approach is identifying the right markers, due to the vast variety of potential miRNAs involved in cancer.
Transcription factors play a crucial role in regulating gene expression. Any dysregulation in their level or activity could be involved in cancer development and tumor progression [6]. ]. For example, PC progression heavily depends on the androgen receptor (AR), a lig-and-activated transcription factor critical in male sexual development [7]. This recep-tor is a member of the steroid hormone-activated nuclear receptor family of transcrip-tion factors [8]. ARs rely on interactions with other transcriptional regulators to initi-ate functional transcription of target genes [9]. Researchers have isolated more than 280 proteins as AR-interacting coregulators [10]. Transcription factors can be categorized, based on different DNA binding motifs, into classical zinc fingers [11], basic helix–loop–helix [12], and homeodomains [13]. ZNF proteins are the most represented sequence-specific DNA binding proteins, with a finger domain that exhibits many biological functions, including tumorigenesis and tumor progression [14]. However, the role of ZNFs in cancer remains controversial, as several ZNFs may pro-mote cancer, while others are tumor suppressors [15,16]. The versatile roles of ZNFs may be attributed to different gene and protein interactions, which depend on the in-dividual genetic profile and type of cancer. For example, overexpression of ZKSCAN3, a gene responsible for the overproduction of the proteins known as ZNF306 or ZNF309, has been associated with PC due to its role in promoting cell migration [17]. Additionally, Wang et al. [18] found evidence that high expression of Kaiso, a member of the BTB/POZ zinc finger protein family, can promote PC cell migration and invasion via suppression of miR-31 expression. For the above reasons, it seems appropriate to test if the interaction between ARs and ZNFs, and their relative miRNAs, can be used as a proper diagnostic tool.
The present study focused on the following protein-coding genes: AR, ZRANB2, ZNF700, and ZNF747, respectively, mapped onto 12q, 12q13.13, 16p11.2, and 1p31.1. These genes belong to the Cys2His2 (C2H2)-type family and are involved in transcriptional regulation. Differences in the number and structure of zinc finger domains, as well as the presence of other protein domains, such as Krüppel-associated box (KRAB), may contribute to their diverse ability to regulate the transcription of target genes and interact with various ligands across several pathways [19]. We specifically selected these targets because various aspects of the molecular mechanism and the biological pathway in which ZNFs are involved in cancer progression remain unclear.
Due to the complexity of the transcriptional behavior of ZNFs, their biological role in cancer progression may also depend on altered miRNA patterns. Therefore, identifying these alterations in miRNA patterns and their role in enhancing or inhibiting gene transcription could be used for the development of novel diagnostic and prognostic biomarkers of PC [20]. This line of research can be helpful considering that miRNAs are valuable diagnostic tools in early cancer detection, even decades prior to clinical manifestation [21]. We focused on a few identified miRNAs with documented interactions as either promoters or suppressors of cellular proliferation and migration associated with AR and ZNFs, with relevance in prostate cancer progression. For instance, miR-550a-5p and miR-421 can promote the proliferation and migration of HCC cells by targeting targeting Glucosamine UDP-N-acetyl-2-epimerase/N-acetylmannosamine kinase (GNE) via the Wnt/β-catenin signaling pathway. Decreased levels of miR-550a-5p inhibit these processes, suggesting its role in cancer progression and poor prognosis [22,23]. Additionally, miR-143-3p and its variants inhibit cell proliferation and promote apoptosis by targeting centrosomal protein 55 (CEP55). Thus, they may act as tumor suppressors by downregulating CEP55 [24]. Identified as a key tumor suppressor, miR-145-5p regulates important oncogenes such as MYC and RAS. In vitro studies demonstrated that miR-145-5p can significantly reduce the expression of these oncogenes, leading to decreased tumor growth in metastatic prostate cancer models [25]. Individual pathways associated with miR-34a-5p and miR-185 and cancer proliferation include dysregulation of immune response, metabolism, and cell signaling [26]. Finally, miR-135b has been identified as a direct regulator of AR protein levels and reduces proliferation in AR-positive prostate cancer cells. It can also influence the hypoxia-inducible factor 1α (HIF1α) pathway [27]. These findings emphasized the impact of miRNAs on cancer progression and highlighted their potential as novel therapeutic targets and diagnostic tools.
Using The Cancer Genome Atlas (TCGA), we analyzed 496 PC cases, including clinical, survival, and biological data. The main goal of the present study was to assess the interplay between AR and ZNF transcription factors, along with some of their miRNAs regulatory processes, in PC prognosis. Specifically, we hypothesized that higher expression levels of ARs, ZNFs, and related miRNAs would correlate with a better clinical outcome of PC patients in terms of overall survival (OS) and disease-free intervals (DFI). It was hypothesized that there would be significant interactions between ZNF proteins and miRNAs, which could potentially offer new insights into the molecular mechanisms of therapeutic targets. As a secondary aim, we explored whether AR expression alone was sufficient to predict OS. Considering that AR expression is a well-established driver of PC progression, we expected a high strength of the association between AR expression and survival.

2. Materials and Methods

2.1. Study Design

We reviewed the TCGA database to assess the gene expression of patients diagnosed with PC. All available cases for which we could collect a complete database, with no missing values, were selected (n = 496). Specifically, the following were the inclusion/exclusion criteria: (a) Inclusion: patients diagnosed with prostate adenocarcinoma (PRAD), availability of IlluminaHiSeq gene expression profiles, presence of clinical parameters, including age, Gleason score, disease-free interval (DFI), and overall survival (OS); (b) exclusion criteria: cases with missing survival data (DFI or OS) or incomplete gene expression profiles. Moreover, because TCGA datasets may contain batch effects due to differences in sequencing platforms or sample processing, the Harmony package [28] was employed to mitigate batch effects between samples, with parameters set to max.iter.harmony = 20 and lambda = 0.5. This method is designed to correct batch effects in high-throughput genomic data. Quality control procedures included normalization, with gene expression data log-transformed and quantile-normalized to ensure comparability across samples. Samples with extreme gene expression values (>3 standard deviations from the mean) were flagged and reviewed. The gene expression was combined with clinical data, survival time and time without the disease, to conduct a survival analysis of the differential genes and identify potential target genes that may affect prognosis. Considering that our study was a retrospective analysis of public data, the Ethical Appraisal was unnecessary.
We are using publicly available data, for which the ethical approval was obtained when the original study was approved.

2.2. TCGA Database

We downloaded clinical data from the TCGA website (https://tcga-data.nci.nih.gov/tcga/, accessed on 14 January 2021), including the age of patients, radical prostatectomy grading, survival parameters, and gene expression levels obtained by IlluminaHiSeq of 496 PC patients. The International Society of Urological Pathology (ISUP) consensus recommendations adopted by the WHO classification of prostate uploaded the Gleason scores (GS) of the original TCGA data [29,30,31]: Group 1 for GS ≤ 6; 2 for GS 7, 3 + 4; 3 for GS 7, 4 + 3; 4 for GS 8, and 5 for GS 9, 10. The age at diagnosis was given in years, whereas disease-free interval (DFI) and overall survival (OS) were in months.

2.3. Statistical Analysis

Univariate statistics (Pearson’s correlation, Student’s t-test, and linear regression) tested the significance of the association among the four target genes and the miRNAs. Student’s t-test quantified the differences in the average gene expression by the ISUP score. A stepwise regression analysis identified the best predictors of OS/DFI based on gene/miRNA expression.
The statistical significance of the Kaplan–Meier curves was derived using the Wilcoxon log-rank test [32]. This statistic measures the proportion of patients living for a specific timeframe after a certain condition. The Kaplan–Meier plot is constituted by a series of decreasing horizontal steps, approaching the estimated true survival curve for the population. Among the typical applications for Kaplan–Meier, we can find a classification function able to group patients into two distinct categories. In our study, we used low and high activation of a target gene, taking the median of the expression level as the grouping point. The graph can estimate the difference in DFI / OS on low and high activation. To generate a Kaplan–Meier estimator, we used the status at the last observation and the time to event. Finally, the last piece of data used was the group assignment of each patient. The dependence on a single variable is the main limitation of this technique. This dependence can often lead to overestimating the importance of that single variable. For that reason, it is helpful to pair estimation curves and multivariate methods that can offer an index of gene activation built on several genes at once.
To this end, we ran a multitude of Multidimensional Scaling (MDS) analysis. This technique was preferred over similar ones due to robustness and perceptual mapping of the results. In MDS, each variable’s contribution is independent of the other ones. Therefore, the shared variance among variables can show unique contributions of individual measures that can differ from what is suggested by the initial mean values of a particular dependent variable. The importance of multivariate models is connected to their ability to find independent associations among factors when assessing complex phenomena such as genetic analysis. MDS reveals the “hidden structure” of complex data [33]. To achieve this goal, this analysis creates a spatial representation of the associations among variables by using the covariation matrix among all the measures. In this map, the distance between two variables shows the independent correlations between them. A lack of fit is inevitable in this process, which is known as S-stress. S-stress values range from 0 (perfect fit) to 1 (worst possible fit). S-stress values < 0.15 are usually acceptable. The amount of variance explained by the model (R2) is usually higher than 0.8. The number of dimensions linked to the number of variables entered in the model is one of the most significant limitations of MDS analysis. For this reason, to test many variables, it is necessary to provide several alternative models and select the best output. These new dimensions of the best model were named based on the association with the original variables and used in the following analyses, such as stepwise regression and Kaplan–Meier analysis.
For all analyses, the alpha level = 0.05 was considered significant. All analyses were performed using SPSS 28.1 (IBM, Armonk, NY, USA).

3. Results

3.1. ISUP Grading Groups and Gene Expression

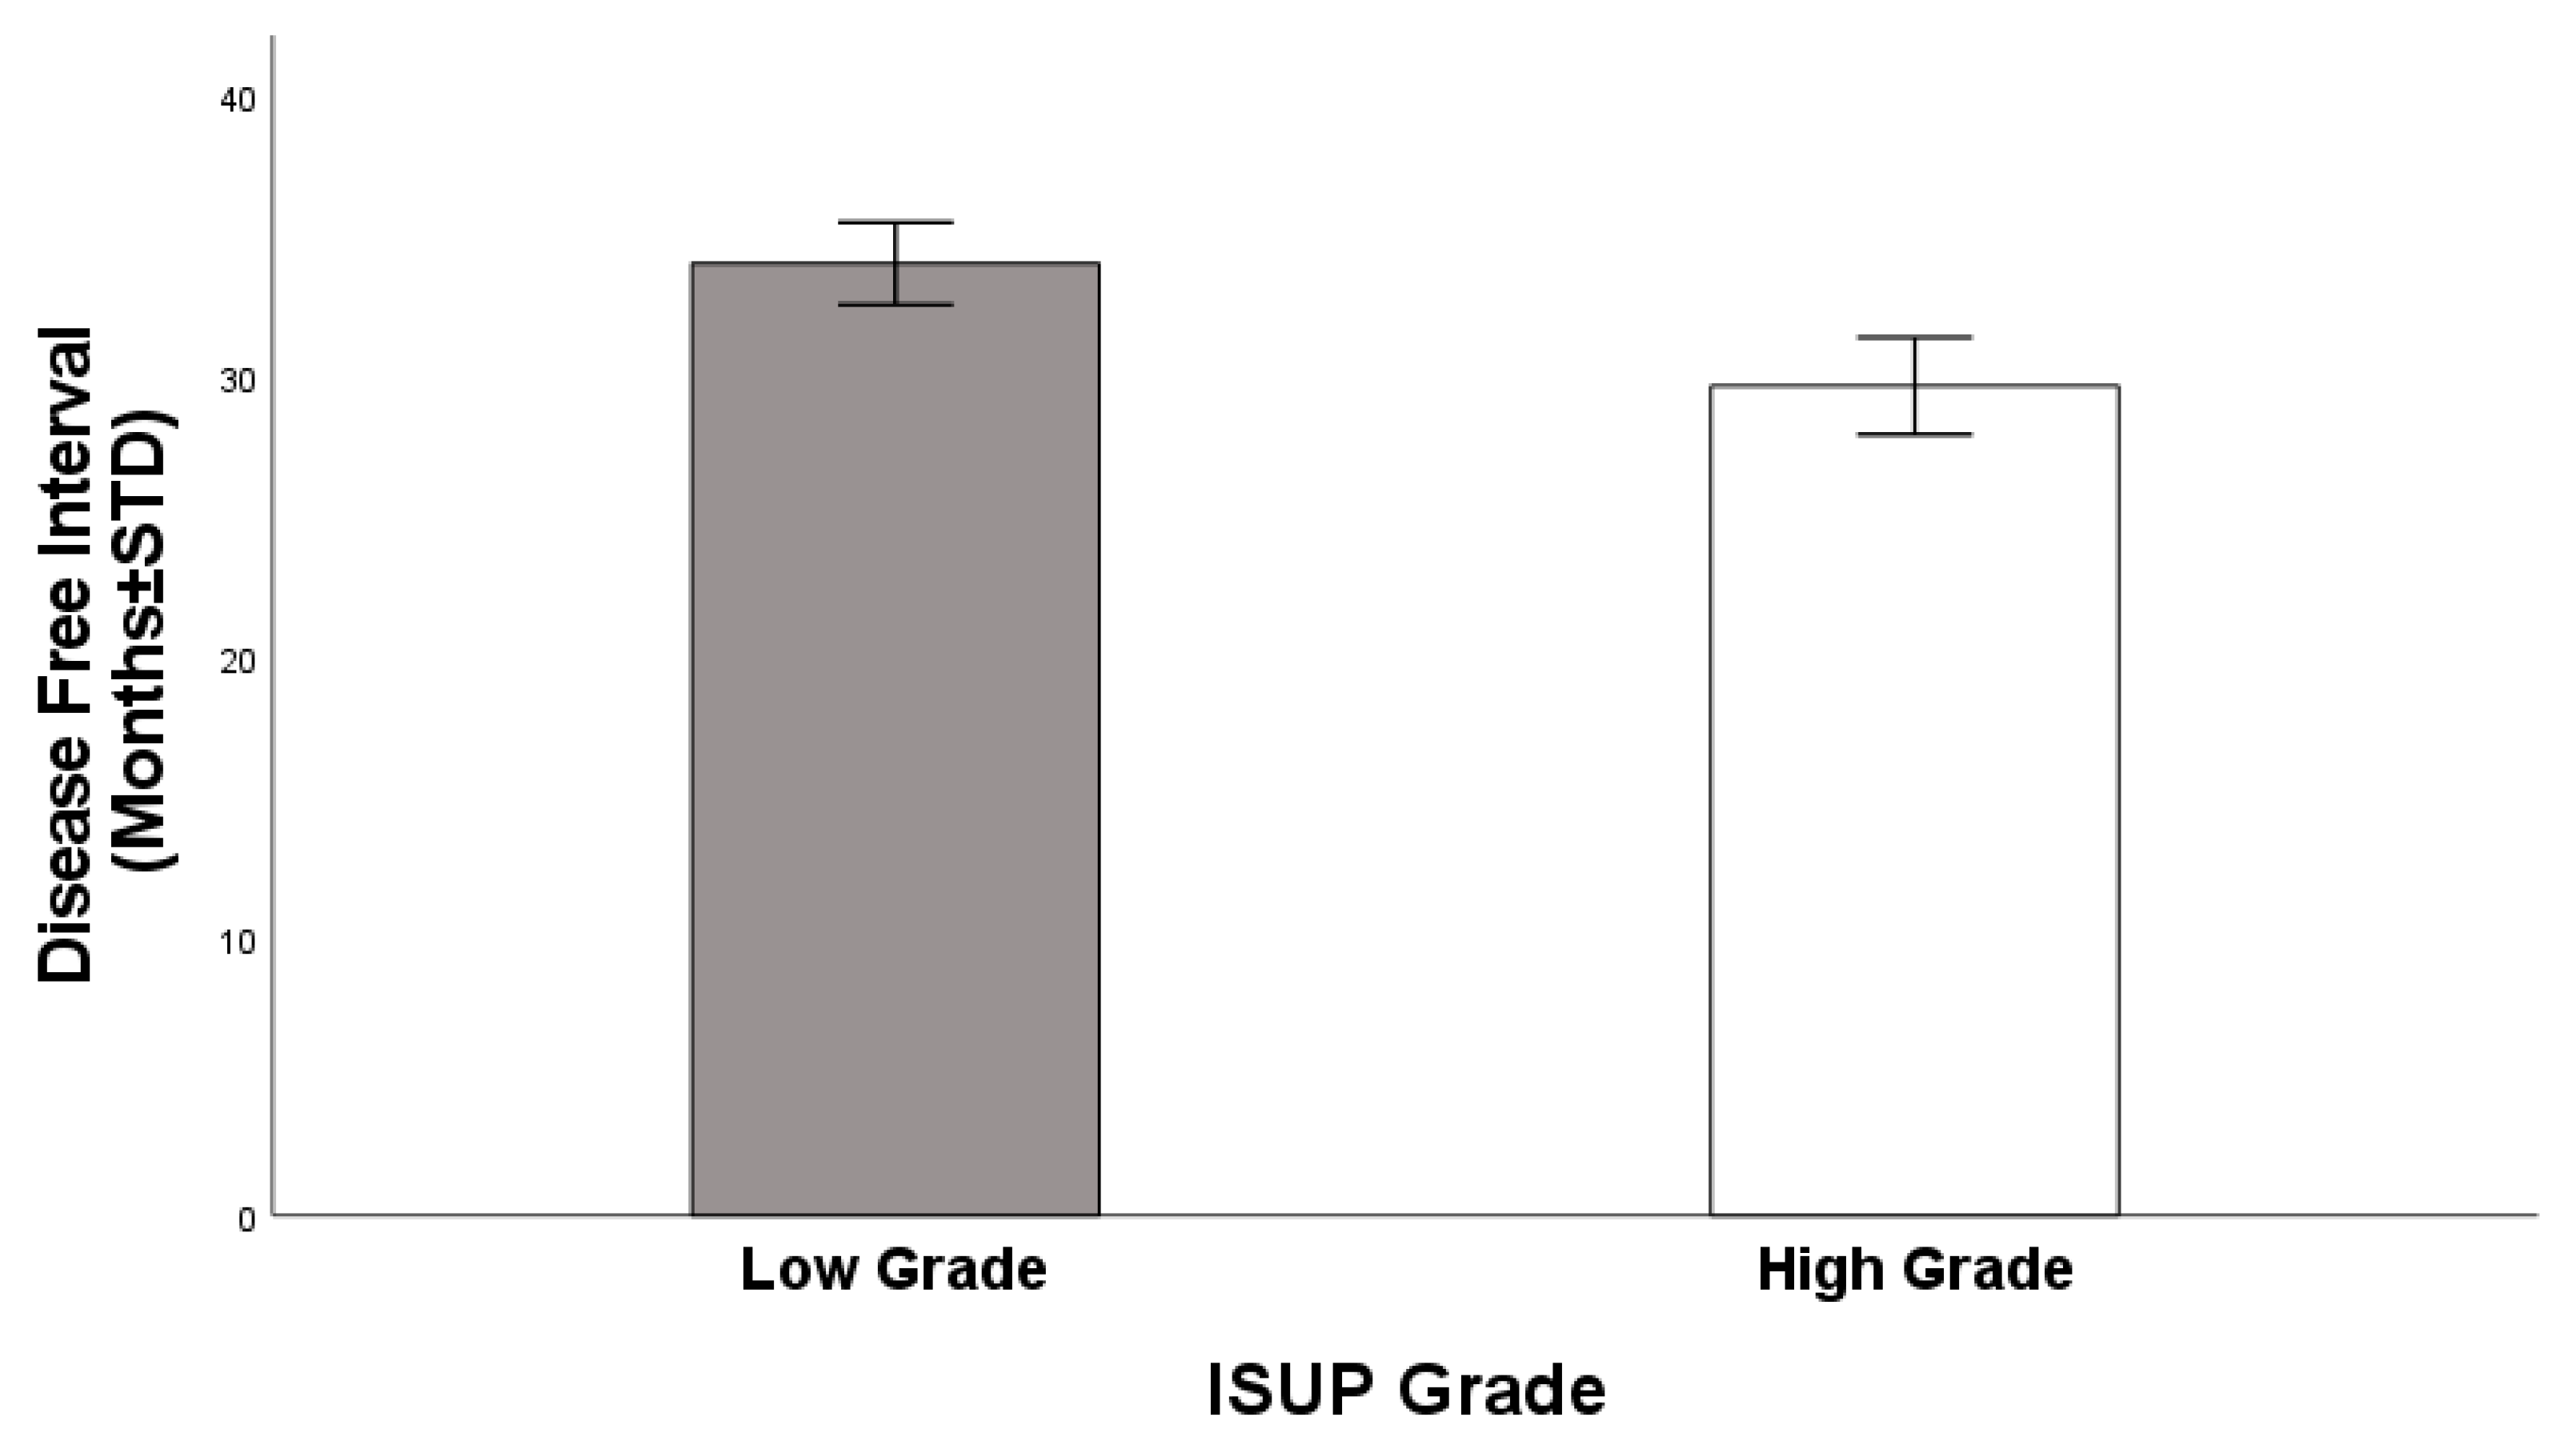
Table 1 demonstrates the number of PC patients grouped by ISUP consensus grading. Of the four target genes, ZNF700 and ZRANB2 showed a significant effect of grading on gene expression (ZNF700: t494 = 21.869, p < 0.001; ZRANB2: t494 = 47.363, p < 0.001—Figure 1 (upper and lower panel). For both ZRANB2 and ZNF700, the expression was higher in patients with higher-grade PC. Tumors with a high grade also showed a higher probability of a shorter time without the disease (t488 = 3.69, p = 0.05—Figure 2), but the overall survival probability did not change significantly (p = 0.868).

3.2. Association Among ZNFs/AR Gene Expressions and Associated miRNAs

As hypothesized, we found many interesting bivariate correlations among the target genes investigated and some key miRNAs associated with their activity (Table 2). Specifically, AR expression positively correlated with ZNF700 expression and the following miRNAs: 145-5p, 185—whereas ARs negatively correlated with miRNA-135.
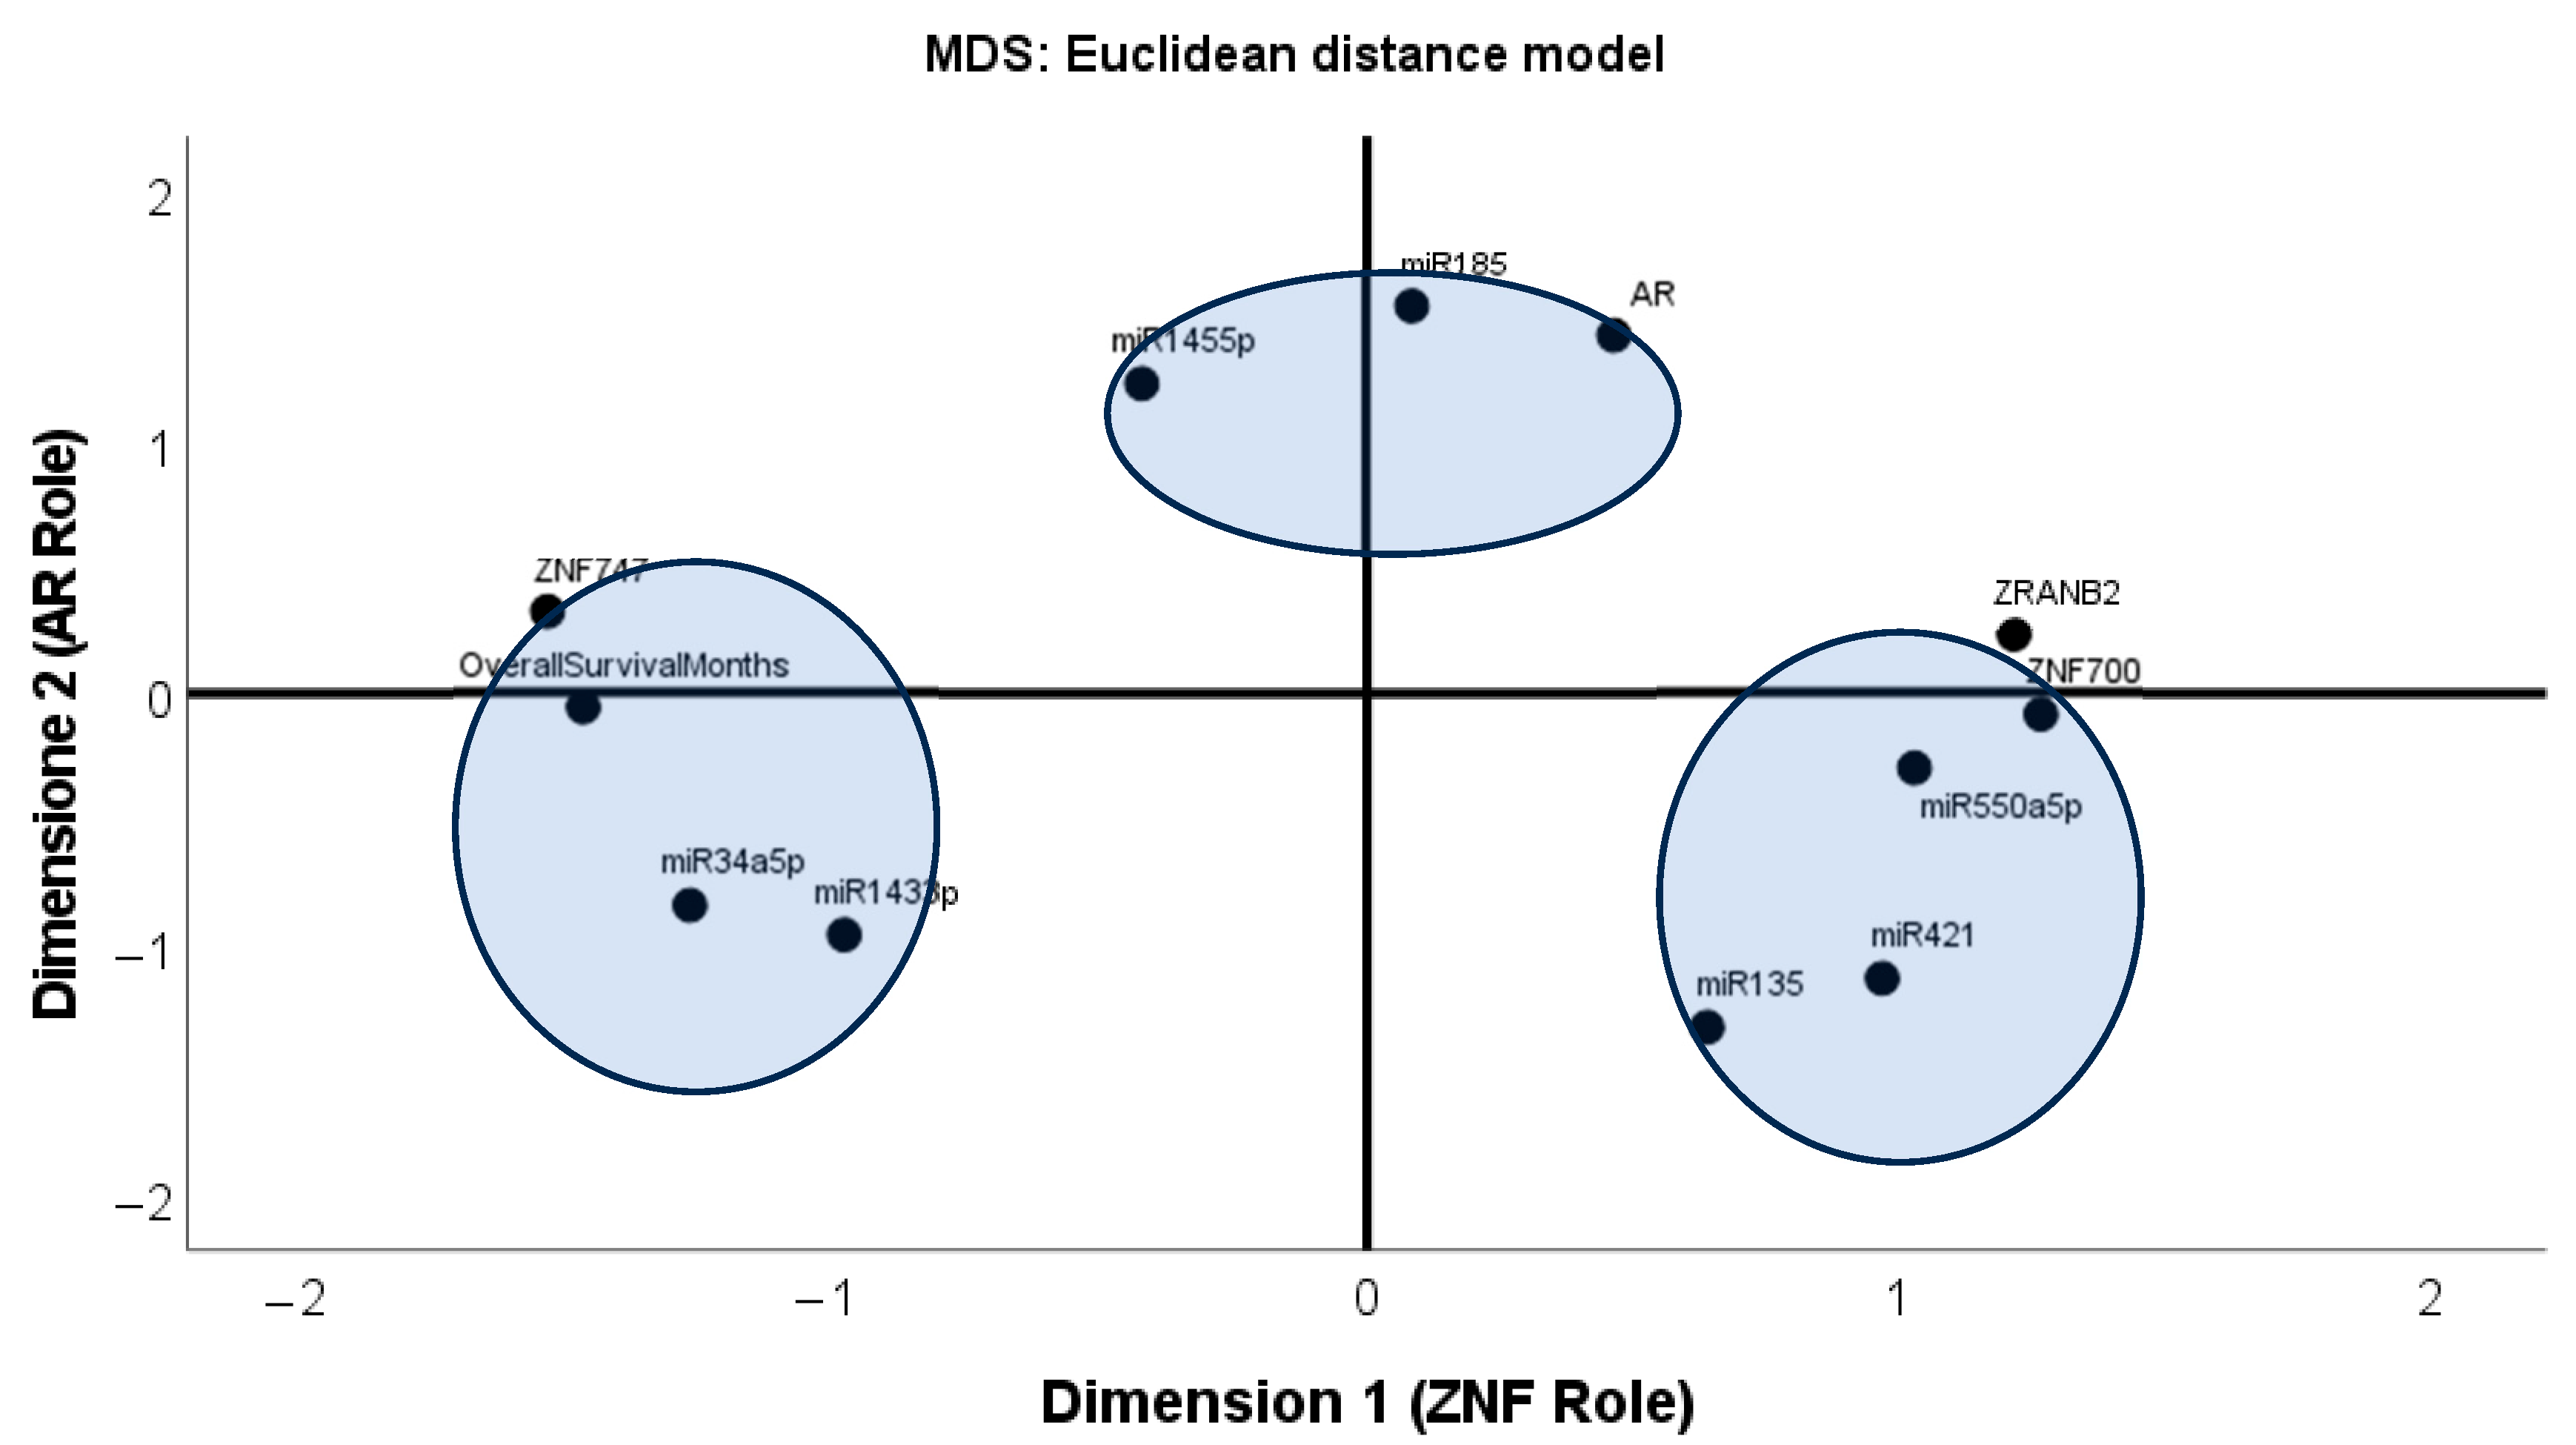
We ran a series of MDS analyses to identify the independent contributions of these multiple associations. The MDS analyses entered two clinical outputs (DFI and OS), four target genes (AR, ZRANB2, ZNF700, and ZNF747), and seven miRNAs. The best output was selected based on S-stress/R2 values and the interpretability of the output. Overall, most configurations returned high values of S-stress and low strength (R2), and thus were considered unreliable. The map shown in Figure 3 was selected, which returned acceptable values (S-stress = 0.16; R2 = 0.81). The map discovered three clusters: AR paired with miRNA-185 and 145-5p; ZNF747 paired with miRNA143-3p, miRNA34a-5p, and with OS; ZNF700 and ZRANB2 paired together with miRNA421, miRNA135, and miRNA145-5p. Regarding gene activation, Dimension 1 was characterized by the opposite role of OS/ZNF747 associated on one side, and ZNF700/ZRANB2 on the other. For this reason, it was named the ZNF role. AR was characterized by dimension 2, and therefore, it was named the AR role. Several miRNAs were associated with OS and then marked for further analyses.
The scores from the MDS were calculated and assigned to each subject, then entered in a series of stepwise analyses to determine the best predictors of OS and DFI (Table 3). The predictors for both OS and DFI were a combination of the ZNF and AR roles (OS: adjusted R2 = 0.46; DFI: adjusted R2 = 0.34), with predictive values surprisingly high for both clinical outputs. It is important to note that the predictive values of the ZNF role and AR role were quite different, as shown by the standardized beta scores (Table 3), with a clear preference for the ZNF role.

3.3. Survival Curves

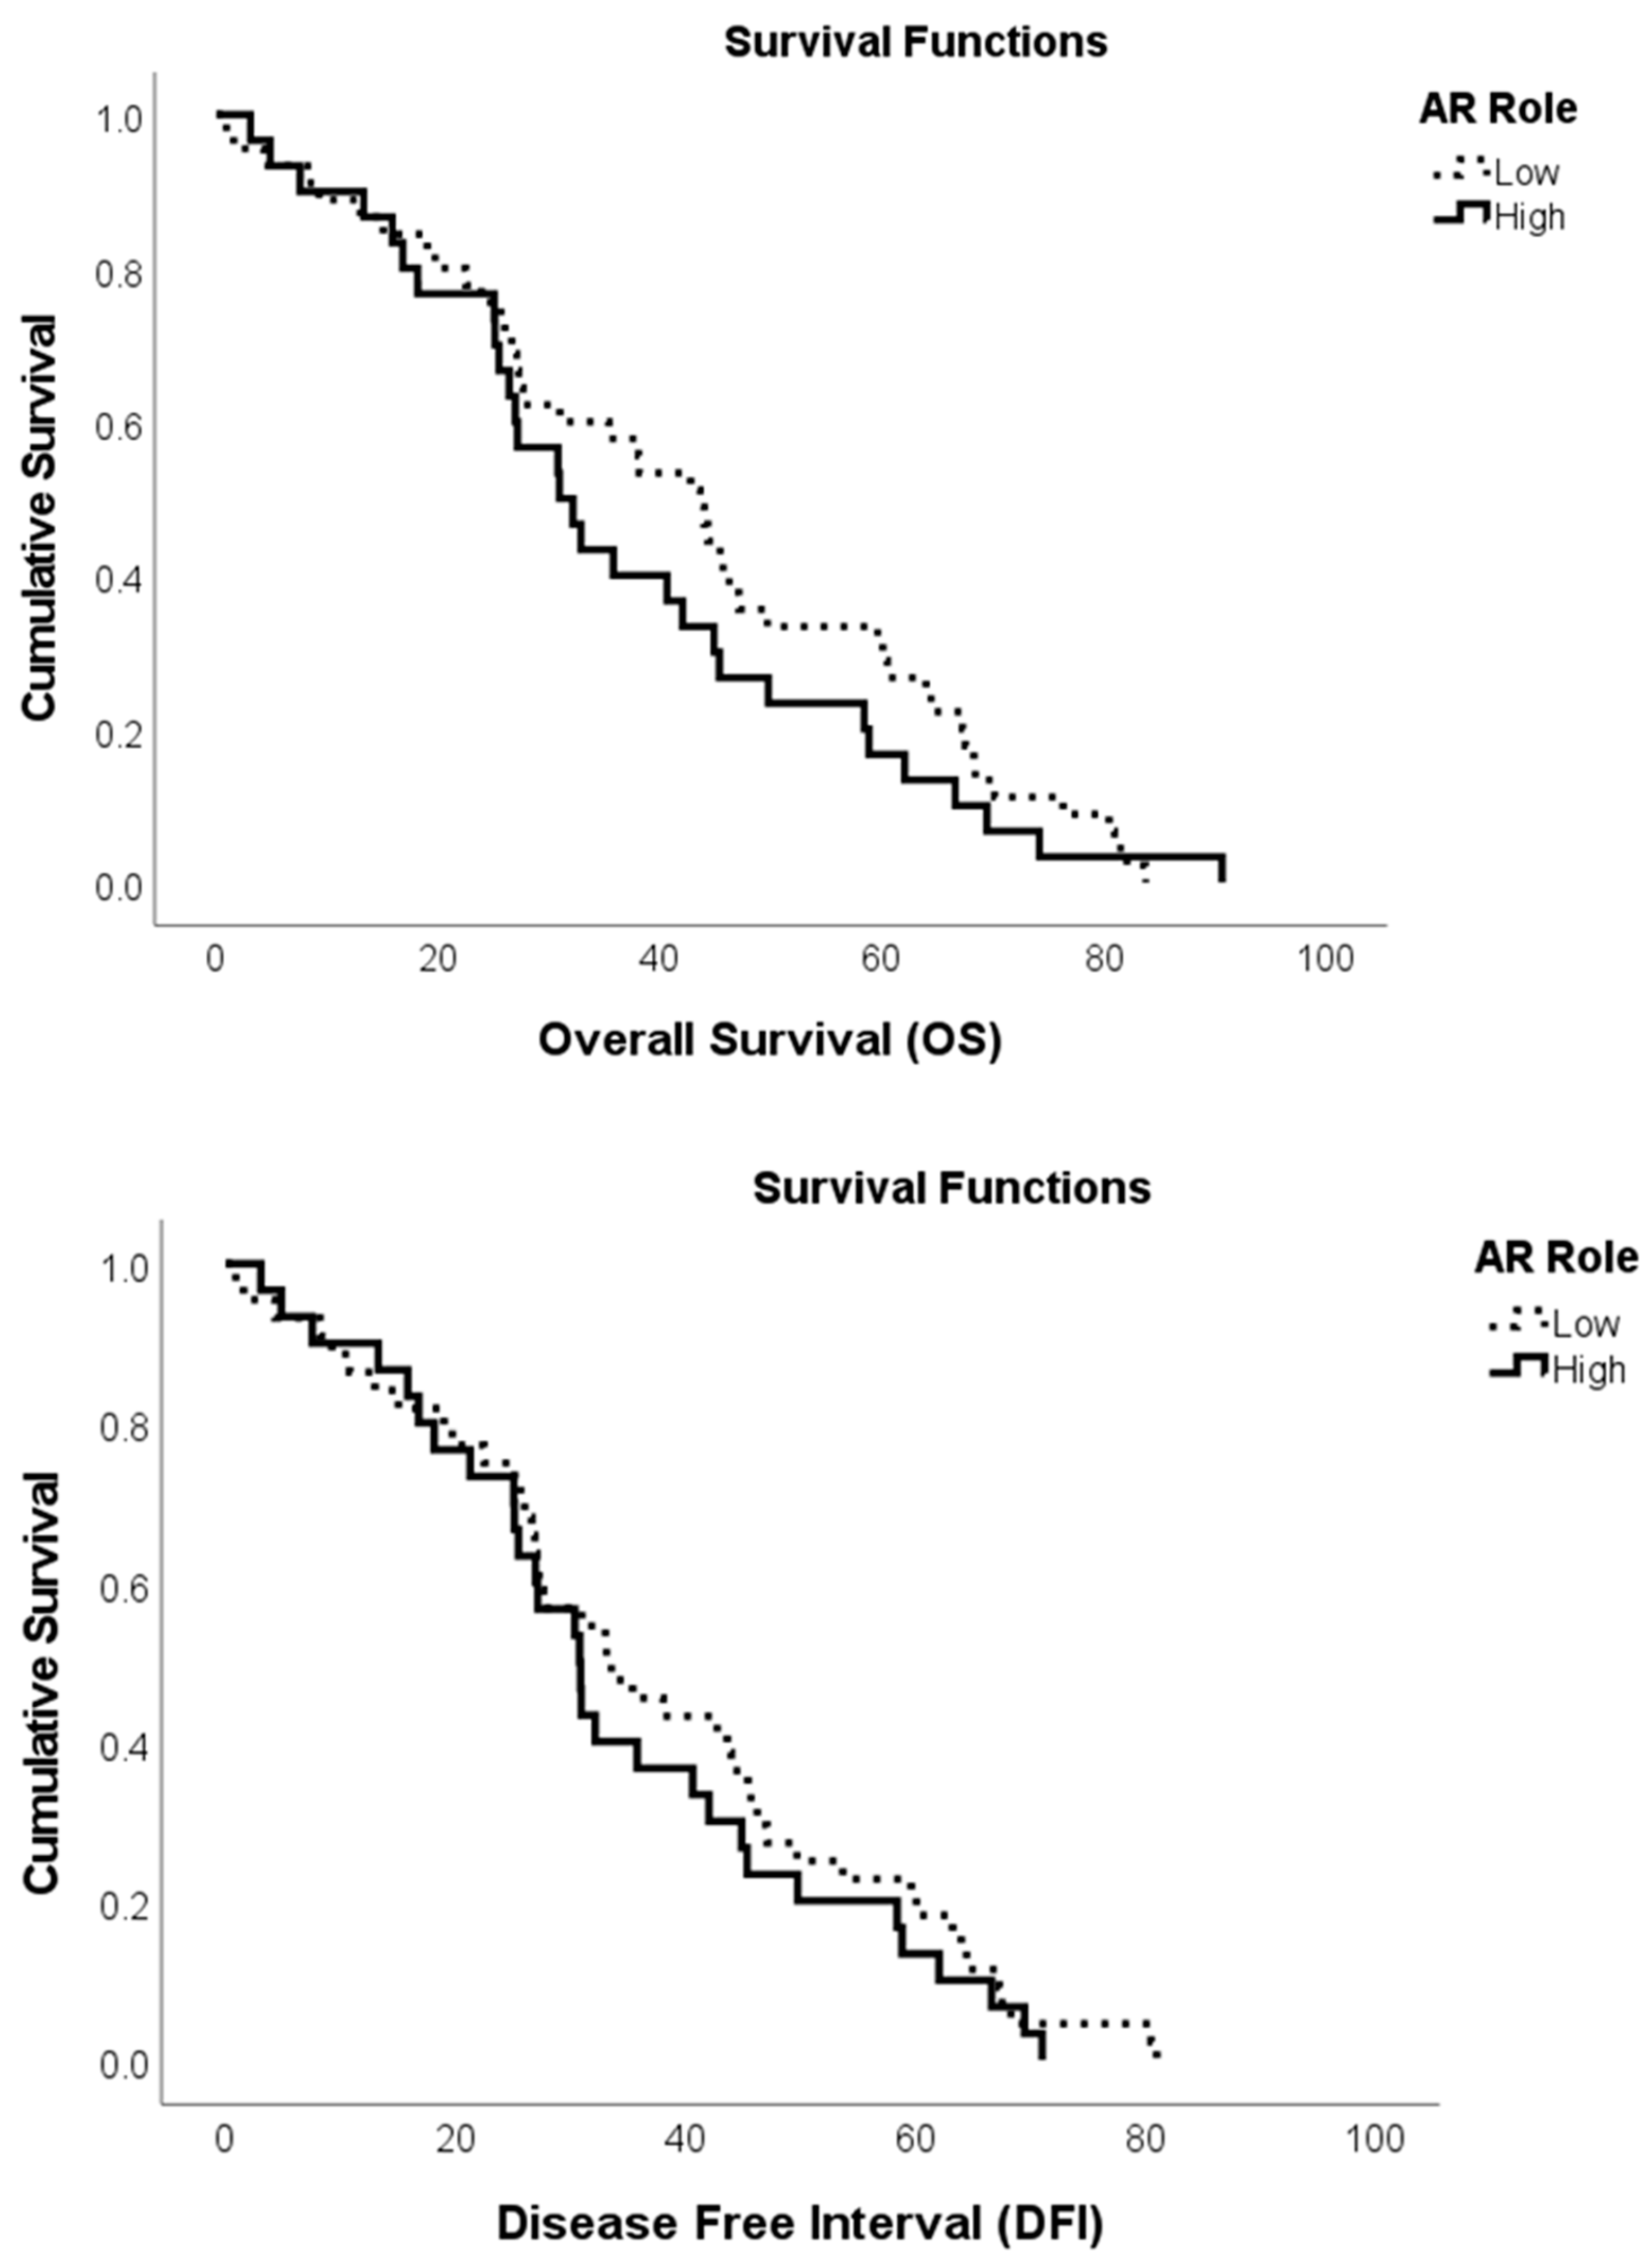
The new dimensions were entered into a Kaplan–Meier estimator to test whether patients with high/low levels of ZNF role and AR role significantly differed in OS and DFI. The OS was significantly higher in patients with low ZNF role (Log Rank = 5.862, p = 0.015—Figure 4 upper panel). The finding was that DFI was significantly higher in patients with low ZNF role (Log Rank = 3.846, p = 0.049—Figure 4 lower panel). The second dimension (AR role) was not significantly related to clinical output (OS: Log Rank = 0.948, p = 0.330—Figure 5 upper panel; DFI: Log Rank = 0.640, p = 0.424—Figure 5 lower panel).

4. Discussion

This study showed preliminary evidence that combining the expression levels of transcription factors belonging to the ZNF and related miRNAs can effectively predict the overall survivability of patients with PC. Specifically, high levels of protein ZNF747 and microRNAs miRNA143-4p and miRNA34a-5p were associated with higher OS. At the same time, higher OS was linked with low levels of proteins ZNF700 and ZRANB2, and microRNAs miRNA421, miRNA135, and miRNA145-5p. Contrary to our hypothesis, we did not find a direct connection between AR expression and OS in our data. ARs were associated with two miRNAs, miRNA-185 and miRNA-145-5p, which was instrumental in finding a dimension of activity independent of the ZNF transcription factors. However, it was not directly related to the clinical output. When grouped in a new dimension named the ZNF role, Kaplan–Meier survival analysis demonstrated a significant difference in PC patients’ survival based on the ZNF role values. The same dimension was able to predict a large proportion of the variance of OS (46%), thus confirming its efficacy and strength as a predictive tool for PC. Assessing the ZNF proteins and the related miRNAs’ values identified in this study could be helpful in the early diagnosis and prognosis of PC.
Previous studies showed that ZNF dysregulation could be associated with tumorigenesis and progression in several cancers [34]. There is a need to detect specific pathways in PC, as the ZNF role in tumor progression may vary in different types of cancer. An et al. [35] focused on gene expression profiles of six members of the ZNF family genes in 33 different cancer types, concluding that having a better understanding of their role in breast cancer is a potential area for future research. Hong et al. [15] identified six ZNF family genes with a role in immunity, prognosis, and treatment of esophageal cancer. Zhu et al. [16] provided a ZNF gene family model evaluating prognostic risk for patients with pancreatic cancer. Our study contributed to this trend, revealing that a linear combination of ZNF747, ZNF700, and ZRANB2 may imply PC progression.
Excluding a few recent papers, the literature on zinc finger proteins and their exact molecular functions is still sparse. KRAB-ZNFs are involved in various tumors by modulating cell proliferation and progression [36]. However, the KRAB-ZNF role in carcinogenesis may be multifaceted as it can serve as an oncogene or tumor suppressor gene [37,38]. Only two or three zinc finger motifs are necessary for ZNFs’ binding on the promoter region of specific targets [39]. In most cases, the ZNFs’ target genes are still unknown or poorly understood. There is an urgent need to assess the role of ZNFs in modulating gene expression in different pathological contexts. Additionally, our study emphasizes the need to investigate ZNF747, ZNF700, and ZRANB2 in their relationship to PC.
Research has identified several up-regulated ZNFs in tumors, like ZNF695, ZNF320, ZNF200, ZNF354A, ZNF707, and ZNF138 [40,41,42,43]. ZRANB2 is known to be involved in RNA splicing and transcriptional regulation, and its role in prostate cancer could be linked to alternative splicing events that affect oncogenic pathways, potentially influencing tumor aggressiveness and therapy resistance. Concerning ZNF700, the only study, by O’Reilly et al. [44], suggested that the classical C2H2 zinc finger motif of ZNF700 may account for an elevated immunogenic potential of this protein. Specifically, ZNF700 has been implicated in transcriptional regulation and immune system modulation. In PC, ZNF700 may influence tumor progression by regulating gene expression patterns associated with cell proliferation and differentiation. This study also suggests ZNF700’s use as a potential diagnostic tool for minimally invasive detection of colorectal cancer. However, survival analysis showed no correlation between colorectal cancer patients and the presence of ZNF autoantibodies in the serum of patients. Since ZNF747 has not been previously studied for cancer, its function remains speculative. Given its classification as a zinc finger protein, it may act as a transcriptional regulator, influencing genes involved in cell cycle control, apoptosis, or androgen receptor signaling. Further experimental validation is needed to determine whether ZNF747 plays a role in tumor suppression or oncogenesis.
We also verified that several miRNAs could contribute to the predictive values of biomarkers related to PC. MiR-143-3p and miR-34a-5p inhibit cell proliferation and promote apoptosis, improving immune response, metabolism, and cell signaling [26]. Our study confirmed these effects because of the positive contribution to the dimension, which increased the OS probability. On the other hand, miRNA421, miRNA135, and miRNA145-5p can promote the proliferation and migration of tumor cells [21], as confirmed by our study, given the negative contribution to the new dimension of the ZNF role.
High zinc levels are essential for prostate health, and the zinc content in cancerous tissue is significantly low or negligible [45]. Reduced zinc levels have two main effects on prostate cells: a metabolic and a growth effect. Together with the increased energy production, the cellular growth increases the proliferation of cancer cells [46], which is dependent on zinc concentration. It is still unknown how zinc can have these two opposite regulatory effects. Therefore, identifying the correct zinc family would be necessary for its prognostic role in PC. Alternatively, it is possible to enhance zinc availability through diet or sex-steroid treatment, considering that they can increase the expression of ZIP1 [47].
The absence of a direct role of AR on clinical output in our models was against our initial hypothesis, and it is difficult to interpret. Testosterone and 5α-dihydrotestosterone (DHT) control PC development and growth, and exercise their effects through binding to AR, which can increase cellular proliferation by decreasing apoptosis [48]. Moreover, as with other steroids, androgens can have a rapid effect on signals involved in cell cycle control, such as steroid receptor trafficking [49]. One possible explanation for this lack of direct association could be the heterogeneity in AR expression and function. AR expression levels can vary significantly among prostate cancer patients, particularly between hormone-sensitive and castration-resistant stages. While AR is crucial for tumor initiation and progression, its role in late-stage disease may be influenced by additional factors, such as AR mutations and AR splice variants (e.g., AR-V7), which could alter AR signaling, making its expression less predictive of survival outcomes. According to TCGA prostate cancer datasets, AR mutations are relatively rare in primary tumors but more prevalent in metastatic castration-resistant prostate cancer (mCRPC). In the case of the prevalence of primary tumors, the impact of AR mutations on survival may be minimal, explaining the lack of a direct association. In some cases, tumors may bypass AR dependency through neuroendocrine differentiation or activation of alternative survival mechanisms, reducing the predictive power of AR expression alone. Moreover, the dataset used in our study may have inherent biases, such as sample selection criteria, which could impact the observed associations. Additionally, AR expression may correlate more strongly with response to therapy rather than survival, which could also explain the discrepancy [50]. A secondary explanation is that ARs’ effects were masked by the ZNFs’ effects, thus making AR a modulatory pathway for the ZNFs’ activation.
Although our study proposed a novel biomarker combination for PC prognosis, it clearly lacks external validation. Several approaches can be employed to confirm the reliability and clinical relevance of our proposed biomarker combination for PC prognosis. Validation in independent cohorts and experimental models should be able to ensure reproducibility and applicability across diverse patient populations. Multi-center clinical studies, with validation studies across multiple institutions with diverse patient populations, would help assess the robustness of the biomarker combination. Moreover, prospective cohort studies, following newly diagnosed PC patients over time and correlating biomarker expression with disease progression and survival outcomes, would strengthen our findings [51]. In addition to validation in independent patient cohorts, our biomarker expression should also be analyzed in Patient-Derived Organoids (PDOs), a 3D tumor model that closely mimics the patient’s tumor microenvironment, in patients with different PC stages to evaluate biomarkers’ prognostic relevance [52,53,54]. PC cell lines with varying aggressiveness (e.g., LNCaP, DU145, PC3) can be used to assess biomarker expression [55]. Moreover, Xenograft models using PC cell lines or patient-derived tumors implanted in immunodeficient mice can assess biomarker expression in vivo [56].
This study has apparent limitations, starting from using the TGCA database and the model’s correlational nature, thus making it impossible to extrapolate any causative functions. The TGCA database helps provide large samples, but like other retrospective databases, there is a lack of more detailed patient clinical and lifestyle habits data. As such, this makes it impossible to correlate our models to other important factors, such as anamnestic and physiological factors. A more characterized population would allow us to assess precise associations with biological properties. Genetic pathways would be an important addition for future analysis. A secondary limitation is derived from the constraints of the models. Thus, there was a need to limit the number of potential biomarkers included in the study. Ideally, a model would include dozens, if not more, different target genes and their related checkpoints. Applying more advanced bioinformatic tools to select patient cohorts may point to better, unexplored directions for the biomarker search. It will be necessary to expand this research in the future. Nevertheless, this study can point toward potential gene targets useful in future research.

5. Conclusions

Our results showed, for the first time, a promising interplay between ZNFs and several miRNAs in PC, which can predict a large proportion of the variance of an essential clinical value such as OS. Multidimensional Scaling (MDS) identified two new dimensions that were entered into a regression analysis to determine the best overall survival and disease-free interval predictors. A combination of both dimensions predicted almost 50% (R2 = 0.46) of the original variance of OS. Kaplan–Meier survival analysis also confirmed the significance of these two dimensions in relation to the clinical output. We speculate that our results can be used as preliminary guidance in molecular testing of several types of ZNF factors and their miRNAs. These results improve our comprehension of biological mechanisms and serve as potential new prognostic indicators and therapeutic targets for better patient PC management.

Author Contributions

Conceptualization, L.B. and M.B.; methodology, L.B. and M.B.; software, M.B. and S.W.; validation, L.B. and M.B.; formal analysis, L.B., M.B., S.W., N.S. and R.S.; investigation, L.B., M.B. and N.S.; data curation, M.B. and S.W.; writing—original draft preparation, L.B. and M.B.; writing—review and editing, L.B., M.B., S.W., N.S. and R.S.; supervision, L.B. and M.B. All authors have read and agreed to the published version of the manuscript.

Funding

This research received no external funding.

Institutional Review Board Statement

We are using publicly available data, for which the ethical approval was obtained when the original study was approved. We had included this paragraph in the paper.

Informed Consent Statement

Not applicable.

Data Availability Statement

The original contributions presented in this study are included in the article. Further inquiries can be directed to the corresponding author.

Conflicts of Interest

The authors declare no conflicts of interest.

References

  1. Cancer TODAY|IARC. 2022. Available online: https://gco.iarc.who.int (accessed on 31 January 2024).
  2. Siegel, D.A. Prostate cancer incidence and survival, by stage and race/ethnicity—United States, 2001–2017. MMWR. Morb. Mortal. Wkly. Rep. 2020, 69, 1473–1480. [Google Scholar] [CrossRef]
  3. Smolarz, B.; Durczyński, A.; Romanowicz, H.; Szyłło, K.; Hogendorf, P. miRNAs in cancer (review of literature). Int. J. Mol. Sci. 2022, 23, 2805. [Google Scholar] [CrossRef]
  4. Peng, Y.; Croce, C.M. The role of MicroRNAs in human cancer. Signal Transduct. Target. Ther. 2016, 1, 15004. [Google Scholar] [CrossRef]
  5. Pozniak, T.; Shcharbin, D.; Bryszewska, M. Circulating microRNAs in medicine. Int. J. Mol. Sci. 2022, 23, 3996. [Google Scholar] [CrossRef]
  6. Li, Y.; Azmi, A.S.; Mohammad, R.M. Deregulated transcription factors and poor clinical outcomes in cancer patients. Semin. Cancer Biol. 2022, 86, 122–134. [Google Scholar] [CrossRef]
  7. Senapati, D.; Kumari, S.; Heemers, H.V. Androgen receptor co-regulation in prostate cancer. Asian J. Urol. 2020, 7, 219–232. [Google Scholar] [CrossRef]
  8. Heemers, H.V.; Tindall, D.J. Androgen receptor (AR) coregulators: A diversity of functions converging on and regulating the AR transcriptional complex. Endocr. Rev. 2007, 28, 778–808. [Google Scholar] [CrossRef] [PubMed]
  9. Kumari, S.; Senapati, D.; Heemers, H.V. Rationale for the development of alternative forms of androgen deprivation therapy. Endocr.-Relat. Cancer 2017, 24, R275–R295. [Google Scholar] [CrossRef] [PubMed]
  10. DePriest, A.D.; Fiandalo, M.V.; Schlanger, S.; Heemers, F.; Mohler, J.L.; Liu, S.; Heemers, H.V. Regulators of Androgen Action Resource: A one-stop shop for the comprehensive study of androgen receptor action. Database 2016, 2016, bav125. [Google Scholar] [CrossRef]
  11. Wolfe, S.A.; Nekludova, L.; Pabo, C.O. DNA recognition by Cys2His2 zinc finger proteins. Annu. Rev. Biophys. Biomol. Struct. 2000, 29, 183–212. [Google Scholar] [CrossRef] [PubMed]
  12. Jones, S. An overview of the basic helix-loop-helix proteins. Genome Biol. 2004, 5, 226. [Google Scholar] [CrossRef] [PubMed]
  13. Scott, M.P.; Tamkun, J.W.; Hartzell, G.W. The structure and function of the homeodomain. Biochim. Biophys. Acta (BBA)-Rev. Cancer 1989, 989, 25–48. [Google Scholar] [CrossRef]
  14. Jen, J.; Wang, Y.C. Zinc finger proteins in cancer progression. J. Biomed. Sci. 2016, 23, 53. [Google Scholar] [CrossRef]
  15. Hong, K.; Yang, Q.; Yin, H.; Wei, N.; Wang, W.; Yu, B. Comprehensive analysis of ZNF family genes in prognosis, immunity, and treatment of esophageal cancer. BMC Cancer 2023, 23, 301. [Google Scholar] [CrossRef] [PubMed]
  16. Zhu, L.; Tu, D.; Li, R.; Li, L.; Zhang, W.; Jin, W.; Li, T.; Zhu, H. The diagnostic significance of the ZNF gene family in pancreatic cancer: A bioinformatics and experimental study. Front. Genet. 2023, 14, 1089023. [Google Scholar] [CrossRef] [PubMed]
  17. Zhang, X.; Jing, Y.; Qin, Y.; Hunsucker, S.; Meng, H.; Sui, J.; Jiang, Y.; Gao, L.; An, G.; Yang, N.; et al. The zinc finger transcription factor ZKSCAN3 promotes prostate cancer cell migration. Int. J. Biochem. Cell Biol. 2012, 44, 1166–1173. [Google Scholar] [CrossRef]
  18. Wang, H.; Liu, W.; Black, S.; Turner, O.; Daniel, J.M.; Dean-Colomb, W.; He, Q.P.; Davis, M.; Yates, C. Kaiso, a transcriptional repressor, promotes cell migration and invasion of prostate cancer cells through regulation of miR-31 expression. Oncotarget 2016, 7, 5677–5689. [Google Scholar] [CrossRef]
  19. Najafabadi, H.S.; Mnaimneh, S.; Schmitges, F.W.; Garton, M.; Lam, K.N.; Yang, A.; Albu, M.; Weirauch, M.T.; Radovani, E.; Kim, P.M.; et al. C2H2 zinc finger proteins greatly expand the human regulatory lexicon. Nat. Biotechnol. 2015, 33, 555–562. [Google Scholar] [CrossRef]
  20. Schitcu, V.H.; Raduly, L.; Nutu, A.; Zanoaga, O.; Ciocan, C.; Munteanu, V.C.; Berindan-Neagoe, I. MicroRNA dysregulation in prostate cancer. Pharmacogenom. Pers. Med. 2022, 15, 177–193. [Google Scholar] [CrossRef]
  21. Keller, A.; Fehlmann, T.; Backes, C.; Kern, F.; Gislefoss, R.; Langseth, H.; Meese, E. Competitive learning suggests circulating miRNA profiles for cancers decades prior to diagnosis. RNA Biol. 2020, 17, 1416–1426. [Google Scholar] [CrossRef]
  22. Dong, A.; Zhang, J.; Sun, W.; Hua, H.; Sun, Y. Upregulation of miR-421 predicts poor prognosis and promotes proliferation, migration, and invasion of papillary thyroid cancer cells. J. Chin. Med. Assoc. 2020, 83, 991–996. [Google Scholar] [CrossRef]
  23. Li, C.; Wu, W.; Zhu, Z.; Lu, P.; Gong, J.; Ma, R. miR-550a-5p promotes the proliferation and migration of hepatocellular carcinoma by targeting GNE via the Wnt/β-catenin signaling pathway. Neoplasma 2022, 69, 1359–1372. [Google Scholar] [CrossRef]
  24. You, B.; Zhang, K. MicroRNA-144-3p inhibits cell proliferation and promotes apoptosis in castration-resistant prostate cancer by targeting CEP55. Eur. Rev. Med. Pharmacol. Sci. 2018, 22, 7660–7670. [Google Scholar]
  25. Iscaife, A.; Reis, S.; Morais, D.; Viana, N.; Silva, I.; Pimenta, R.; Bordini, A.; Dip, N.; Srougi, M.; Leite, K. Treating metastatic prostate cancer with microRNA-145. Apoptosis 2018, 23, 388–395. [Google Scholar] [CrossRef]
  26. Oto, J.; Herranz, R.; Plana, E.; Sánchez-González, J.V.; Pérez-Ardavín, J.; Hervás, D.; Fernández-Pardo, Á.; Cana, F.; Vera-Donoso, C.D.; Martínez-Sarmiento, M.; et al. Identification of miR-20a-5p as robust normalizer for urine microRNA studies in renal cell carcinoma and a profile of dysregulated microRNAs. Int. J. Mol. Sci. 2021, 22, 7913. [Google Scholar] [CrossRef]
  27. Aakula, A.; Leivonen, S.; Hintsanen, P.; Aittokallio, T.; Ceder, Y.; Børresen-Dale, A.; Perälä, M.; Östling, P.; Kallioniemi, O. MicroRNA-135b regulates ERα, AR and HIF1AN and affects breast and prostate cancer cell growth. Mol. Oncol. 2015, 9, 1287–1300. [Google Scholar] [CrossRef] [PubMed]
  28. Korsunsky, I.; Millard, N.; Fan, J.; Slowikowski, K.; Zhang, F.; Wei, K.; Baglaenko, Y.; Brenner, M.; Loh, P.R.; Raychaudhuri, S. Fast, sensitive and accurate integration of single-cell data with Harmony. Nat. Methods 2019, 16, 1289–1296. [Google Scholar] [CrossRef]
  29. Epstein, J.I.; Egevad, L.; Amin, M.B.; Delahunt, B.; Srigley, J.R.; Humphrey, P.A.; Grading Committee. The 2014 International Society of Urological Pathology (ISUP) consensus conference on Gleason grading of prostatic carcinoma: Definition of grading patterns and proposal for a new grading system. Am. J. Surg. Pathol. 2016, 40, 244–252. [Google Scholar] [CrossRef] [PubMed]
  30. Moch, H.; Humphrey, P.A.; Ulbright, T.M.; Reuter, V.E. (Eds.) WHO Classification of Tumors of the Urinary System and Male Genital Organs, 4th ed.; IARC: Lyon, France, 2016. [Google Scholar]
  31. van Leenders, G.J.L.H.; van der Kwast, T.H.; Grignon, D.J.; Evans, A.J.; Kristiansen, G.; Kweldam, C.F.; Litjens, G.; McKenney, J.K.; Melamed, J.; Mottet, N.; et al. ISUP Grading Workshop Panel Members (2020). The 2019 International Society of Urological Pathology (ISUP) Consensus Conference on Grading of Prostatic Carcinoma. Am. J. Surg. Pathol. 2020, 44, e87–e99. [Google Scholar] [CrossRef]
  32. Kaplan, E.L.; Meier, P. Nonparametric estimation from incomplete observations. J. Am. Statist. Assoc. 1958, 53, 457–481. [Google Scholar] [CrossRef]
  33. Kruskal, J.B.; Wish, M. Multidimensional Scaling; Sage: Washington, DC, USA, 1978. [Google Scholar]
  34. Zhao, J.; Wen, D.; Zhang, S.; Jiang, H.; Di, X. The role of zinc finger proteins in malignant tumors. FASEB J. Off. Publ. Fed. Am. Soc. Exp. Biol. 2023, 37, e23157. [Google Scholar] [CrossRef]
  35. An, G.; Feng, L.; Hou, L.; Li, X.; Bai, J.; He, L.; Gu, S.; Zhao, X. A bioinformatics analysis of zinc finger protein family reveals potential oncogenic biomarkers in breast cancer. Gene 2022, 828, 146471. [Google Scholar] [CrossRef] [PubMed]
  36. Sobocińska, J.; Molenda, S.; Machnik, M.; Oleksiewicz, U. KRAB-ZFP Transcriptional Regulators Acting as Oncogenes and Tumor Suppressors: An Overview. Int. J. Mol. Sci. 2021, 22, 2212. [Google Scholar] [CrossRef] [PubMed]
  37. Sun, M.; Ju, J.; Ding, Y.; Zhao, C.; Tian, C. The signaling pathways regulated by KRAB zinc-finger proteins in cancer. Biochim. Biophys. Acta (BBA)-Rev. Cancer 2022, 1877, 188731. [Google Scholar] [CrossRef]
  38. Cesaro, E.; Lupo, A.; Rapuano, R.; Pastore, A.; Grosso, M.; Costanzo, P. ZNF224 Protein: Multifaceted Functions Based on Its Molecular Partners. Molecules 2021, 26, 6296. [Google Scholar] [CrossRef]
  39. Emerson, R.O.; Thomas, J.H. Adaptive Evolution in Zinc Finger Transcription Factors. PLoS Genet. 2009, 5, e1000325. [Google Scholar] [CrossRef]
  40. Juárez-Méndez, S.; Zentella-Dehesa, A.; Villegas-Ruíz, V.; Pérez-González, O.A.; Salcedo, M.; López-Romero, R.; Román-Basaure, E.; Lazos-Ochoa, M.; de Oca-Fuentes, V.E.M.; Vázquez-Ortiz, G.; et al. Splice variants of zinc finger protein 695 mRNA associated to ovarian cancer. J. Ovarian Res. 2013, 6, 61. [Google Scholar] [CrossRef]
  41. Li, R.; Campos, J.; Iida, J. A gene regulatory program in human breast cancer. Genetics 2015, 201, 1341–1348. [Google Scholar] [CrossRef]
  42. Chernova, O.B.; Hunyadi, A.; Malaj, E.; Pan, H.; Crooks, C.; Roe, B.; Cowell, J.K. A novel member of the WD-repeat gene family, WDR11, maps to the 10q26 region and is disrupted by a chromosome translocation in human glioblastoma cells. Oncogene 2001, 20, 5378–5392. [Google Scholar] [CrossRef]
  43. Nesslinger, N.J.; Sahota, R.A.; Stone, B.; Johnson, K.; Chima, N.; King, C.; Rasmussen, D.; Bishop, D.; Rennie, P.S.; Gleave, M.; et al. Standard treatments induce antigen-specific immune responses in prostate cancer. Clin. Cancer Res. 2007, 13, 1493–1502. [Google Scholar] [CrossRef]
  44. O’Reilly, J.A.; Fitzgerald, J.; Fitzgerald, S.; Kenny, D.; Kay, E.W.; O’Kennedy, R.; Kijanka, G.S. Diagnostic potential of zinc finger protein-specific autoantibodies and associated linear B-cell epitopes in colorectal cancer. PLoS ONE 2015, 10, e0123469. [Google Scholar] [CrossRef] [PubMed]
  45. Cortesi, M.; Fridman, E.; Volkov, A.; Shilstein, S.; Chechik, R.; Breskin, A.; Vartsky, D.; Raviv, G.; Ramon, J. New prospective for non-invasive detection, grading, size evaluation, and tumor location of prostate cancer. Prostate 2010, 70, 1701–1708. [Google Scholar] [CrossRef]
  46. Costello, L.C.; Feng, P.; Milon, B.; Tan, M.; Franklin, R.B. Role of zinc in the pathogenesis and treatment of prostate cancer: Critical issues to resolve. Prostate Cancer Prostatic Dis. 2004, 7, 111–117. [Google Scholar] [CrossRef]
  47. Hussain, S.; Khan, M.; Sheikh, T.M.M.; Mumtaz, M.Z.; Chohan, T.A.; Shamim, S.; Liu, Y. Zinc essentiality, toxicity, and its bacterial bioremediation: A comprehensive insight. Front. Microbiol. 2022, 13, 900740. [Google Scholar] [CrossRef]
  48. Dehm, S.M.; Tindall, D.J. Molecular regulation of androgen action in prostate cancer. J. Cell. Biochem. 2006, 99, 333–344. [Google Scholar] [CrossRef]
  49. Leung, J.K.; Sadar, M.D. Non-genomic actions of the androgen receptor in prostate cancer. Front. Endocrinol. 2017, 8, 2. [Google Scholar] [CrossRef] [PubMed]
  50. Kumar, A.; Coleman, I.; Morrissey, C.; Zhang, X.; True, L.D.; Gulati, R.; Etzioni, R.; Bolouri, H.; Montgomery, B.; White, T.; et al. Substantial interindividual and limited intraindividual genomic diversity among tumors from men with metastatic prostate cancer. Nat. Med. 2016, 22, 369–378. [Google Scholar] [CrossRef] [PubMed]
  51. Zhong, X.; Yang, Y.; He, H.; Xiong, Y.; Zhong, M.; Wang, S.; Xia, Q. Integrating multi-cohort machine learning and clinical sample validation to explore peripheral blood mRNA diagnostic biomarkers for prostate cancer. Cancer Cell Int. 2025, 25, 158. [Google Scholar] [CrossRef]
  52. Lee, J.; Kim, Y.; Lee, C.; Jeon, S.S.; Seo, H.; Lee, J.; Choi, J.; Kang, M.; Kim, E.; Shin, K.; et al. Generation of prostate cancer assembloids modeling the patient-specific tumor microenvironment. PLoS Genet. 2025, 21, e1011652. [Google Scholar] [CrossRef] [PubMed]
  53. Zhou, L.; Zhang, C.; Zhang, Y.; Shi, C. Application of Organoid Models in Prostate Cancer Research. Front. Oncol. 2021, 11, 736431. [Google Scholar] [CrossRef]
  54. Waseem, M.; Wang, B.-D. Organoids: An Emerging Precision Medicine Model for Prostate Cancer Research. Int. J. Mol. Sci. 2024, 25, 1093. [Google Scholar] [CrossRef]
  55. Saranyutanon, S.; Deshmukh, S.K.; Dasgupta, S.; Pai, S.; Singh, S.; Singh, A.P. Cellular and Molecular Progression of Prostate Cancer: Models for Basic and Preclinical Research. Cancers 2020, 12, 2651. [Google Scholar] [CrossRef]
  56. Wu, X.; Gong, S.; Roy-Burman, P.; Lee, P.; Culig, Z. Current mouse and cell models in prostate cancer research. Endocr.-Relat. Cancer 2013, 20, R155–R170. [Google Scholar] [CrossRef] [PubMed]
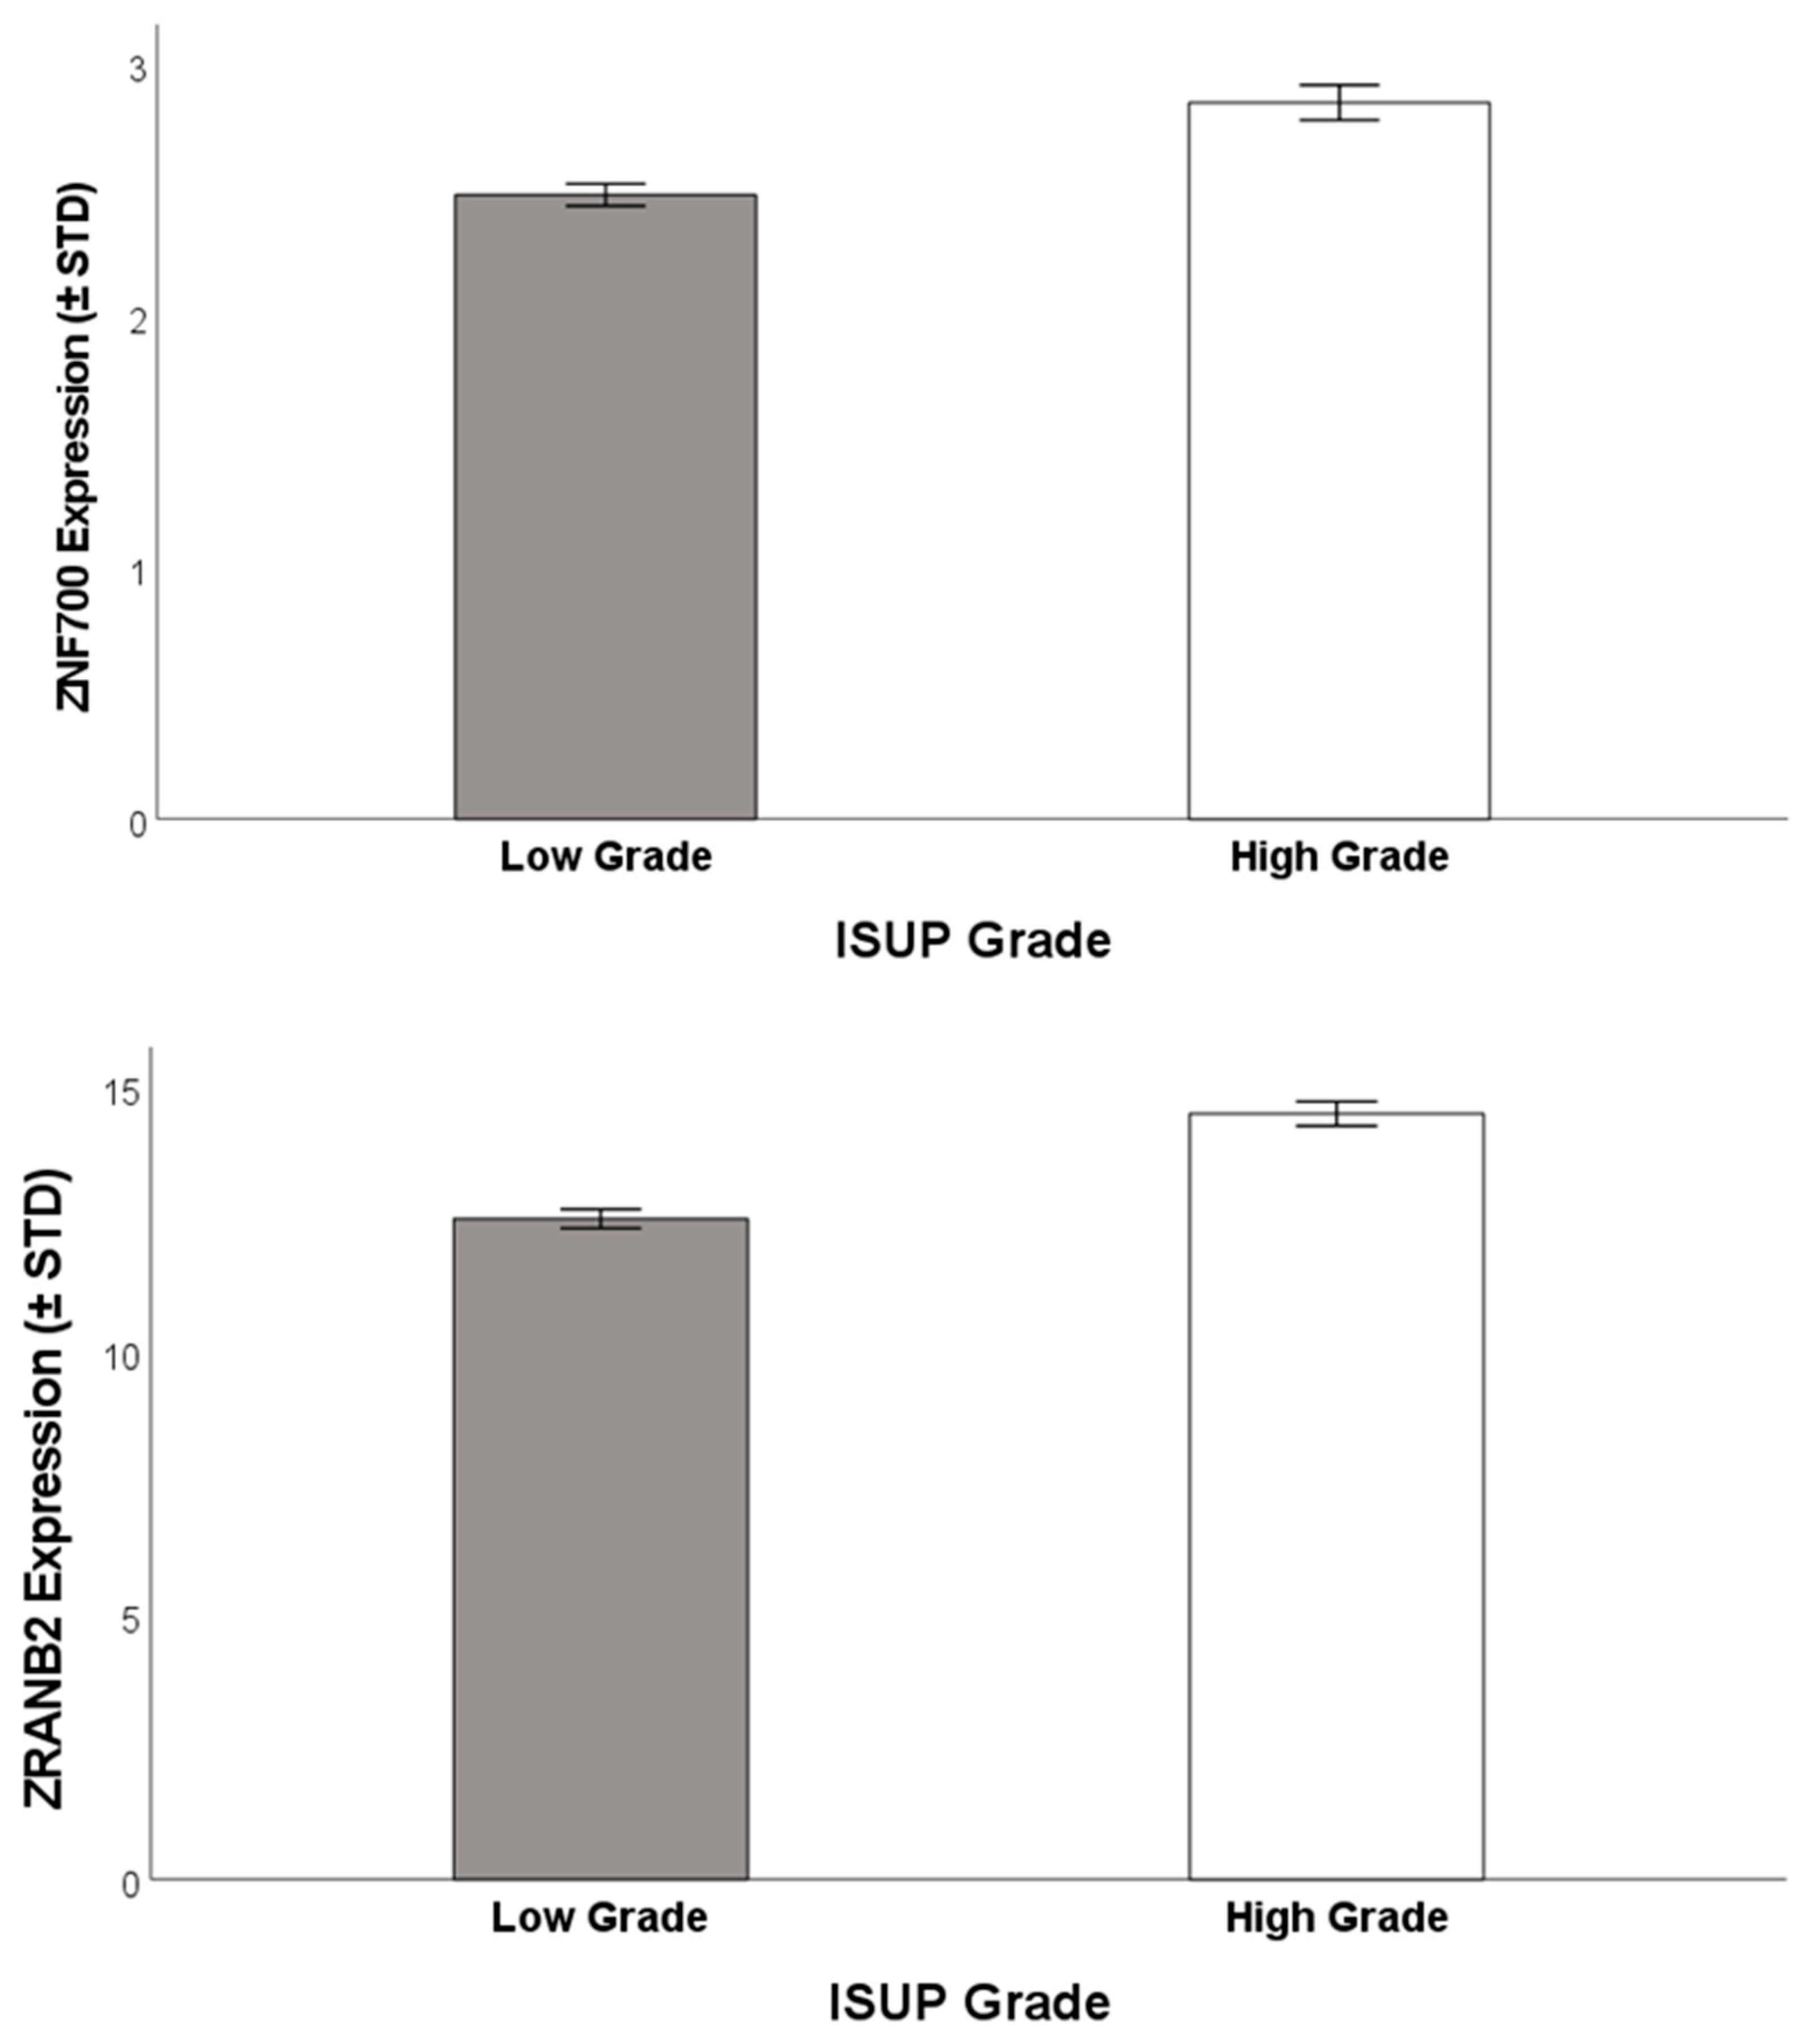
Figure 1. Differences in gene expression among grading groups by the ISUP consensus recommendations. ZNF700 and ZRANB2, in the upper and lower panel, respectively, showed a significant effect of grading on gene expression. For both ZRANB2 and ZNF700, the expression was higher in patients with higher-grade PC (p < 0.001).
Sci 07 00111 g001
Figure 2. Differences in DFI among grading groups by ISUP consensus recommendations. Low-grade group included grades 1, 2, and 3 by ISUP; high-grade group included grades 4 and 5 by ISUP. High-grade PC showed significantly higher probability of having shorter DFI (p < 0.05).
Sci 07 00111 g002
Figure 3. Multidimensional Scaling (MDS) map of the association among the target genes (ZNFs and AR) and related miRNAs. Three clusters are indicated on the map by the circles. Overall survival (OS) was grouped with ZNF747 and two miRNAs (left group). On the opposite side of the map, ZNF700 and ZRANB2 were grouped with three miRNAs (right group). The last group consisted of AR and two miRNAs (upper group). Given the configuration of the variables entered in the analysis, the two new dimensions were named ZNF and AR roles.
Sci 07 00111 g003
Figure 4. Kaplan–Meier curves of the first dimension, ZNF role, which were revealed by the MDS analysis. The curve showed a higher OS (upper panel) and DFI (lower panel) in patients with low levels of ZNF role expression in comparison to patients with high levels (p < 0.05 for both clinical outputs).
Sci 07 00111 g004
Figure 5. Kaplan–Meier curves of the second dimension, AR role, which were revealed by the MDS analysis. The survival curves were significantly different for either OS (upper panel) or DFI (lower panel) in patients with low levels of AR role expression in comparison to patients with high levels (p < 0.05 for both clinical outputs).
Sci 07 00111 g005
Table 1. Number of patients by Gleason score and group classification.
ClassificationPrimary GSSecondary GSN. of CasesPercentageLow/High Score
Group 1334410%L
Group 23414629%L
Group 34310120%L
Group 4446413%H
Group 54, 54, 514128%H
Table 2. Pearson’s correlation of the target genes, selected miRNAs, and clinical output (disease-free interval (DFI) and overall survival (OS).
OSARZNF747ZRANB2ZNF700miR421miR185miR135miR34a5pmiR1455pmiR1445pmiR550a5pmiR1433p
DFI0.914 **−0.0110.151 **−0.127 **−0.155 **−0.0320.034−0.1200.0440.0060.014−0.0800.081
OS −0.0360.139 **−0.084−0.131 **−0.0570.047−0.128 *0.048−0.0080.004−0.0170.053
AR −0.0270.0860.100 *0.1240.176 **−0.201 **−0.0800.229 **−0.0260.046−0.087
ZNF747 −0.176 **−0.174 **−0.132−0.051−0.102−0.043−0.047−0.035−0.228 *−0.079
ZRANB2 0.527 **0.098−0.018−0.014−0.0300.104−0.0380.206 *0.066
ZNF700 0.246 **0.0820.060−0.0870.204 **−0.0620.023−0.081
miR421 0.0170.209 **−0.0250.209 **−0.0190.102−0.048
miR185 0.008−0.0860.0890.014−0.123−0.086
miR135 0.110−0.025−0.154 *−0.137−0.037
miR34a5p 0.031−0.036−0.088−0.027
miR1455p −0.004−0.006−0.014
miR1445p 0.0120.019
miR550a5p −0.078
(*) Indicates significance at the 0.05 level. (**) Indicates significance at the 0.01 level.
Table 3. Stepwise regression of the clinical output (OS and DFI) by the new dimensions revealed by the MDS analysis.
Model OSUnstandardized CoefficientsStandardized CoefficientstSig.
BStd. ErrorBetaAdj. R2
1(Constant)40.067 ± 3.361.678 23.876<0.001
ZNF role17.958 ± 3.381.6890.77910.630<0.0010.39
2(Constant)40.067 ± 3.111.553 25.790<0.001
ZNF role17.958 ± 3.131.5640.77911.482<0.001
AR role5.677 ± 3.131.5640.2463.629<0.0010.46
a. Dependent Variable: Overall Survival (OS)
Model DFIUnstandardized CoefficientsStandardized CoefficientstSig.
BStd. ErrorBetaAdj. R2
1(Constant)35.953 ± 3.771.884 19.082<0.001
ZNF role12.427 ± 3.541.8870.6136.586<0.0010.27
2(Constant)35.963 ± 3.541.768 20.304<0.001
ZNF role12.422 ± 3.541.7710.6137.015<0.001
AR role−5.801 ± 3.531.766−0.287−3.280<0.0010.34
b. Dependent Variable: Disease-Free Interval (DFI)
Disclaimer/Publisher’s Note: The statements, opinions and data contained in all publications are solely those of the individual author(s) and contributor(s) and not of MDPI and/or the editor(s). MDPI and/or the editor(s) disclaim responsibility for any injury to people or property resulting from any ideas, methods, instructions or products referred to in the content.