Article

A Molecular Dynamics Perspective on the Impacts of Random Rough Surface, Film Thickness, and Substrate Temperature on the Adsorbed Film’s Liquid–Vapor Phase Transition Regime

1
Department of Architecture and Engineering, University of Parma, Parco Area delle Science 181/A, 43124 Parma, Italy
2
Department of Engineering for Industrial Systems and Technologies, University of Parma, 43124 Parma, Italy
*
Author to whom correspondence should be addressed.
Submission received: 25 March 2024 / Revised: 19 May 2024 / Accepted: 23 May 2024 / Published: 3 June 2024
(This article belongs to the Special Issue Feature Papers—Multidisciplinary Sciences 2023)

Abstract

:
While recent studies have proven an unexpected liquid–vapor phase transition of adsorbed liquid films, a comprehensive description of the mechanisms of different types of phase change regimes over realistic representations of random rough surfaces is absent in the literature. The current comprehensive study investigates the effects of a gold random rough surface, liquid film thickness, and substrate temperature on the liquid–vapor phase change regime of an adsorbed sodium liquid film, considering the evaporator section of a wicked heat pipe (WHP) using a molecular dynamics (MD) simulation. At first, to generate a realistic random rough surface, a new and promising method is proposed that is entirely based on MD simulations. Then, to simulate the evaporator section of a WHP, a unique configuration for eliminating the vapor domain is developed. The simulation results reveal that three distinct regimes, namely, normal evaporation, cluster boiling, and film boiling, could be identified, which are presented on two-dimensional diagrams with the substrate temperature and liquid film thickness as coordinates for the ideally smooth and random rough surfaces. The results also manifest that even though using the random rough surface could lead to different phase transition regimes, the type of regime depends mainly on the substrate temperature and liquid film thickness. Furthermore, this study displays two different modes for normal evaporation. Also, it is shown that the impacts of the liquid film thickness and substrate temperature on the mode of normal evaporation are much more significant than the surface roughness.

1. Introduction

Changing the solid surface properties is one of the most important common methods that can significantly affect the phase transition heat transfer and regime [1]. Among numerous methods to improve solid surface properties, introducing surface roughness is one of the most promising and can significantly enhance phase transition heat transfer in various thermal management devices. For example, studies [2,3] have revealed that the direct deposition of nanoparticles on the wick surface of wicked heat pipes (WHPs) could improve their thermal performance. Although macro-experimental studies have confirmed the effects of surface roughness on phase transition heat transfer, molecular dynamics (MD) simulation could be an effective technique to gain a deeper understanding of the impact of non-smooth surfaces.
MD simulations of ultra-thin liquid film phase change over simple geometric nanostructure shapes, for example, grooved [4,5,6], cubical [7,8,9,10], conical [11,12,13,14], and spherical [15,16,17] nanostructures, have been widely and intensively studied. Regardless of their shapes, the simple geometric nanostructures do not exhibit a real non-smooth surface morphology. Therefore, a few researchers have constructed random rough surfaces and studied their impact on the ultra-thin liquid–vapor phase transition. In 2019, the first random rough (copper) surfaces were generated by Liu et al. [18] using the generalized Weierstrass–Mandelbrot function to explore nanoscale explosive boiling dynamics of an ultra-thin argon liquid film (with a thickness of ~14 nm (nanometer = 10−9 m)) via MD simulations. The substrate temperature was increased in a linear manner from 85 K to 300 K during the time period of 5 ns (nanosecond = 10−9 s). According to their findings, random rough surfaces exhibit a greater heat transfer rate compared to an ideally smooth surface. This effect was further amplified when the roughness level was increased, primarily as a result of the increased surface area at the solid–liquid interface. After that, in their subsequent study [19], they developed two random rough copper surfaces with various levels of roughness with their previous method to simultaneously investigate the effect of surface wettability and roughness level on the nanoscale explosive boiling performance of an ultra-thin argon liquid film (with a thickness of ~7 nm). They found that an increase in wettability and roughness level could significantly improve liquid film–solid copper substrate energy transfer. A similar study was reported by Guo et al. [20], who constructed a random rough copper surface (by applying the generalized Weierstrass–Mandelbrot expression) to analyze the effect of surface wettability on the nucleate boiling of an ultra-thin argon liquid film. In their study, the liquid film thickness and solid substrate temperature were set to ~14 nm and 160 K, respectively. Their results indicated that, compared to an ideally smooth surface, using random rough surfaces with higher wettability could make new contact lines with more microlayers and consequently improve heat transfer. Qun and Zheng [21] investigated the evaporation of an ultra-thin argon liquid film (with a thickness of 5.76 nm) on three sinusoidal copper surfaces with different heights and numbers of sinusoidal nanostructures and their heat transfer benefits with respect to an ideally smooth surface via MD simulations. The solid substrates were gradually heated up from 86 K to 160 K. The results demonstrated that enhancement of the quantity and height of sinusoidal nanostructures improves the heat transfer characteristics. The authors attributed this better heat transfer performance for the random rough surfaces to the higher heating surface area and lower Kapitza (solid–liquid interfacial) thermal resistance. The same mathematical expression was used by Wang et al. [22] to generate four sinusoidal gold (Au) surfaces with different heights and numbers of sinusoidal nanostructures to examine the evaporation of an ultra-thin sodium (Na) liquid film (with a thickness of ~8 nm) under a 600 K heating substrate temperature. However, interestingly, the results revealed that using the random rough surface not only remarkably decreases heat transfer, but with the increment in heights and numbers of sinusoidal nanostructures, its negative effect increases. The authors attributed this adverse impact of the sinusoidal nanostructures on the heat transfer performance to the increase in the Kapitza thermal resistance and collision thermal resistance (conduction and convection thermal resistance inside the liquid film). Recently, Cao et al. [23] fabricated four Gaussian random rough copper surfaces with different levels of roughness and explored the effect of surface roughness on the nucleate boiling heat transfer of an ultra-thin argon liquid film with a thickness of 17.28 nm. The solid substrates were gradually heated up from 86 K to 200 K. They showed that enhancing the roughness of the surface enhances the heat transfer area and coupling strength between solid and liquid, and consequently improving heat transfer.
It is worth noting that most of the previous studies [18,19,20,21,22] used perfectly periodic multivariable functions to construct a regular random rough surface, which does not reflect the raw pattern of real solid surfaces. Furthermore, all the abovementioned investigations were limited to the use of a single combination of liquid film thickness and solid substrate temperature. This strongly hampers an in-depth understanding of ultra-thin liquid–vapor phase transition behavior, since changing film thickness and substrate temperature could lead to completely different phase transition regimes. Additionally, the aforementioned MD simulations used a specific simulation configuration consisting of either a reflecting size-control wall at the top (which results in an increasing pressure process) [18,19,21,22,23] or a pressure-control wall at the top (which results in a constant pressure process) [20]. However, in this study, considering the actual working condition of WHPs, an alternative and more realistic configuration is proposed. More details will be provided in Section 2.
In summary, in the light of the mentioned literature gaps, the present work investigates the liquid–vapor phase transition behavior over a random rough surface in the whole thickness range of the absorbed film (1–9 nm; see Ref. [24] for more details) and in the operating temperature range of sodium WHPs (600–1000 K [25]). Sodium WHPs were chosen because their working liquid (Na) is computationally more efficient and common for MD simulations of liquid–vapor phase change transition studies (see Refs. [14,22,26,27], for example) compared to other common WHPs’ working fluids (e.g., water, methanol, etc.). Moreover, the employed random rough surface is entirely generated by means of the MD technique, and to the authors’ best knowledge, this is the first attempt to fabricate a random surface entirely based on the MD technique and capable of providing a more realistic representation of existing surface topographies. Lastly, an alternative simulation configuration is adopted to effectively simulate vapor leaving the evaporator section in real WHPs.

2. MD Simulation Models and Methods

In this study, all equilibrium and non-equilibrium MD simulations were conducted with the open-source Large-scale Atomic/Molecular Massively Parallel Simulator (LAMMPS) package (patch_22Dec2022) [28] because of its adaptability and verified accuracy. The velocity Verlet algorithm [29] was employed to integrate the atom motion equation in order to update the position and velocity of atoms. To ensure accuracy of the calculations and speed up the simulations, the time step was set at 1 fs (femtosecond = 10−15 s), and the cutoff radius was chosen to be more than 2.5 times the fluid (Na) length parameters (2.5 × 3.24 Å = 9.72 Å (angstrom = 10−10 m)) and set to 10 Å to neglect their effects on the simulation results [30]. Energy minimization of all simulation systems, which is necessary to find the most stable and lowest energy conformation, was achieved using the conjugate gradient algorithm. The stopping tolerances for energy and force were chosen as 10−8 eV and 10−8 eV/Å, respectively. OVITO (Version 3.8.3) [31], an analysis and visualization software for MD simulation data, was used to generate the visual representations of the simulation boxes.
Even though copper, platinum, and aluminum are unquestionably the most common solid walls in liquid–vapor phase transition in industrial applications, to hold their atoms in their initial original positions during MD simulations, a spring force with a constant magnitude should be exerted on each atom (see Refs. [7,18,32], for more details). Therefore, to avoid exerting this non-Lennard-Jones interaction, which could not provide a realistic representation of the vibration of atoms, Au was used due to the fact that its interatomic potential parameters could work reasonably well to simulate its structure.
The MD simulation domains and procedures for constructing a random rough Au surface and liquid–vapor phase transition of the adsorbed Na liquid film are described in the following subsections.

2.1. Innovative Method to Construct a Random Rough Au Surface

In this subsection, an original method is proposed to construct a random rough Au surface. The main advantage of the presented method compared with those available in the literature (the regular and periodic rough surfaces) is that it is solely and exclusively based on MD simulations. Moreover, it could represent more realistic random rough surfaces. It should be mentioned that up to now, Guillotte et al. [33] and Wu and Hong [34] have established the most feasible and successful approach for modeling nanoporouses, from which the suggested method derives its fundamental idea.
In order to better describe the modeling procedure, Figure 1 indicates a visual representation illustrating the primary steps. The initial structure of the simulation system, which had dimensions of 40.78 Å(X) × 61.17 Å(Y) × 300.00 Å(Z), consisted of two phases: a Au pure phase and a gold–silver (Au-Ag) mixing phase. The computational domain’s height was significantly greater than the thickness of the pure and mixing phases, so both phases could be fully developed. In the X and Y directions, periodic boundary conditions were imposed, whereas in the Z direction, non-periodic boundary conditions were established. For the Au pure phase, 6 monolayers of Au consisting of 1953 atoms were arranged following a face-centered cubic (FCC) crystal structure with a lattice constant of 4.08 Å, which is based on the density of 19.29 g/cm3. The Au pure phase lied at the bottom of the simulation box. Then the Au-Ag mixing phase was placed over the Au pure phase. The Au-Ag mixing phase consisted of 500 Au atoms and 913 Ag atoms (in a 50.00:50.00 mass ratio) with a density value equal to 13.64 g/cm3 [35]. Ag was chosen as the second mixing element because its melting temperature and crystal structure are relatively similar to those of Au.
As depicted in Figure 1, the whole simulation procedure was divided into four steps: energy minimization and demixing, deletion of Ag atoms, gradual-cooling solidification, and crystalline phase replacement, which are outlined in the following paragraph.
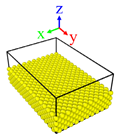
In the first step (energy minimization and demixing), the energy of the entire system was minimized. Once the minimum energy state was achieved, an MD run was performed under a constant number of particles, volume, and energy (NVE) ensemble at 1400 K (higher than the melting points of both elements). A Langevin thermostat [36] was utilized to regulate the temperature of both phases throughout this period. The total simulation time was 500 ps (picosecond = 10−12 s). In order to form artificially immiscible and separated Au and Ag clusters in the mixing phase, the Ag and Au should be immiscible and also prevent the blending of the Au pure phase with them. Therefore, the Au pure phase was fixed. In the second step (deletion of Ag atoms), the Ag liquid atoms were entirely deleted. Then, in the third step (gradual-cooling solidification), to change the amorphous state of Au atoms to a crystalline phase, the final structure obtained from the second step was cooled gradually from 1400 K to 300 K over a period of 550 ps (corresponding to a ramp rate of 2 K/ps), leading to a random rough Au surface. In the fourth step (crystalline phase replacement), to improve the crystallization and obtain a more realistic result, the final position of Au atoms from the third step was replaced by a crystalline phase, and this final configuration was taken as the random rough surface (Surface B) for the MD simulation of liquid–vapor phase transition, which is shown along with the ideally smooth surface (Surface A) in Table 1.
Despite producing a more realistic random rough surface than the conventional periodic multivariable function method, the proposed method should not be considered a time- and cost-effective computational technique.
The interactions between the pair of interacting atoms (Au and Ag) were described by two kinds of potential functions.
First, to describe the Au-Au and Ag-Ag interactions in the first step (energy minimization and demixing), the Embedded Atom Model (EAM) potential [38] was employed:
U i = F i + 1 2 j ( i ) ϕ ij r ij
Ui is the potential energy of the atom i, F i is the embedding energy, which is a function of the electron density, and ϕ ij is a short-range pair repulsion between the atoms i and j separated by a distance r ij . However, to describe the Au-Ag interactions, the Van der Waals interactions were modeled via the well-known 12-6 Lennard-Jones potential (12-6 L-J) (Equation (2)), due to its straightforward interaction potential and minimal computational expense [39].
U ij = 4 ε ij σ ij r ij 12 σ ij r ij 6
where Uij is potential energy between the atoms i and j, ε ij and σ ij are energy and length parameters, and r c is the cutoff radius. A modified version of the Lorentz combination rule was employed for the calculation of the length parameter between Au and Ag atoms, i.e., Equation (3).
σ Au-Ag = 1 4 × σ Au-Au + σ Ag-Ag 2 = 0.6514   Å
This modification was considered because the exact length parameter between Au and Ag atoms ( σ Au-Ag = σ Au-Au + σ Ag-Ag 2 = 2.6055   Å ) prevents the formation of separated Ag and Au clusters, which is essential for the proposed method of constructing the random rough Au surface (see Ref. [33] for more details). Moreover, the energy parameter between Au and Ag atoms was defined by ε Au-Ag = ε Au ε Ag = 0.3936   eV , based on the Berthelot rule (a geometric mean) [40]. The potential functions and their parameters used in different steps are tabulated in Table 2.

2.2. Liquid–Vapor Phase Transition Simulation

In this subsection, the simulation system and method for investigating liquid–vapor phase transition are introduced.
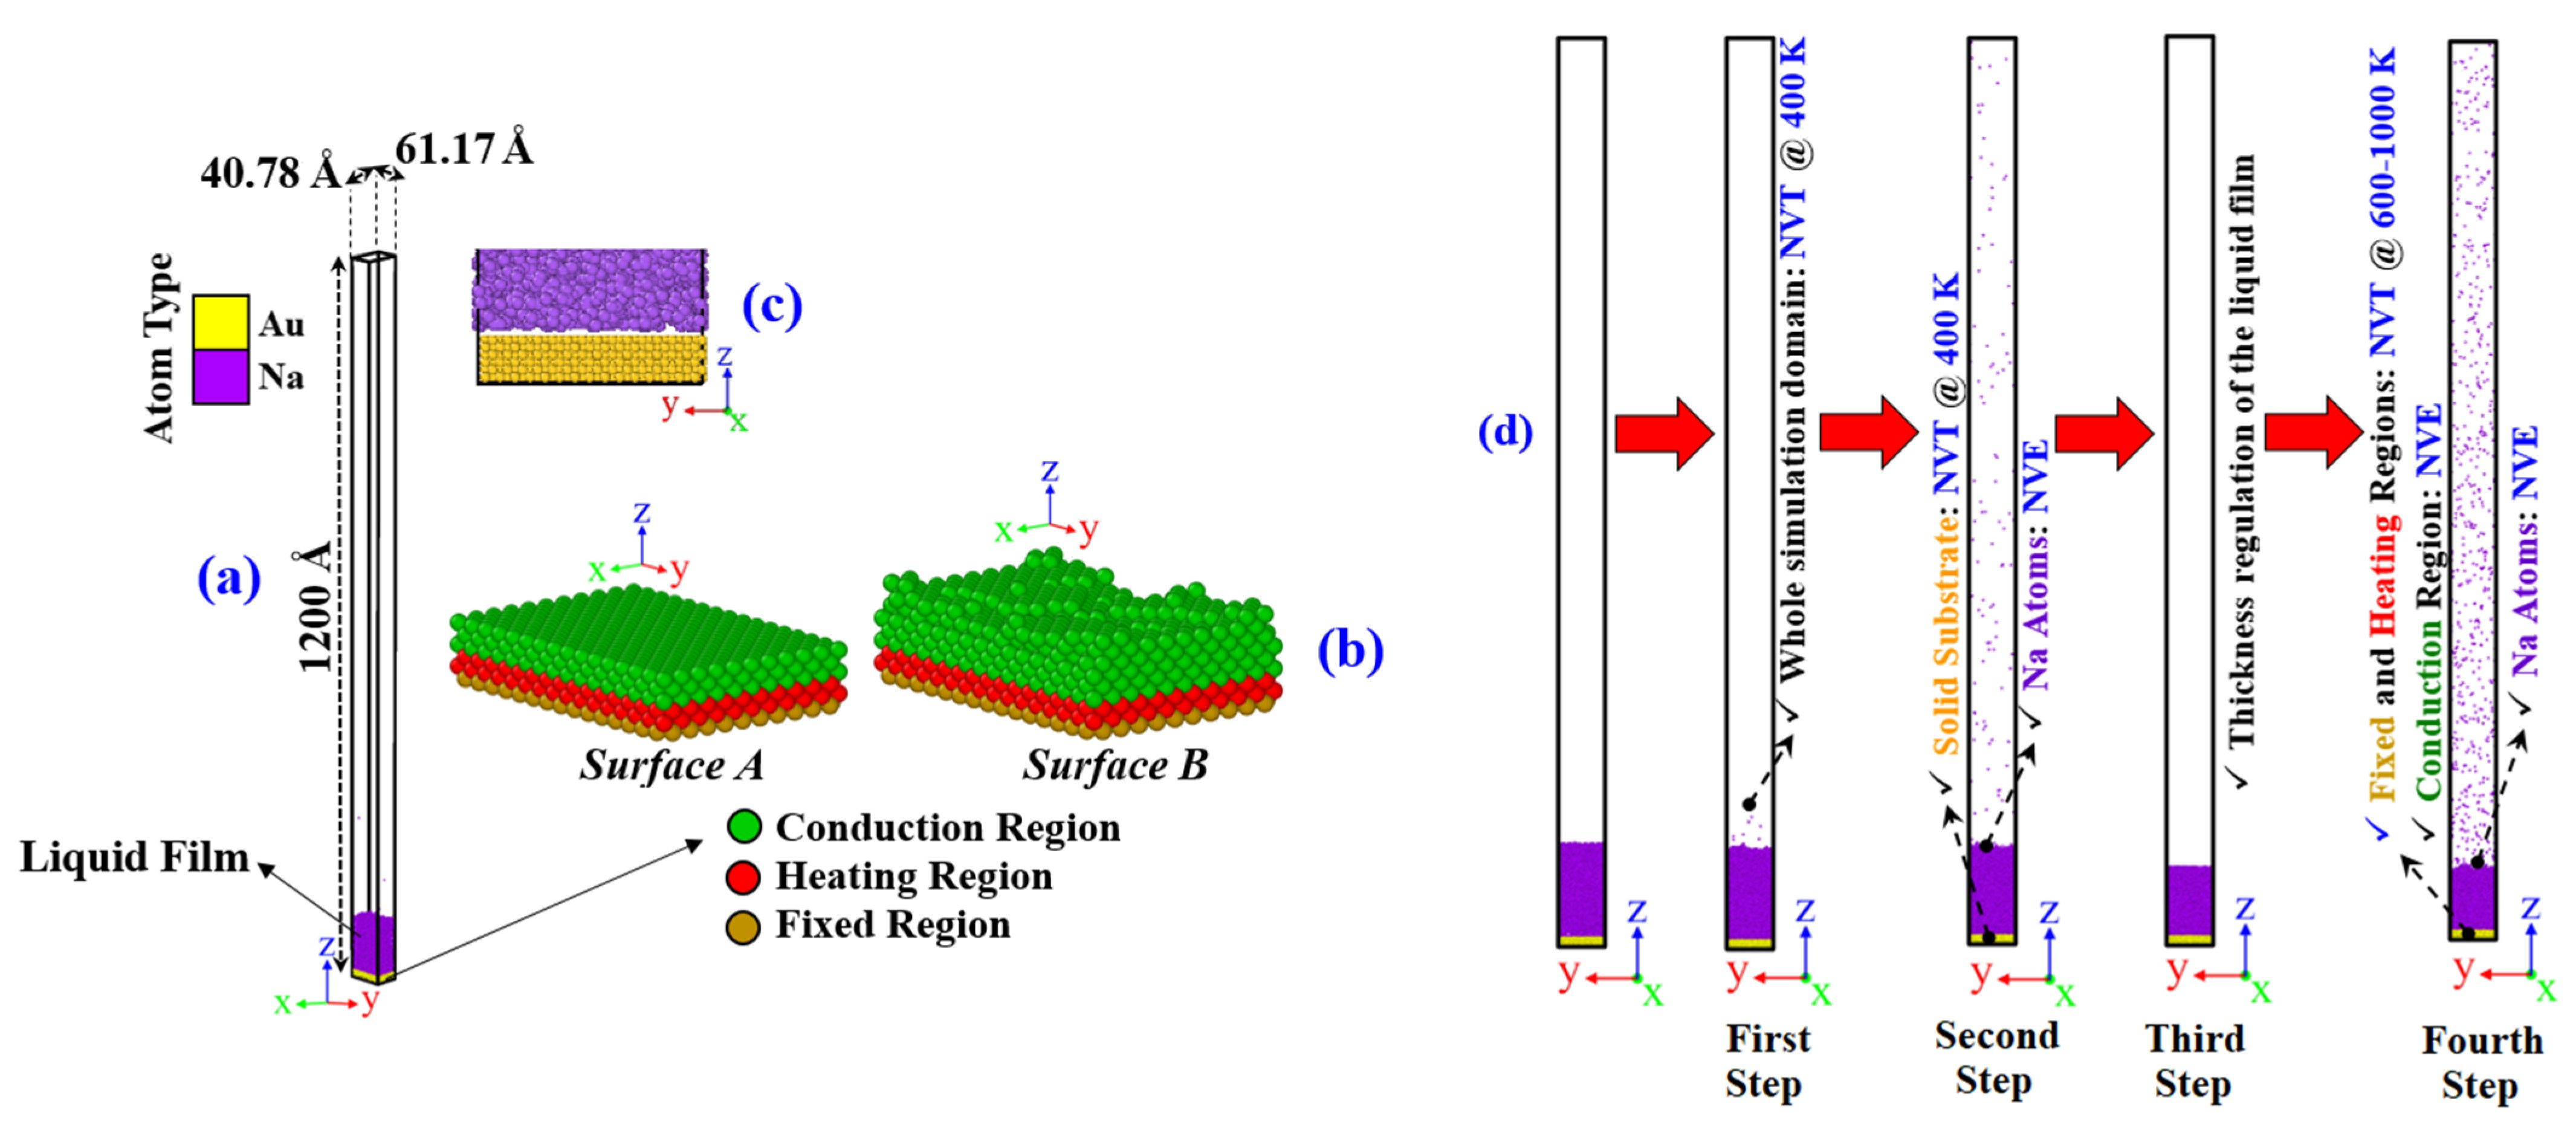
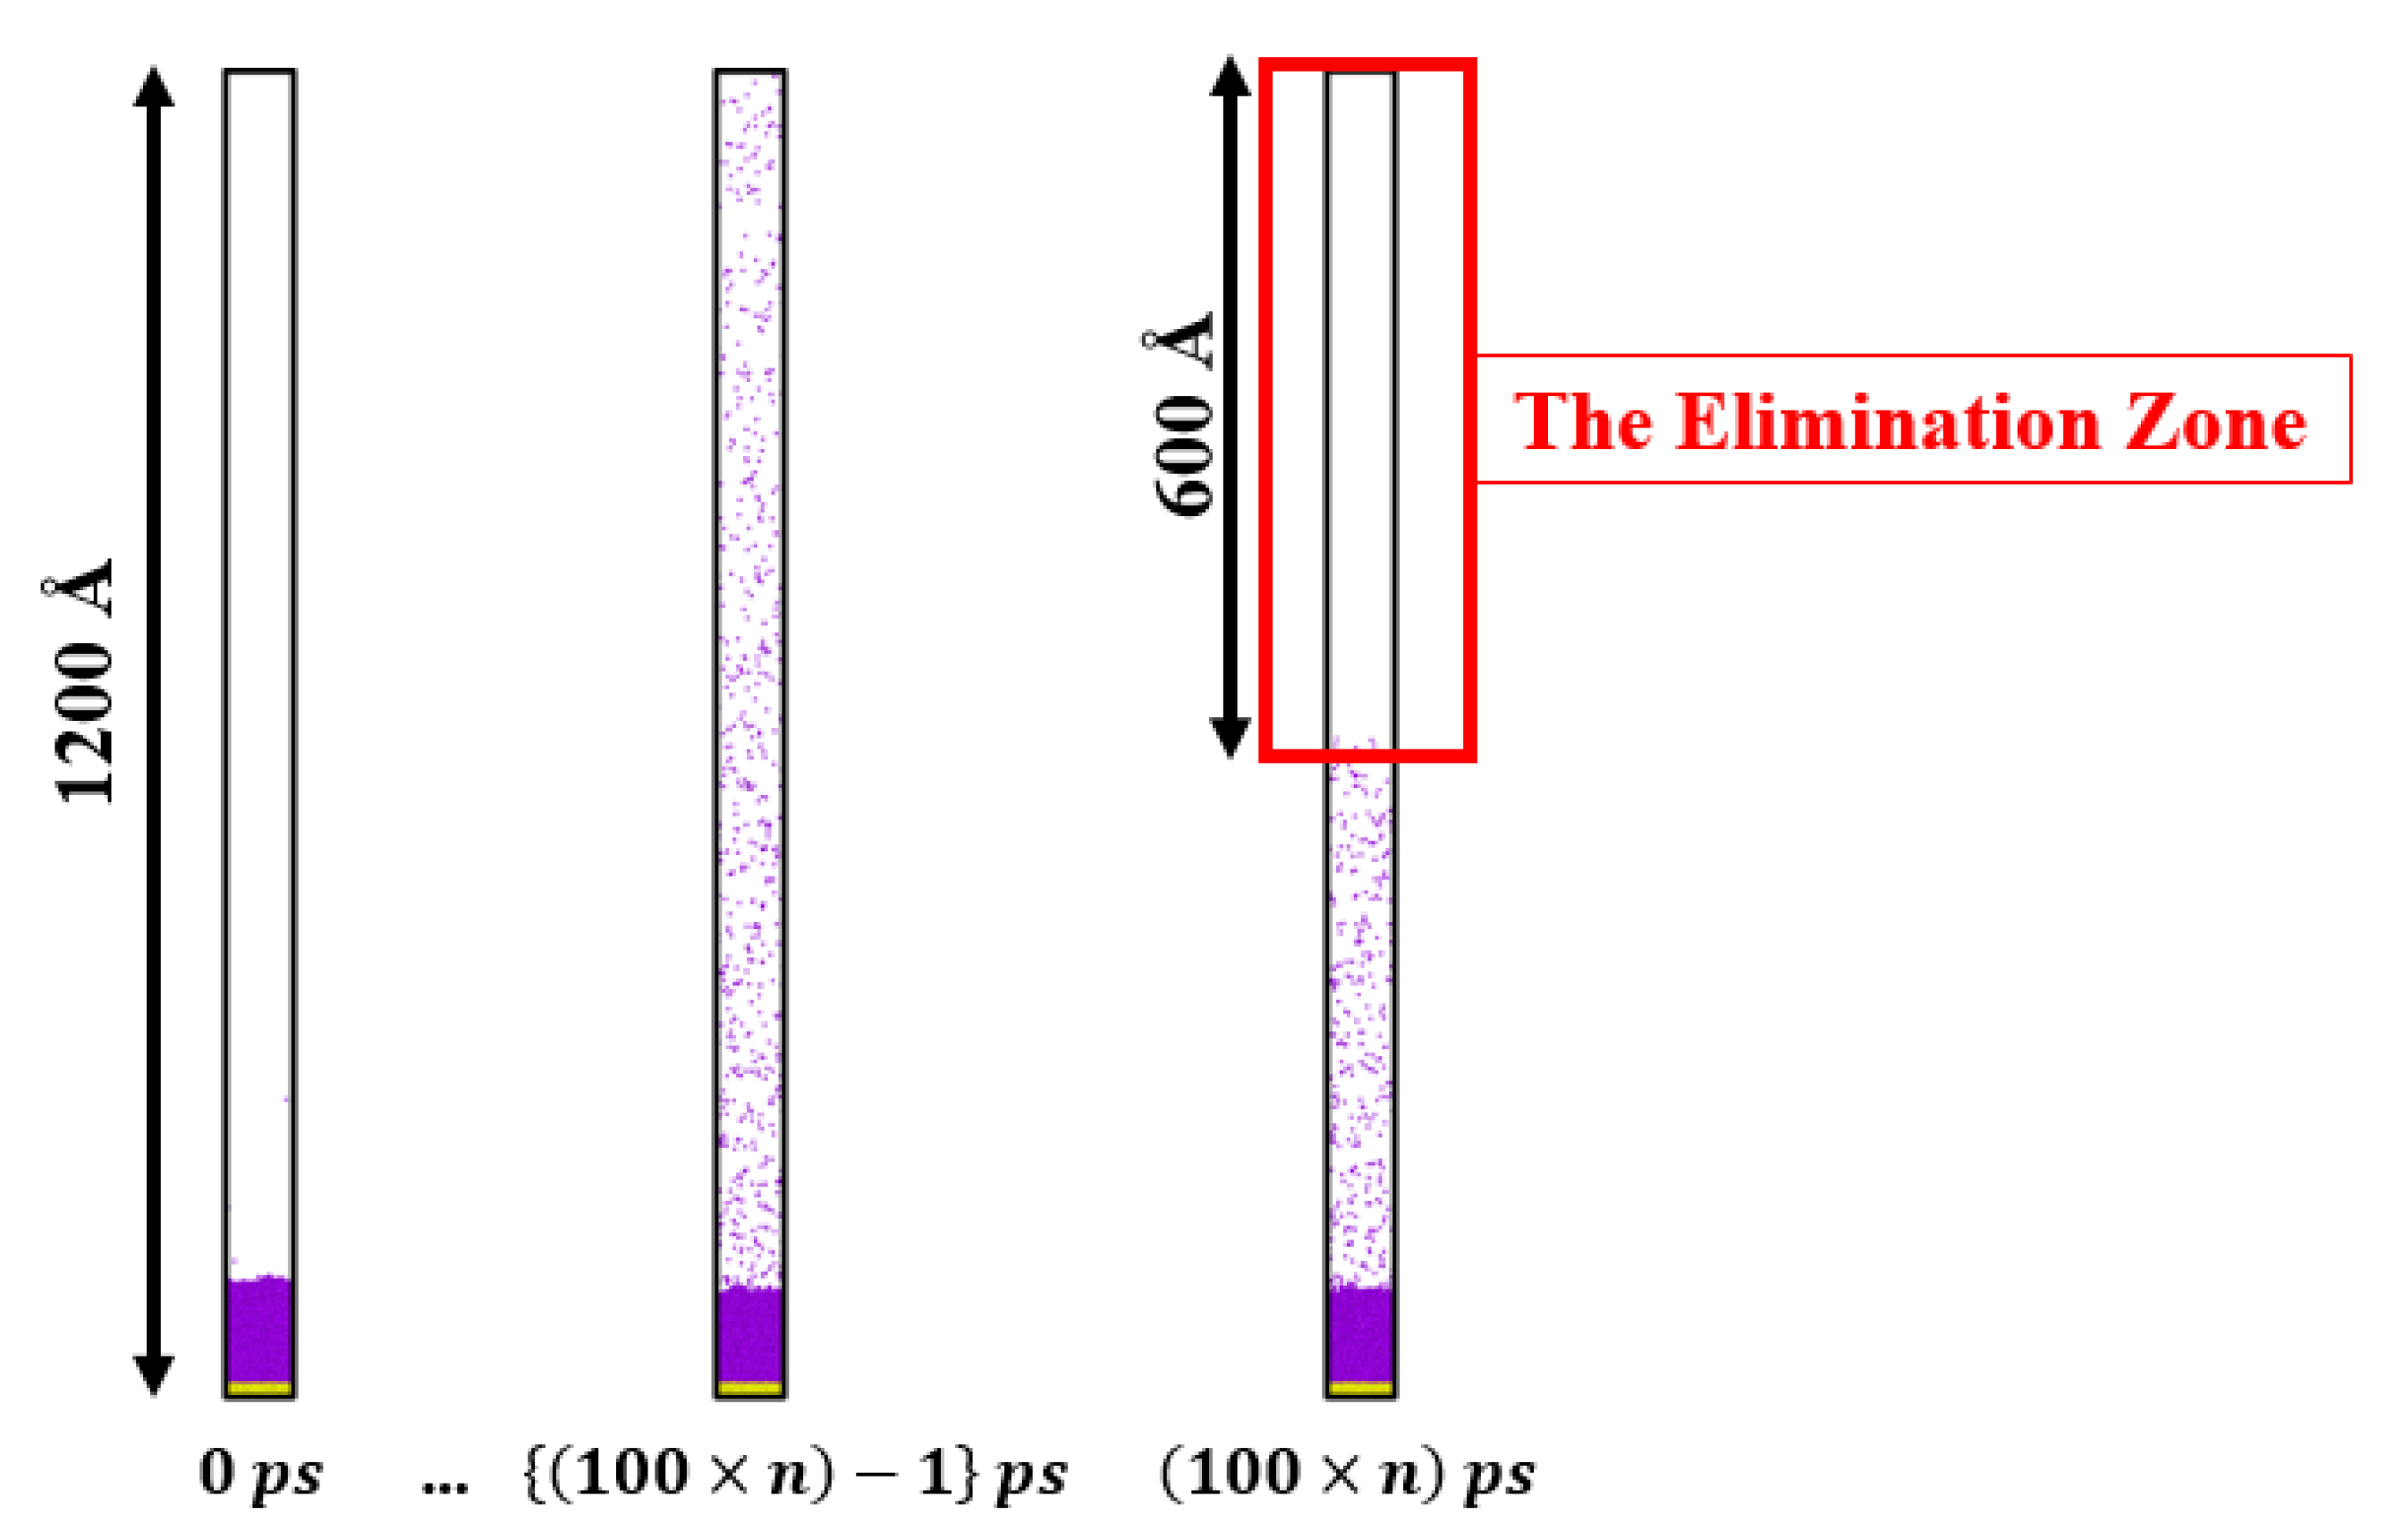
The details of the simulation boxes are shown in Figure 2a, which were composed of a Au solid surface and a Na liquid film. The dimensions of the simulation boxes in the X and Y directions were 40.78 Å and 61.17 Å, respectively. These dimension values were chosen to be large enough (larger than two times the cutoff radius (10 Å)) to maintain the minimum image convention. The dimension in the Z direction was 1200.00 Å. What is more, all directions were subjected to periodic boundary conditions, with the exception of the Z direction, where non-periodic boundary conditions were applied. It should be noted that, in order to simulate the evaporator section of WHPs, an elimination zone was defined at the upper part of the simulation boxes (from 600.00 to 1200.00 Å), where the vapor atoms were deleted every 100 ps, as schematically illustrated in Figure 3.
As depicted in Figure 2a, to analyze the effect of the random rough surface on the liquid–vapor phase transition, the ideally Au smooth surface (surface A) and the random rough Au surface (surface B) fabricated in the previous section were employed as the solid substrates and placed at the bottom of the simulation boxes (along the Z direction). As illustrated in Figure 2b, the solid substrates were divided into three regions: a fixed region, a heating region, and a conduction region. To guarantee that the solid substrates stayed fixed in their location through the entire simulation process, the outermost monolayers of them (the fixed region) were fixed at their lattice sites. It should be noted that the other Au monolayers and atoms (the heating and conduction regions) were permitted to undergo unrestricted oscillation. Additionally, the immediately following two Au monolayers were set as the heating region in order to sustain the intended wall temperature and operate as the heat source during MD simulations. Also, the conduction region transferred heat from the heating region to the liquid film.
An ultra-thin Na liquid film of 12 nm thickness (containing 7207 Na atoms), which corresponds to the density of 0.92 g/cm3 at 400 K [43], was used as an initial liquid film and placed on the solid substrates. However, as depicted in Figure 2c, the initial liquid film and solid substrates were separated by an initial distance (minimum of 3.98 Å) in order to prevent nearby atoms from being subjected to an unphysically strong force.
Figure 2d displays the main four steps of the simulation protocol: relaxation, equilibrium, thickness regulation, and phase transition. At the start of the relaxation step (the first step), the entire system (including both the solid substrate and initial liquid film) was given the opportunity to relax via energy minimization. After energy minimization, the whole system was equilibrated with the Nose–Hoover thermostat at a uniform temperature of 400 K (a little higher than the Na melting point (371 K) [44]) in the NVT ensemble for 1,000,000 steps (1000 ps). In the second step (equilibrium), the thermostat was disconnected from the Na atoms, and an NVE ensemble was imposed on them for 500,000 time steps (500 ps). Meanwhile, the solid substrate was still kept in the NVT ensemble. In the third step (thickness regulation), the liquid film’s height was adjusted to 1–9 nm by eliminating extra Na atoms. In the fourth step (phase transition), the thermostat was disconnected from the conduction region, and the temperature of the heating region was suddenly increased to 600–1000 K, and non-equilibrium MD simulations ran for four million steps (4 ns).
The Lorentz combination rule [40] was employed to calculate the length parameter between Au and Na atoms, expressed in Equation (4):
σ Au-Na = σ Au-Au + σ Na-Na 2 = 2.9385   Å
In addition, the energy parameter between Au and Na atoms was defined by ε Au-Na = α   ε Au ε Na based on a revised version of the Berthelot rule suggested by Din and Michaelides [45], where α is the potential energy factor that could be applied to modify the solid surface wettability. In the present work, informed by the results in Ref. [27], only the strong hydrophilicity ( α = 1 ) was considered. Based on the above Au-Na energy parameters, the contact angle of Na atoms on an ideally smooth Au surface is around 0° (see Ref. [27] for more details). Based on the results obtained by Refs. [26,27], the aforementioned interatomic potential parameters show good agreement with available experimental data. The interatomic potential parameters related to the 12-6 L-J for Na and Au interactions are tabulated in Table 3.
As mentioned previously, the liquid–vapor phase transition behavior of Na liquid film of nine film thicknesses (1–9 nm) over two different Au surfaces with five different heating region temperatures (600, 700, 800, 900, and 1000 K) was studied. For convenience of reference, the simulation cases were labeled using three parts: the first part of the case name indicates the surface (A: ideally smooth surface; B: random rough surface), the second part indicates the thickness of liquid film (1–9 nm), and the third part presents the temperature of the heating region (solid substrate temperature). For instance, the simulation case B3-600 represents a simulation box with the random rough surface and a liquid film thickness of 3 nm, which in the solid substrate was heated to 600 K.

3. Result and Discussion

Using the aforementioned simulation boxes and procedure, the liquid–vapor phase transition regime of adsorbed Na liquid films with different thicknesses of 1 nm to 9 nm on heated ideally smooth and random rough Au solid surfaces under various values of substrate temperatures (ranging from 600 K to 1000 K) is analyzed in this section.

3.1. Overview of Phase Transition Regimes

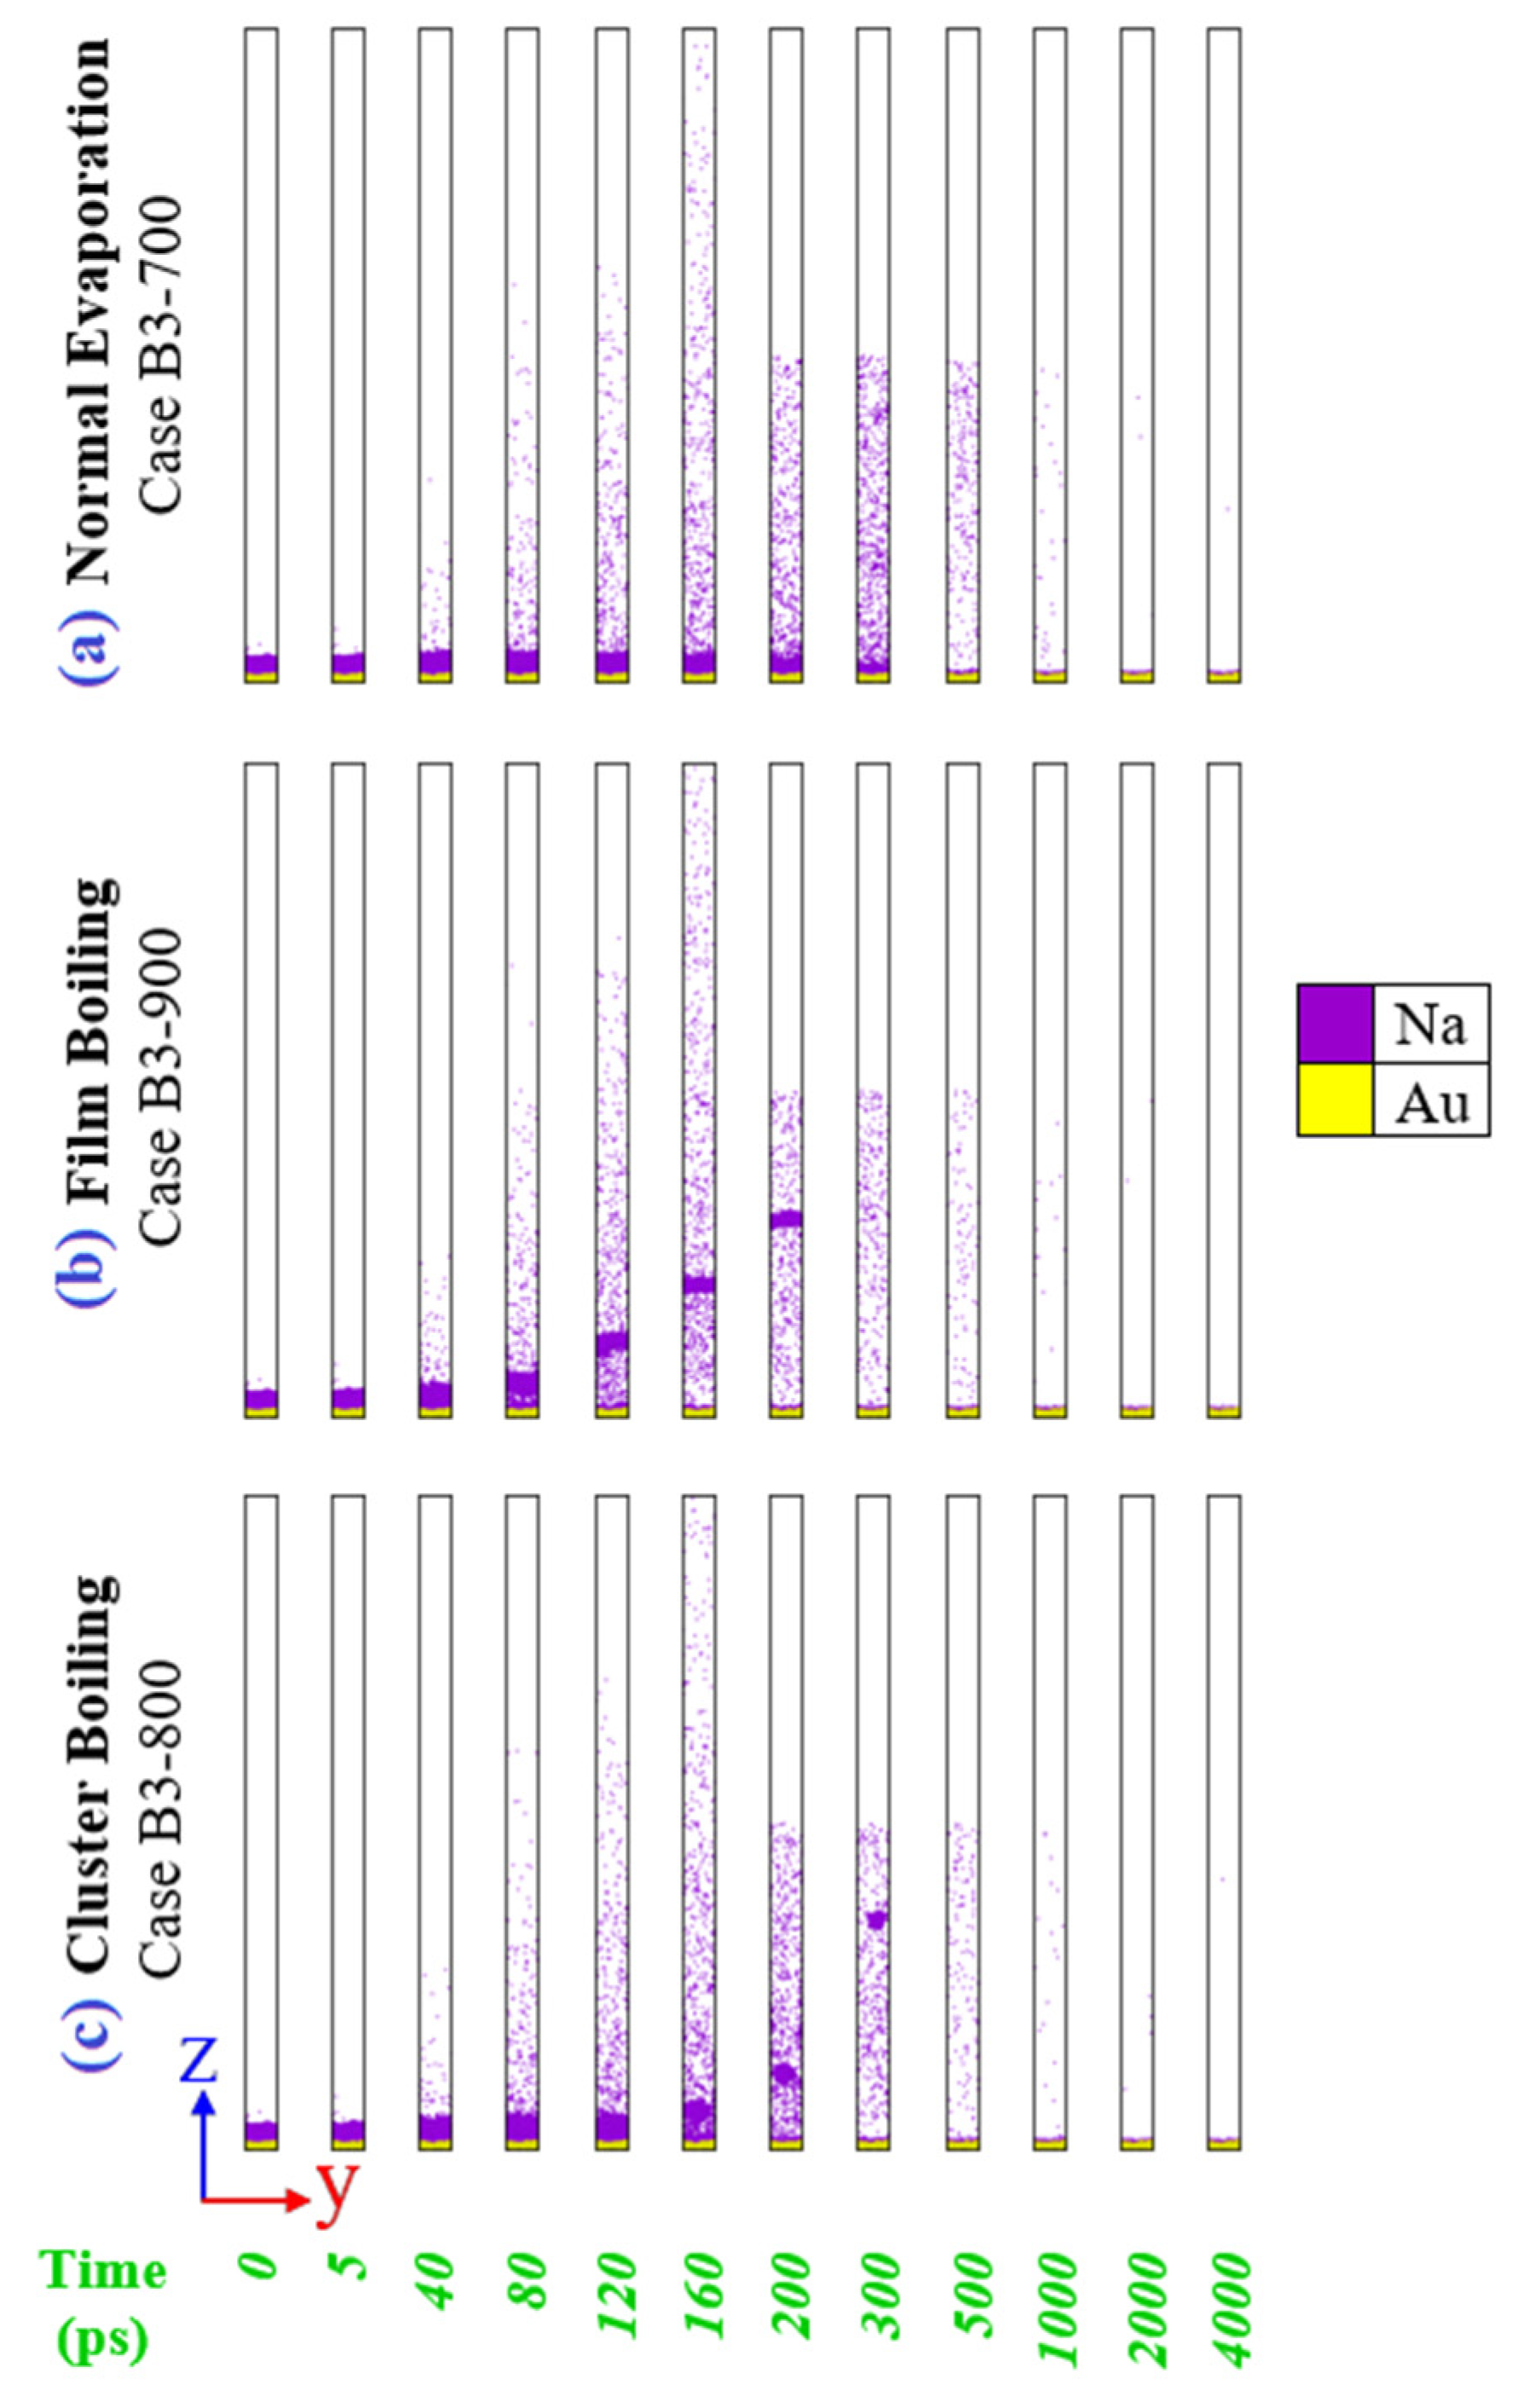
According to the obtained results, phase transition regimes have been classified into three categories and named: normal evaporation, film boiling, and cluster boiling. In order to explain the underlying internal mechanisms of normal evaporation, film boiling, and cluster boiling, three cases, including Cases B3-700, B3-900, and B3-800, are selected, respectively. Figure 4 illustrates the captured snapshots of the trajectory of atoms during normal evaporation (Case B3-700), film boiling (Case B3-900), and cluster boiling (Case B3-800) at 0, 5, 40, 80, 120, 160, 200, 300, 500, 1000, 2000, and 4000 ps. It should be noted that these instants at limited selected times are taken in order to indicate differences between the phase transition regimes.
To have a better perspective on different phase transition regimes, their mass density (Dens) distributions are shown in Figure 5. To show the contour plots more clearly, the view of the Y-Z plane with a height of 153 Å, which is higher than the liquid–vapor interface in all cases, was chosen. As can be seen in Figure 5a, in normal evaporation, the liquid film thickness steadily decreases as liquid atoms and droplets separate from the liquid film and reach the vapor space, as has been shown in Figure 4a. It should be noted that the density of liquid droplets is much lower than that of the liquid phase. In film boiling, a vapor layer forms inside the liquid film, which pushes the upper liquid atoms upward as a liquid slug, as shown in Figure 5b. Cluster boiling is a transition regime between normal evaporation and film boiling, in which the liquid atoms leave the liquid film neither in the form of an individual atom or droplet (observed in normal evaporation) nor in the form of a liquid slug (observed in film boiling). In fact, cluster boiling is defined by liquid atoms leaving the liquid film in a liquid cluster form that consists of a limited number of atoms, even though it could show high value density (more than half of the density of the liquid phase [46] (0.46 g/cm3 at 400 K [43])) in its core, as depicted in Figure 5c. Then, the liquid cluster gradually disintegrates into the vapor space, as indicated in Figure 4c.
Figure 6 displays the phase transition diagrams for the ideally smooth surface (surface A) and the random rough surface (surface B). The roman numerals inside the green cells show the different normal evaporation modes, which will be discussed in detail in Section 3.4. The results presented in Figure 6 illustrate the relationship between the phase change regime and the solid surface roughness, solid substrate temperature, and liquid film thickness. For simulation systems with a liquid film thickness value of 1 nm, neither changing the substrate temperature nor surface roughness can change the phase transition regime, and only normal evaporation can be observed. For simulation systems with a liquid film thickness value of 2 nm, increasing the substrate temperature shifts the phase transition regime from normal evaporation to cluster boiling. Moreover, for simulation systems with a liquid film thickness value of 3 nm, increasing the substrate temperature turns the phase transition regime from normal evaporation to cluster boiling and finally into film boiling. In addition, for simulation systems with a liquid film thickness of 4–9 nm, increasing the substrate temperature changes the phase transition regime from normal evaporation to film boiling. Even though the dependency of the mode of phase transition on the liquid film thickness has been reported in very few previous studies [47,48,49], the presented data show that the introduction of the random rough surface could also change the phase transition regime (for a particular simulation system: Case B2-800; highlighted with a black box in Figure 6), which will be thoroughly discussed in the subsequent subsection.

3.2. Transition from Normal Evaporation to Cluster/Film Boiling

In this subsection, the comparison between normal evaporation and boiling is first conducted in detail. Then, the reason why changing the surface roughness from Case A2-800 to Case B2-800 resulted in different phase transition regime is explained.
Figure 7a–c show the temperature (Temp), kinetic energy (KE), potential energy (PE), total energy (TE, which is the sum of KE and PE), and Dens distributions for Cases B3-700, B3-900, and B3-800 at the start of the non-equilibrium liquid–vapor phase transition simulation (at 5 ps). As presented in Figure 7d, Na liquid film atoms are defined into two zones, which include the near-wall zone and the adjacent zone, and two layers, namely the liquid–vapor interface and the solid–liquid interface.
As can be seen in Figure 7a–c, Dens distributions in the liquid film for all cases at the start of the non-equilibrium phase transition (at 5 ps) are nearly uniform and similar, with the exception of some slight and random localized variations, which are impossible to avoid in MD studies and real liquids. However, it should be emphasized that the density of liquid at solid–liquid interfaces is significantly low. This can be attributed to the presence of a few fluid atoms on the solid surface due to the random rough structure. Moreover, due to the robust intermolecular forces between solid substrate and liquid film atoms, the solid–liquid interface atoms experience large attractive forces, which results in lower PE than their upper atoms. Furthermore, applying high solid substrate temperatures causes a rapid and immediate sharp increase in Temp and KE in their adjacent zone. In addition, it is worth stressing that all cases show a higher PE and TE (close to 0 eV) and lower Dens at the liquid–vapor interfaces. The reason for that is that the Na liquid atoms at the liquid–vapor interface do not experience any attractive forces from the vacuum above.
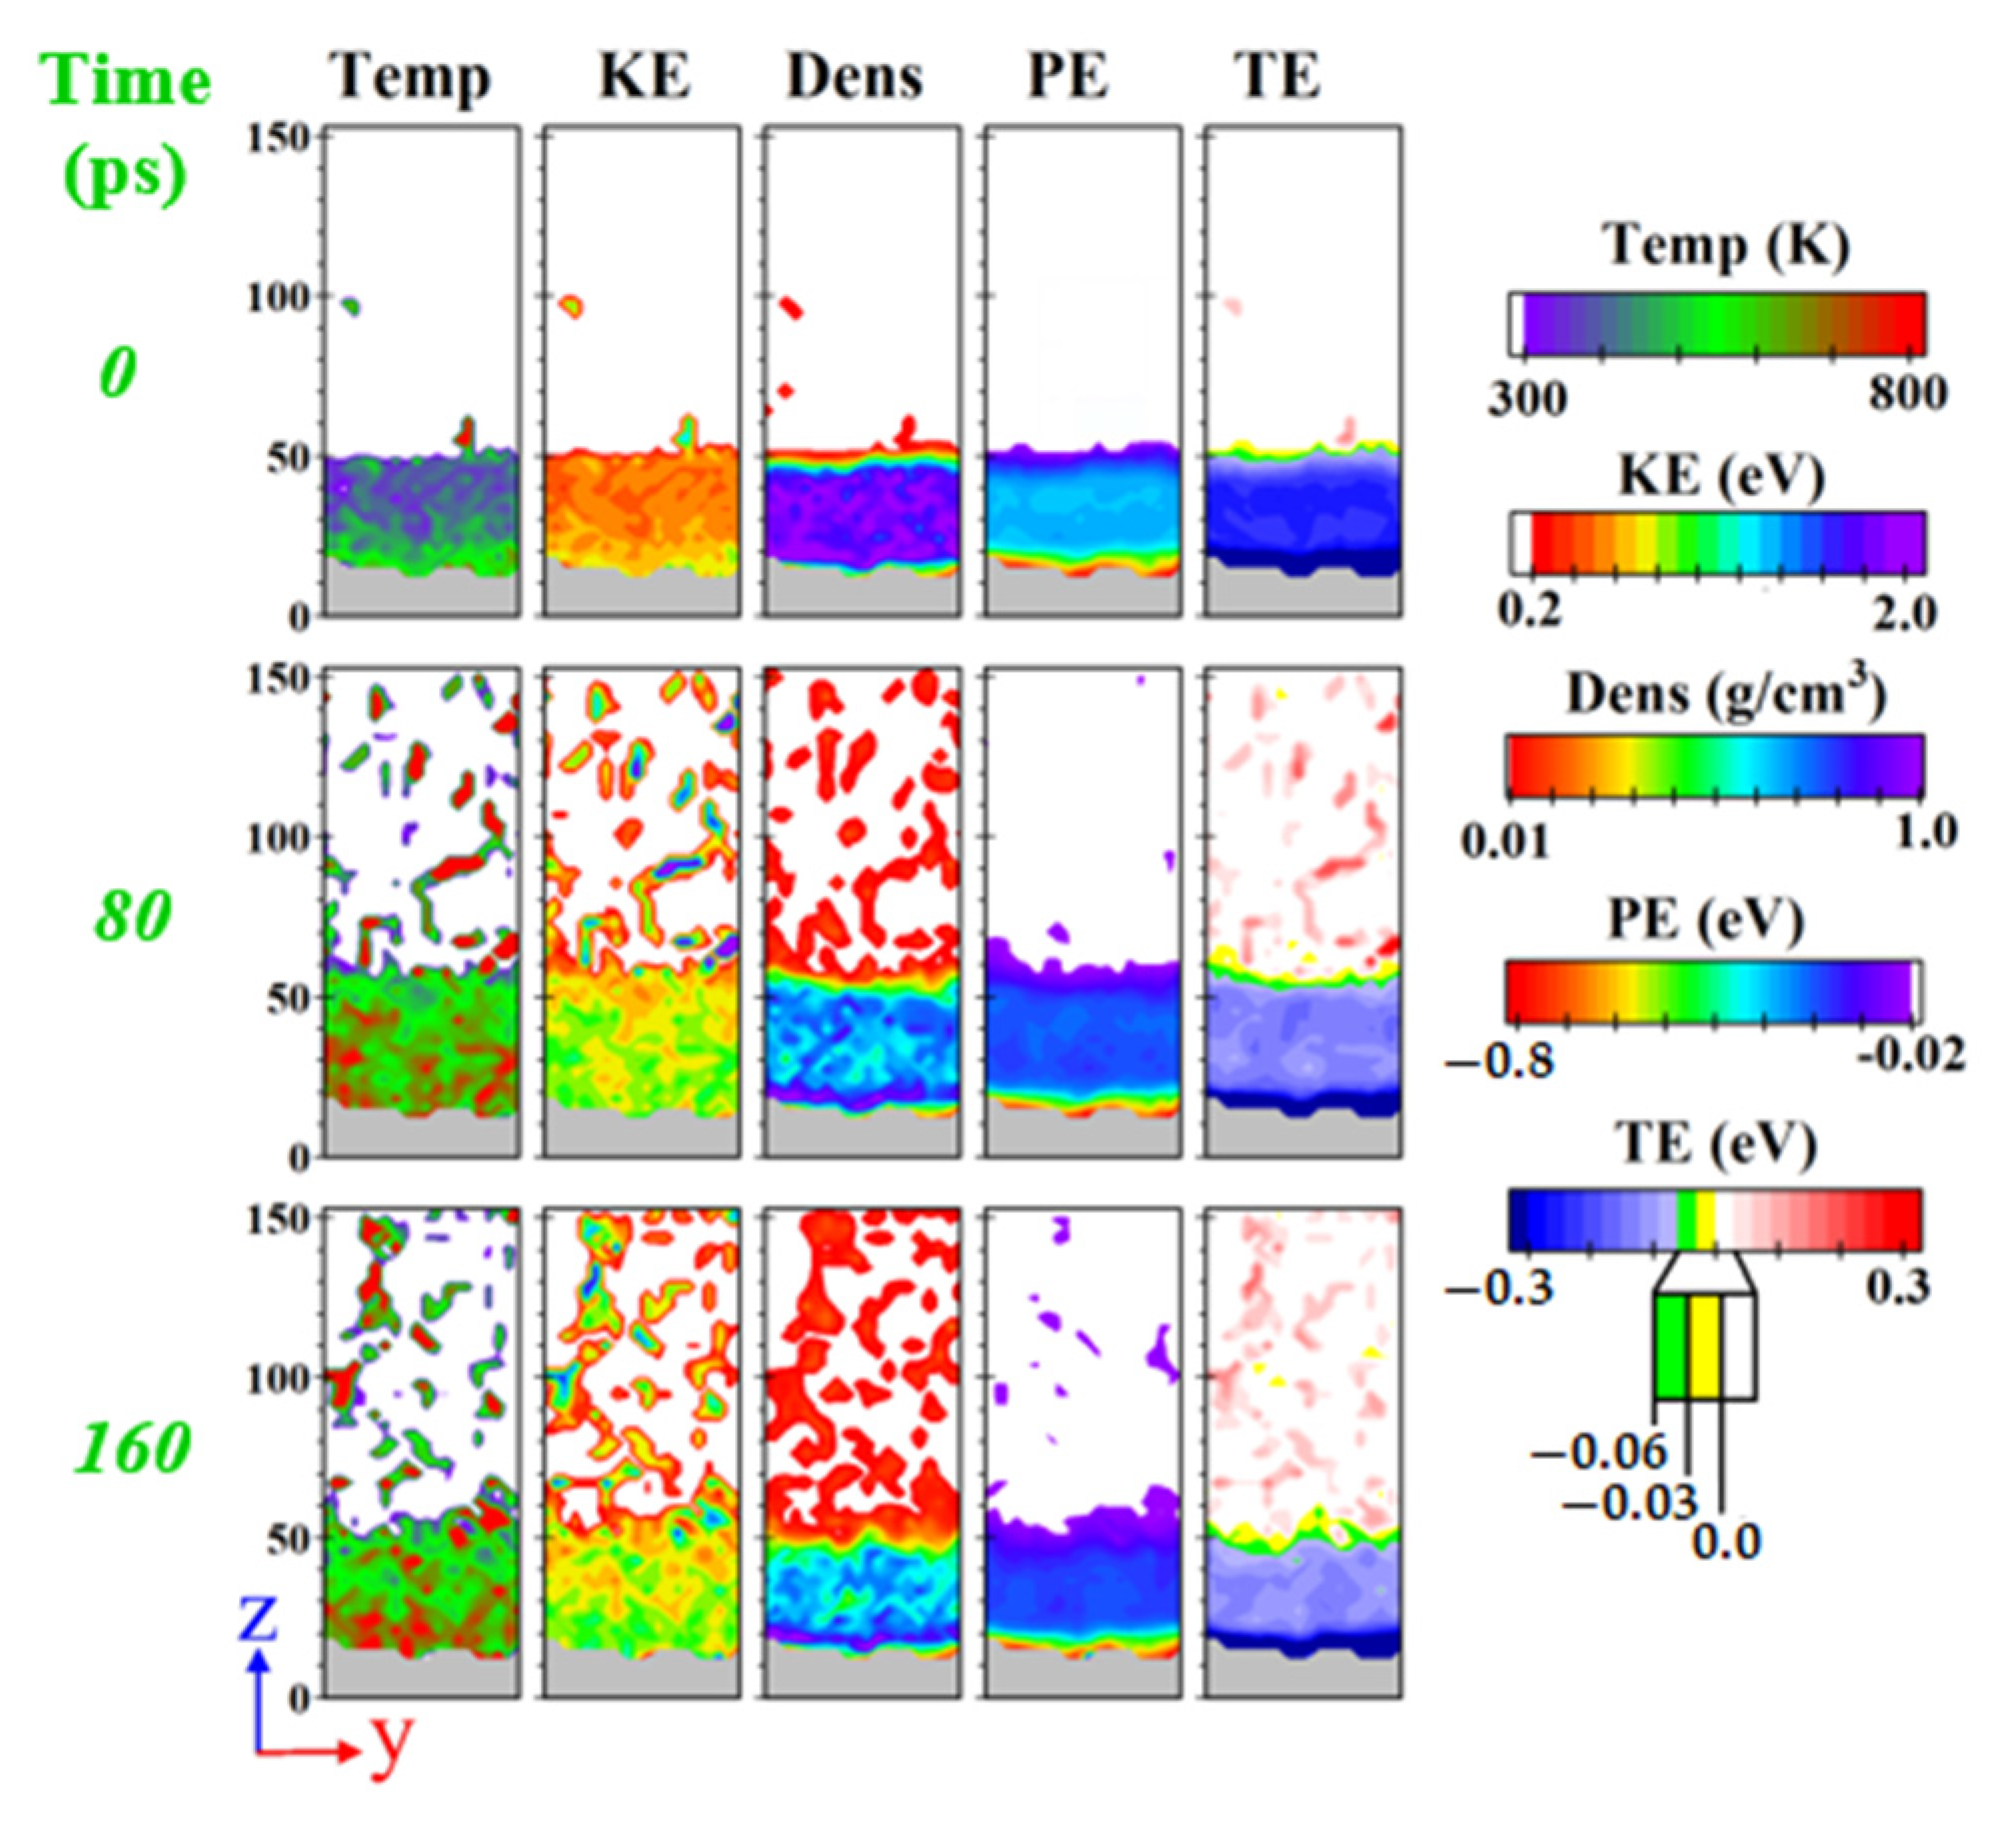
Figure 8 shows the Temp, KE, Dens, PE, and TE distributions for Case B3-700 (normal evaporation) and three representative time instants, namely 0 ps (initial time), 80 ps, and 160 ps. As time goes on, the liquid film absorbs more and more thermal energy from the heated solid substrate through the solid–liquid interface. The absorbed thermal energy is transformed into atomic kinetic energy, resulting in a considerable enhancement in the KE, which promotes the high excitation of Na atoms; hence, thermal expansion occurs in the liquid film, which makes the local mass density constantly and gradually decrease. Hence, decreasing the local mass density can effectively increase the distance between the Na atoms, resulting in a continuous increase in PE, according to Equation (2). Note that the same behavior was also observed for Cases B3-900 (film boiling) and B3-800 (cluster boiling).
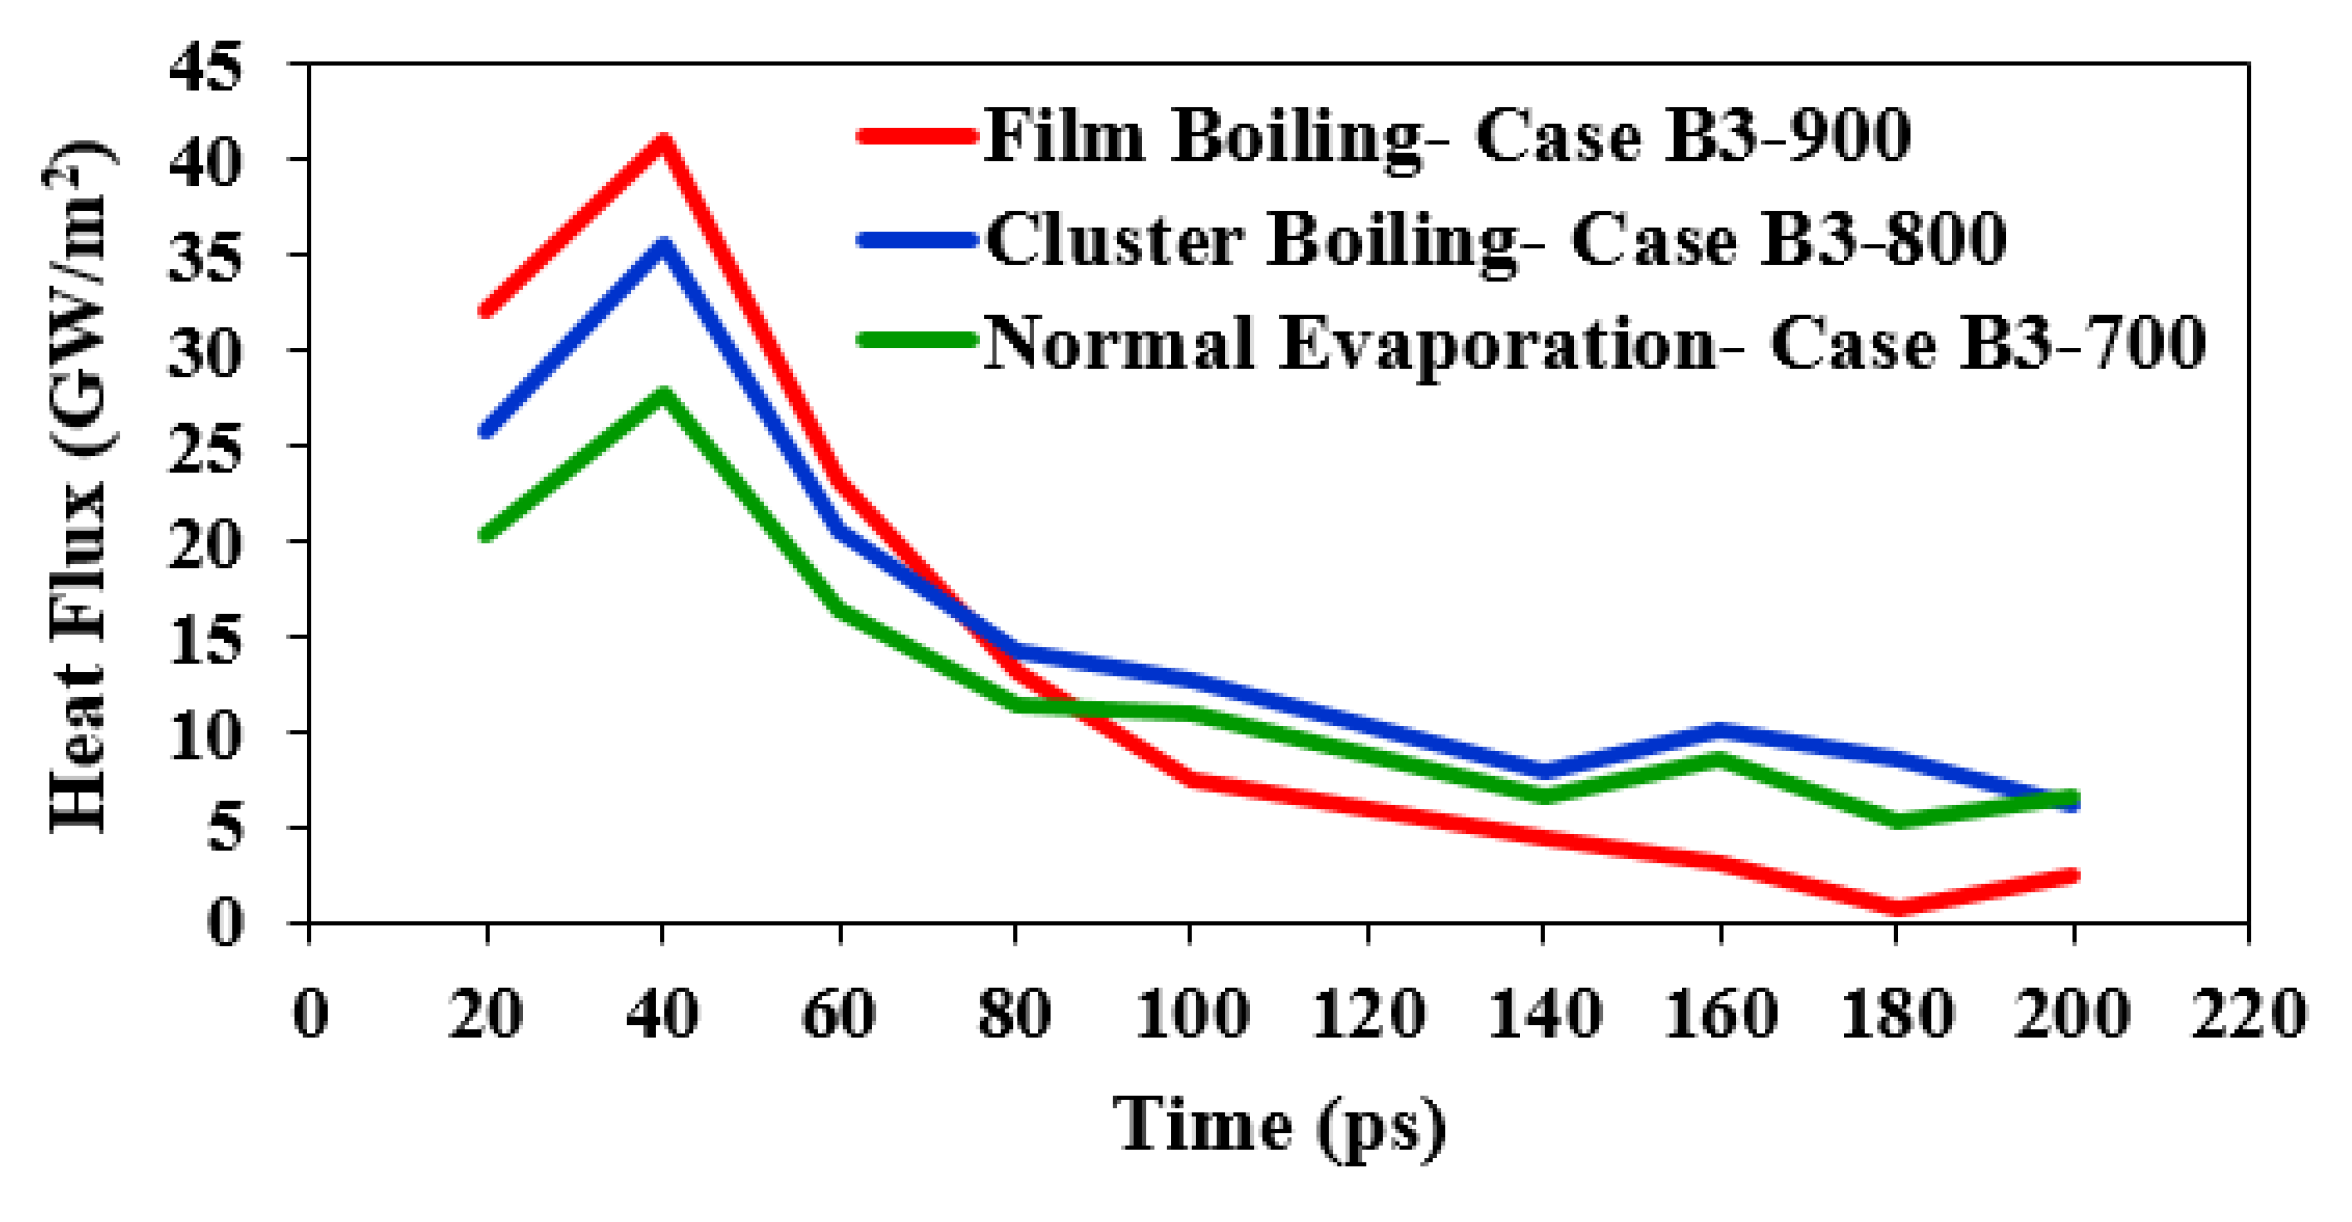
In Figure 9, the heat flux exchanged between the solid substrate and the fluid at the solid–liquid interface is shown as a function of time for three meaningful cases, namely, Case B3-900, Case B3-800, and Case B3-700. Specifically, the heat flux is here defined as the total energy increment of Na atoms over the surface area reflected on the X-Y plane per unit time [18]. During the first instants of the simulation, the heat flux plots present a peak for all the considered cases, probably due to higher temperature difference between the solid substrate and the adjacent zone. To note, higher substrate temperature results in higher exchanged heat fluxes. The heat flux therefore decreases as soon as the simulation proceeds, i.e., the fluid layers progressively approach the substrate temperature. It has to be pointed out that such a decreasing trend is more pronounced for Case B3-900 (film boiling). This is probably due to the fact that, for this phase transition regime, the formation of a thick vapor layer (with low thermal conductivity) at the near-wall zone strongly hampers heat transfer between the substrate and the fluid.
A higher heat flux can help the liquid film absorb more thermal energy from the solid substrate and exhibit a higher KE and PE. Consequently, as can be seen by the comparison of TE distributions for normal evaporation (shown in Figure 8) and film and cluster boiling (shown in Figure 10), a higher heat flux for film and cluster boiling can increase the TE of the liquid film to much higher values than those for normal evaporation. It is interesting that the collision thermal resistance of the liquid film slows the dissipation of absorbed thermal energy from the near-wall zones to the upper atoms, which could lead to the accumulation of TE, especially in the near-wall zone in cases with a high solid substrate temperature (Cases B3-800 and B3-900).
As shown in Figure 10, it is evident from the TE distribution that for Cases B3-900 and B3-800, a distinct group of Na liquid atoms inside the near-wall zones acquire a TE greater than −0.06 eV (green parts on the plots) in a short time (at 40 ps and 60 ps, respectively). As time evolves, the TE reaches higher values and exceeds −0.03 eV (yellow parts on the plots) at 45 ps and 70 ps for Cases B3-900 and B3-800, respectively. From a nanoscale point of view, it is well known that the liquid–vapor phase transition occurs when the KE (which is always positive) overcomes the PE barrier (which is always negative). In other words, when the TE of Na atoms exceeds 0 eV, Na atoms will experience a liquid–vapor phase change. As shown in Figure 10, it is evident from the TE distributions for Cases B3-900 and B3-800 that small vapor cavities (white parts on the plots at 55 ps and 80 ps, respectively) begin to appear, resulting in the development of a layer of vapor. The vapor layer developed during boiling pushes away a liquid slug or cluster from the solid surface.
On the other hand, as seen in Figure 8, for Case B3-700, even though the TE distribution inside its near-wall zone is not perfectly uniform and unchanged with time, its value is always negative (less than 0 eV). It can be inferred that, with the low value of absorbed thermal energy, the Na liquid atoms cannot get enough thermal energy to increase their KE to break their PE barrier. And this is why a low substrate temperature inhibits the occurrence of cluster and film boiling and causes normal evaporation. According to the obtained results, it can be summarized that if the Na atoms inside the near-wall zone could obtain enough thermal energy from the heated solid substrates such that their TE exceeds 0 eV, they would convert into a vapor layer that would insulate either a liquid slug or liquid cluster from the solid surface after a particular period of time.
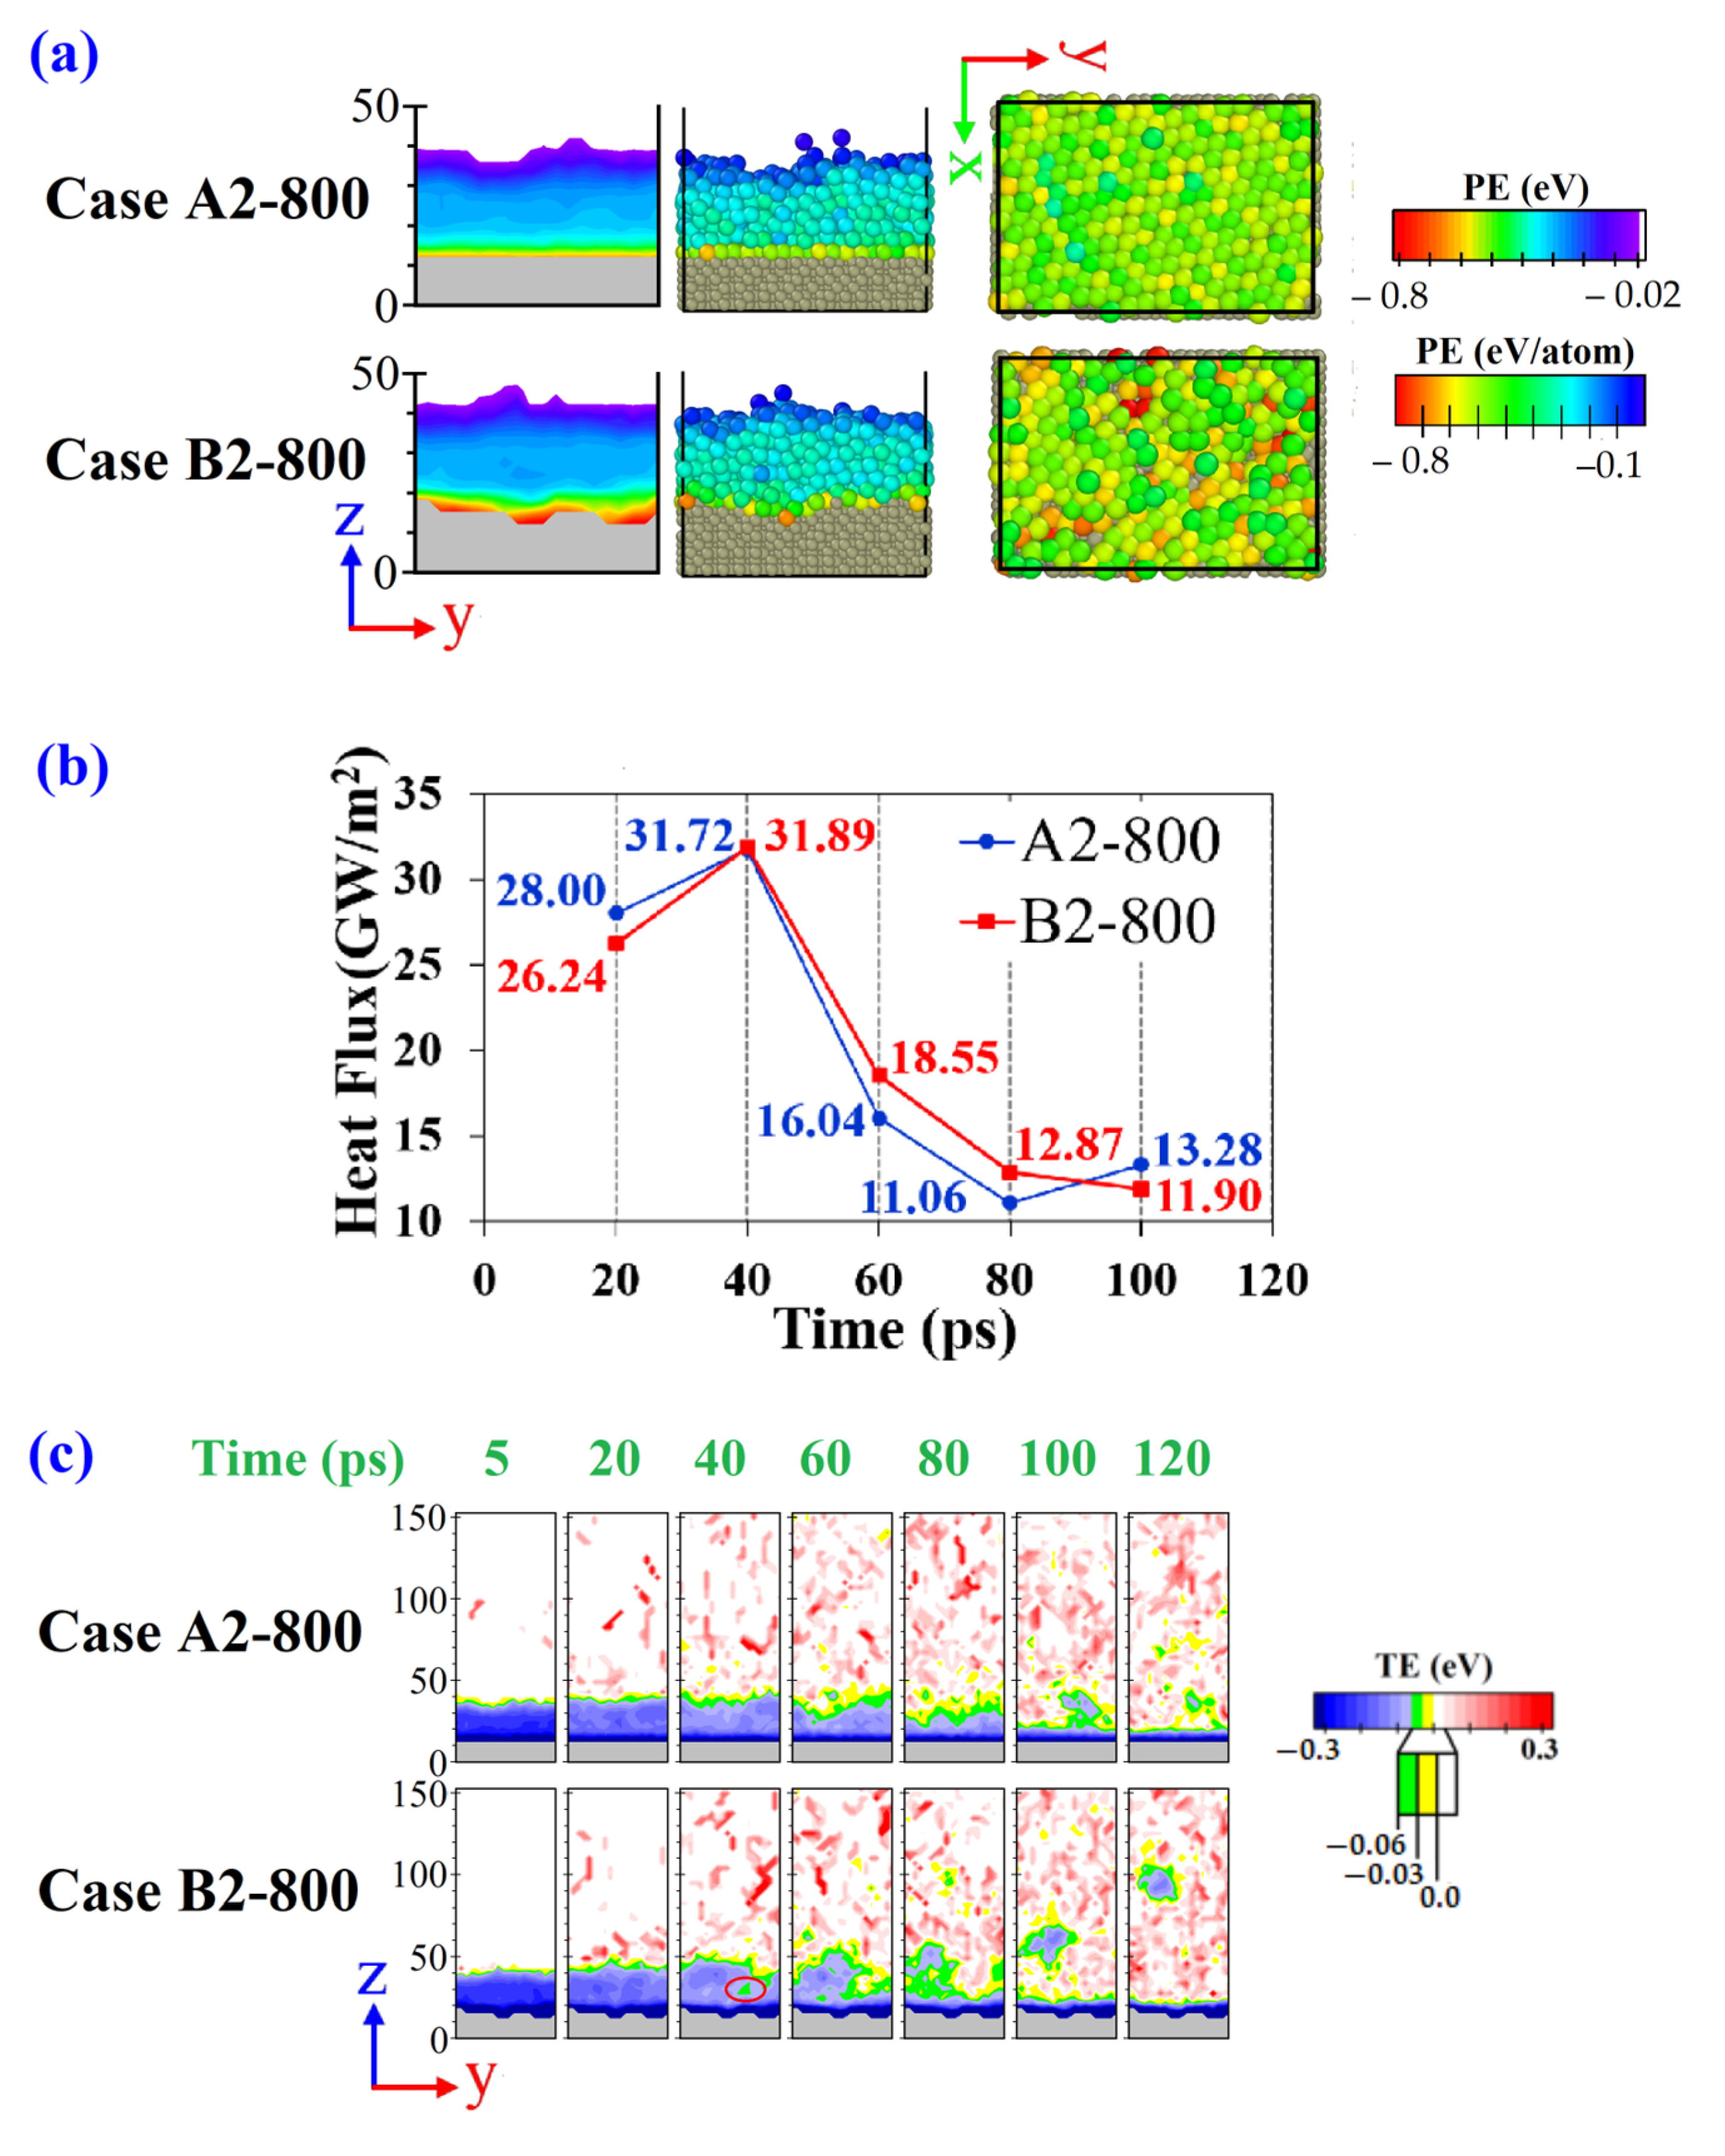
In the previous results, the impact of the substrate temperature on the phase transition regime was demonstrated. However, to clearly and fully understand the liquid–vapor phase transition diagrams, in the following text, the impact of the random rough surface on the liquid phase transition regime is explained briefly. As previously stated, the results confirm that for a liquid film with the same thickness of 2 nm and the same solid substrate temperature of 800 K, by changing the ideally smooth surface (Case A2-800) to a random rough surface (Case B2-800), the phase transition regime switched from normal evaporation to cluster boiling. Based on the magnified picture of the contour plot and the calculated atomic distribution of PE, clarified in Figure 11a, using the random rough surface can remarkably improve the solid–liquid interactions. The stronger solid–liquid interaction results in greater energy transfer ability through the solid–liquid interface, thereby leading to a higher heat flux (demonstrated in Figure 11b). Therefore, the absorbed thermal energy coming from the solid substrate on the random rough surface is greater than that on the smooth surface at the same time. The fact that the random rough surface has the ability to absorb more thermal energy means that for Case B2-800, it would be easier to induce a higher TE (close to 0 eV) inside the liquid film compared to Case A2-800. Figure 11c denotes the comparison of the TE distributions for Cases A2-800 and B2-800. As indicated in the figure, the TE for Case B2-800 reaches a value of −0.06 eV inside the film liquid at 40 ps (red ellipse in figure). Therefore, Case B2-800, with a higher value of absorbed thermal energy, could finally induce cluster boiling. This agrees with the aforementioned conclusions in the prior subsection, which showed that a higher absorbed thermal energy is beneficial to the liquid film for boiling instead of normal evaporation. It should be noticed that the heat flux enhancement caused by the random rough surface is not significant (as shown in Figure 11b), mainly because of its low roughness ratio (=1.03). Therefore, the effect of the random rough surface on the liquid–vapor phase transition regime was limited in a very critical case (a liquid film thickness of 2 nm and a solid substrate temperature of 800 K).
Solomon et al. [3] demonstrated that WHPs with coated wicks exhibited lower evaporator thermal resistance compared to those without coating. However, because of the scale limitation, they were not able to clearly explain the valid reason behind this. They assumed that the enhanced surface areas of the wick were the cause of the nanoparticle coating’s reduction in thermal resistance. On the other hand, the nanoparticle coating might have reduced the evaporator’s resistance because it increased the capillary force due to the rough surface [50]. In other words, it is possible that the nanoparticle coating reduces heat transfer but improves wick capillarity, which are contradictory to each other. However, findings from the present MD study indicated that using a rough surface can remarkably improve solid–liquid interactions, consequently leading to higher heat fluxes.
Attractively, another interesting finding is that nucleate boiling is not observed in all simulation systems. According to the aforementioned explanations, as time grew, the density of the near-wall zones became lower and lower. Some parts change into a bubble nucleus and finally convert into a vapor layer, and either cluster or film boiling happens. Some MD simulation research conjectured that easily heating up an ultra-thin liquid film, which results in the violent movement of liquid atoms, cannot represent the classical nucleation theory [51], in which the initiation of nucleate boiling is defined based on the formation of localized regions of low density inside the liquid [52], and despite several attempts, whether nanofilm boiling agrees with the classical nucleation theory is a currently unresolved open issue. Moreover, some researchers (see Ref. [53], for example) speculated that when one distinct bubble nucleus forms within the liquid film, the enormous vapor pressure within the bubble nucleus will compress the surrounding liquid atoms, and due to the application of periodic boundary conditions (in the X and Y directions) in MD studies, the formation of a perfect distinct bubble nucleus and consequently nucleate boiling would be challenging. However, as observed in Figure 10, the generated bubble nucleus did not compress the surrounding atoms; hence, the mentioned speculation is not convincing enough, at least for the configuration used in this study. Nevertheless, according to the explanations given in the previous subsections, for an adsorbed liquid film on a superhydrophilic solid substrate, nucleate boiling at the reduced pressure is impossible because the pressure difference between the formed bubble nucleus and upper vapor space could push the liquid slug upward easily, creating a piston-like effect and finally leading to either cluster or film boiling. The configuration and characteristics of the MD simulations in this paper could be considered similar, to some extent, to the experimental investigation conducted by Hong et al. [54]. They experimentally studied evaporation and boiling on a copper particle sintered porous wick at reduced pressure inside a planar heat pipe (vapor chamber). The authors pointed out that, for a thin liquid film, bubble nucleation is not experimentally visible. Despite this, they mentioned that it may be attributed to the opaqueness of the wick material.

3.3. Transition from Cluster Boiling to Film Boiling

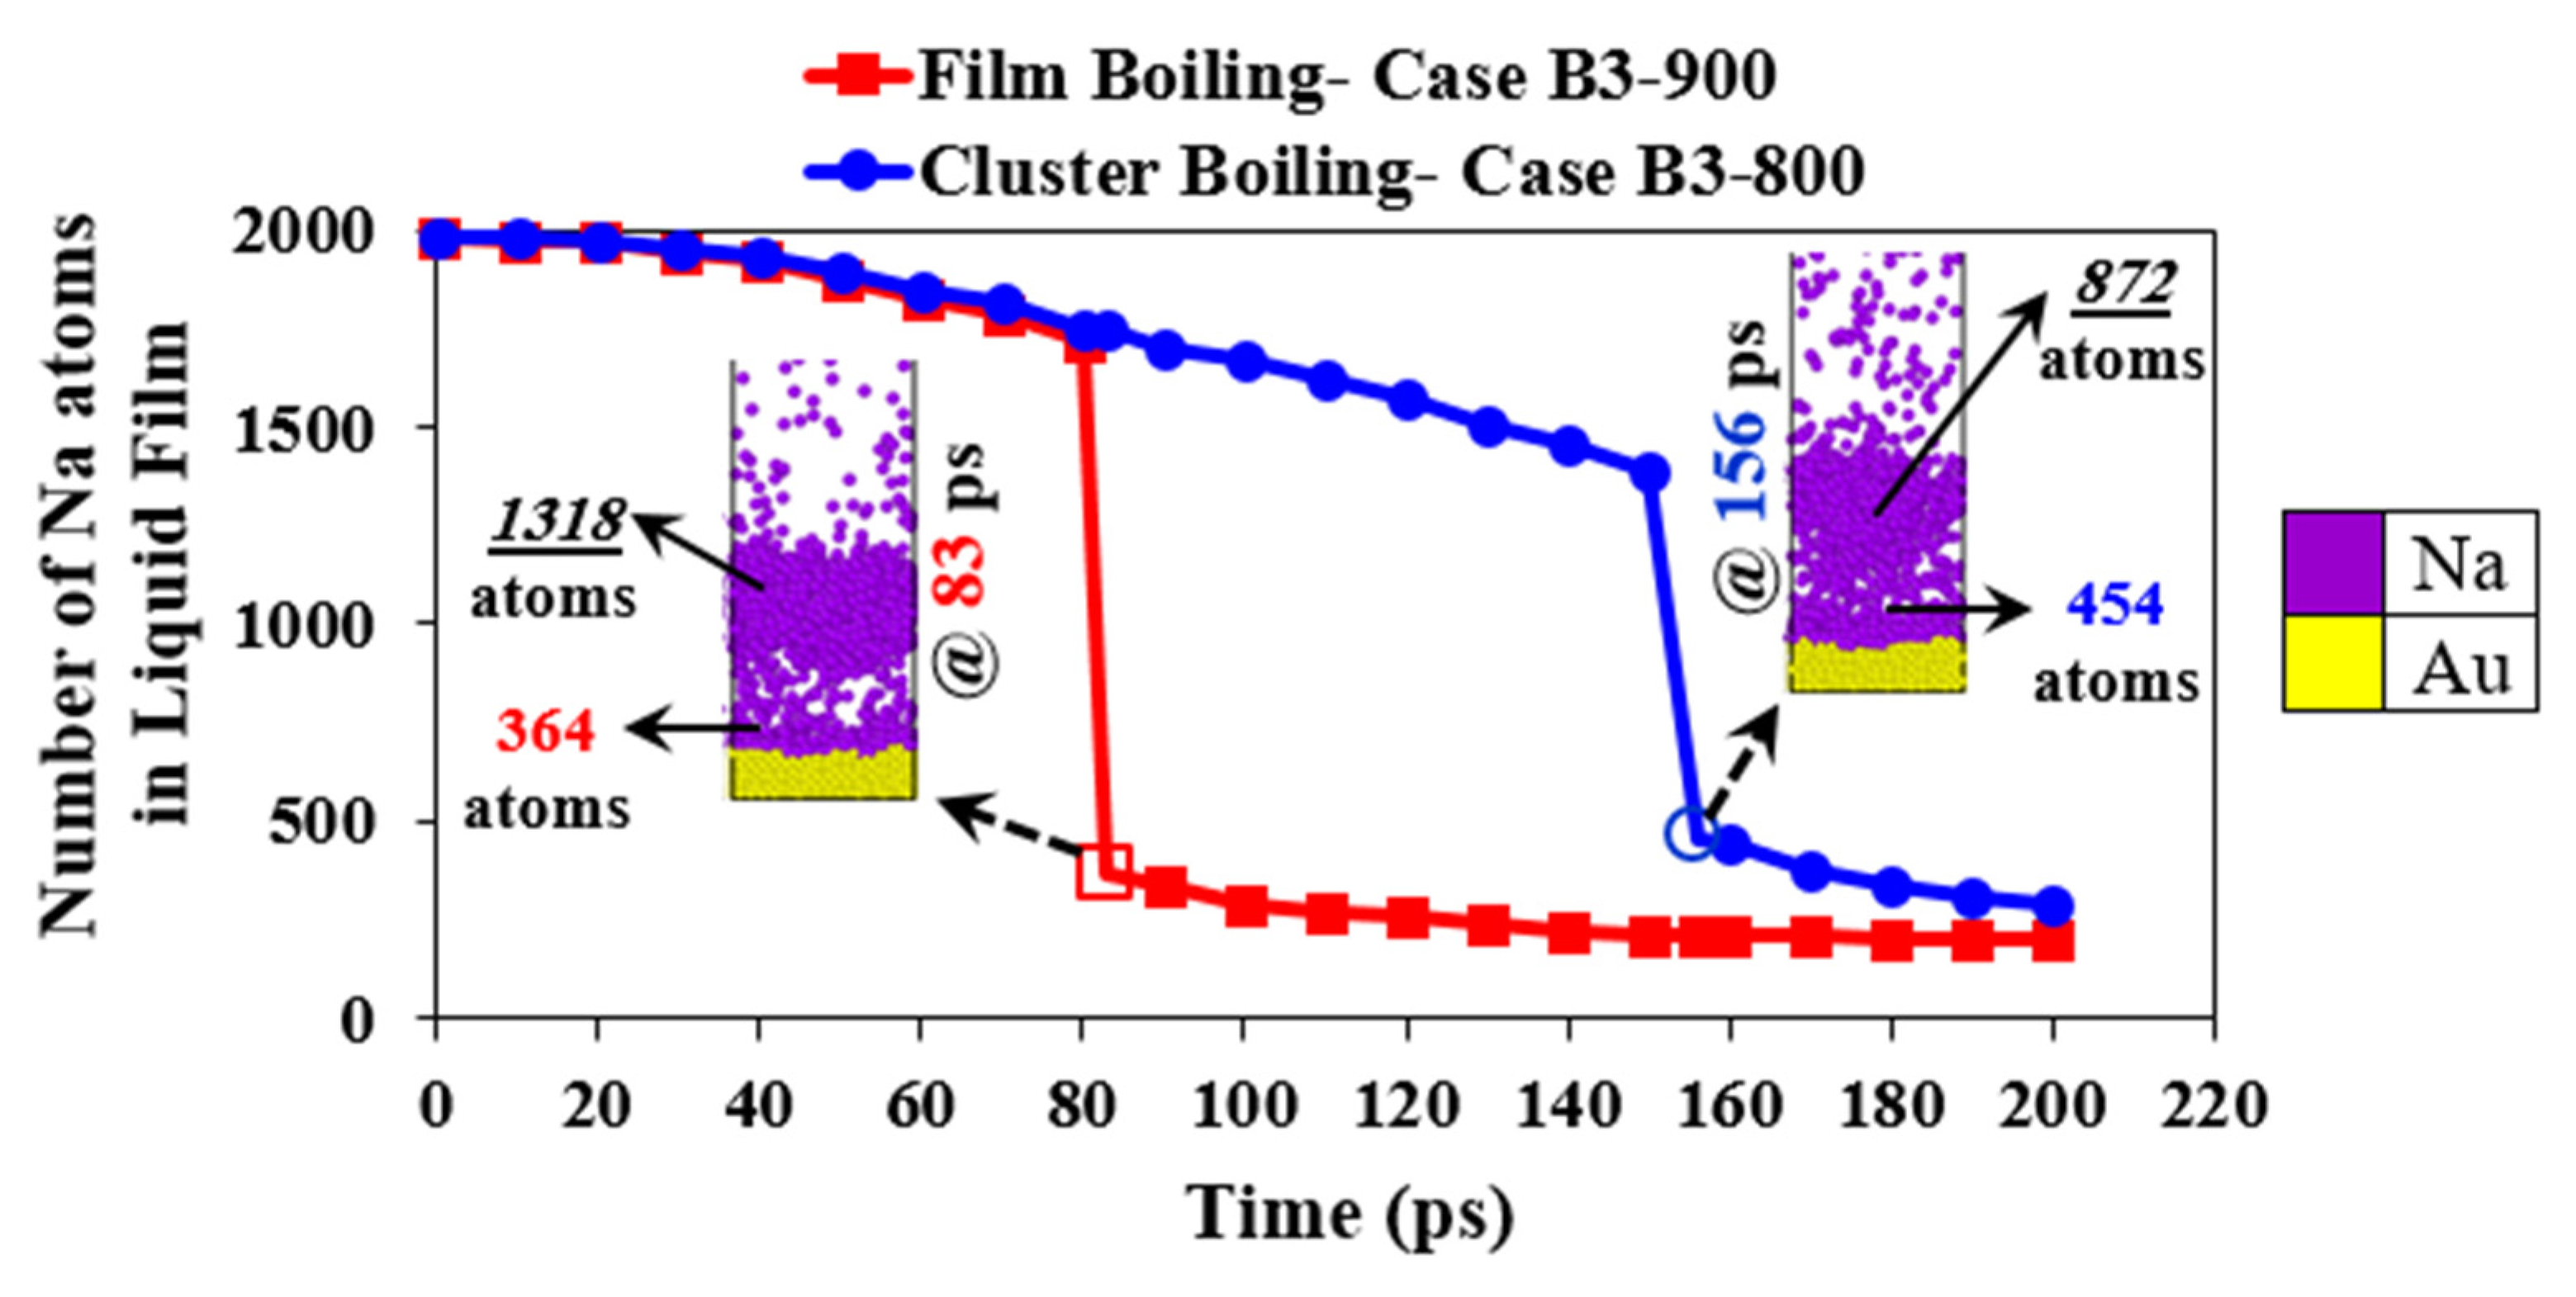
Further discussion is worthwhile to provide atomistic insights into the different mechanisms behind cluster boiling and film boiling, as well as the effect of liquid film thickness on the phase transition regime. As discussed in Section 3.2, TE at the liquid–vapor interfaces for all cases is always close to 0 eV due to a very low PE, manifesting that the Na liquid atoms at the liquid–vapor interfaces are easy to evaporate. Thus, it can be concluded that evaporation always occurs, even during cluster and film boiling. This phenomenon can help explain why the liquid phase transition regime was converted from cluster boiling into film boiling by increasing the solid substrate temperature from 800 K (for Case B3-800) to 900 K (for Case B3-900). Since both cases have the same liquid film thickness (3 nm) and the same substrate surface (surface B), the required thermal energy for the formation of vapor film is almost the same. Nevertheless, the heated solid substrate temperature for Case B3-800 is lower than that for Case B3-900. As a consequence, the waiting time to reach the required thermal energy to induce boiling would be longer, as shown before in Figure 10. Figure 12 displays the number of Na atoms in the liquid film for both cases before and after the onset time of boiling. Note that the onset of film/cluster boiling was defined as the first appearance of a divided liquid region into two different liquid films, which were identified based on the “Oxford” method [55].
The significant fall in the number of atoms in the liquid film, illustrated in Figure 12, is caused by the formation of the vapor layer, which is crucial during the transition to cluster or film boiling. It is clearly seen that the declining trend of the number of atoms in both cases is very similar, but the waiting time for Case B3-800 to form a vapor film is longer than for Case B3-900. As the required time for the onset of boiling increases, the liquid film spends more time near the heated solid substrate. More obviously, it can be concluded that the longer the liquid film resides on the heated solid substrate, the thinner its thickness (the number of Na atoms in the liquid film) becomes. Accordingly, at the onset of boiling, the liquid film is not thick enough to leave the liquid film as a liquid slug. That implies that even though the occurrence of film boiling is mainly related to higher heat fluxes, a minimum liquid film thickness is vital. When the liquid film thickness is very low, film boiling does not happen, regardless of the value of absorbed thermal energy.
In a word, in order to classify the phase transition regimes, two points should be noticed:
  • Whenever TE in the near-wall zone goes to a zero value, a vapor layer starts forming, and it can ultimately yield either cluster or film boiling. Otherwise, normal evaporation will be observed.
  • Following the formation of the vapor layer, if the number of liquid atoms that are about to evaporate is higher than a particular threshold, film boiling will appear; otherwise, cluster boiling will take place. From the results described above, it can be inferred that the minimum initial liquid film thickness of 3 nm is the threshold for the occurrence of film boiling.
In summary, the aforementioned explanations in Section 3.2 and Section 3.3 declare that the solid substrate temperature, liquid film thickness, and surface roughness play significant roles in the phase transition regime. These factors could influence the value and rate of the absorbed thermal energy and consequently the possibility and onset time of generating the vapor layer, thereby defining the phase transition regime.

3.4. Transition from Cluster Boiling to Film Boiling

This part gains further insight into the normal evaporation regime. The time trends of heat fluxes for the random rough surface during normal evaporation with two different substrate temperatures (600 and 700 K) are shown in Figure 13.
It is important to mention that the original data curves were smoothed by applying the Fast Fourier Transform filter [56], which is a common signal processing technique. This post-processing was needed to reduce heat flux fluctuation due to random, instantaneous interactions, i.e., to achieve a better outline of the heat flux trends over time.
Clearly, based on the variation in trend of the heat fluxes, two different modes of normal evaporation can be identified. For Cases B1-600, B2-600, B3-600, B1-700, B2-700, B3-700, and B4-700, heat fluxes continuously decrease to a zero value (Mode I). However, for the other simulation systems, as the time changes, heat fluxes first decrease to reach a minimum value, then increase to reach a maximum value, and finally decrease again to a zero value (Mode II).
To clearly analyze such heat transfer behavior, Case B6-900 was chosen as meaningful case, and its heat flux trend along with the time evolution of two-dimensional contour plots of Temp distributions are presented in Figure 14. It is evident from the figure that, once normal evaporation starts, as the temperature of liquid atoms rises, the temperature difference between them and the solid substrate decreases, which contributes to a decreasing heat flux. After a specific time (580 ps), the near-wall zone atoms can transfer their thermal energy to the upper atoms; thus, the heat flux starts to gradually increase again. Based on the discussion of Section 3.2, the main reason for this waiting time may be because of the collision thermal resistance. As time proceeds, because of the coupled effect of heat transfer to the upper layer (above the near-wall zone) and thickness reduction of the upper layer due to evaporation, the liquid film temperature gradually rises and becomes more uniform. Finally, at 2500 ps, most of the liquid atoms reach the same temperature as the solid substrate, thus leading to a heat flux drop. It is remarkable that the maximum heat flux can be observed at a certain liquid film thickness for all simulation systems, such as 3 nm and 4 nm for the 600 and 700 K solid substrates, respectively. Increasing the substrate temperature from 600 K to 700 K increases the heat flux and delays the occurrence of a maximum peak, confirming that the threshold thickness for 700 K (4 nm) is higher than that for 600 K (3 nm). More importantly, as expected, simulation systems with an initial liquid film thickness less than the threshold (4 nm for cases with a substrate temperature of 700 K and 3 nm for cases with a substrate temperature of 600 K) cannot experience Mode II. Comprehensively, it is concluded that substrate temperature and liquid film thickness can be considered the dominant factors in the definition of normal evaporation modes.

4. Conclusions

In the present study, the effects of random roughness and substrate temperature (ranging from 600 K to 1000 K) on the liquid–vapor phase transition regime of adsorbed sodium liquid films in various thicknesses (ranging from 1 nm to 9 nm) were studied via a molecular dynamics simulation method. At first, to generate a realistic representation of a random rough gold surface, a new method was developed. Afterward, the constructed random rough surface was used as the solid substrate in non-equilibrium liquid–vapor phase transition simulations. The newly proposed surface was compared with an ideally smooth surface. The results were given in terms of temperature, density, kinetic, and potential, and total energy distributions, as well as analyses of the heat fluxes.
As a general result, it was found that for the ideally smooth and random rough surfaces, by changing the liquid film thickness and substrate temperature, three different phase transition regimes can be identified: normal evaporation, cluster boiling, and film boiling. The details of the main findings are summarized and listed as follows:
(1)
The results illustrated that the value of the solid substrate temperature as well as the liquid film thickness are critical in determining the phase transition regime. Enhancing the solid substrate temperature and consequently the value of the absorbed thermal energy could result in changing the phase transition from a normal evaporation regime to cluster/film boiling and cluster boiling to film boiling if the liquid film had the minimum required thicknesses. Specifically, the minimum thickness for normal evaporation to cluster/film boiling transition was 2 nm, while it was 3 nm for cluster to film boiling transition.
(2)
Even though using the random rough surface can enhance the absorbed thermal energy, besides a specific film thickness (2 nm) and substrate temperature (800 K), it cannot change the phase transition regime. Mainly because its heat flux enhancement is not significant because of its low roughness ratio.
(3)
For the normal evaporation regime, two different modes (in terms of the heat fluxes) were identified. The influence of roughness on the mode of normal evaporation was negligible. For the normal evaporation transition mode, the liquid film thickness plays a significant role, even more than the solid substrate temperature.
A prospective direction for subsequent studies could be focused on the influence of the roughness ratio on the phase transition regime. Increasing the roughness ratio could increase the heat flux significantly; therefore, it could have a more obvious effect on the phase transition regime. Additionally, since nucleate boiling was not observed in our simulations, this study might also be extended to investigate surface wettability and pressure control configuration in relation to the possibility of nucleate boiling.

Author Contributions

Writing—original draft preparation, R.F. and L.P.; writing—review and editing, L.P., N.N., L.C. and M.W.A.; software, R.F., L.P. and N.N.; supervision, L.C. and F.B. All authors have read and agreed to the published version of the manuscript.

Funding

Muhammad Waheed Azam has a PhD fellowship in the framework of PON R&I 2014/2020 (CCI 2014IT16M2OP005), Action IV.5-“PhD on green issues”, funded by the Ministry of University and Research (MUR), Italy, FSE-REACT-EU.

Institutional Review Board Statement

Not applicable.

Informed Consent Statement

Not applicable.

Data Availability Statement

The data presented in this study are available upon request from the correspondent authors.

Conflicts of Interest

The authors declare no conflicts of interest.

Nomenclature

Abbreviations
12-6 L-J12-6 Lennard-Jones potential
ÅAngstrom
DensDensity [g/cm3]
EAMEmbedded Atom Model potential
eVElectronvolt
FCCFace-centered cubic
FEmbedding energy [eV]
fsFemtosecond
gGram
GWGigawatt
KKelvin
KEKinetic energy [eV]
mMeter
MDMolecular dynamics
nmNanometer
nsNanosecond
NVEMicrocanonical ensemble
NVTCanonical ensemble
OVITOOpen Visualization Tool software
PEPotential energy [eV]
psPicosecond
rijDistance between the atoms i and j [Å]
sSecond
TETotal energy [eV]
TempTemperature [K]
UiPotential energy in the Embedded Atom Model potential [eV]
UijPotential energy in the Lennard-Jones 12-6 potential [eV]
WHPWicked heat pipe
α Potential energy factor
σ Lennard-Jones potential distance constant [Å]
μ Micro
ε Lennard-Jones potential energy constant [eV]
ϕ Interatomic pair repulsion energy [eV]
Subscripts
AgSilver
AuGold
iAtom i
jAtom j
NaSodium

References

  1. Rainieri, S.; Bozzoli, F.; Pagliarini, G. Effect of a Hydrophobic Coating on the Local Heat Transfer Coefficient in Forced Convection under Wet Conditions. Exp. Heat Transf. 2009, 22, 163–177. [Google Scholar] [CrossRef]
  2. Tang, H.; Xie, Y.; Xia, L.; Tang, Y.; Sun, Y. Review on the fabrication of surface functional structures for enhancing heat transfer of heat pipes. Appl. Therm. Eng. 2013, 226, 120337. [Google Scholar] [CrossRef]
  3. Solomon, A.B.; Ramachandran, K.; Pillai, B.C. Thermal performance of a heat pipe with nanoparticles coated wick. Appl. Therm. Eng. 2012, 36, 106–112. [Google Scholar] [CrossRef]
  4. Shahmardi, A.; Tammisola, O.; Chinappi, M.; Brandt, L. Effects of surface nanostructure and wettability on pool boiling: A molecular dynamics study. Int. J. Therm. Sci. 2021, 167, 106980. [Google Scholar] [CrossRef]
  5. Liu, H.; Ahmad, S.; Chen, J.; Zhao, J. Molecular dynamics study of the nanoscale boiling heat transfer process on nanostructured surfaces. Int. Commun. Heat Mass Transf. 2020, 119, 104963. [Google Scholar] [CrossRef]
  6. Li, Z.; Wang, Z.; Shao, W.; Cao, Q.; Cui, Z. Ultrathin liquid film nucleate boiling on grooved surfaces with variational aspect ratio. Therm. Sci. Eng. Prog. 2023, 43, 102023. [Google Scholar] [CrossRef]
  7. Wang, W.; Zhang, H.; Tian, C.; Meng, X. Numerical experiments on evaporation and explosive boiling of ultra-thin liquid argon film on aluminum nanostructure substrate. Nanoscale Res. Lett. 2015, 10, 158. [Google Scholar] [CrossRef]
  8. Fu, T.; Mao, Y.; Tang, Y.; Zhang, Y.; Yuan, W. Effect of nanostructure on rapid boiling of water on a hot copper plate: A molecular dynamics study. Heat Mass Transf. 2015, 52, 1469–1478. [Google Scholar] [CrossRef]
  9. Fallahzadeh, R.; Bozzoli, F.; Cattani, L. Effect of closed-loop nanochannels on the onset of explosive boiling: A molecular dynamics simulation study. J. Phys. Conf. Ser. 2024, 2685, 012013. [Google Scholar] [CrossRef]
  10. Fallahzadeh, R.; Bozzoli, F.; Cattani, L.; Azam, M.W. Effect of Cross Nanowall Surface on the Onset Time of Explosive Boiling: A Molecular Dynamics Study. Energies 2024, 17, 1107. [Google Scholar] [CrossRef]
  11. Seyf, H.R.; Zhang, Y. Effect of nanotextured array of conical features on explosive boiling over a flat substrate: A nonequilibrium molecular dynamics study. Int. J. Heat Mass Transf. 2013, 66, 613–624. [Google Scholar] [CrossRef]
  12. Qasemian, A.; Qanbarian, M.; Arab, B. Molecular dynamics simulation on explosive boiling of thin liquid argon films on cone-shaped Al–Cu-based nanostructures. J. Therm. Anal. Calorim. 2020, 145, 269–278. [Google Scholar] [CrossRef]
  13. Fu, T.; Mao, Y.; Tang, Y.; Zhang, Y.; Yuan, W. Molecular Dynamics Simulation on Rapid Boiling of Thin Water Films on Cone-Shaped Nanostructure Surfaces. Nanoscale Microscale Thermophys. Eng. 2015, 19, 17–30. [Google Scholar] [CrossRef]
  14. Wang, Z.; Ye, T.; Guo, K.; Wang, C.; Tian, W.; Qiu, S.; Su, G. Molecular dynamics simulation of the evaporation of thin liquid sodium film on the conical nanostructure surface. Prog. Nucl. Energy 2023, 162, 104795. [Google Scholar] [CrossRef]
  15. Liu, R.; Liu, Z. Study of boiling heat transfer on concave hemispherical nanostructure surface with MD simulation. Int. J. Heat Mass Transf. 2019, 143, 118534. [Google Scholar] [CrossRef]
  16. Seyf, H.R.; Zhang, Y. Molecular Dynamics Simulation of Normal and Explosive Boiling on Nanostructured Surface. J. Heat Transf. 2013, 135, 121503. [Google Scholar] [CrossRef]
  17. Zhou, J.; Li, S.; Tang, S.-Z.; Zhang, D.; Tian, H. Effect of nanostructure on explosive boiling of thin liquid water film on a hot copper surface: A molecular dynamics study. Mol. Simul. 2021, 48, 221–230. [Google Scholar] [CrossRef]
  18. Liu, H.; Qin, X.; Ahmad, S.; Tong, Q.; Zhao, J. Molecular dynamics study about the effects of random surface roughness on nanoscale boiling process. Int. J. Heat Mass Transf. 2019, 145, 118799. [Google Scholar] [CrossRef]
  19. Liu, H.; Deng, W.; Ding, P.; Zhao, J. Investigation of the effects of surface wettability and surface roughness on nanoscale boiling process using molecular dynamics simulation. Nucl. Eng. Des. 2021, 382, 111400. [Google Scholar] [CrossRef]
  20. Guo, C.; Ji, C.; Kong, Y.; Liu, Z.; Guo, L.; Yang, Y. The Effect of Liquid–Solid Interactions upon Nucleate Boiling on Rough Surfaces: Insights from Molecular Dynamics. Materials 2023, 16, 1984. [Google Scholar] [CrossRef]
  21. Qun, C.; Zheng, C. Molecular dynamics simulations of the effects of surface sinusoidal nanostructures on nanoscale liquid film phase-change. J. Therm. Sci. 2020, 29, 1076–1084. [Google Scholar] [CrossRef]
  22. Wang, Z.; Ye, T.; Guo, K.; Tian, W.; Qiu, S.; Su, G. The evaporation of nanoscale sodium liquid film on the non-ideal nanostructure surface: A molecular dynamics study. Int. J. Adv. Nucl. React. Des. Technol. 2023, 5, 1–8. [Google Scholar] [CrossRef]
  23. Cao, Q.; Li, Z.; Cui, Z. Nanoscale Investigation of Bubble Nucleation and Boiling on Random Rough Surfaces. Langmuir 2023, 39, 12754–12761. [Google Scholar] [CrossRef] [PubMed]
  24. Ma, B.; Guye, K.; Dogruoz, B.; Agonafer, D. Molecular dynamics simulations of thin-film evaporation: The influence of interfacial thermal resistance on a graphene-coated heated silicon substrate. Appl. Therm. Eng. 2021, 195, 117142. [Google Scholar] [CrossRef]
  25. Wang, C.; Zhang, D.; Qiu, S.; Tian, W.; Wu, Y.; Su, G. Study on the characteristics of the sodium heat pipe in passive residual heat removal system of molten salt reactor. Nucl. Eng. Des. 2013, 265, 691–700. [Google Scholar] [CrossRef]
  26. Wang, Z.; Guo, K.; Wang, C.; Zhang, D.; Tian, W.; Qiu, S.; Su, G. Molecular dynamics study of liquid sodium film evaporation and condensation by Lennard-Jones potential. Nucl. Eng. Technol. 2022, 54, 3117–3129. [Google Scholar] [CrossRef]
  27. Wang, Z.; Ye, T.; Guo, K.; Tian, W.; Qiu, S.; Su, G. Molecular dynamics study of the wettability effect on the evaporation of thin liquid sodium film. Nucl. Eng. Des. 2023, 405, 112183. [Google Scholar] [CrossRef]
  28. Leite, R.P.; de Koning, M. Nonequilibrium free-energy calculations of fluids using LAMMPS. Comput. Mater. Sci. 2019, 159, 316–326. [Google Scholar] [CrossRef]
  29. Hu, C.; Shi, L.; Yi, C.; Bai, M.; Li, Y.; Tang, D. Mechanism of enhanced phase-change process on structured surface: Evolution of solid-liquid-gas interface. Int. J. Heat Mass Transf. 2023, 205, 123915. [Google Scholar] [CrossRef]
  30. Asai, P.; Jin, J.; Deo, M.; Miller, J.D.; Butt, D. Non-equilibrium molecular dynamics simulation to evaluate the effect of confinement on fluid flow in silica nanopores. Fuel 2022, 317, 123373. [Google Scholar] [CrossRef]
  31. Stukowski, A. Visualization and analysis of atomistic simulation data with OVITO—The Open Visualization Tool. Model. Simul. Mater. Sci. Eng. 2010, 18, 015012. [Google Scholar] [CrossRef]
  32. Liu, L.; Su, Z.; Du, Y.; Li, Y.; Han, H.; Zhu, J.; Sun, C. Molecular dynamics study on the enhancement of heterogeneous nucleate boiling of mixed liquid on superhydrophilic surfaces. Appl. Therm. Eng. 2023, 230, 120724. [Google Scholar] [CrossRef]
  33. Guillotte, M.; Godet, J.; Pizzagalli, L. A fully molecular dynamics-based method for modeling nanoporous gold. Comput. Mater. Sci. 2019, 161, 135–142. [Google Scholar] [CrossRef]
  34. Wu, C.-D.; Hong, G.-W. Effects of heating rate on morphological evolution, microstructure, and mechanical properties of nanoporous gold. J. Appl. Phys. 2022, 131, 224304. [Google Scholar] [CrossRef]
  35. Kraut, J.C.; Stern, W.B. The density of gold-silver-copper alloys and its calculation from the chemical composition. Gold Bull. 2000, 33, 52–55. [Google Scholar] [CrossRef]
  36. Schneider, T.; Stoll, E. Molecular-dynamics study of a three-dimensional one-component model for distortive phase transitions. Phys. Rev. B 1978, 17, 1302–1322. [Google Scholar] [CrossRef]
  37. Krone, M.; Stone, J.E.; Ertl, T.; Schulten, K. Fast visualization of Gaussian density surfaces for molecular dynamics and particle system trajectories. In Proceedings of the Eurographics Conference on Visualization, Vienna, Austria, 5–8 June 2012. [Google Scholar] [CrossRef]
  38. Daw, M.S.; Baskes, M.I. Semiempirical, Quantum Mechanical Calculation of Hydrogen Embrittlement in Metals. Phys. Rev. Lett. 1983, 50, 1285–1288. [Google Scholar] [CrossRef]
  39. Ahmadi, V.; Fahim, A.H.; Neek, S.J.; Ghassemi, H. Molecular dynamic simulation of light alkanes flash evaporation. Therm. Sci. Eng. Prog. 2023, 46, 102211. [Google Scholar] [CrossRef]
  40. Delhommelle, J.; Millié, P. Inadequacy of the Lorentz-Berthelot combining rules for accurate predictions of equilibrium properties by molecular simulation. Mol. Phys. 2009, 99, 619–625. [Google Scholar] [CrossRef]
  41. Foiles, S.M.; Baskes, M.I.; Daw, M.S. Embedded-atom-method functions for the fcc metals Cu, Ag, Au, Ni, Pd, Pt, and their alloys. Phys. Rev. B 1986, 33, 7983–7991. [Google Scholar] [CrossRef]
  42. Hasan, M.N.; Shavik, S.; Rabbi, K.; Mukut, K.; Morshed, A. Phase Change Characteristics of Ultra-Thin Liquid Argon Film over different Flat Substrates at High Wall Superheat for Hydrophilic/Hydrophobic Wetting Condition: A Non-Equilibrium Molecular Dynamics Study. J. Chem. Eng. 2017, 29, 49–55. [Google Scholar] [CrossRef]
  43. Fink, J.K.; Leibowitz, L. Thermodynamic and Transport Properties of Sodium Liquid and Vapor; U.S. Department of Energy: Washington, DC, USA, 1995; p. 87. [CrossRef]
  44. Foust, O.J. Sodium chemistry and physical properties. In Sodium-NaK Engineering Handbook; Gordon and Breach: New York, NY, USA, 1972; Volume I, p. 9. [Google Scholar]
  45. Din, X.-D.; Michaelides, E.E. Kinetic theory and molecular dynamics simulations of microscopic flows. Phys. Fluids 1997, 9, 3915–3925. [Google Scholar] [CrossRef]
  46. Wu, X.; Yang, Z.; Duan, Y. Formation and growth of R32/R1234yf nanobubble on smooth surface: Molecular dynamics simulations. J. Mol. Liq. 2022, 348, 118020. [Google Scholar] [CrossRef]
  47. Alam, M.; Thakur, S.H.; Islam, M.; Hasan, M.N.; Mitsutake, Y.; Monde, M. Atomistic and macroscopic characterization of nanoscale thin film liquid-vapor phase change phenomena. Int. J. Therm. Sci. 2021, 170, 107159. [Google Scholar] [CrossRef]
  48. Wang, Y.-H.; Wang, S.-Y.; Lu, G.; Wang, X.-D. Explosive boiling of nano-liquid argon films on high temperature platinum walls: Effects of surface wettability and film thickness. Int. J. Therm. Sci. 2018, 132, 610–617. [Google Scholar] [CrossRef]
  49. Rabbi, K.F.; Tamim, S.I.; Faisal, A.H.M.; Mukut, K.M.; Hasan, M.N. A molecular dynamics study on thin film liquid boiling characteristics under rapid linear boundary heating: Effect of liquid film thickness. In Proceedings of the 7th BSME International Conference on Thermal Engineering, Dhaka, Bangladesh, 22–24 December 2016. [Google Scholar] [CrossRef]
  50. Yang, K.-S.; Tu, C.-W.; Zhang, W.-H.; Yeh, C.-T.; Wang, C.-C. A novel oxidized composite braided wires wick structure applicable for ultra-thin flattened heat pipes. Int. Commun. Heat Mass Transf. 2017, 88, 84–90. [Google Scholar] [CrossRef]
  51. Wang, Y.-H.; Wang, S.-Y.; Lu, G.; Wang, X.-D. Effects of wettability on explosive boiling of nanoscale liquid films: Whether the classical nucleation theory fails or not? Int. J. Heat Mass Transf. 2019, 132, 1277–1283. [Google Scholar] [CrossRef]
  52. Blander, M.; Katz, J.L. Bubble nucleation in liquids. AIChE J. 1975, 21, 833–848. [Google Scholar] [CrossRef]
  53. Chen, Y.-J.; Cao, Q.; Li, J.; Yu, B.; Tao, W.-Q. Effects of simulation system on the phase transition behavior of liquid film: A molecular dynamics study. J. Mol. Liq. 2020, 311, 113306. [Google Scholar] [CrossRef]
  54. Hong, F.; Cheng, P.; Wu, H.; Sun, Z. Evaporation/boiling heat transfer on capillary feed copper particle sintered porous wick at reduced pressure. Int. J. Heat Mass Transf. 2013, 63, 389–400. [Google Scholar] [CrossRef]
  55. Deng, X.; Xu, X.; Song, X.; Li, Q.; Liu, C. Boiling heat transfer of CO2/lubricant on structured surfaces using molecular dynamics simulations. Appl. Therm. Eng. 2023, 219, 119682. [Google Scholar] [CrossRef]
  56. Ilic, M.; Stevanovic, V.D.; Milivojevic, S.; Petrovic, M.M. Explosive boiling of water films based on molecular dynamics simulations: Effects of film thickness and substrate temperature. Appl. Therm. Eng. 2023, 220, 119749. [Google Scholar] [CrossRef]
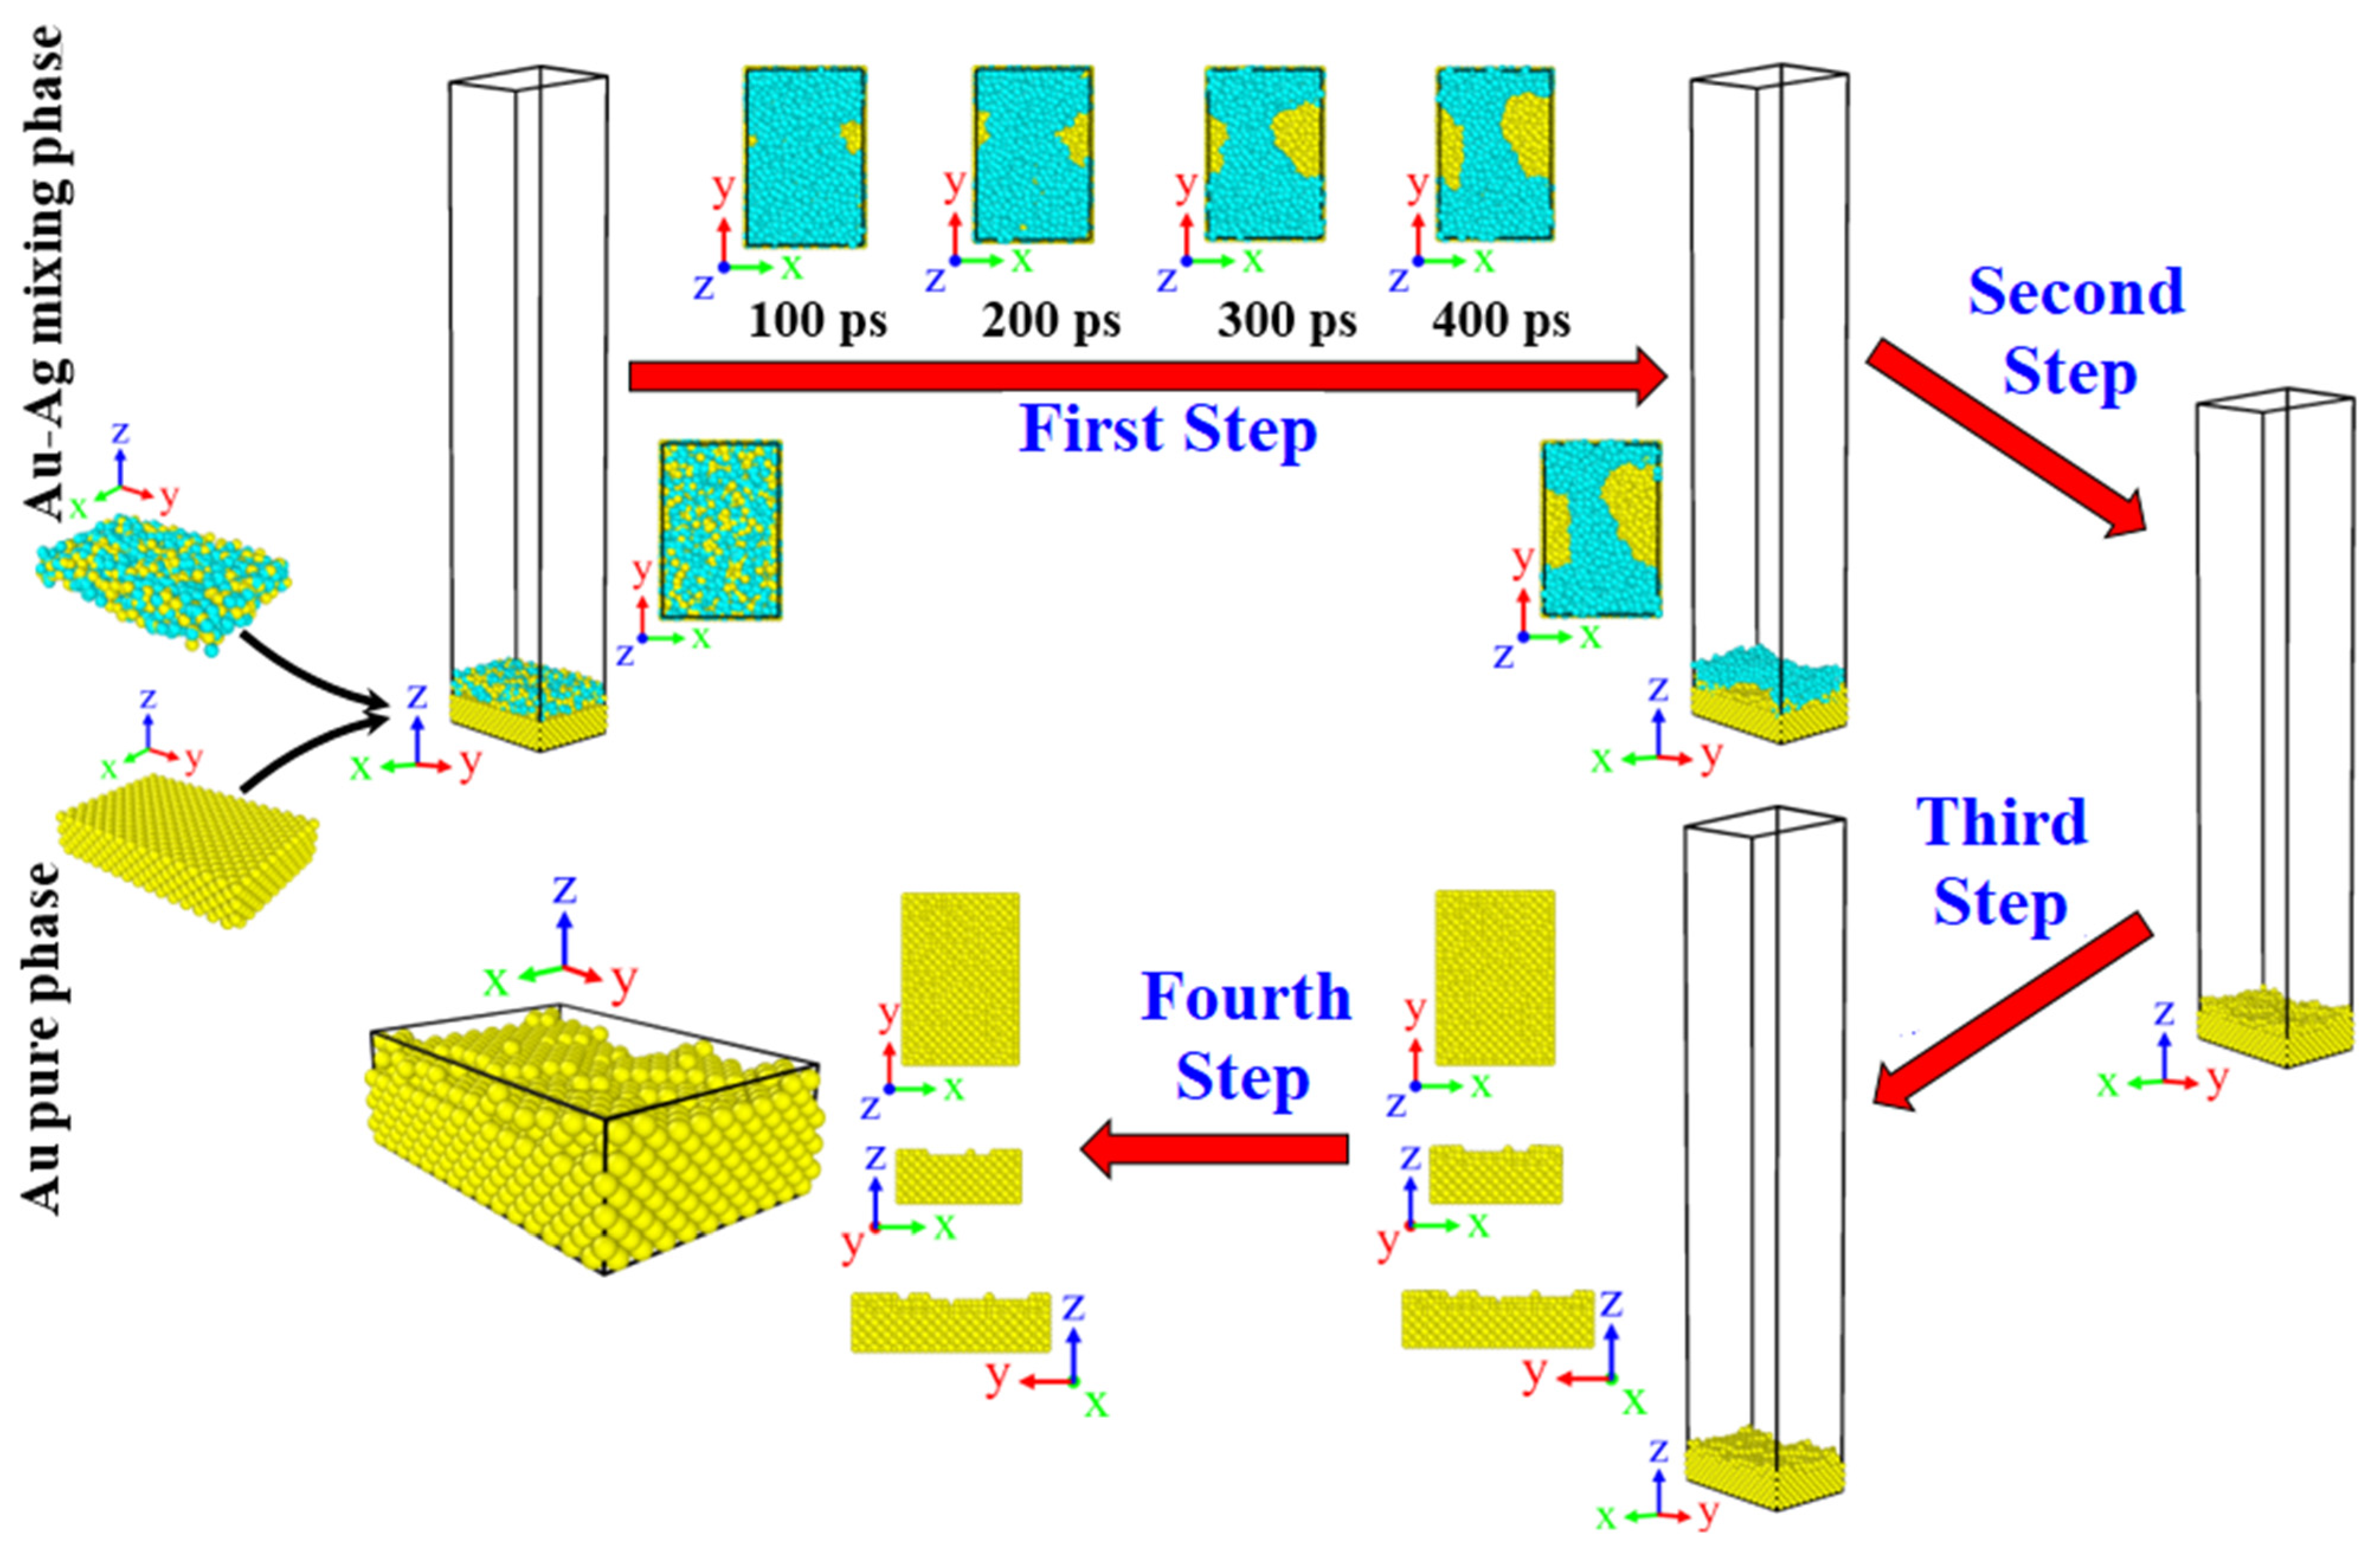
Figure 1. Illustration of the sequence of the main steps of the random rough Au surface construction. The yellow and blue atoms are Au and Ag atoms, respectively.
Sci 06 00033 g001
Figure 2. (a) Initial configuration of the simulation domains, (b) three regions of the solid substrates, (c) the initial distance between the initial liquid film and solid substrates, (d) four steps of the phase transition simulations.
Sci 06 00033 g002
Figure 3. A schematic illustration of the proposed configuration for the MD simulations (n = 1, 2, 3, …, 40).
Sci 06 00033 g003
Figure 4. The snapshots of the time evaluation of atom trajectories during: (a) normal evaporation, (b) film boiling, and (c) cluster boiling processes in the Y-Z plane.
Sci 06 00033 g004
Figure 5. Two-dimensional contour plots of Dens distributions for: (a) normal evaporation, (b) film boiling, and (c) cluster boiling. To show the contour plots more clearly, the solid substrates are represented by a gray region.
Sci 06 00033 g005
Figure 6. Liquid–vapor phase transition diagrams for: the surface A (the ideally smooth surface) and the surface B (the random rough surface). The roman numerals inside the green cells show the different normal evaporation modes. The black box represents a specific simulation system where the introduction of the random rough surface changes the phase transition regime.
Sci 06 00033 g006
Figure 7. Two-dimensional contour plots of Temp, KE, Dens, PE, and TE distributions for: (a) normal evaporation, (b) film boiling, and (c) cluster boiling at 5 ps. (d) A schematic of the Na atomic arrangement inside the liquid film, describing defined zones and layers. Purple and gray–colored areas represent the Na and Au atoms, respectively.
Sci 06 00033 g007
Figure 8. Time evolution of two-dimensional contour plots of Temp, KE, Dens, PE, and TE distributions for normal evaporation (Case B3-700).
Sci 06 00033 g008
Figure 9. Time evolution of the heat fluxes for film boiling, cluster boiling, and normal evaporation.
Sci 06 00033 g009
Figure 10. Time evolution of atom trajectories and contour plots of TE distributions for: (a) cluster boiling and (b) film boiling.
Sci 06 00033 g010
Figure 11. Cases A2-800 and B2-800: (a) two-dimensional contour plots and atomic distributions of PE at 5 ps, (b) time evolution of the heat fluxes, and (c) time evolution of two-dimensional contour plots of TE distributions.
Sci 06 00033 g011
Figure 12. Time evolution of the number of Na atoms inside the liquid film for cluster and film boiling.
Sci 06 00033 g012
Figure 13. Trends of normal evaporation heat fluxes for the random rough surfaces.
Sci 06 00033 g013
Figure 14. Trend of heat flux and two-dimensional contour plots of Temp distributions for Case B9-600.
Sci 06 00033 g014
Table 1. The topological morphologies of the ideally smooth and random rough Au surfaces.
SurfaceRoughness Ratio 1Oblique ViewTop View
A1.00Sci 06 00033 i001Sci 06 00033 i002Sci 06 00033 i003Sci 06 00033 i004
Sci 06 00033 i005
B1.03Sci 06 00033 i006Sci 06 00033 i007
Sci 06 00033 i008Sci 06 00033 i009
1 Roughness ratio = the surface area/the ideally smooth surface area. The surface areas were calculated by the Gaussian density method [37] with the resolution, radius scaling, and iso value equal to 200, 100%, and 0.6, respectively.
Table 2. Interatomic potential parameters related to the EAM and 12-6 L-J for Au and Ag interactions.
Simulation StepAtom PairPotential
Function
EAM Parameters12-6 L-J Parameters
σ (Å) ε (eV)
First StepAu-AuEAMRef. [41]
Ag-AgEAMRef. [41]
Au-Ag12-6 L-J0.6514 10.3936 1
Third StepAu-Au12-6 L-J2.6370 (Ref. [26])0.441280 (Ref. [26])
1 To calculate these values, the Ag-Ag interactions with the length parameter ( σ Ag ) and the energy parameter ( ε Ag ) equal to 2.574 Å and 0.3510 eV [42], respectively, have been used.
Table 3. Interatomic potential parameters related to the 12-6 L-J for Na and Au interactions.
Atom Pair σ (Å) ε (eV)
Na-Na3.2400 (Ref. [27])0.051528 (Ref. [27])
Au-Au2.6370 (Ref. [27])0.441280 (Ref. [27])
Au-Na2.93850.150792
Disclaimer/Publisher’s Note: The statements, opinions and data contained in all publications are solely those of the individual author(s) and contributor(s) and not of MDPI and/or the editor(s). MDPI and/or the editor(s) disclaim responsibility for any injury to people or property resulting from any ideas, methods, instructions or products referred to in the content.