1. Introduction
In the world in which we live today, the generation of waste and its management is one of the main problems that the different governments must face, especially those of the main world powers. These countries, in addition to being the ones that have the most resources at their disposal, are also the ones that produce the most waste and therefore must find ways to reuse most of the resources and materials to favor both the environment and the circular economy.
Waste management is a set of operations carried out with the aim of properly determining how to proceed with each type of waste produced. There are several approaches to consider, such as the post-consumer approach, in which decisions about what should be the route of action against waste are made when the quantities and properties of these are known. Meanwhile, in the pre-consumption approach, measures are taken during the production of the goods to be consumed, that is, during manufacturing and marketing the methods of managing the waste that is going to be generated are already considered. This latter approach is principally the basis of the Waste Framework Directive (Directive 2008/98/EC) [
1].
The objective of these new rules proposed by the European Union is to promote the change from the linear economy previously used in society towards the circular economy. Therefore, in March 2020, the European Commission published the new action plan for the circular economy, whose main purpose is to reduce the production of waste by improving the management of existing resources. The main points of this plan are to make sustainable products the norm in the EU, to empower consumers by providing them with reliable product information, to focus on the different sectors that use the most resources and have a high potential for circularity, such as electronics or construction, and to ensure the reduction in waste production [
1].
One of the most problematic types of waste is the municipal waste or urban solid waste, since these include bulky waste apart from household waste. The voluminous waste are those that due to their size cannot be managed in the same way as the rest of the waste, so they are sent to a clean point or an eco-park which are to be found in most European cities. According to data published by the Ministry for the Ecological Transition and the Demographic Challenge, in Spain in 2018, 79% of this type of waste was sent to landfills [
2].
Despite all the progress made regarding the management of urban solid waste, bulky waste continues to present a serious problem. In the European Union, some 19 million items of bulky waste are produced yearly, including mattresses, of which more than 60% end up in landfills. Some of the products that can be obtained after the mechanical and chemical recycling of this waste are adhesives, solvents, foams, fiber-reinforced composites and felts, and reinforced plastics [
3].
Regarding the recycling of mattresses in European Union, the fact is that usually only the steel springs of the mattress core are recycled, while the rest of the mattress is sent to landfills. In some big cities, companies are subcontracted to collect this bulky waste, from which the textile parts are removed, and the foams are separated. The rest of the mattress is then compressed into bales to reduce the volume of the mattress to 10% of the original volume of the waste, before sending them to landfill.
In Spain, around 1.8 million new mattresses are sold each year, of which 40% are mattresses with springs. The rest of them are latex or viscoelastic mattresses, both containing polyurethane in their composition. The perspective of the worldwide consumption of this polymer is expected to increase by 8% in the year 2023 [
4].
Another problem of our society is sound pollution, that has been increasing at an alarming rate due to industrialization and modernization. The manufacture of acoustic insulating materials using waste has been studied sporadically in the literature. Some authors have used leather waste [
5], recycled textiles [
6], denim fabrics [
7], and carpet waste [
8]. All these studies have shown interesting properties of the materials produced, but in any case, the previous briquetting of the waste is considered. Furthermore, seashells have been considered for enhancing the acoustical characteristics of polyurethane foams [
9], producing bio-based composites able to adsorb sound with a frequency below 500 Hz.
For the measurement of acoustic properties, international standards have been developed. Many of these standards, as is the case of UNE-EN ISO 10534 [
10], are based on the use of complex equipment, such as impedance tubes, which are expensive but simple to operate. Some authors [
11,
12] have used home equipment to carry out measurements similar to those required by these international standards. In this way, the main objective of this research is to produce compact briquettes from mattress waste and verify their usefulness as an acoustic material, by using a home-made equipment that will allow the measurement of sound reduction indices at different frequencies; MATLAB
® has been used for the signal processing by transforming audio into data and calculating reduction indices.
2. Materials and Methods
Two different waste mattresses were used in this work, both collected from a waste manager. One of the materials, blue, was more compact at first glance than the other, the grey material.
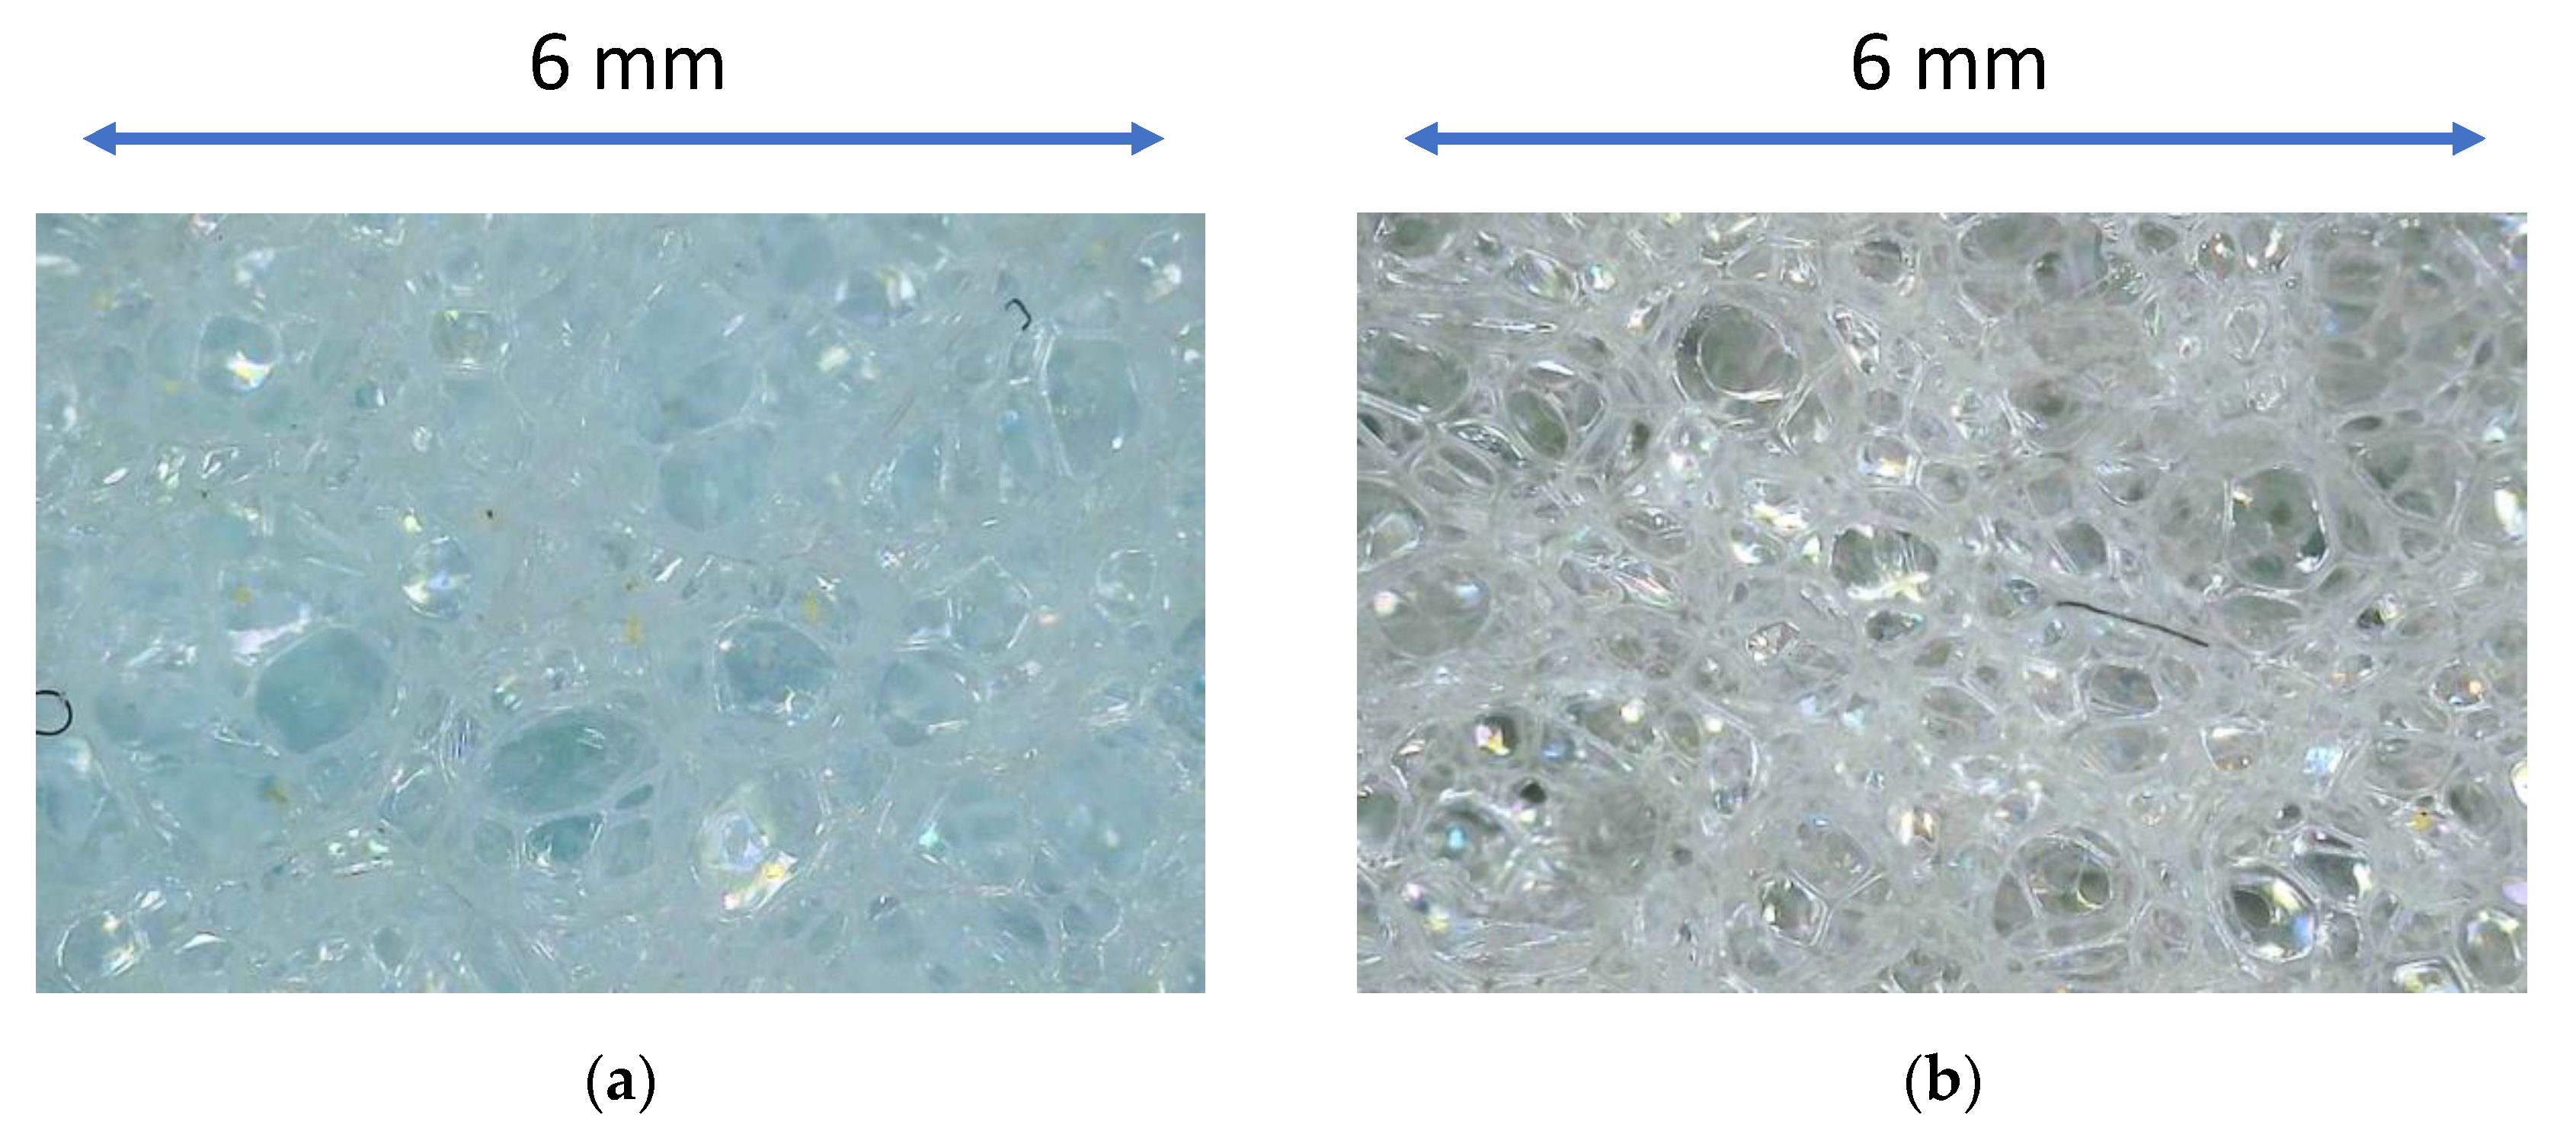
Figure 1a,b show micrographs of the materials, where some differences can be seen. It can be seen with the naked eye that the grey material is more porous. These micrographs have been created with a SKYBASIC Wi-Fi Digital Microscope at a total of 50× magnification. This microscope can also work with 1000× magnification, as will be seen later.
From a chemical point of view, both pieces of waste came from viscoelastic memory foam (VMF) mattresses [
13,
14], which is the material mainly used today in the production of mattresses.
Viscoelastic foam is a polyurethane foam to which a series of additives have been integrated during its manufacturing process to achieve certain characteristics in the polymer, such as the adaptability of its hardness depending on temperature, that is, that when the material is cold, it is hard and increases its rigidity, while, if the material is heated, it softens slightly, which is an ideal characteristic for mattresses, since it favors its adaptation to the user’s body.
A workflow of the methodology used in the experimental design is shown in
Figure 2. First, the mattress waste was briquetted at different conditions, then the materials obtained were characterized, and the sound tests were performed. Finally calculation of sound insulation was completed.
In order to briquette the waste generated by the mattresses, in this case, for both types of viscoelastic foam (blue and grey), a laboratory press fitted with a heater was used. This briquetting machine is composed of a press with a hydraulic piston and a manual–pneumatic pump. Previous studies were completed with this equipment giving interesting results [
13,
14,
15]. A photograph of the system can be found in
Figure 3.
The operation of the briquette machine consisted of the piston exerting a certain pressure, which was measured by means of the manometer that is incorporated in the machine, on a cylindrical mold with a diameter of 53 mm. The piston is self-returning, so when the user stops applying pressure through the pump, the piston goes back, and the sample is no longer under pressure.
Finally, a heating jacket was installed around the cylindrical mold. This jacket has a program to control the temperature, which allows the temperature to be studied during the briquetting process.
In this equipment, the temperature and pressure to which the samples were subjected were varied, in order to obtain the optimum briquetting conditions. This study was carried out for the two foams mentioned before (blue and grey). The conditions of each of the experiments are those shown in
Table 1.
As can be seen in the table, experiments 10 and 11 were carried out under the same process conditions, in order to verify the reproducibility of the experiments with the briquetting machine.
Before starting the sound measurements, some physical properties of the foams were determined. Density was measured by obtaining a cube-shaped piece of foam and determining its dimensions (vernier caliper) and its weight using a balance. Once the volume was calculated, we obtained the apparent density:
On the other hand, the porosity of the materials was determined. To do this, the weight of the dry materials was determined, after immersing them in acetone for about ten seconds. In this way, the amount of liquid absorbed by the foam was calculated, knowing that the difference between the weight of the dry materials and the weight of those same materials, but after being submerged, was the weight of liquid absorbed. Knowing the density of the liquid, the volume of liquid absorbed can be obtained. Once both volumes were obtained, we proceeded to calculate the porosity of the materials, using the following expression:
Finally, it was decided to calculate the so-called compactness ratio to know the compaction quality of each of the briquettes under study. This parameter was calculated as follows:
Being Fw the compaction factor, Vfoam refers to the volume that the material that makes up the briquette should occupy in the case where it was not compacted, that is, if the amount of mass of the briquette was previously foam prior to the introduction to the briquette machine. When making this division, as is evident, values greater than one would be obtained for the compaction factor, for example, if a value of 2 was obtained for this factor, it would mean that the un-briquetted foam occupied twice the volume that it possessed once it had been briquetted, so the higher the compaction factor, the better the compaction in the briquette.
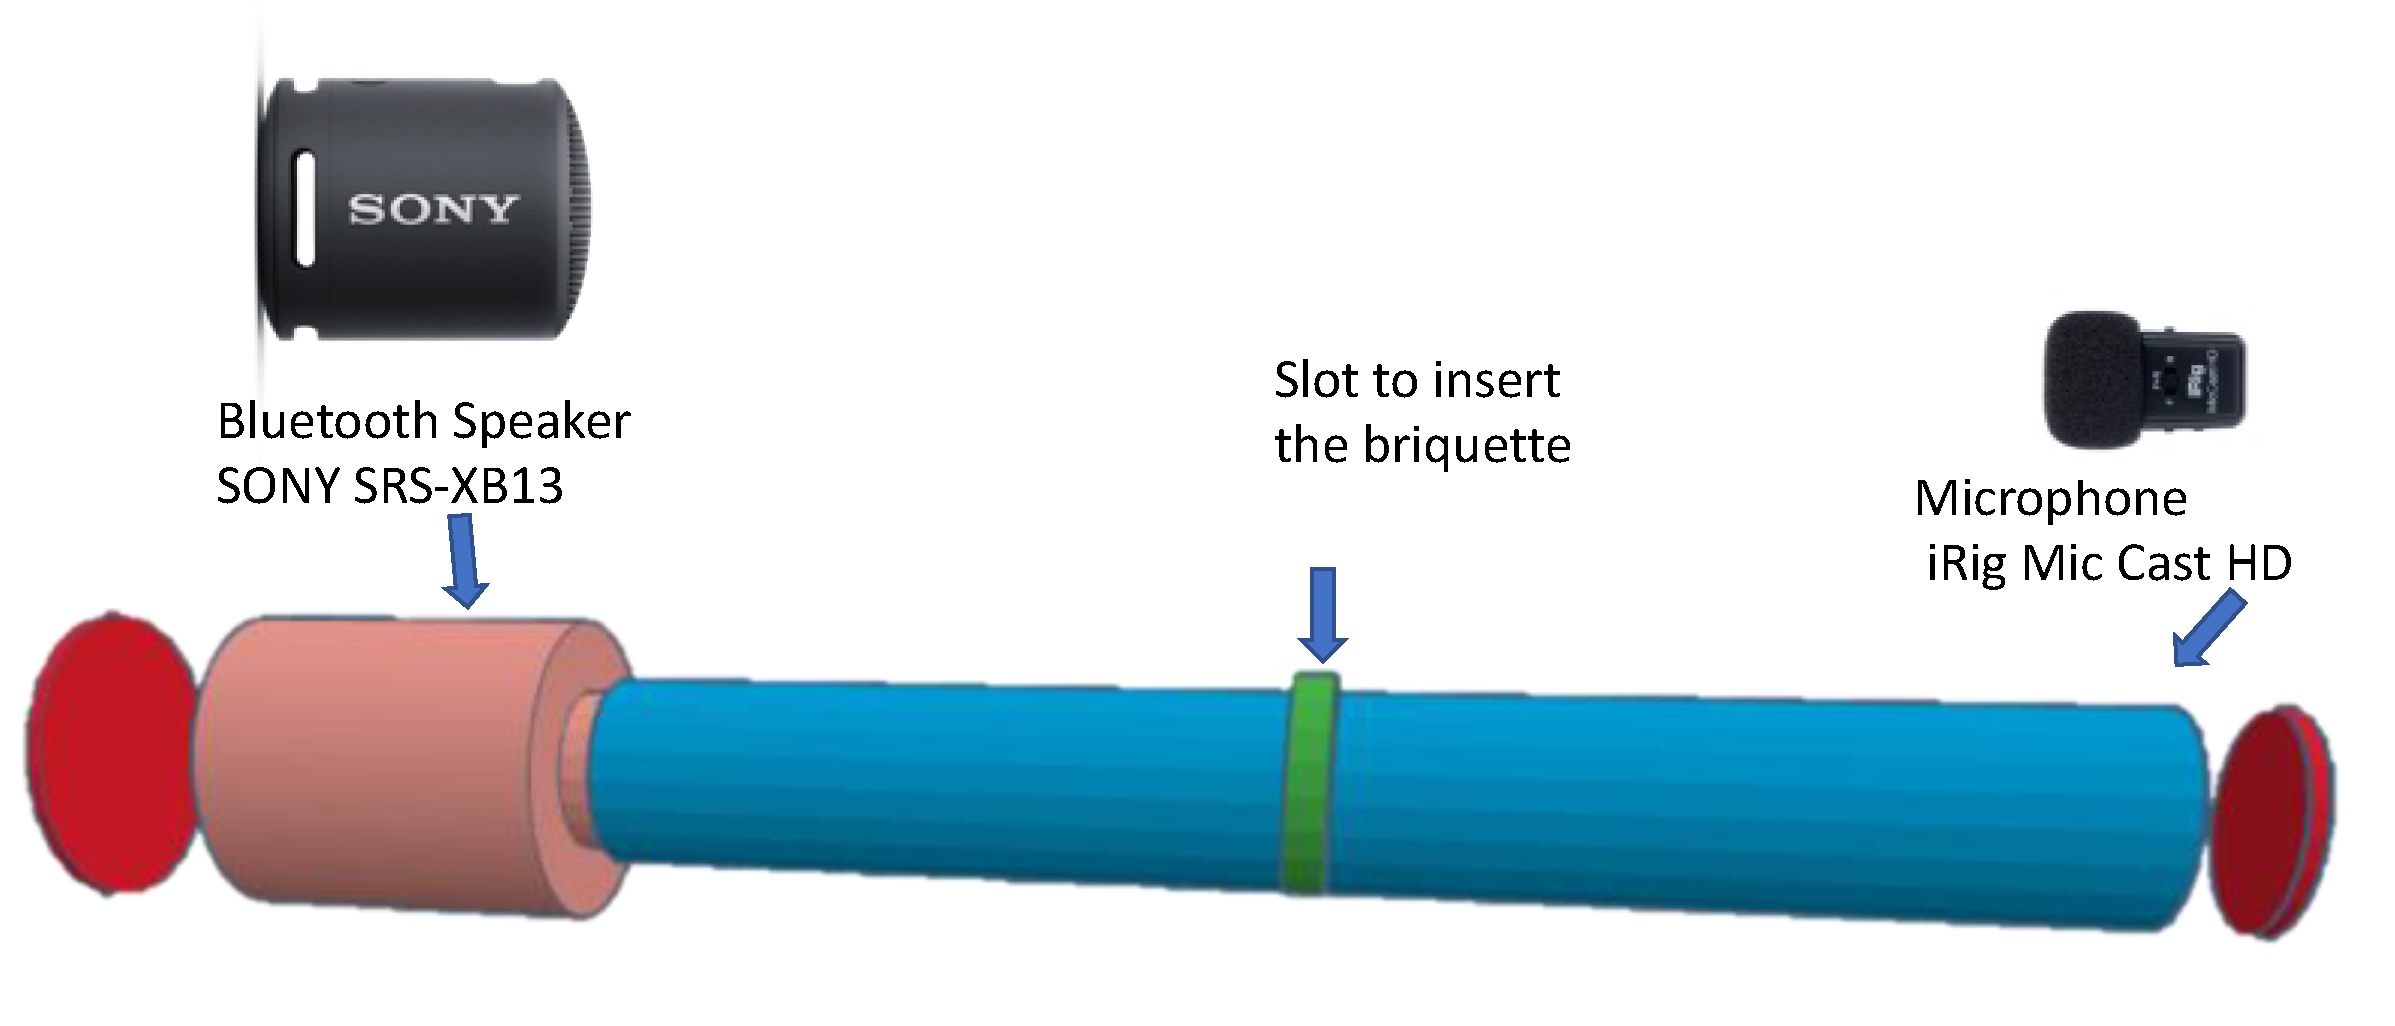
Once the different briquettes with the two different foams were obtained, their sound insulation capabilities were measured. The equipment used for sound measurement was a 50 cm long tube, with a slot in the center of the tube, where the material to be tested can be introduced. At one end of the tube, a Bluetooth speaker was positioned, with which a sound file was played that contained a sound that varied in frequency between the entire audible spectrum (20–20,000 Hz). Measurements were made at three different volumes (nominally volumes 4, 5, and 6) in order to compare results.
At the other end of the tube a microphone was placed specifically selected for its response to different frequencies and for its spatial characteristics. Regarding the operation of the microphone, it should be noted that it had a good response against all the previously mentioned audible frequencies, and had a correct response against all angles of incidence. As for the mounted equipment, see the scheme shown in
Figure 4.
Before proceeding with the sound measurement experiments, the equipment was placed inside a “box” made of insulating material. This was executed so that, when measuring the audio, the ambient noise in the room would be reduced and, therefore, the measurements would be of higher quality.
The objective of the acoustic measurements carried out using the previously mentioned equipment was to obtain the reduction index of each of the briquettes. This index is defined as follows:
where
IR is the reduction index in decibels (dB);
Ei is the intensity of the sound received just before the material; and
Et is the transmitted sound measured after the insulating element.
Figure 5 shows a schematic of the incident and transmitted intensities.
In this figure, Er is the sound being reflected by the insulator. This intensity was not measured, since it is not necessary for the study, although it could be obtained approximately as the difference between the other two intensities.
When taking the sound measurements with the equipment, a sound file is played from the speaker located at one end of the tube, the audio of which varies in frequency throughout the audible spectrum (20–20,000 Hz), using the following function:
where the frequency (f) is in hertz and the time (t) is in seconds. The selected audio file has a duration of 360 s.
In our case, to obtain the necessary data to calculate the reduction index, instead of measuring the sound before and after each one of the briquettes, we chose to measure the sound with the empty tube (blank runs) and then measure the sound intensity with the briquette inserted in the slot at the center of the tube. The first intensity measured was treated as the incident intensity (Ei), while the second was the transmitted intensity (Et). When making the measurements, different loudspeaker volumes were used, in this case, volumes 4, 5, and 6 were used, since if lower volumes were selected the signal was poorly measured by the microphone and if higher volume signals were used, the system would become saturated. As is obvious, all these measures were carried out in such a way that the equipment was acoustically isolated from the outside, to avoid interferences in the microphone.
Once the audio files were obtained for all the briquettes obtained and for the three volume levels previously mentioned, around 20,000 data per second were recorded, being quite difficult to handle with a personal computer due to the huge amount of data. To facilitate the necessary calculations to obtain the reduction indices, it was decided to use the MATLAB
® software to transform the audio into data, making a smoothing of the data. In the program used, an average of the values was calculated every 7000 points, thus eliminating variables with millions of points and allowing the corresponding calculation to be completed. The used MATLAB
® file can be found in
Appendix A of the present article.
4. Discussion
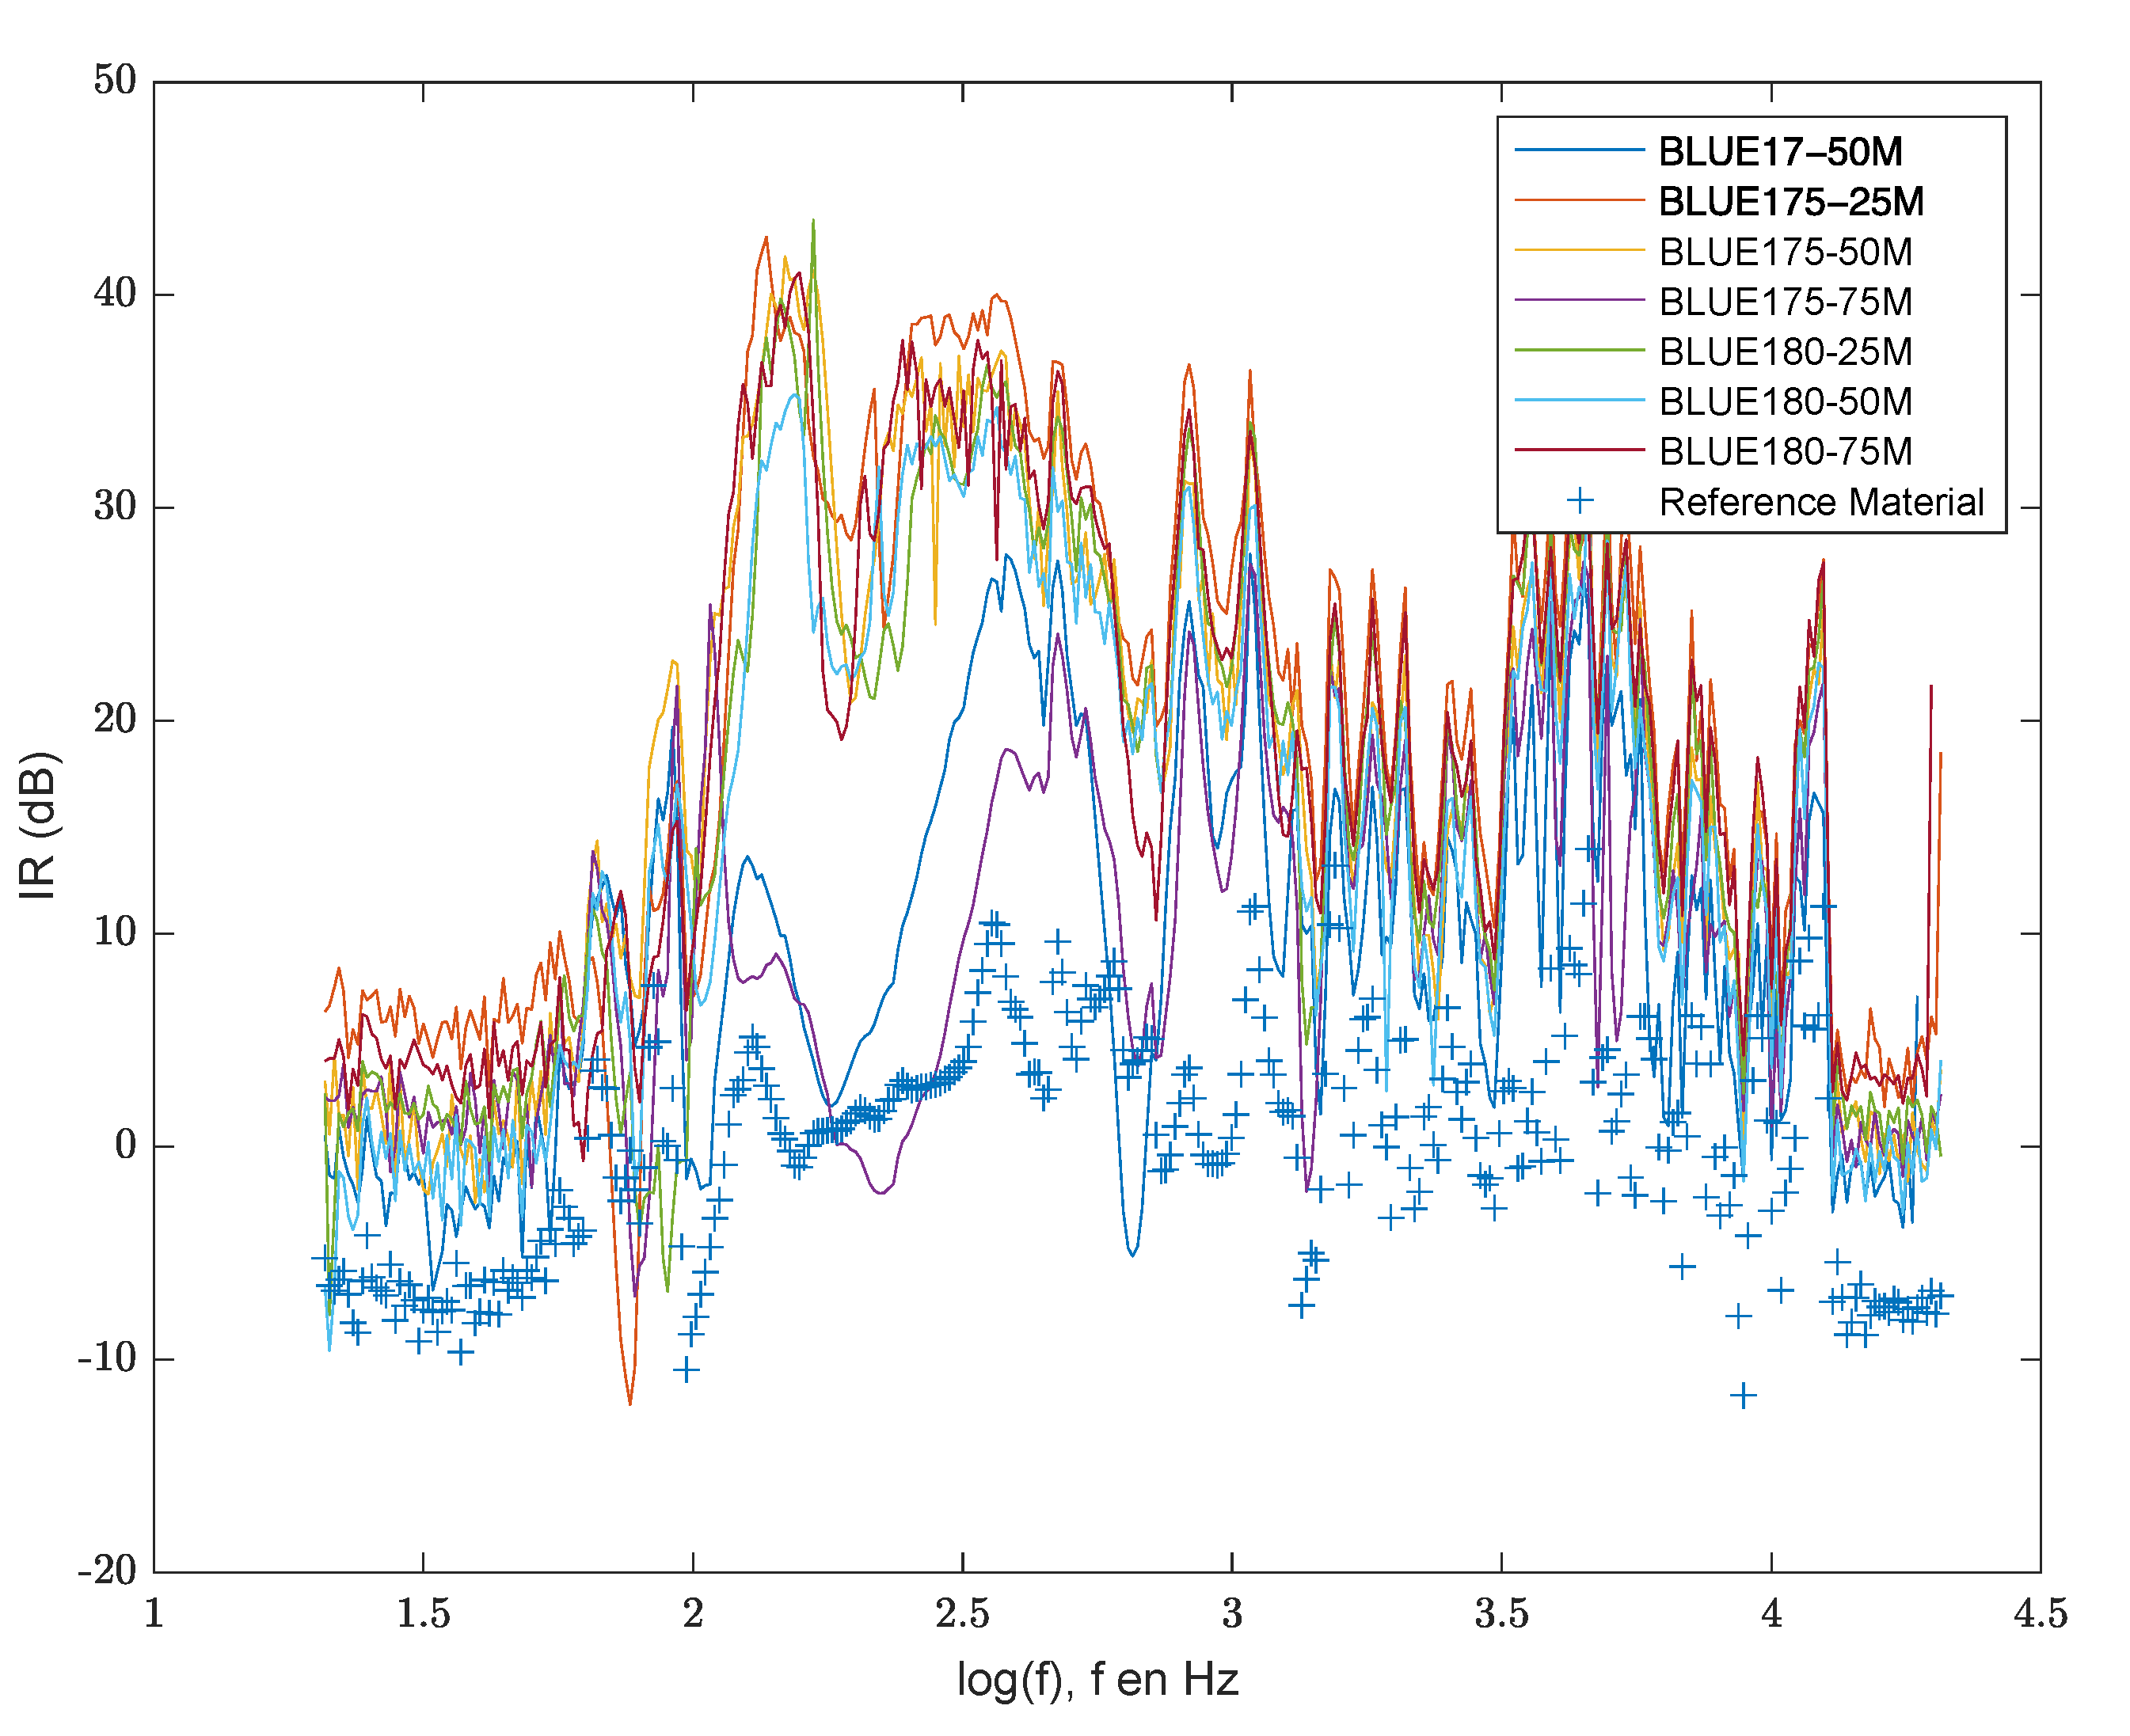
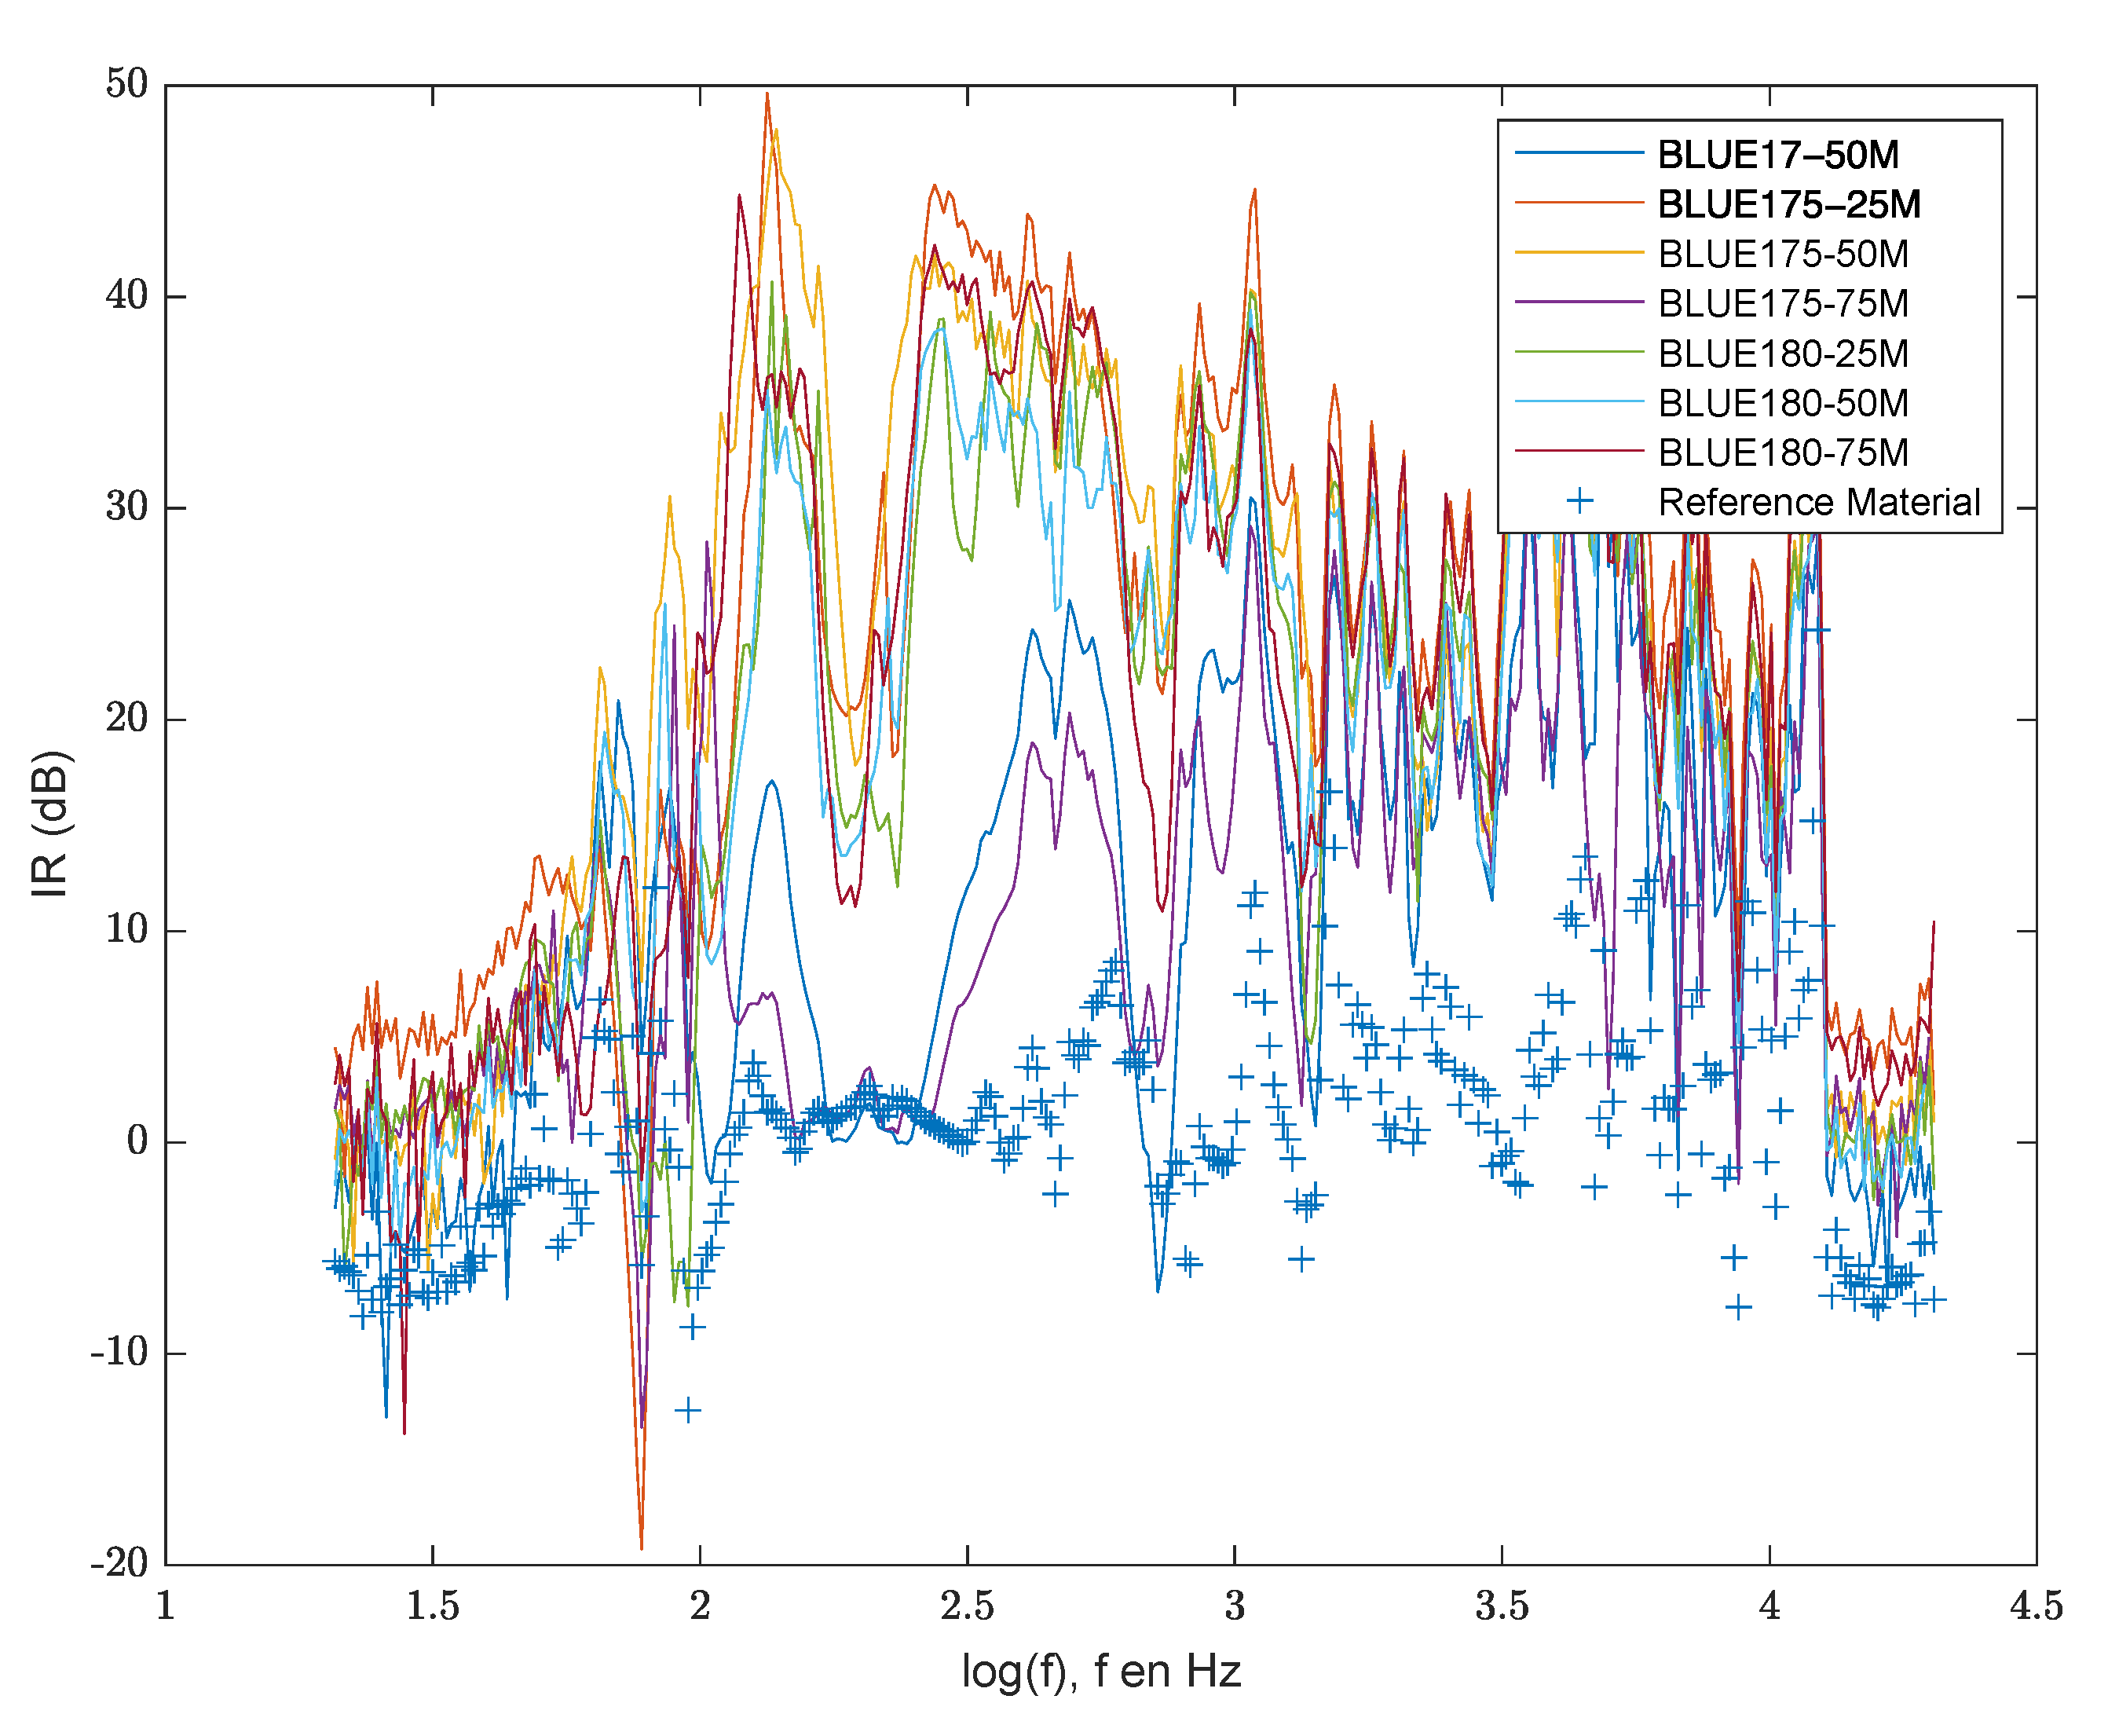
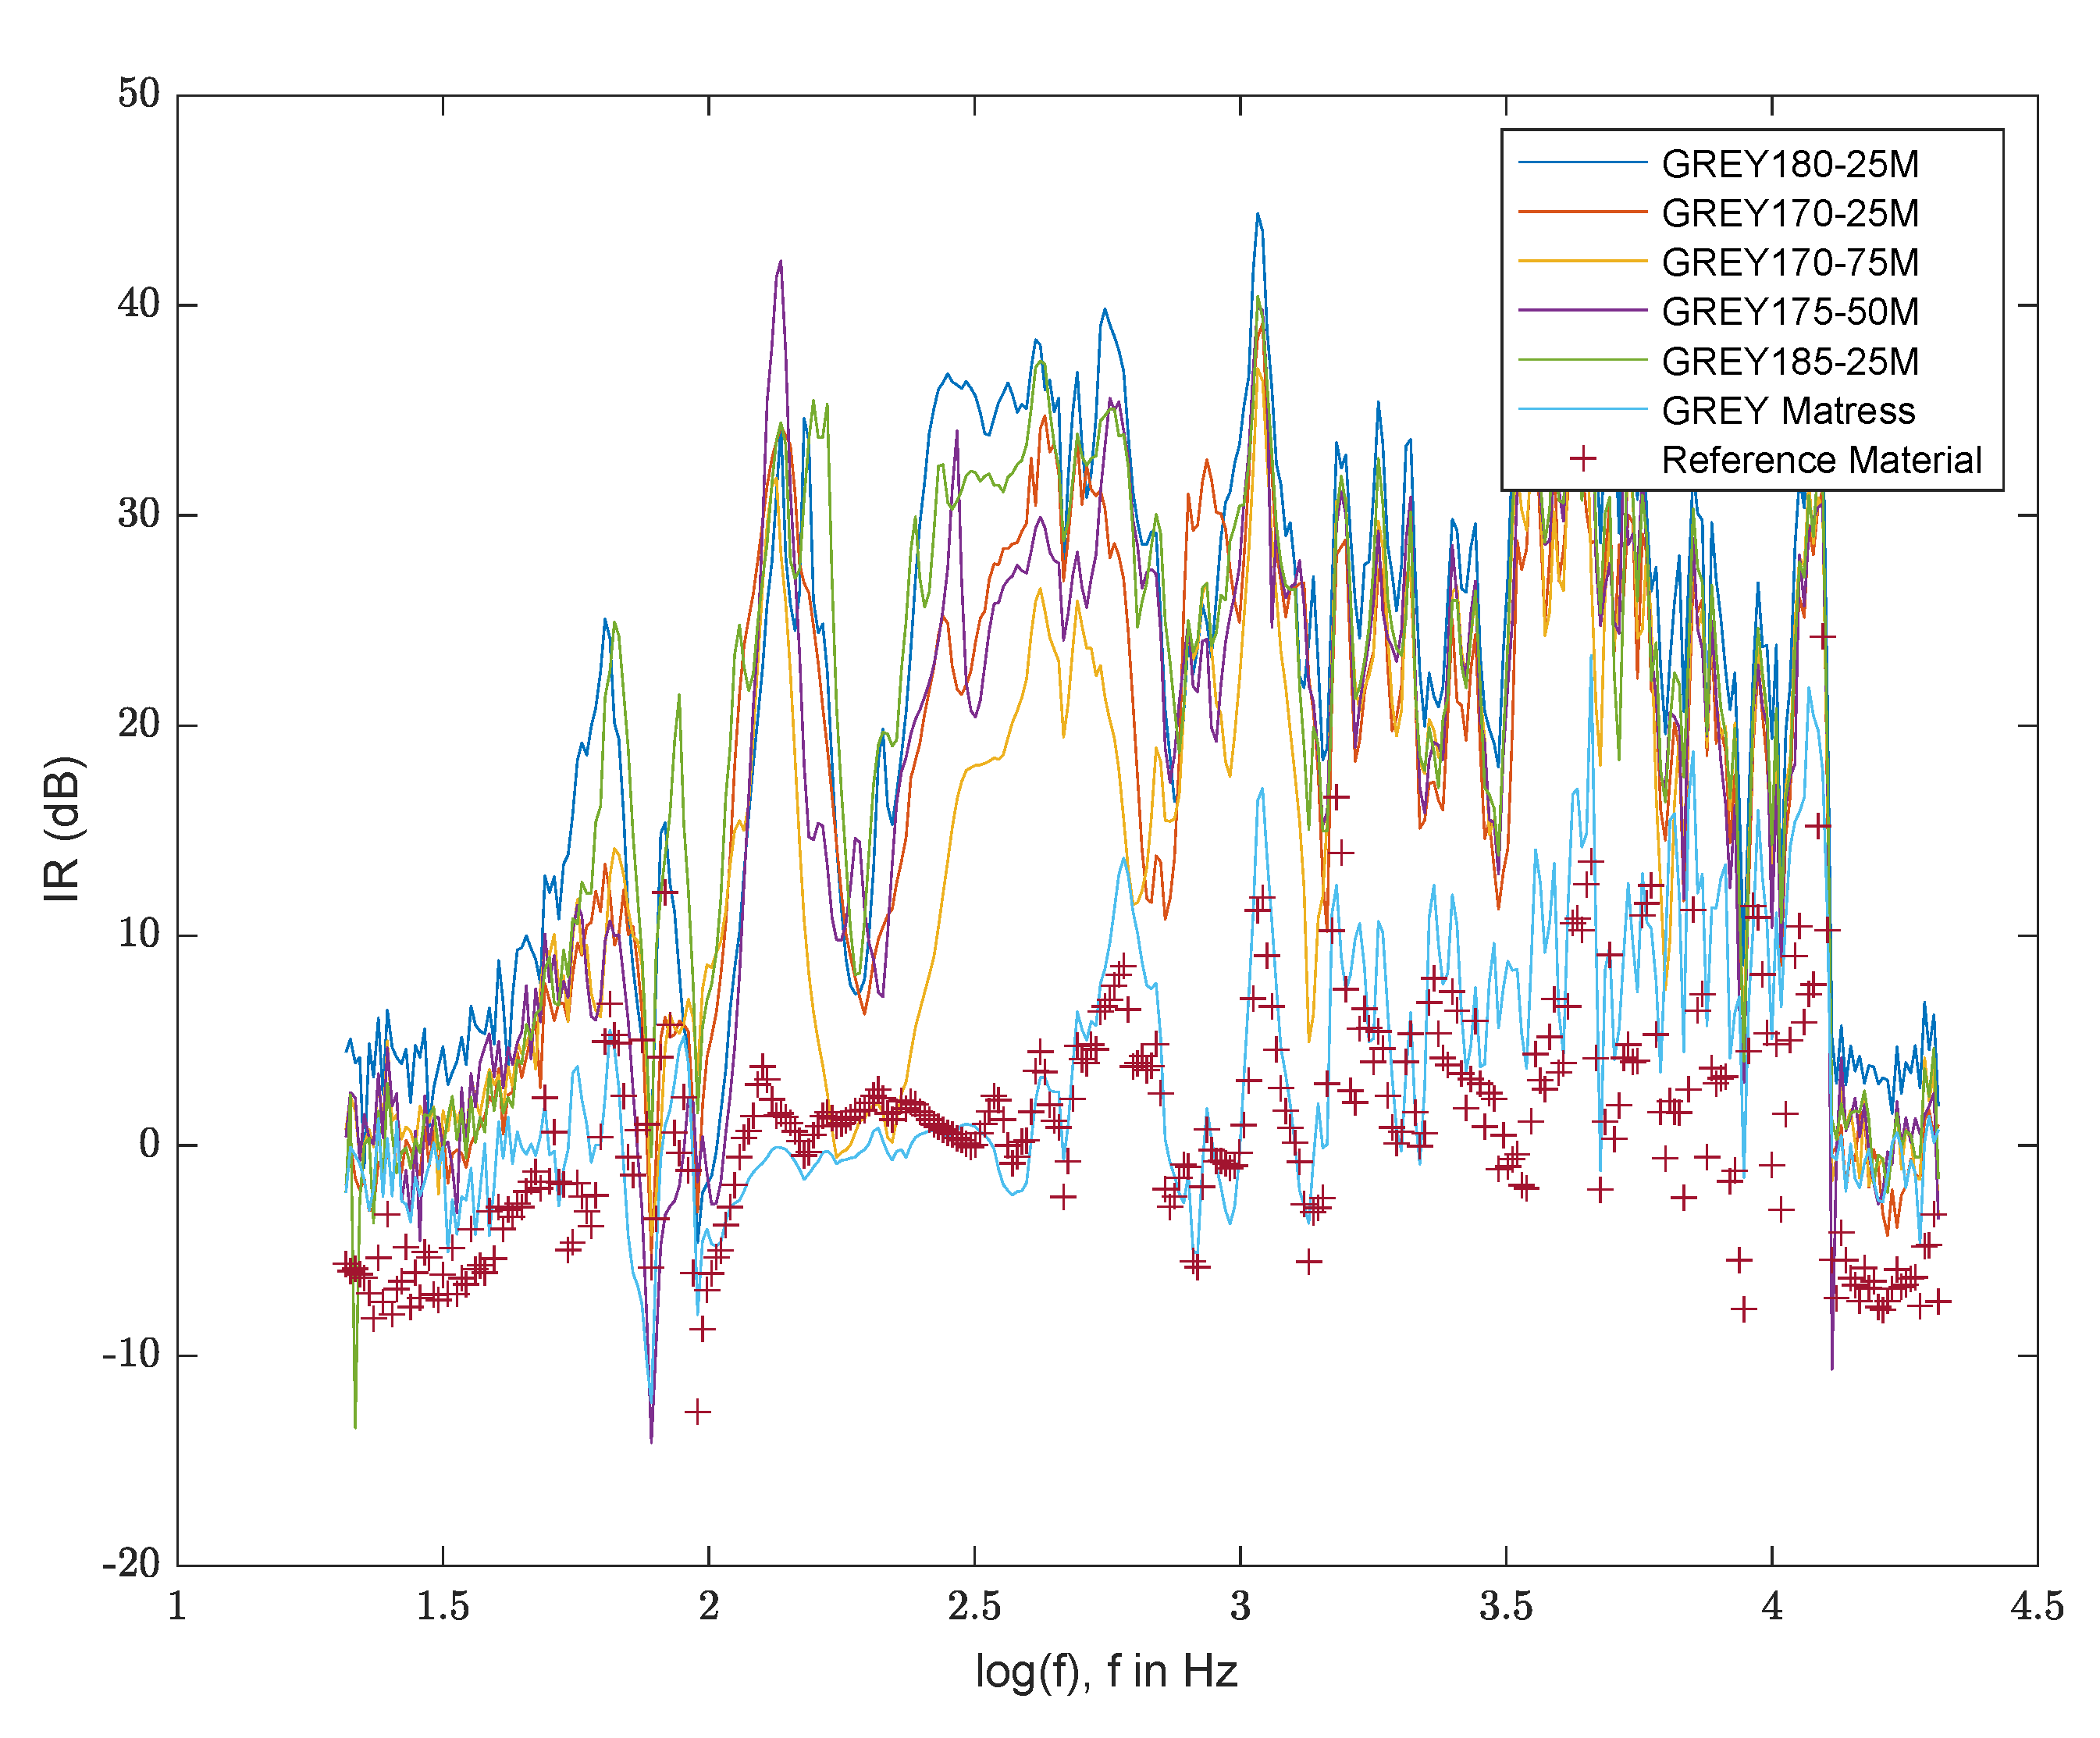
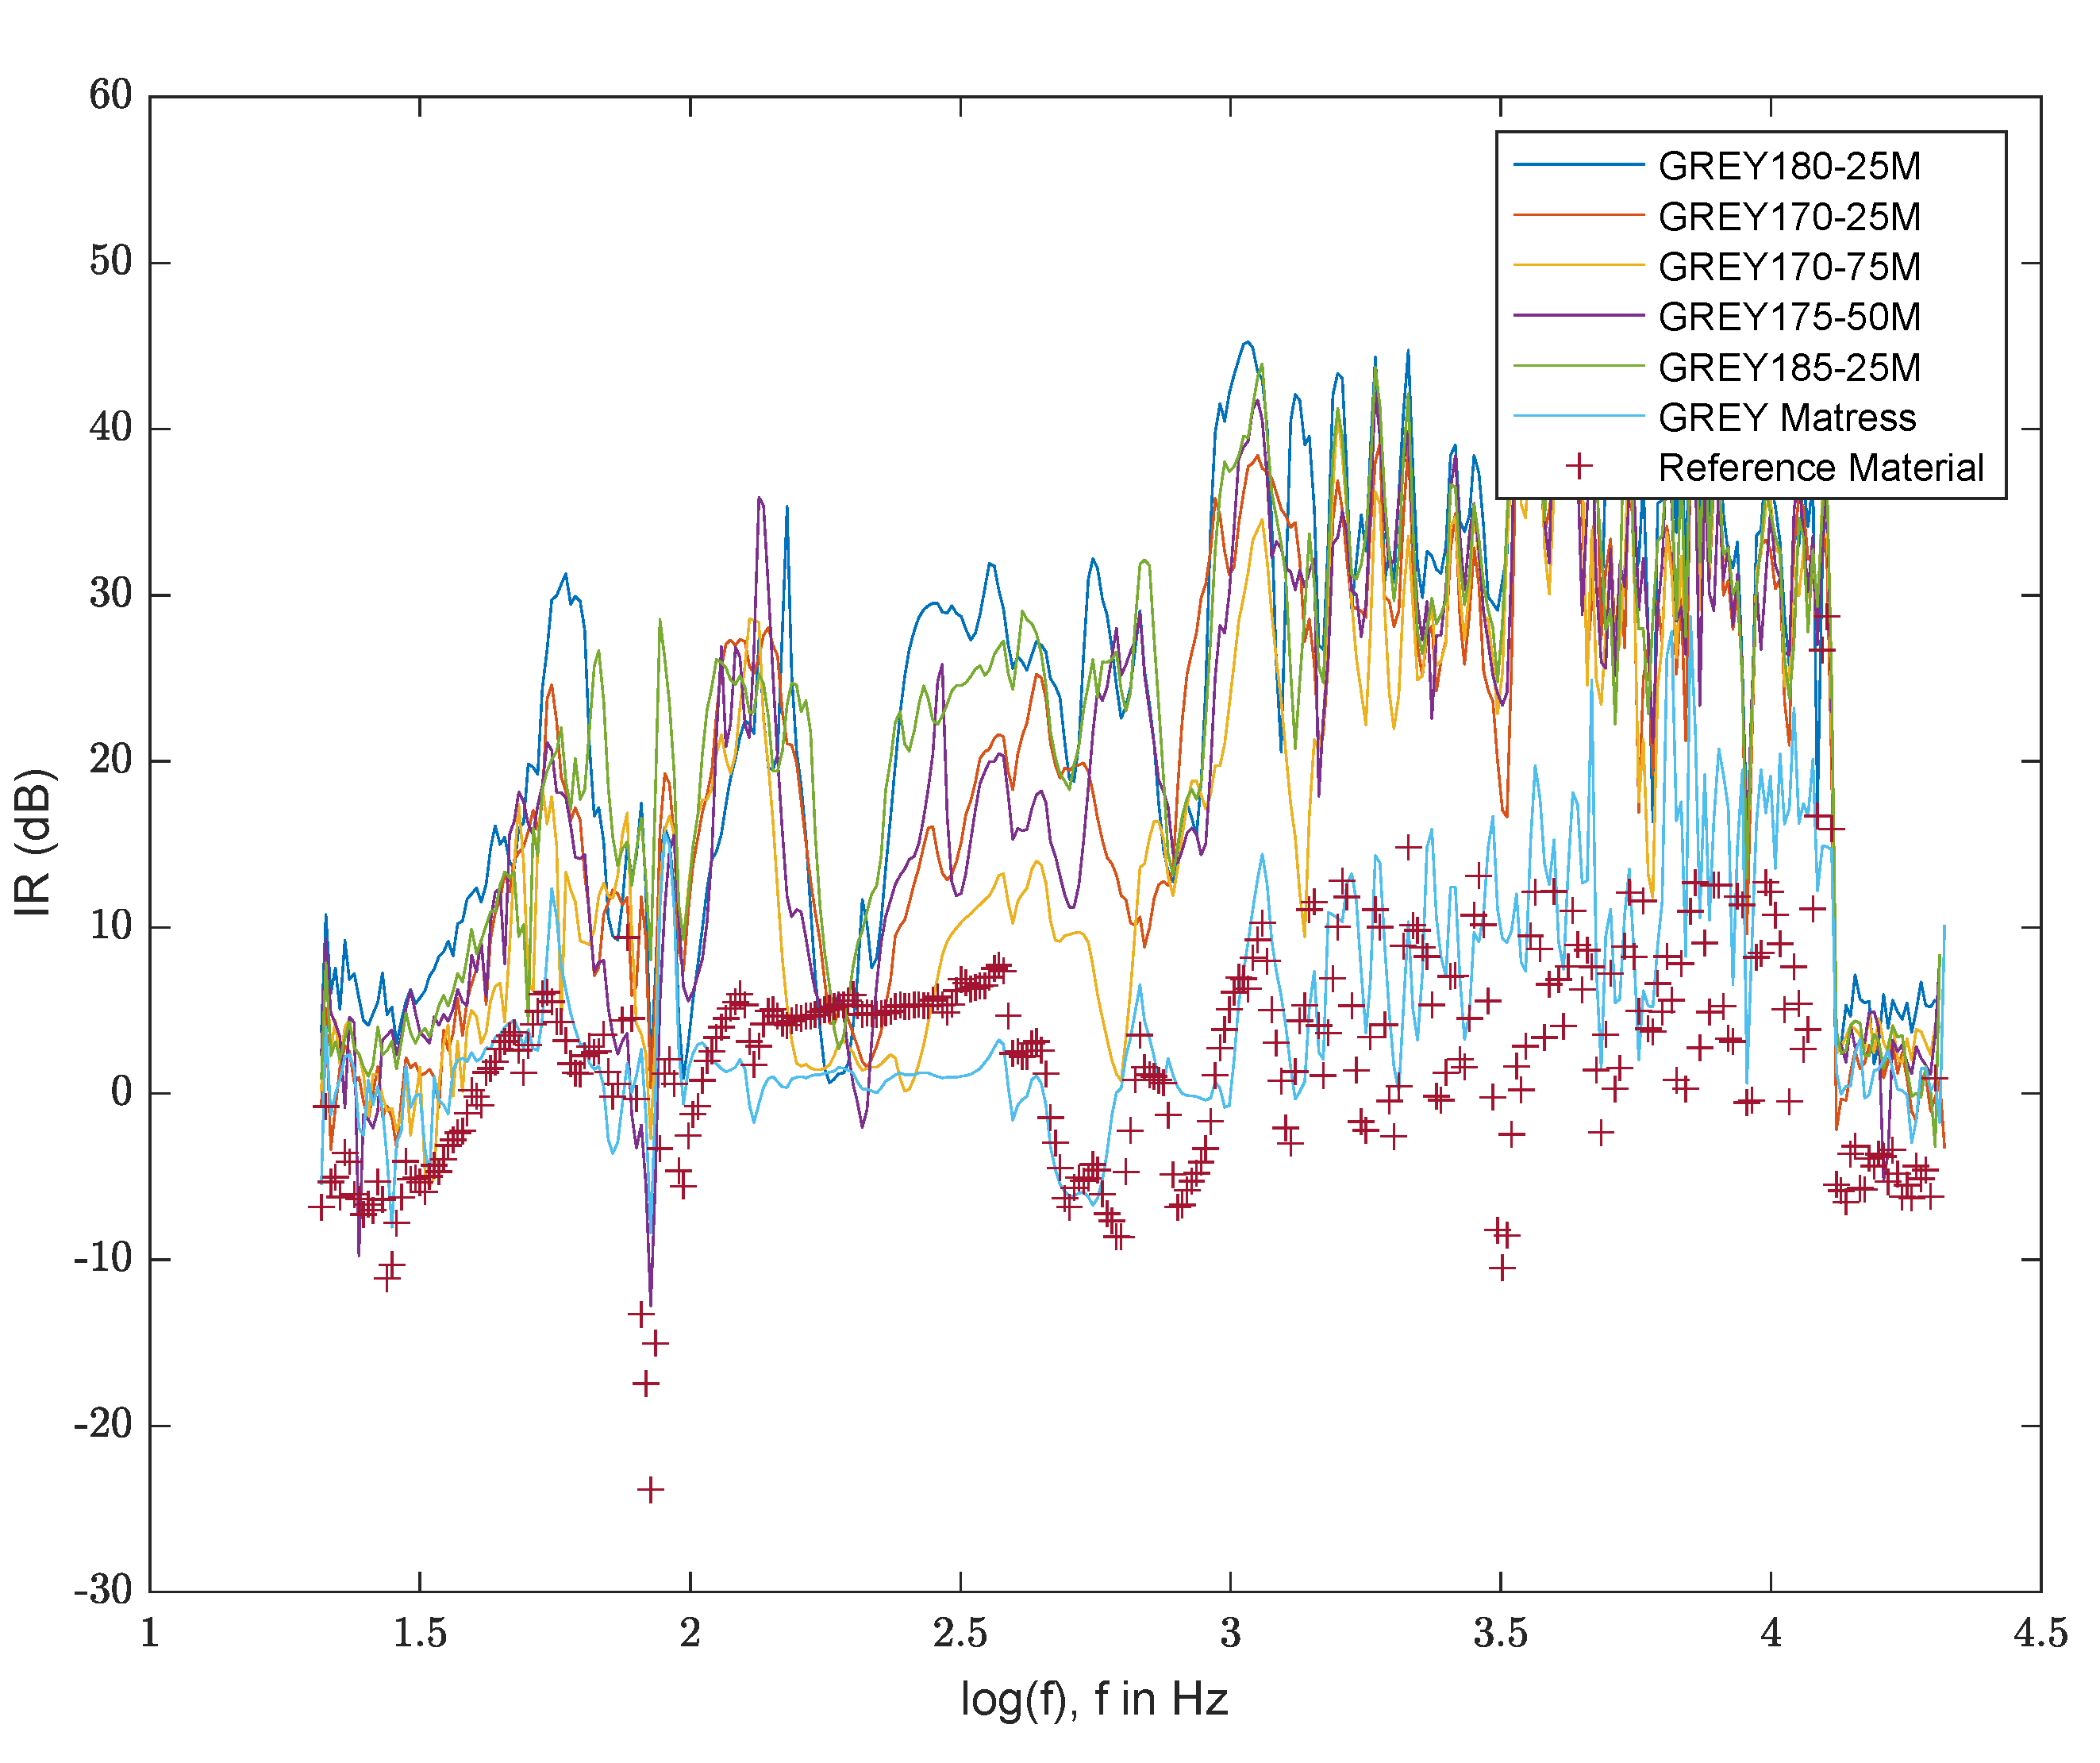
As can be seen in previous figures, different IRs are obtained for different frequencies, as well as the different runs performed at various volumes. The values of the IR for the different volumes are similar at a fixed frequency. Nevertheless, an average index can be calculated as the average of all the data obtained, since, as previously indicated, millions of pieces of data were obtained. In turn, an average index between the three previous ones, has also been calculated and, finally, the maximum reduction index registered by each of the briquettes has been obtained, and the frequency at which said maximum index has been obtained. These data were also calculated for both uncompacted foams and for the reference material. The results obtained are shown in
Table 2.
Table 2 also shows the results obtained for the different physical properties of the material, such as apparent density, porosity, and the compaction factor. All the reduction indices obtained are also included, as well as the frequency at which the maximum IR were obtained.
In the previous table, uncompacted foams with a thickness of 9 mm were also tested, a thickness similar to that of the briquettes obtained in the different experiments. Additionally, for comparison, acoustic measurements were taken for a sample of the blue foam with a much greater thickness, in this case 35 mm. It can be seen how the reduction indices obtained are considerably higher.
Regarding porosities, it can be seen that porosity of the uncompacted materials is very high, i.e., a lot of void volume is present in these materials. In addition, it can be observed that the highest porosity was recorded for the briquette made with grey VMF and with conditions of 170 °C and 25 MPa, while the lowest porosity is that of the blue briquette obtained with 180 °C and 50 MPa applied. Briquettes produced at 180 °C or higher usually present a lower porosity than the briquettes obtained at a higher temperature, with the exception of the porosity value of 0.8491, obtained in a blue briquette made at 180 °C and 25 MPa.
As far as the apparent density of the briquette is concerned, in
Table 2 it can be seen how the highest density recorded is that obtained in a grey briquette produced with a temperature of 180 °C and 25 MPa, followed closely by that obtained in the blue viscoelastic foam briquette manufactured at 175 °C and 50 MPa. On the other hand, the lowest density is found in the blue briquette produced at 170 °C and 50 MPa.
Dealing with the compaction factor, grey briquettes have uniformity in their FW values and are also lower than most of the compaction factors obtained for the blue briquettes. With this, it can be stated that the blue foam compacts better than the grey viscoelastic foam.
Regarding the IR obtained, the reference material used registers very low reduction indices, so it would not serve as an acoustic insulator. In turn, we can see how the reduction rates increase as the audio volume increases in almost all tests. This may be due to errors in the data collection method, which will be more reliable at higher volumes.
Regarding the maximum IR obtained for each of the materials, for the grey viscoelastic foam we find the highest reduction index in the briquette obtained at 180 °C and 25 MPa, although in this material similar maximum indices have been obtained for all the briquettes. Regarding the blue foam, we observe that the highest was obtained by the briquette manufactured at 175 °C and 25 MPa, and that there are two briquettes that have lower maximum reduction rates, which are those produced at 170 °C and 50 MPa of pressure, since 175 °C and 75 MPa; as for the rest of the briquettes, they had very similar values.
Search for Correlations
Regarding the variation of IR with the different physical properties, different graphic representations have been made. IR values obtained at volume 6 were used for this purpose, since this was the maximum volume at which the amount of sound isolated by the briquette can be better appreciated. Reduction indices vs. porosity was represented (
Figure S19). It can be seen how the evolution of the points does not follow a clear trend, although in the briquettes with a greater porosity, reduction indices of around 20 dB have been obtained. Looking at the data, briquettes with a lower porosity tended to have a higher reduction index.
In addition, a representation of IR vs. apparent density was completed (
Figure S20). As in the previous case, the data obtained do not follow any trend. Even so, it can be seen how the blue foam tends to have higher reduction rates for apparent density values that are very similar to the grey foam. Again, the data obtained for the grey foam are more consistent than for the blue foam. Despite the lack of a clear trend, we can see that in most cases as apparent density increases, the reduction rate tends to increase.
Finally, a similar study has been carried out with the compaction factor (
Figure S21). As previously mentioned, the compaction factor of the blue viscoelastic foam is greater than that obtained for the grey foam. As far as the reduction indices are concerned, in both foams these indices tended to increase with the compaction factor, but there are too many exceptions that cause a clear trend to not be followed again to be able to carry out an in-depth analysis.
Observing both
Table 2 and all the representations of the previously mentioned reduction indices, the highest reduction index recorded in the experiments carried out with the blue foam was in the briquette processed at 175 °C and 25 MPa, followed by that obtained at 175 °C and 50 MPa. Regarding the grey foam, the highest reduction index was registered in the briquette that was manufactured at 180 °C and 25 MPa.
5. Conclusions
When analyzing the compaction factors obtained for each material, the blue foam clearly compacts much better than the grey foam. This could already be roughly appreciated by observing the briquettes obtained with each of the foams.
As far as the reduction indices are concerned, we did not find a great variation in their average values obtained for each of the materials, nor in their maximum values. Although, as previously mentioned, as the audio volume increases, the reduction rate increases, since it manages to retain a greater amount of sound.
Once all the parameters obtained have been analyzed, the optimal briquetting conditions for blue foam are 175 °C and 25 MPa, while for grey foam they are 180 °C and 25 MPa.
Even so, the reduction indices obtained for the briquettes may indicate that it is possible to manufacture acoustic insulation by recycling mattresses, which, as mentioned in the introduction, is a severe problem due to the difficulty in managing this type of waste. In fact, the reduction indices with prepared briquettes are much higher in the frequencies that most affect the human ear, compared to a reference insulating material.
In this way, the present work shows that it is possible to reuse VMF mattress waste as building insulation materials. Since mattresses are one of the most problematic types of waste (bulky waste), policies for the reuse of these materials in newly built buildings should be implemented.
The study has certain limitations, among them the minimal relationship that exists between the briquetting conditions and the sound response of the materials. This may be because experimentally it is very difficult to maintain a constant temperature in the equipment used throughout the briquetting process.
