Article

Correlation between the Fluctuations in Worldwide Seismicity and Atmospheric Carbon Pollution

by
Alberto Carpinteri
and
Gianni Niccolini
*
Department of Structural, Geotechnical and Building Engineering, Politecnico di Torino, 10129 Turin, Italy
*
Author to whom correspondence should be addressed.
Submission received: 10 September 2018 / Accepted: 19 September 2018 / Published: 2 January 2019

Abstract

:
The crucial stages in the geochemical evolution of the Earth’s crust, ocean, and atmosphere could be explained by the assumed low-energy nuclear reactions (LENR) that are triggered by seismic activity. LENR result in the fission of medium-weight elements accompanied by neutron emissions, involving Fe and Ni as starting elements, and C, N, O as resultants. Geochemical data and experimental evidences support the LENR hypothesis. A spectral analysis of the period 1955–2013 shows common cycles between interannual changes in atmospheric CO2 growth rate and global seismic-moment release, whereas the trending behavior of the atmospheric CO2 was in response to the anthropogenic emissions. Assuming a correlation between such seismic and atmospheric fluctuations, the latter could be explained by cycles of worldwide seismicity, which would trigger massively LENR in the Earth’s Crust. In this framework, LENR from active faults could be considered as a relevant cause of carbon formation and degassing of freshly-formed CO2 during seismic activity. However, further studies are necessary to validate the present hypothesis which, at the present time, mainly aims to stimulate debate on the models which regulates atmospheric CO2.

1. Introduction

Several geochemistry studies have demonstrated that the Earth’s crust and atmosphere have undergone significant changes in their chemical composition over the last 4.5 billion years [1,2,3,4,5,6,7,8,9,10]. Undoubtedly, one of the basic characteristics of the early stages of the Earth’s formation was the presence of a highly toxic primordial atmosphere, very different the current one, of which the origin is still being investigated. Various hypotheses have been formulated regarding the variation in the atmospheric composition over the Earth’s lifetime such as degassing from volcanism [11,12,13,14,15], heavy bombardment by asteroids [16,17], and production of free oxygen by cyanobacterial photosynthesis leading to the Great Oxidation Event [18,19,20], but none of them are fully convincing and conclusive.
On the other hand, the changes in element concentrations appear to be intimately correlated to the Earth’s tectonic activity. Recent data on the composition time variations in the Earth’s atmosphere have shown that CO2 and H2O concentrations in the atmosphere increased dramatically during the Archean era, occurring 3.8 to 2.5 Gyr ago, between the tectonic plate formation and the most severe tectonic activity. This primordial carbon pollution is related to decreases in the concentrations of Fe and Ni as well as to increases in the concentrations of Si and Al that occurred in two step-wise transitions: 3.8 Gyr ago, at the beginning of tectonic activity, and then 2.5 Gyr ago, during the period of the most severe tectonic activity [21,22,23,24,25,26], as shown in Figure 1.
Successively, between 2.5 and 2.0 Gyr ago, N2 and O2 concentrations increased sharply (Great Oxidation Event) in concomitance with the most relevant formation of the Earth’s continental crust [18,19,20]. Thus, a significant coupling appears between the periods of intense tectonic activity and the sudden increments of CO2 (and H2O), occurred 3.5 Gyr ago, and later, 2.5 Gyr ago, of N2 and O2 levels, in the atmospheric composition over the Earth’s lifetime [1,19,20] (see Figure 2).
The chemical balances underlying the geochemical evolution of the Earth’s crust, ocean, and atmosphere can be considered as indirect evidences of recently hypothesized low-energy nuclear reactions (LENR) [27,28,29,30,31], occurring massively in the Earth’s crust during periods of intense tectonic activity, and hierarchically organized into two different sets (see Tab. 12.2 p. 176 in [27]):
Fe26, Co27, Ni28 → Mg12, Al13, Si14 → C6, N7, O8
where the atmospheric elements (C, N, O) can be regarded as results of the second set of reactions, involving Si, Al, and Mg as starting elements. In particular, the estimated Mg increment (3.2%, according to [22]) is equivalent to the carbon content in the primordial atmosphere (particularly high in the form of CO2 and CH4). The second set of reactions in Eq.(1), involving Mg as the starting element and C as the resultant, can be regarded as an alternative or a competing mechanism with volcanic degassing [11,12,13,14,15] by which tectonic forces added CO2 to the atmosphere toward the end of the Hadean period [27,32].
Interestingly, a comparison between a very rough estimate and experimental evidences seems to support this hypothesis. First, assuming a mean density equal to 3.6 g/cm3 and a thickness of ~60 km of the Earth’s proto-crust, the mass increase in Mg (~3.5 × 10²¹ kg, corresponding to 3.2% of the mass of the proto-crust involved in the reaction), and therefore in C, implies a very high atmospheric pressure. Given a terrestrial surface area of 5.1 × 10¹⁴ m2 and conjecturing the same gravitational acceleration for the proto-Earth, a tentative value of ~660 atm was obtained for the atmospheric pressure. This very high value, which is plausible and consistent with the conditions prevailing between 3.8 and 2.5 Gyr ago, is corroborated by models presented for a CO2- and CH4-rich primordial atmosphere that had ground level pressures of some hundred atm (~650 atm, as was the value reported in [1]).
Furthermore, significant neutron emissions have been measured, both at the Earth’s crust scale, during earthquake preparation stages (Figure 3) [33,34,35,36], and at the laboratory scale, during crushing tests on non-radioactive rock specimens.
In the laboratory experiments, neutron and other forms of energy emissions were measured in correspondence to micro- and macro-fracturing [37,38,39,40,41], with the final considerable reduction in the Fe content consistently counterbalanced by an increase in the content of Al, Si and Mg [29,31]. Further evidence supporting the link between seismicity and variations in the atmospheric CO2 is the spatial organization of the CO2 release from the ground in the Himalayas, Nepal, which were apparently controlled by large earthquakes [42].

2. Atmospheric CO2 and the Carbon Cycle

Carbon dioxide is an integral part of the carbon cycle, in which carbon is exchanged between the Earth’s oceans, soils, rocks, and the biosphere at two different rates: the slow carbon cycle, which involves geochemical processes between the atmosphere, oceans, soils, rocks and volcanism; and the fast carbon cycle, which refers to the movement of carbon between the environment and living organisms in the biosphere, including photosynthesis and respiration [43]. The slow-rate geochemical processes, including the formation and burial of carbonates, the burial of organic matter (on land or in the ocean), and volcanism have largely determined the flow of CO2 into and out of the atmosphere on multi-million-year time scales. As currently accepted, the reduction of atmospheric CO2 caused by these burial processes appears to be bound by tectonic processes, which return the carbon from the Earth’s mantle and crust to the atmosphere through volcanic degassing (which became less frequent as the Earth’s mantle progressively cooled). Later, the flow of atmospheric CO2 began to be controlled by other natural processes such as the origin and the expansion of forests, which caused increased burial of organic carbon by photosynthesis, and the respiration of living organisms, which added CO2 back into the atmosphere [44,45].
In the pre-industrial era, the flow of atmospheric CO2 was considered to be largely in balance, with natural sources of CO2 nearly balanced by natural CO2 sinks. Since the Industrial Revolution however, anthropic activity has perturbed the carbon cycle due to the direct addition of carbon to the atmosphere from the burning of fossil fuels and land-use changes (mainly deforestation). According to carbon cycle models [46], about 57% of the anthropogenic CO2 emissions should be removed from the atmosphere by the biosphere (vegetation and land) and oceans, which behave as carbon sinks.
As current atmospheric CO2 levels exceed measurements from the last 800,000 years, according to artic ice core measurements [47], and are rising quickly, anthropogenic perturbation of the global carbon cycle is considered to be the only attributing factor to the dramatic increase in CO2 as well as that of the other greenhouse gases of the contemporary Earth’s atmosphere [48,49]. In accordance with this paradigm, the global carbon budget, describing the exchanges of CO2 between the atmosphere and the other major carbon reservoirs, is currently given by the following balance equation:
atm growth = fossil fuel + land use change − ocean sink – land sink
where geochemical terms are usually neglected, as their rate is considered too slow to have some relevance on the atmospheric CO2 concentration over hundred- or thousand-year timescales, or because they became relatively infrequent, like volcanism. However, some doubts remain regarding the balance of this equation, because the ocean sink is estimated by a combination of global ocean biogeochemistry models and the land sink is often estimated from the residual of the other budget terms [48]. With regard to the latter point, recent studies suggest that the role of tropical forests may have been previously very poorly quantified, and indicate a terrestrial tropical carbon sink larger than the previous estimates [50,51]. Accounting for this finding while balancing the global carbon cycle implies that the currently considered carbon sources are larger [52], and/or that other carbon sources need to be considered in the budget. It must be said that some extra sources, missing in the balance, can also be caused by the human activity, such as the increasing acidification of the oceans, which makes them carbon sources as well.

3. Data Analysis

When observing the relationship between the anthropogenic CO2 emissions and the atmospheric CO2 growth rate (compare diagrams in Figure 4A,C), plotted in GtC/year−1 from 1955 to 2013 (the choice of the period was motivated by the need for comprehensive and reliable data, available online at https://earthquake.usgs.gov/earthquakes/search/ and at http://www.globalcarbonproject.org/carbonbudget/archive.htm#CB20147), some evidences cast some doubts on the belief that anthropogenic emissions effectively drive all atmospheric CO2 growth [53,54,55]:
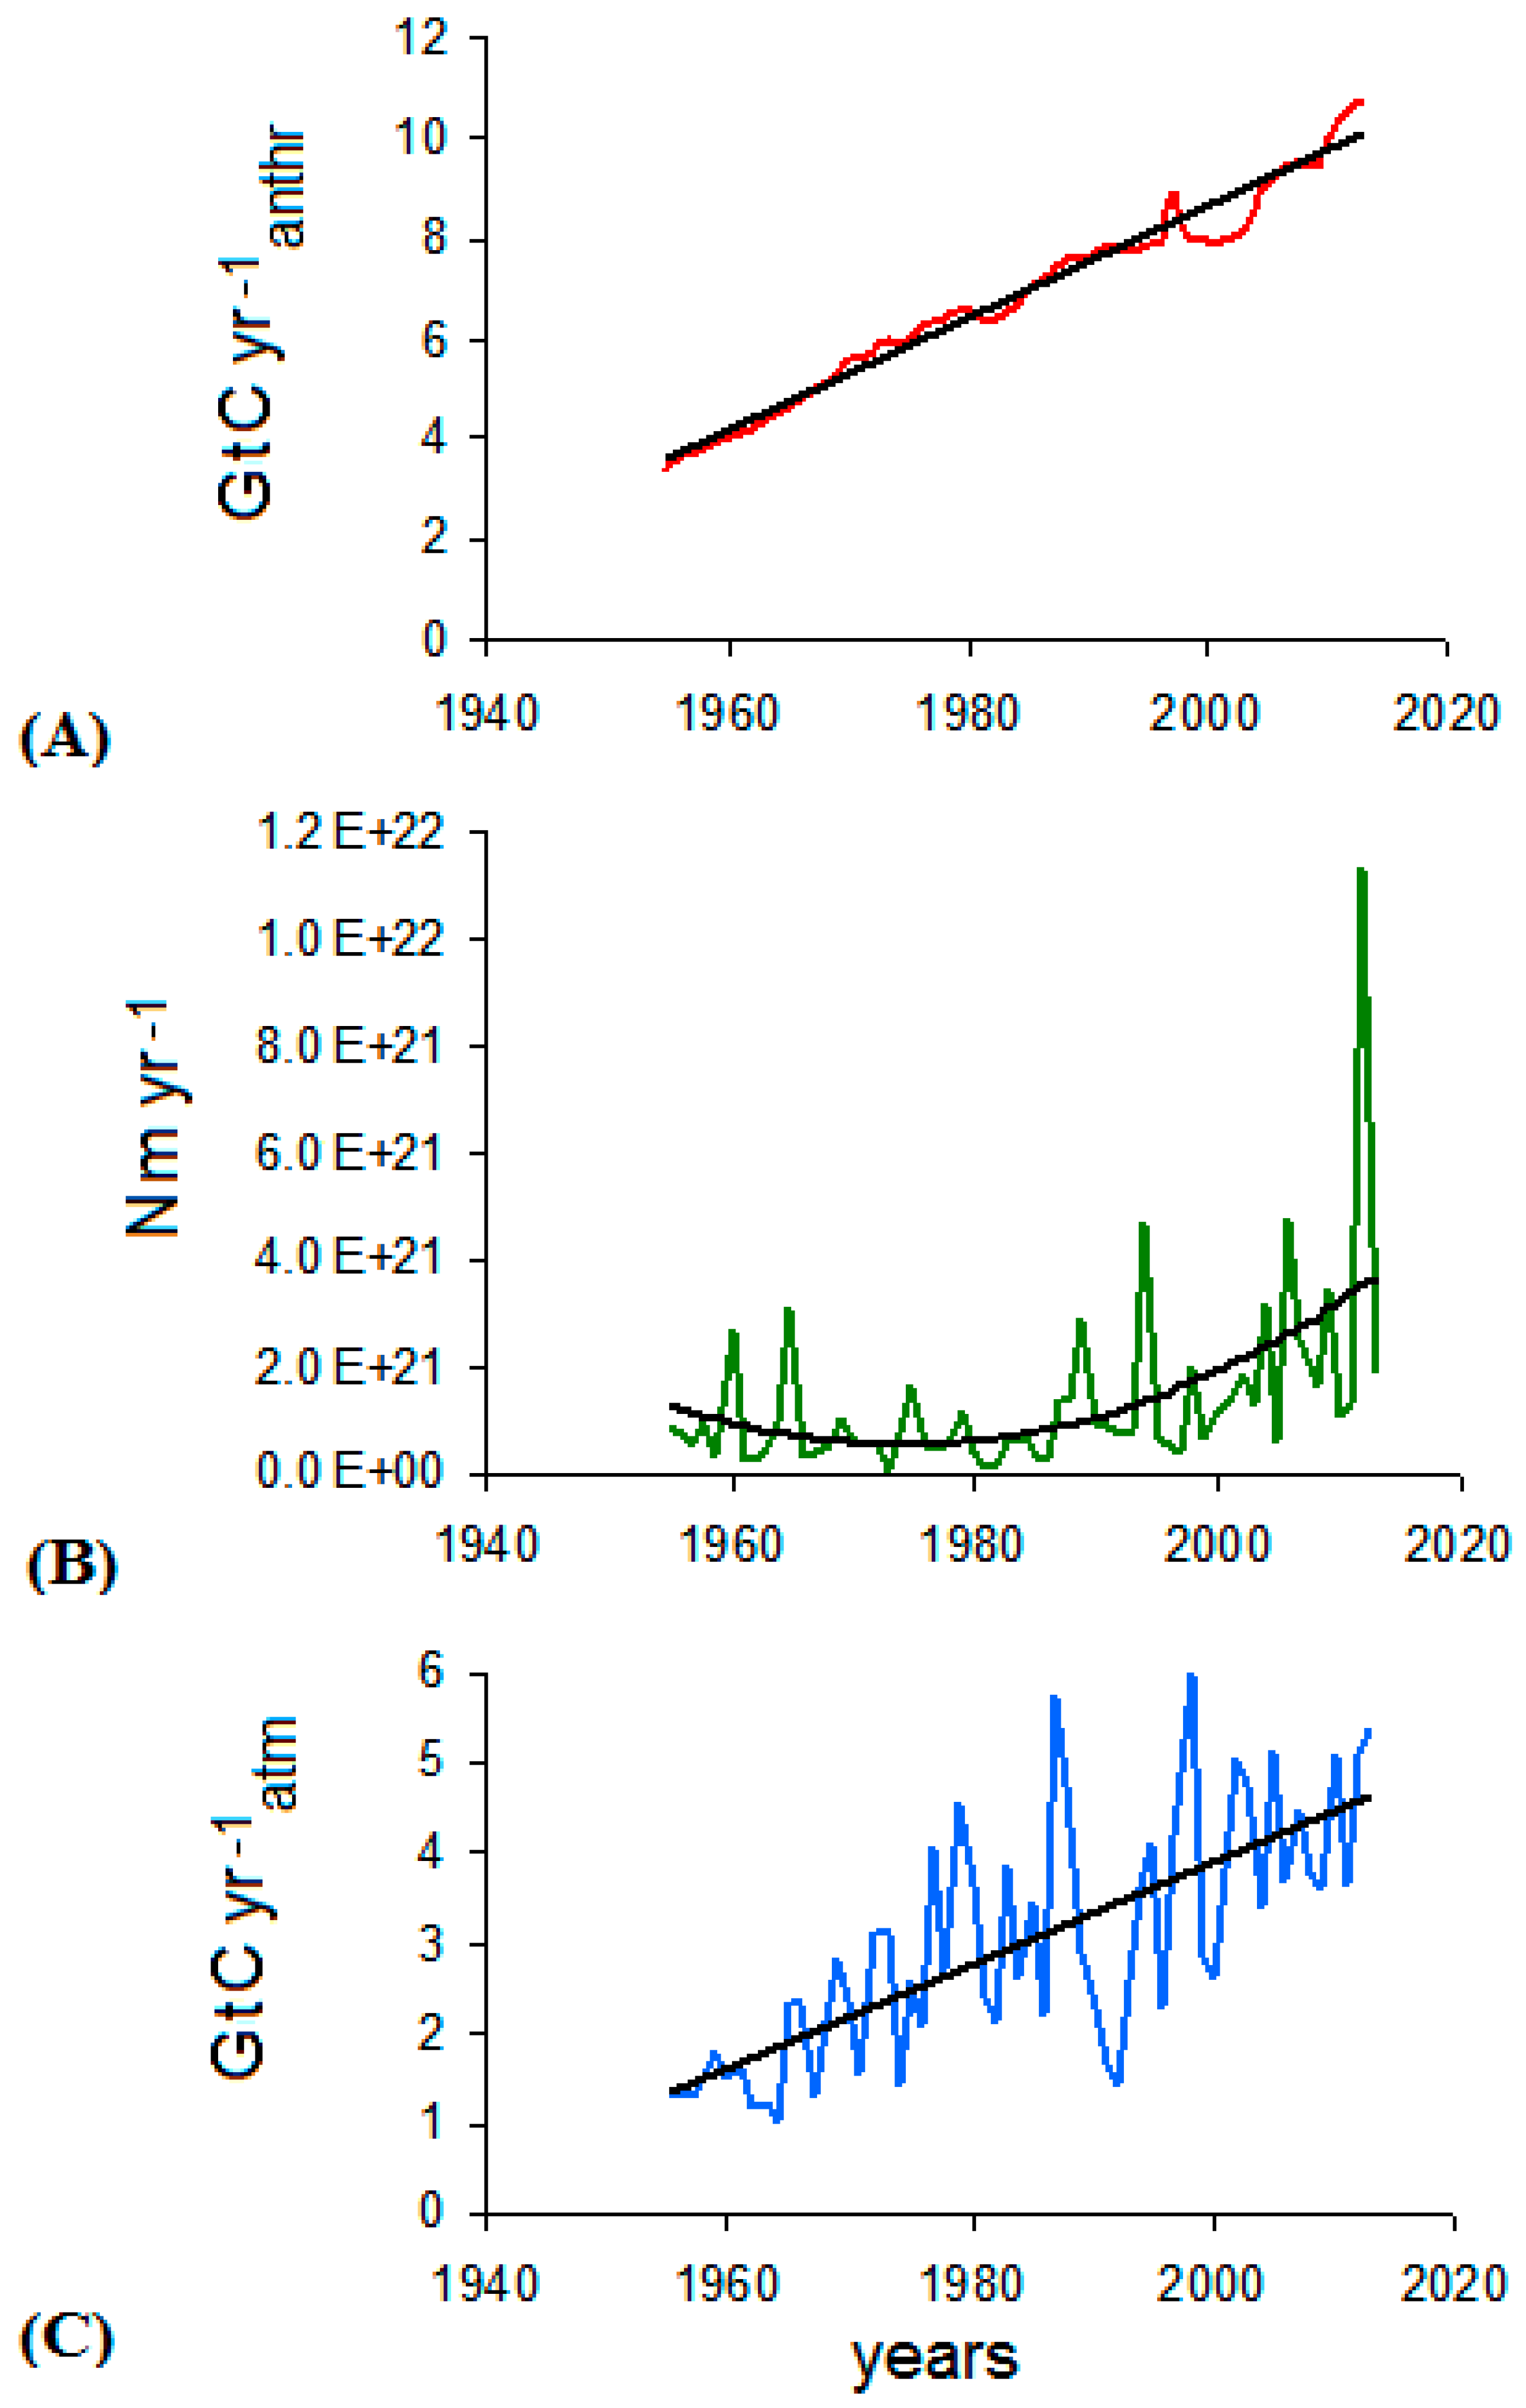
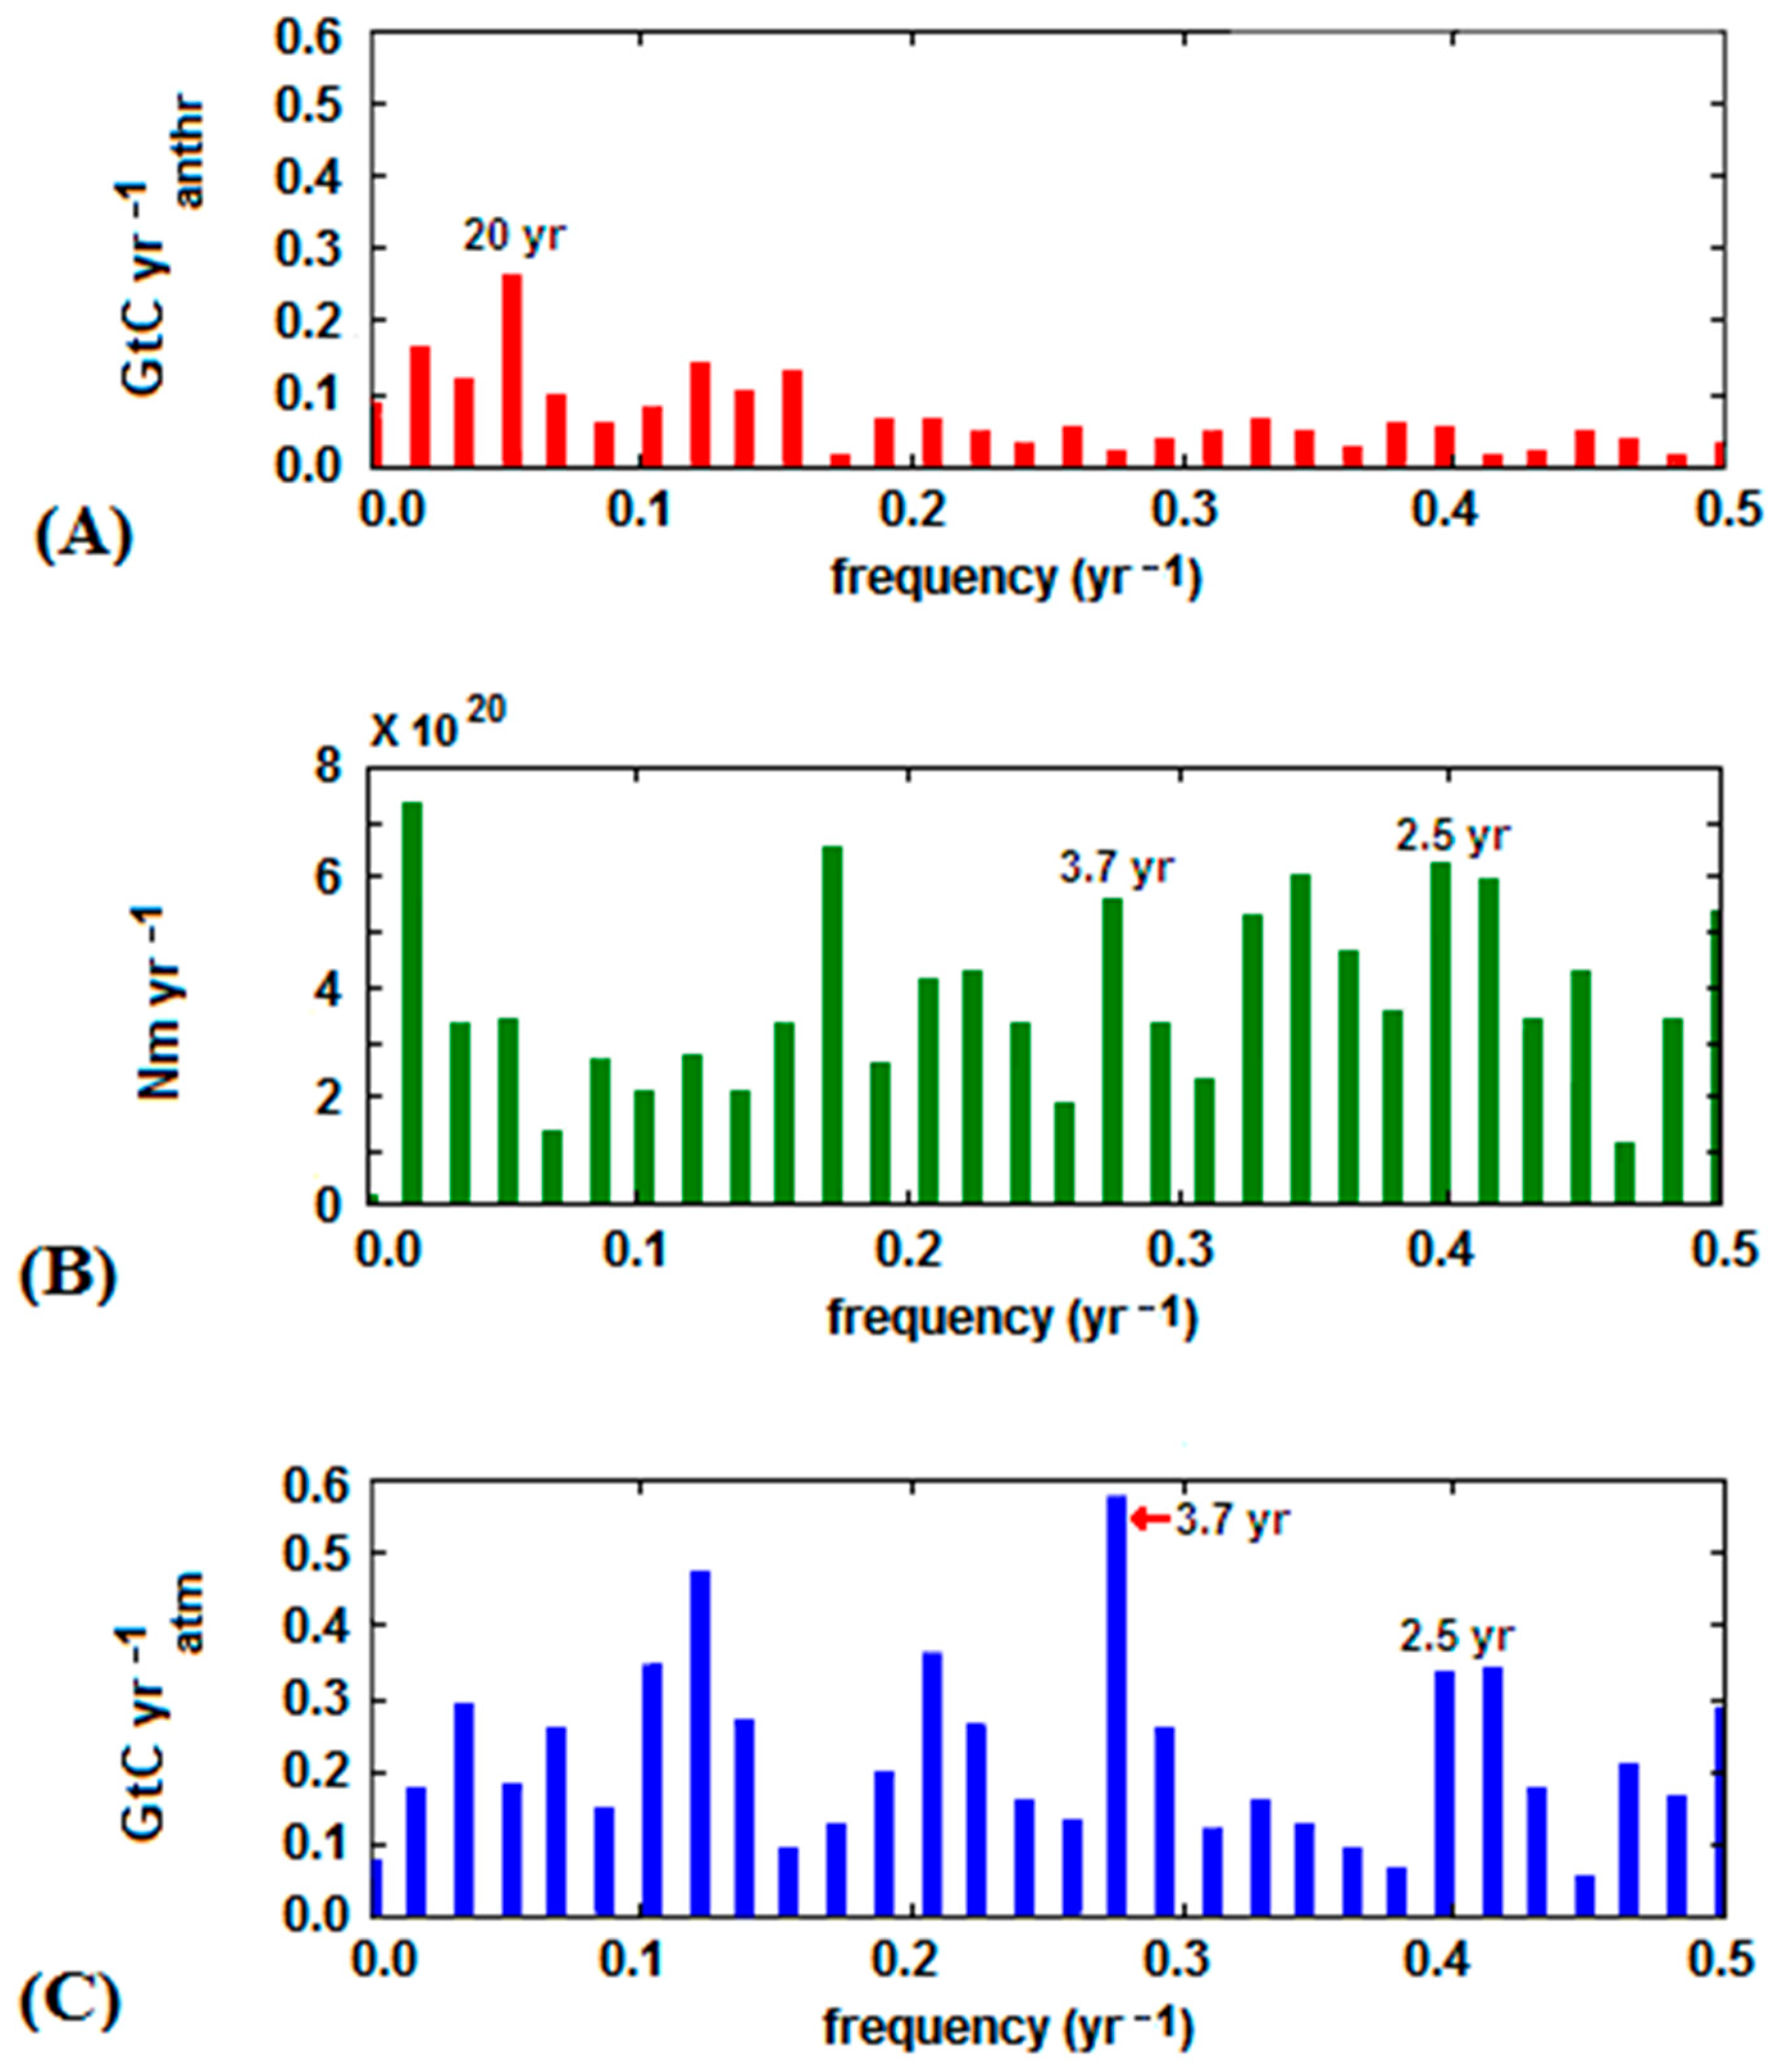
  • The significant acceleration in the anthropogenic emission rate, largely due to China’s contribution, observed since 2002 was not reflected in the analogous trend of atmospheric CO2, and yet continued its steady growth;
  • the downward trend of atmospheric CO2 was seen in some periods, especially from 1988 to 1993, despite the continuous growth of the anthropogenic emissions; and
  • intensive cyclic fluctuations around the trend line were observed for the atmospheric CO2 growth rate whereas the increase of the anthropogenic CO2 emission rate was smoother.
However, it can be argued that the atmosphere, as a part of a complex system which includes oceans and lands, may give a delayed answer to a perturbation, such as the change in CO2 emission. Instead, there are scientific evidences about changes in atmospheric composition connected to tectonic activity [56], and neutron emissions observed in correspondence to fracturing at the laboratory and Earth’s crust scales. Consistently, the hypothesized relationship between LENR and neutron emissions from active faults may be regarded as the principal cause of magnesium depletion and related carbon formation (according to table 12.2, page 176 in [27]) during events connected to tectonic plate formation. The consequent degassing of freshly-formed CO2 depends on concomitant factors, such as the presence of anomalous heat flux below Earth’s crust and crustal thinning. Furthermore, since there are evidences of big tectonic activity (with related extra CO2 emissions) which didn’t bring to any earthquake, it also has to be said that tectonic activity and earthquakes are not synonymous. However, it was worth investigating the possible relationship between the atmospheric CO2 growth rate and the global seismic-moment release rate (Nm/year−1, newton-meters per year), although several studies focused on temporary and localized CO2 emissions connected to seismic activity [57,58].
Accordingly, a comparison of the rates of anthropogenic CO2 emission, global seismic-moment release (calculated from data provided by the USGS Earthquake Hazards Program [59]), and atmospheric CO2 growth (refer to xls files in Global Carbon Budget Archive [48]) showed that all the considered time series display an upward trend, linear for atmospheric and anthropogenic data, but quadratic for seismic data (Figure 4A–C).
However, it is worth noting that anthropogenic CO2 emissions exhibited low-amplitude fluctuations when compared to those of the atmospheric CO2 growth rate (compare Figure 4A,C), that is, up to one order of magnitude smaller when considering peak-to-peak excursions.
A further comment results when considering the periodicities hidden in the fluctuations of the time series. The fast Fourier transform (FFT) analysis of residual data, obtained by subtracting the trend component (identified by a simple curve-fitting approach) from the actual data, showed that the low-frequency components (approximately lying in the 0–0.15/year−1 interval) in the anthropogenic emission spectrum prevail over higher frequencies. This was unlike more uniform mixtures of components in seismic-moment release and atmospheric CO2 spectra, where spectral peaks appeared at high frequencies as well (compare FFT diagrams in Figure 5).
As shown in Figure 5A, the anthropogenic time series exhibited a dominant spectral peak at 0.05/year−1, equivalent to a 20-year period, which did not correlate with the atmospheric CO2 fluctuations as this periodicity is not relevant in the atmospheric spectrum (observe the fourth spectral component of atmospheric CO2 data in Figure 5C). Conversely, the atmospheric fluctuations exhibited a main periodicity of 3.7 years that was almost absent in the anthropogenic emission spectrum. This discrepancy loosens, partly, the bond between anthropogenic emissions and the atmospheric CO2 growth rate.
Instead, the 3.7-year periodicity was relevant in both the atmospheric CO2 growth rate and in the seismic-moment release rate spectra, as well as other periodicities such as the 2.5-year spectral peaks (see Figure 5B,C). Then, residuals are subjected also to coherence analysis [60] to find out more systematically on which frequencies the spectral coherence appears between an input x(t) and an output y(t) time series, i.e., on which frequencies the output responds on the input. The spectral coherence Cxy(f) (or normalized cross-spectral density) is defined as:
Cxy(f) = |Gxy(f)|2·Gxx−1(f)·Gyy−1(f)
where Gxy(f) is the cross-spectral density between x and y, and Gxx(f) and Gyy(f) the auto-spectral density of x and y respectively. Here, Cxy(f) is calculated to estimate the degree of relationship between the perturbation x (the anthropogenic or the seismic time series) and the answer y (the atmospheric time series) in the frequency domain.
Coherence diagrams of Figure 6 differentiate mainly in the interval 0.2–0.4 year−1, where the spectral coherence between seismic and atmospheric data is higher than that between anthropogenic and atmospheric data, consistently with the previous observations. High-coherence values between 0.2 and 0.4 year −1 reflect relevant common cycles between 2.5 and 5 years in the spectrum of both seismic and atmospheric fluctuations, almost absent in the anthropogenic time series. Thus, short-range atmospheric CO2 fluctuations seems better correlated with seismic than anthropogenic activity. Unfortunately, the narrowness of the considered time window does not allow to grasp possible and, in a sense, expected long-term effects of the seismic activity.

4. Conclusions

The presented results derive from geochemical studies on the chemical evolution at the Earth’s scale that affected the mantle, crust, and atmosphere during the periods of the most severe tectonic activity, and were corroborated by experimental evidences of neutron emissions during rock fracture and the concomitant changes in element concentrations in the specimens.
It is important to note that the conventional assumptions in relation to the migration of chemical elements do not imply the nearly perfect satisfaction of the mass balances, whereas the chemical balances among the most abundant elements derived from geochemical data are considered as indirect evidences of conjectured LENR reactions. The atmospheric elements (C, N, O) can be regarded as the results of a set of reactions, involving Si, Al, and Mg as starting elements, that are massively triggered by tectonic activity. In particular, this conjecture not only accounts for atmospheric CO2 formation and its variations over the Earth’s lifetime, but could also provide an explanation for some of the observed anomalies in the correlation between the atmospheric CO2 growth rate and the anthropogenic emission rate.
By examination of the time series, fluctuations in the atmospheric CO2 growth rate cannot be explained in terms of low-amplitude anthropogenic emission fluctuations (nearly an order-of-magnitude difference). Furthermore, the main periodicities of these two phenomena are different.
Although variations in climate variables are recognized as important drivers of the interannual variability of the atmospheric CO2 growth rate [61], common cycles are found between atmospheric and seismic variables. In the light of the aforementioned LENR, such atmospheric CO2 fluctuations may be ascribed to the cycles of the worldwide seismicity.
Obviously, in absence of any causality analysis, the performed spectral analysis does not permit to say anything conclusive about the reciprocal causality relation between these indicators. This study simply aims to open a debate on the models which regulates the atmospheric CO2 levels, by suggesting more detailed investigations of the oscillations in climate variables and their correlation with other variables connected to Earth’s activity.

Supplementary Materials

Earthquake data are available online at https://earthquake.usgs.gov/earthquakes/search/. CO2 emission data are available online at http://www.globalcarbonproject.org/carbonbudget/archive.htm#CB20147.

Author Contributions

Conceptualization, writing—review and supervision, A.C.; investigation, data curation, formal analysis, writing—original draft preparation, G.N.

Funding

This research received no external funding.

Conflicts of Interest

The authors declare no conflict of interest.

References

  1. Liu, L. The inception of the oceans and CO2-atmosphere in the early history of the Earth. Earth Planet. Sci. Lett. 2004, 227, 179–184. [Google Scholar] [CrossRef]
  2. Weast, R.C. Handbook of Chemistry and Physics, CRC Handbook of Chemistry and Physics; CRC Press: New York, NY, USA, 1980. [Google Scholar]
  3. Garrison, T.S. Oceanography: An Invitation to Marine Science; Thompson Brooks Cole: Belmont, CA, USA, 2005. [Google Scholar]
  4. Schopf, J. Earth’s Earliest Biosphere: Its Origin and Evolution; Princeton University Press: Princeton, NJ, USA, 1983. [Google Scholar]
  5. Kolb, E. Blind Watchers of the Sky: The People and Ideas that Shaped Our View of the Universe; Oxford University Press: Oxford, UK, 2000. [Google Scholar]
  6. Kolb, E.W.; Matarrese, S.; Notari, A.; Riotto, A. Primordial inflation explains why the universe is accelerating today. arXiv, 2005; arXiv:hep-th/0503117. [Google Scholar]
  7. Williams, R.P.; Da Silva, F.J.R. Evolution was chemically constrained. J. Theor. Biol. 2003, 220, 323–343. [Google Scholar] [CrossRef] [PubMed]
  8. Buesseler, K.O.; Doney, S.C.; Karl, D.M.; Boyd, P.W.; Caldeira, K.; Chai, F.; Coale, K.H.; de Baar, H.J.; Falkowski, P.G.; Johnson, K.S.; et al. Ocean iron fertilization moving forward in a sea of uncertainty. Science 2008, 319, 162. [Google Scholar] [CrossRef] [PubMed]
  9. Holland, H.D. The oxygenation of the atmosphere and oceans. Philos. Trans. R. Soc. Lond. Ser. B 2006, 361, 903–915. [Google Scholar] [CrossRef] [PubMed]
  10. Abbott, D.; Burgess, L.; Longhi, J.; Smith, W.H. An empirical thermal history of the Earth’s upper mantle. J. Geophys. Res. 1994, 99, 835–850. [Google Scholar] [CrossRef]
  11. Kasting, J.F.; Ackerman, T.P. Climatic consequences of very high carbon dioxide levels in the Earth’s early atmosphere. Science 1986, 234, 1383–1385. [Google Scholar] [CrossRef]
  12. Yung, Y.L.; De More, W.B. Photochemistry of Planetary Atmospheres; Oxford University Press: New York, NY, USA, 1999. [Google Scholar]
  13. Ahrens, T.J. The state of mantle minerals. Technophysics 1971, XX, 189–219. [Google Scholar]
  14. Ringwood, A.E. The chemical composition and the origin of Earth. In Advance in Earth Science; Hurley, P.M., Ed.; MIT PRESS: Cambridge, UK, 1962. [Google Scholar]
  15. Gaillard, F.; Scaillet, B. A theoretical framework for volcanic degassing chemistry in a comparative planetology perspective and implications for planetary atmospheres. Earth Planet. Sci. Lett. 2014, 403, 307–316. [Google Scholar] [CrossRef]
  16. Tera, F.; Papanastassiou, D.A.; Wasserburg, G.J. Isotopic evidence for a terminal lunar cataclysm. Earth Planet. Sci. Lett. 1974, 22, 1–21. [Google Scholar] [CrossRef]
  17. Cohen, B.A.; Swindle, T.D.; Kring, D.A. Support for the Lunar Cataclysm Hypothesis from Lunar Meteorite Impact Melt Ages. Science 2000, 290, 1754–1755. [Google Scholar] [CrossRef]
  18. Saito, M.A. Less nickel for more oxygen. Nature 2009, 458, 714–715. [Google Scholar] [CrossRef] [PubMed]
  19. Kopp, R.E.; Kirschvink, J.L.; Hilburn, I.A.; Nash, C.Z. The Paleoproterozoic snowball Earth: A climate disaster triggered by the evolution of oxygenic photosynthesis. Proc. Natl. Acad. Sci. USA 2005, 102, 11131–11136. [Google Scholar] [CrossRef] [PubMed]
  20. Konhauser, K.O.; Pecoits, E.; Lalonde, S.V.; Papineau, D.; Nisbet, E.G.; Barley, M.E.; Arndt, N.T.; Zahnle, K.; Kamber, B.S. Oceanic nickel depletion and a methanogen famine before the Great Oxidation Event. Nature 2009, 458, 750–753. [Google Scholar] [CrossRef] [PubMed]
  21. Favero, G.; Jobstraibizer, P. The distribution of aluminum in the Earth: From cosmogenesis to Sial evolution. Coord. Chem. Rev. 1996, 149, 367–400. [Google Scholar] [CrossRef]
  22. Taylo, S.R.; McLennan, S.J. Planetary Crusts: Their Composition, Origin and Evolution; Cambridge University Press: Cambridge, UK, 2009. [Google Scholar]
  23. Hawkesworth, C.I.; Kemp, A.I.S. Evolution of the continental crust. Nature 2006, 443, 811–817. [Google Scholar] [CrossRef] [PubMed]
  24. Doglioni, C. Interno della Terra. In Enciclopedia Scienza e Tecnica; Treccani: Milano, Italy, 2007; pp. 595–605. [Google Scholar]
  25. Rudnik, R.L.; Fountain, D.M. Nature and composition of the continental crust: A lower crustal perspective. Rev. Geophys. 1995, 33, 267–309. [Google Scholar] [CrossRef]
  26. Yaroshevsky, A.A. Abundances of chemical elements in the Earth’s crust. Geochem. Int. 2006, 44, 54–62. [Google Scholar] [CrossRef]
  27. Carpinteri, A.; Manuello, A. Evolution and fate of chemical elements in the Earth’s Crust, Ocean, and Atmosphere. In Acoustic, Electromagnetic, Neutron Emissions from Fracture and Earthquakes; Carpinteri, A., Lacidogna, G., Manuello, A., Eds.; Springer: Basel, Switzerland, 2015. [Google Scholar]
  28. Carpinteri, A.; Manuello, A. Reply to “Comments on ‘Geomechanical and Geochemical Evidence of Piezonuclear Fission Reactions in the Earth’s Crust’ by A. Carpinteri and A. Manuello” by U. Bardi and G. Comoretto. Strain 2013, 49, 548–551. [Google Scholar] [CrossRef]
  29. Carpinteri, A.; Borla, O.; Lacidogna, G.; Manuello, A. Neutron emissions in brittle rocks during compression tests: Monotonic vs. cyclic loading. Phys. Mesomech. 2010, 13, 264–274. [Google Scholar] [CrossRef]
  30. Carpinteri, A.; Manuello, A. Geomechanical and geochemical evidence of piezonuclear fission reactions in the Earth’s crust. Strain 2011, 47, 282–292. [Google Scholar] [CrossRef]
  31. Carpinteri, A.; Lacidogna, G.; Manuello, A.; Borla, O. Piezonuclear fission reactions: Evidences from microchemical analysis, neutron emission, and geological transformation. Rock Mech. Rock Eng. 2012, 45, 445–459. [Google Scholar] [CrossRef]
  32. Carpinteri, A.; Manuello, A.; Negri, L. Chemical evolution in the Earth’s mantle and its explanation based on piezonuclear fission reactions. In Acoustic, Electromagnetic, Neutron Emissions from Fracture and Earthquakes; Carpinteri, A., Lacidogna, G., Manuello, A., Eds.; Springer: Basel, Switzerland, 2015. [Google Scholar]
  33. Sobolev, G.A.; Shestopalov, I.P.; Kharin, E.P. Implications of Solar Flares for the Seismic Activity of the Earth. Izvestiya. Phys. Solid Earth 1998, 34, 603–607. [Google Scholar]
  34. Volodichev, N.N. Lunar periodicity of the neutron radiation burst and seismic activity on the Earth. In Proceedings of the 26th International Cosmic Ray Conference, Salt Lake City, UT, USA, 17–25 August 1999. [Google Scholar]
  35. Sigaeva, E.; Nechaev, O.; Panasyuk, M.; Bruns, A.; Vladimirsky, B.; Kuzmin, Y. Thermal neutrons’ observations before the Sumatra earthquake. Geophys. Res. Abstr. 2006, 8, 00435. [Google Scholar]
  36. Carpinteri, A.; Borla, O. Fracto-emissions as seismic precursors. Eng. Fract. Mech. 2017, 177, 239–250. [Google Scholar] [CrossRef]
  37. Carpinteri, A.; Lacidogna, G.; Manuello, A.; Niccolini, G.; Borla, O. Time correlation between acoustic, electromagnetic and neutron emissions in rocks under compression. In Proceedings of the Conference & Exposition on Experimental and Applied Mechanics (SEM), Costa Mesa, CA, USA, 11–14 June 2012; Chapter N. 50. pp. 387–393. [Google Scholar]
  38. Carpinteri, A.; Lacidogna, G.; Borla, O.; Manuello, A.; Niccolini, G. Electromagnetic and neutron emissions from brittle rocks failure: Experimental evidence and geological implications. Sadhana 2012, 37, 59–78. [Google Scholar] [CrossRef]
  39. Borla, O.; Lacidogna, G.; Di Battista, E.; Niccolini, G.; Carpinteri, A. Electromagnetic emission as failure precursor phenomenon for seismic activity monitoring. In Proceedings of the Conference & Exposition on Experimental and Applied Mechanics (SEM), Greenville, SC, USA, 2–5 June 2014; Volume 5, pp. 221–229. [Google Scholar]
  40. Lacidogna, G.; Borla, O.; Niccolini, G.; Carpinteri, A. Correlation between acoustic and other forms of Energy emissions from fracture phenomena. In Acoustic, Electromagnetic, Neutron Emissions from Fracture and Earthquakes; Carpinteri, A., Lacidogna, G., Manuello, A., Eds.; Springer: Basel, Switzerland, 2015. [Google Scholar]
  41. Manuello, A.; Sandrone, R.; Guastella, S.; Borla, O.; Lacidogna, G.; Carpinteri, A. Neutron emissions and compositional changes at the compression failure of Iron-rich natural rocks. In Acoustic, Electromagnetic, Neutron Emissions from Fracture and Earthquakes; Carpinteri, A., Lacidogna, G., Manuello, A., Eds.; Springer: Basel, Switzerland, 2015. [Google Scholar]
  42. Girault, F.; Bollinger, L.; Bhattarai, M.; Koirala, B.P.; France-Lanord, C.; Rajaure, S.; Gaillardet, J.; Fort, M.; Sapkota, S.N.; Perrier, F. Large-scale organization of carbon dioxide discharge in the Nepal Himalayas. Geophys. Res. Lett. 2014, 41, 6358–6366. [Google Scholar] [CrossRef]
  43. Rothman, D.H. Atmospheric carbon dioxide levels for the last 500 million years. Proc. Natl. Acad. Sci. USA 2001, 99, 4167–4171. [Google Scholar] [CrossRef]
  44. Royer, D.L. Atmospheric CO2 and O2 during the Phanerozoic: Tools, patterns, and impacts. In Treatise on Geochemistry; Turekian, K., Holland, H., Eds.; Elsevier Science: New York, NY, USA, 2014; pp. 251–267. [Google Scholar]
  45. Bergman, N.M.; Lenton, T.M.; Watson, A.J. Copse: A new model of biogeochemical cycling over Phanerozoic time. Am. J. Sci. 2004, 301, 182–204. [Google Scholar] [CrossRef]
  46. CDIAC, 2016: Global Fossil-Fuel CO2 Emissions. Available online: http://cdiac.ornl.gov/trends/emis/tre_glob_2013.html (accessed on 14 October 2017).
  47. Luthi, D.; Le Floch, M.; Bereiter, B.; Blunier, T.; Barnola, J.-M.; Siegenthaler, U.; Raynaud, D.; Jouzel, J.; Fischer, H.; Kawamura, K.; et al. High-resolution carbon dioxide concentration record 650,000–800,000 years before present. Nature 2008, 453, 379–382. [Google Scholar]
  48. Global Carbon Budget. Available online: http://www.globalcarbonproject.org/carbonbudget/ (accessed on 16 October 2017).
  49. Intergovernmental Panel on Climate Change (IPPC). Intergovernmental Panel on Climate Change; AR4-WG1; IPPC: Geneva, Switzerland, 2007. [Google Scholar]
  50. Lewis, S.L.; Lopez-Gonzalez, G.; Sonké, B.; Affum-Baffoe, K.; Baker, T.R.; Ojo, L.O.; Phillips, O.L.; Reitsma, J.M.; White, L.; Comiskey, J.A.; et al. Increasing carbon storage in intact African tropical forests. Nature 2009, 457, 1003–1006. [Google Scholar] [CrossRef] [PubMed]
  51. Tollefson, J. Counting carbon in the Amazon. Nature 2009, 461, 1048–1052. [Google Scholar] [CrossRef]
  52. Schuur, E.A.; Vogel, J.G.; Crummer, K.G.; Lee, H.; Sickman, J.O.; Osterkamp, T.E. The effect of permafrost thaw on old carbon release and net carbon exchange from tundra. Nature 2009, 459, 556–559. [Google Scholar] [CrossRef] [PubMed]
  53. Salby, M.L. Physics of the Atmosphere and Climate; Cambridge University Press: Cambridge, UK, 2012. [Google Scholar]
  54. Oliver, J.G.J. Trends in Global CO2 Emissions: 2015 Report; PBL Netherlands Environmental Assessment Agency: The Hague, The Netherlands, 2015. [Google Scholar]
  55. Courtney, R.S. Limits to Existing Quantitative Understanding of Past, Present and Future Changes to Atmospheric Carbon Dioxide Concentration; International Conference on Climate Change: New York, NY, USA, 2008. [Google Scholar]
  56. King, C.H. Gas Geochemistry Applied to Earthquake Prediction: An Overview. J. Geophys. Res. 1986, 91(B12), 12269–12281. [Google Scholar] [CrossRef]
  57. Pierotti, L.; Botti, F.; D’Intinosante, V.; Facc, G. Anomalous CO2 content in the Gallicano thermo-mineral spring (Serchio Valley, Italy) before the 21 June 2013, Alpi Apuane Earthquake (M = 5.2). Phys. Chem. Earth 2015, Parts A/B/C, 85–86. [Google Scholar]
  58. Gheradi, F.; Pierotti, L. The suitability of the Pieve Fosciana hydrothermal system (Italy) as a detection site for geochemical seismic precursors. Appl. Geochem. 2018, 92, 166–179. [Google Scholar] [CrossRef]
  59. Search Earthquake Catalog. Available online: https://earthquake.usgs.gov/earthquakes/search/ (accessed on 16 October 2017).
  60. Padron, E.; Melian, G.; Marrero, R.; Nolasco, D.; Barrancos, J.; Padilla, G.; Hernandez, P.A.; Perez, N.M. Changes in the diffuse CO2 emission and relation to seismic activity in and around El Hierro, Canary Islands. Pure Appl. Geophys. 2008, 165, 95–114. [Google Scholar] [CrossRef]
  61. Keeling, C.D.; Whorf, T.P.; Wahlen, M.; Van der Plichtt, J. Interannual extremes in the rate of atmospheric carbon dioxide since 1980. Nature 1995, 375, 666–670. [Google Scholar] [CrossRef]
Figure 1. Estimated changes in the concentrations of Fe, Ni, Al, and Si in the Earth’s crust during tectonic plate formation (3.8 Gyr ago) and during the most severe tectonic activity (2.5 Gyr ago) (the picture, extracted from [27], was produced by collecting information taken from [21,22,23,24,25,26]; more details are reported in [28]).
Sci 01 00017 g001
Figure 2. Variation in the atmospheric composition over the Earth’s lifetime. During the Archean era, about 15% of the Earth’s atmosphere was constituted by carbon dioxide (CO2), and the remaining part was mainly composed by water vapor (H2O) (the picture, extracted from [27], was produced by collecting information taken from [21,22,23,24,25,26]; more details are reported in [28]).
Sci 01 00017 g002
Figure 3. (A) Seismic activity and neutron flux measurements in the period 1975–1987 (Kola Peninsula, Russia [33]); (B) Typical time correlation between fitting distributions of neutron flux measurements at the Murisengo gypsum mine, and a local seismic swarm (magnitude 3.2 main shock) [36].
Sci 01 00017 g003
Figure 4. (A) Time series plots (1955–2013) of annual anthropogenic CO2 emissions; (B) global seismic-moment release; (C) and the atmospheric CO2 growth rate. Trend lines are in black.
Sci 01 00017 g004
Figure 5. (A) FFT spectra of the de-trended time series for: Anthropogenic CO2 emissions; (B) the global seismic-moment release rate; (C) and the atmospheric CO2 growth rate. Note the discrepancy between the main peaks of anthropogenic (20-year) and atmospheric (3.7-year) spectra, and the peaks shared by the seismic and atmospheric spectra (e.g., at 2.5 and 3.7 years).
Sci 01 00017 g005
Figure 6. Spectral coherences Cxy(f) between atmospheric CO2 growth rate and: (a) anthropogenic CO2 emission rate; (b) seismic-moment release rate.
Sci 01 00017 g006

