Abstract
Manmade detention ponds have historically been impacted by anthropogenic activities such as rainwater runoff, car emissions, and drainage from infrastructures, which can lead to complications for pond ecosystems. Sediment samples collected from the northern, southern, western, and eastern regions of a small pond on a suburban high school campus on Long Island, NY, were analyzed for potential chemical changes resulting from an inundation of water by a broken water main. Incorporating synchrotron X-ray techniques, sediment was analyzed using Submicron Resolution Spectroscopy, Tender Energy X-ray Spectroscopy, and X-ray Powder Diffraction to examine heavy metals, light elements, and minerals. Results include a Zn:Cu ratio increase from 4:1 to 10:1 in the eastern zone and a higher heavy metal presence in the western zone for all elements examined, with greater distribution throughout the pond post-inundation. Lighter elements appear to remain relatively unchanged. The appearance of diopside in the eastern zone post-inundation samples suggests contamination from the water main break, while the presence of carbonate minerals in the western zone is consistent with erosion of asphalt material from the adjacent parking lot.
1. Introduction
A retention pond is a human-made structure designed to mitigate flooding and erosion. These ponds, commonly found in urban settings, collect stormwater runoff, which often contains pollutants that can affect the ecosystem. Various studies have explored the chemical composition of retention pond sediments, such as those in Shoreham-Wading River, New York [1,2,3], and other locations like Greenfield Park in Wisconsin, which experiences runoff from roadways containing heavy metals like lead and zinc [4], and the Oakville retention pond in Ontario, which accumulates phosphorus due to runoff from agricultural areas [5]. Similarly, retention ponds, including the Shoreham-Wading River Pond, are home to organisms like macroinvertebrates, fish, and waterfowl. However, these habitats are often contaminated by pollutants, such as heavy metals, which can disrupt the local ecosystem [3,6]. Runoff pollution, a significant contributor to contamination, has been identified as a primary threat to aquatic life, with studies showing that pollutants harm over 50% of aquatic organisms [1]. The accumulation of such pollutants not only jeopardizes aquatic ecosystems but also raises concerns about the long-term health of the environment, underscoring the importance of monitoring runoff in retention ponds.
This study investigates the impact of heavy metals, lighter elements, and mineral composition on the sediment of the Shoreham-Wading River retention pond. It is hypothesized that pollutants introduced by surrounding infrastructure, such as parking lots, roads, and utility pipes, have contributed to the sediment composition. Moreover, examination of how a water main break event affected the pond’s sediment anticipates increased heavy metal concentrations due to runoff from the ruptured pipes. This research aims to characterize the effects of pollution from both the water main break and general runoff on the chemical and mineral composition of pond sediment.
To test these hypotheses, samples were analyzed for their concentrations of key elements, including Ca, Ti, Fe, Cu, Zn, As, and Mg. These elements were selected due to their relevance to the pond’s ecosystem. Their presence is influenced by human activities such as car emissions and runoff from nearby infrastructure. Specifically, Fe and Ti, commonly found in car emissions, can accumulate in water-soluble forms, potentially harming the pond’s ecosystem [7]. While Fe is a necessary nutrient for aquatic life, it becomes toxic at elevated concentrations [2,8]. Similarly, As, which can be harmful in its As(V) form, is often associated with pesticides and rock erosion [9]. The levels of Ca and Mg, indicative of water hardness, play an important role in maintaining pond health and supporting aquatic organisms [10]. Zn, commonly found in aquatic environments in a 5:1 ratio with Cu, serves as an indicator of ecosystem health. This study compares the elemental ratios found in the Shoreham-Wading River Pond to the safety guidelines set by the Interim Sediment Quality Guidelines (ISQG) [11].
Given that galvanized steel pipes were likely used in constructing the water supply system in the Shoreham-Wading River area [3], it is expected that the rupture of these pipes would have introduced high concentrations of Zn and Fe into the pond. These metals, characteristic of galvanized steel, are often present in significant quantities in water runoff from such pipes [12]. The runoff from these pipes, located near the eastern part of the pond, likely contributed to the contamination. Additionally, the pond’s proximity to a parking lot, made of asphalt containing bismuth and hydrocarbons, is expected to have increased the presence of Fe and Ca in the sediment [13]. Previous research indicates that high concentrations of heavy metals in ponds correlate with reduced biodiversity [14]. This study suggests that the accumulation of heavy metals, particularly in the eastern zone of the pond, could negatively impact the biodiversity of the pond’s ecosystem by harming macroinvertebrates through direct contact or ingestion [8].
In this study, pollution from the water main break, categorized by samples from the east and south zones, with the general pollution from road runoff, as reflected in samples from the west and north zones, is compared. By examining these samples, the aim is to better understand how the water main break event influenced the pond’s chemical and mineral composition and assess the long-term implications for the ecosystem.
Several recent studies have investigated the influence of anthropogenic disturbances on aquatic systems using advanced spectroscopic methods, providing a strong foundation for understanding elemental and mineral changes in these systems. For instance, one study applied infrared spectroscopy, X-ray techniques, and scanning electron microscopy to analyze sediment from freshwater lakes [15]. Building on this multi-technique approach, this study contributes by examining heavy metal ratios and their mineral associations, providing additional insight into how elements co-occur and transform under acute anthropogenic influence. Another study employed X-ray powder diffraction and XANES spectroscopy to characterize zinc speciation in sediments from an urban pond [16]. While focusing on zinc speciation in urban pond sediments, this research expands on this by incorporating a broader suite of both light and heavy elements, enabling a more comprehensive understanding of the geochemical shifts that occur after localized infrastructure-related events. In addition, a third study analyzed water samples from industrial zones using various X-ray techniques [17]. This study’s focus on sediment complements this work by offering a more stable record of elemental and mineralogical changes over time. By applying synchrotron-based spectroscopy before and after a defined disturbance, this study extends these findings to short-term pollution events in smaller-scale, community-based urban systems. Together, these prior works create a valuable context in which the data presented in this study deepen the understanding of both the temporal dynamics and elemental relationships in disturbed aquatic environments, especially under acute stress rather than chronic stressors.
2. Materials and Methods
2.1. Sample Collection
Sediment samples were collected at Shoreham-Wading River High School in New York. Two groups of four samples each were taken from designated locations around the pond: north (exposed to parking lot pollution), south (exposed to runoff point), west (closest to the parking lot), and east (closest to the runoff point) (Figure 1). Initial samples were collected five months before a water main break occurred. Additional samples were then collected four months after that water main break event, totaling nine months’ time between sample collections. The samples were collected using a round-point shovel, taking samples about six feet away from the pond’s shoreline and about three feet below the waterline. The pond itself is a conical shape with a liner placed below the sediment.
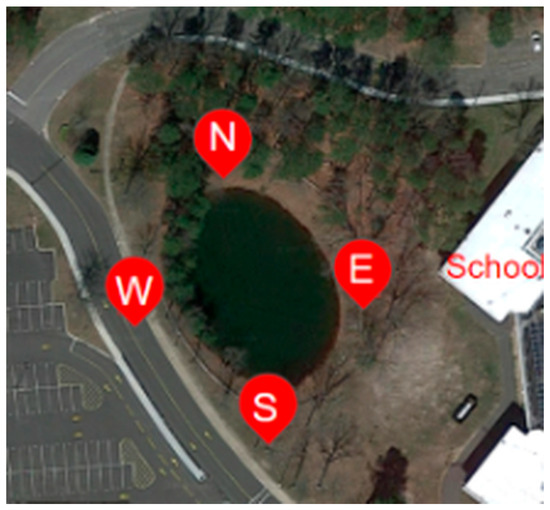
Figure 1.
Four pond sediment samples were collected before a water main break in the northern, southern, eastern, and western portions of the pond, and four additional samples were collected in the same locations after a water main break at Shoreham Wading-River High School, Long Island, New York [18].
2.2. Pond Sediment Sample Preparation
Sediment samples were air dried at room temperature to remove any moisture, then sifted using a 5.51-inch mesh nylon sieve. The resulting sediment was secured on a slide using Kapton tape in preparation for the SRX beamline. The sediment samples, as part of the TES beamline experimentation, were mounted and secured on a polypropylene slide using Kapton tape. In preparation for the XPD beamline, the same sifted sediment was poured into polyimide tubing that was plugged with clay.
2.3. Data Collection
Data were collected via the Submicron Resolution X-ray spectroscopy (SRX) beamline at the National Synchrotron Light Source II (NSLS-II) at Brookhaven National Laboratory (BNL) [19]. The SRX beamline has an incident energy of 4.5–20 keV. This allows detection up to the fourth period of elements in the k-shell, which encompasses a large number of heavy metals. For this study, the incident energy of the SRX beamline was set to 12 keV, at a spot size of 2 μm and a scan area of 20 × 20 μm, to analyze the following elements: Ca, Ti, Cr, Mn, Fe, Ni, Cu, Zn, Ga, and As. Additionally, the samples were taken to the Tender Energy X-ray Absorption Spectroscopy (TES) beamline at the NSLS-II at BNL [20]. The TES beamline has a range of 2–5.5 keV, capable of observing elements such as Mg, Al, Si, P, S, K, Ca, and Ti. During this experiment, a 2.7 keV incident energy was used to accurately measure Mg and Al, both of which are much lower on the keV range of the beamline. Data were also collected from the X-ray Powder Diffraction (XPD) beamline at the NSLS-II at BNL, operating at an incident energy of 67 keV. These diffraction data were used to identify the mineral content of the sample [21].
2.4. Data Analysis
After processing all pond sediment samples at the SRX, TES, and XPD beamlines, the resulting data were analyzed using PyXRF for SRX and TES datasets, while the XPD data were analyzed with Dioptas 0.5.9, a software designed for the analysis and integration of two-dimensional diffraction images. Dioptas facilitates the rapid processing and exploration of large datasets collected from area detectors, particularly at synchrotron beamlines, by enabling real-time calibration, integration, and visualization of diffraction patterns during experiments. PyXRF is an advanced fluorescence analysis package for X-ray fluorescence data fitting and visualization that is built in Python v. 3.8.13 [22]. This package includes a visualization feature where the relative intensities of elements in a sample can be compared [22]. After importing the data for one of the sample groups, a raw distribution of the elements found in the sample is created. To confirm these elements, they need to be fitted with their respective emission lines. Once they are fit, the approximate concentration of each element relative to other elements in the sample is displayed in the form of fluorescence spectra (count). It is then possible to examine the data in the form of a spectrum graph, elemental map, and Red–Green–Blue (RGB) map. These figures were compiled based on location and analyzed for trends, relations to one another, and the presence of colocalization [19]. The sediment samples are labeled “New” and “Old”, referring to the water main break at Shoreham-Wading River High School. The “Old” samples refer to the samples that were collected prior to the water main break, while the “New” samples refer to those collected after the water main break. Data are presented from the eastern and western zones. The data from the southern zone resemble those of the eastern zone, while the data from the northern zone are similar to those of the western zone. Additionally, mineral data were collected from the same samples at the XPD beamline, producing diffraction patterns that were analyzed using Dioptas software and the American Mineralogical Database to identify the minerals present in the sediment [23,24].
3. Results
3.1. Heavy Elements Present in Pond Sediment
The heavy metal presence was identified and visualized as seen in Figure 2 and Figure 3. Heavy metal intensities in the eastern zone closest to the building decrease for all elements except Zn (Figure 3). Before the water main break, there was roughly a 4:1 Zn:Cu ratio, and, after the water main break, there was an observed ratio of almost 10:1 Zn:Cu. Heavy metal intensities in the western zone closest to the parking lot showed higher amounts for every element examined (Figure 4). Before and after the water main break, the Zn:Cu ratio stayed roughly the same at close to 9:1. These ratios are fairly normal, as the common ratio is near 5:1 [25]. Elemental maps (Figure 4) show that before the water main break, Ti, Fe, and Zn are found in concentrated pockets, while after the water main break, these elements are more evenly distributed throughout the sediment.
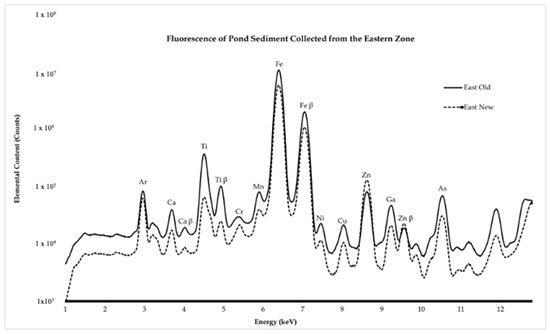
Figure 2.
The spectra display data from pond sediment collected at the eastern zone of the Shoreham-Wading River High School pond. This zone is closest to the point where the water main break occurred. There is less presence of all elements after the water main break, other than Zn. This may be attributed to the water main break washing away concentrated areas of the elements, making them more uniform throughout the sample. The increase in Zn may be attributed to the Zn coating on the galvanized pipes involved in the water main break.
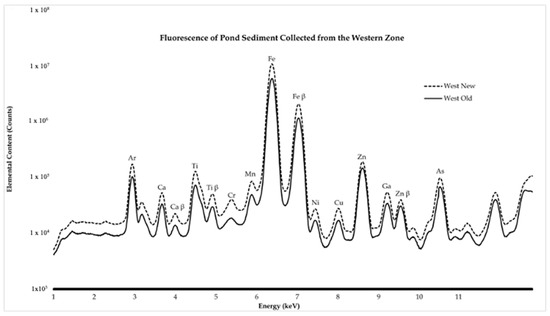
Figure 3.
The spectra display beamline data from the western zone at the Shoreham-Wading River High School pond. This zone is closest to the parking lot. Every element is more present after exposure to general runoff pollution, mainly in the form of car emission waste and rainfall.
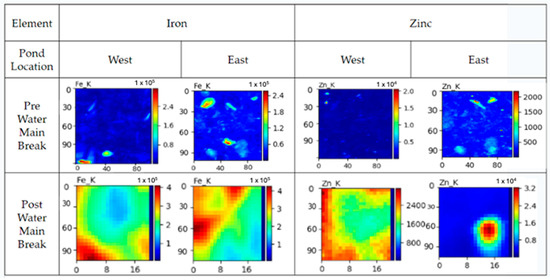
Figure 4.
The warmer colors represent a higher presence of the element, while the cooler colors represent a lower presence. The figure above depicts the elemental mapping of Fe and Zn from the eastern and western portions of the pond. Post-water main break SRX analysis revealed a marked increase in Zn abundance, reflected in a ratio shift from 4:1 to 10:1. Other heavy metals showed minimal changes.
3.2. Light Elements Present in Pond Sediment
Data from the eastern and western zones were examined using the TES beamline. The data from the northern and southern zones were identical to those from the Western zone. The elements analyzed were Mg, Al, Si, P, and S, all of which are present in the makeup of pond sediments.
3.3. Mineral Composition of Pond Sediment Pre and Post-Water Main Break
The powder diffraction data collected at the XPD beamline allowed for the identification of quartz, ferrihydrite, diopside, hydrogen silicates, kaolinite, and chlorite. Both quartz and ferrihydrite were found to be present in all samples of the sediment. Diopside and hydrogen silicates were both identified only in the New East sample. Kaolinite and chlorite were detected to be present in both the Old West and the New West sediment.
4. Discussion
4.1. Elemental Presence (Heavy Metals)
Data in the eastern zone reflect the effects of potential pollutants resulting from the water main break, and data in the western zone reflect the effects of general runoff pollution. As shown in Figure 2, zinc (Zn) concentrations increase in the New East sample following the water main break, while other metals, such as Fe, Cu, and Ti, decrease slightly due to the influx of municipal water. However, the pond maintains healthy Zn:Cu ratios in the eastern zone closest to the building, and the elemental mapping in Figure 4 shows that the elements found in sediment were more evenly distributed, reflecting less clustering or areas of high concentration, after the water main break. These healthy ratios are in accordance with the safety guidelines proposed by the Interim Sediment Quality Guidelines (ISQGs). The ISQGs are used to assess the potential risks of sediment contaminants to aquatic ecosystems by providing concentration thresholds for various contaminants. The ISQG emphasizes that sediment elemental concentrations need to be kept below certain ratio thresholds in order to ensure a healthy environment for aquatic species [11]. The increase in the Zn could be attributed to the galvanized pipes that broke and the Zn coating contaminating the water flushed into the pond. In contrast, the decrease in all other elements could be attributed to the new water diluting their presence. Since samples were collected with a shovel, it is probable that the sediment on the surface of the pond is more contaminated than the sediment deeper. Although their relative abundance was lower, the fact that potentially harmful elements, such as iron and arsenic, are more evenly distributed throughout the pond makes the aquatic environment more dangerous for the organisms that inhabit it, because, if ingested in high amounts, there could be consequences that lead to death. In the western zone closest to the parking lot, Figure 3 displays the increase in heavy metal abundance. This clearly reflects the impact of the storm runoff. This may be attributed to the introduction of heavy metals and suspended soils from the parking lot runoff over time [26]. This is true for the Zn concentrations as well in the eastern zone. It is important to note that the events that caused this are highly variable. Still, there is no discrediting the relationship between heavy metals in the pond and the surrounding environment. The uniform distribution of heavy metals in the pond could also have a harmful impact on the environment. The present elements can be potentially hazardous to environmental health, especially Fe, Ti, and Zn [4]. These three heavy metals, especially when found throughout sediment, may be sublethal to macroinvertebrates [27]. Although the metal counts did not increase, other than Zn, it is important to note that, in reference to the elemental maps presented in Figure 4, the metal distribution went from being found in hotspots to being more spatially distributed throughout the sample. Therefore, the water main break was effective in removing these highly concentrated spots of metals within the sample, thus redistributing the metal throughout the sediment, which could affect the biodiversity of aquatic species.
The presence of arsenic in the pond’s sediment may, however, be concerning, due to its potential toxic effects on aquatic ecosystems and human health. Arsenic, a naturally occurring element, often enters water bodies through both natural geological sources and anthropogenic activities, such as pesticide use, industrial runoff, and the erosion of contaminated soils. In a pond setting, arsenic can be absorbed by sediment particles, making it available for uptake by bottom-dwelling organisms. This bioaccumulation can harm aquatic life by interfering with metabolic processes and, at higher concentrations, can cause mortality in sensitive species. Additionally, arsenic poses a risk to human health, as it can leach into groundwater sources or accumulate in fish and plants that may enter the food chain. In this pond, the detection of arsenic could be attributed to runoff from nearby agricultural lands, road surfaces, or infrastructure materials that leach arsenic as they degrade. Monitoring and mitigating arsenic levels are critical, as continued accumulation could degrade the pond’s biodiversity and pose risks to public health if the pond is part of a larger watershed [9].
4.2. Elemental Presence (Light Elements)
The presence of light elements decreased after the water main break by a negligible amount (Figure 5 and Figure 6). Si was found in the highest amount out of the light elements examined. The Si abundance can be considered normal, as it is found in high concentrations in soil and sediment and makes up a large percentage of sandstone and other sedimentary rocks [28]. The Mg and Al had an overall decrease in presence throughout all the samples by a negligible amount. The Mg percentages in comparison to Si did have an increase in the New East sample as compared to the Old East. This increase is likely caused by the presence of Mg in the municipal water of the school, which would have been introduced into the pond during the water main break [29]. The presence of Mg has been shown to have major negative health impacts in macroinvertebrates, fish, and waterfowl by disrupting their metabolic processes if the Mg levels affect the ratio of Ca to Mg [30]. However, this ratio was not affected (Figure 5 and Figure 6). In the eastern zone, the ratio of Ca to Mg decreased, while, in the western zone, the ratio of Ca to Mg increased; however, in both zones, the change in Ca and Mg concentration was negligible to have a severe effect on the hardness of the water. The lesser presence of Al is also to be expected, as it is common in soil sediment [31].
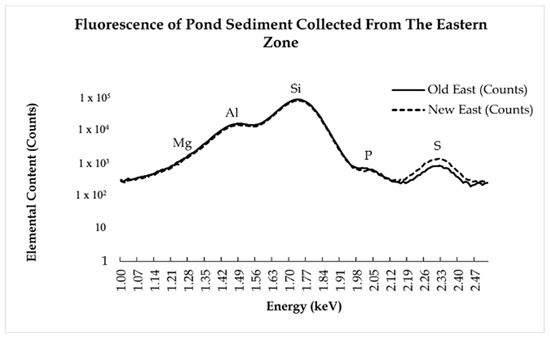
Figure 5.
The spectra display beamline data from pond sediment collected at the eastern zone of the Shoreham-Wading River High School Pond. This zone is closest to the building with a water main break. All elements are slightly less abundant, except for S, after the water main break. This may be attributed to the water main break washing away concentrated areas of the elements, making them more uniform throughout the sample.
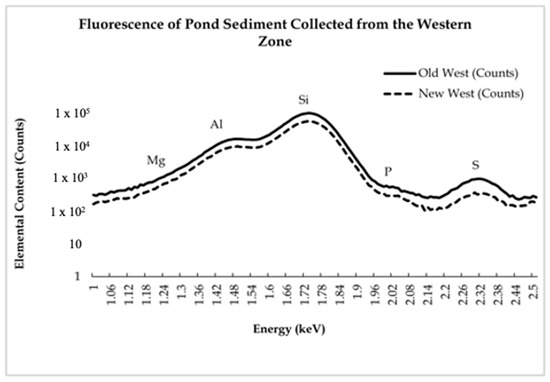
Figure 6.
The spectra display beamline data from the western zone at the Shoreham-Wading River High School Pond. This zone is closest to the parking lot. All elements were found in higher abundance in the older sample.
4.3. Mineral Content
Drainage ponds on Long Island, New York, such as the Shoreham Wading-River Pond, are significantly impacted by anthropogenic pollution and runoff due to their proximity to urban infrastructure, including schools, parking lots, and roads. These ponds function as catchments for stormwater runoff, often carrying a mixture of natural sediments and pollutants from surrounding areas. Runoff from parking lots primarily introduces hydrocarbons and heavy metals, while the erosion of local sandy soils contributes quartz and clay minerals, such as kaolinite and chlorite, to the sediment [32]. Following a recent water main break, additional materials, such as ferrihydrite and clay minerals, were likely mobilized from corroding infrastructure and oxygenated water conditions [8]. Similarly, silicate minerals, such as serpentine, were likely introduced through disturbed soils or construction runoff [8]. These materials were deposited as dissolved minerals and sediments entered the pond, reflecting a complex interplay between natural sedimentation processes and anthropogenic influences.
Quartz, a primary component of sand and sediment, was present in all samples from the SWR pond. Its high resistance to weathering and widespread occurrence in sandstone, a common feature of Long Island geology, ensures its persistence in sediment over time [32]. Quartz-rich sands are frequently carried into drainage ponds via runoff from parking lots and roads, further contributing to their abundance in this environment.
Ferrihydrite, primarily associated with iron, was also present in all samples and was identified through the co-localization of Fe detected in SRX analysis. Ferrihydrite commonly forms through iron oxidation in oxygenated water, often as a result of iron-rich runoff from urban infrastructure such as galvanized pipes [33]. Notably, ferrihydrite was more prominent in the New West sample compared to the Old West sample, indicating an increase in iron content following the water main break, which likely mobilized iron-bearing sediments and facilitated further oxidation. This trend was consistent with elevated iron levels detected through SRX analysis.
In the New East sample, diopside and hydrogen silicates were identified, marking a new presence not observed in the Old East sample (Figure 7 and Figure 8). Diopside, a pyroxene mineral containing Ca, Mg, and Si, correlated with the increased presence of these elements detected through TES analysis. This mineral may have been introduced by the water main break, which disturbed underlying sediment layers or mobilized rock fragments from nearby urban runoff, such as parking lot sediment. Hydrogen silicates, typically associated with Mg, Al, and Si, were likely introduced through a combination of erosion and chemical changes caused by the addition of municipal water, as evidenced by the increased Mg and Si levels detected by TES. These changes could have altered the pH or ionic composition of the pond, favoring the mobilization and precipitation of silicate minerals [8]. Additionally, hydrogen silicates may have been transported into the pond via runoff from concrete or roads adjacent to the site.
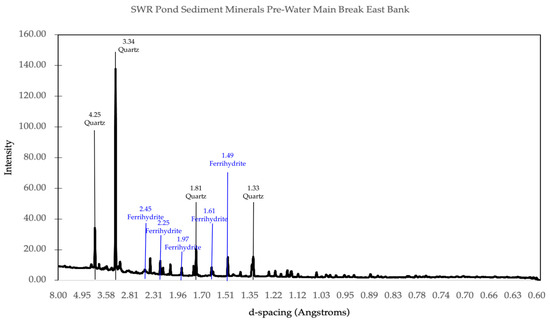
Figure 7.
Mineral matches from X-ray powder diffraction data for the east bank of the pond prior to the water main break. The main minerals identified from the peaks present are quartz and ferrihydrite, as indicated.
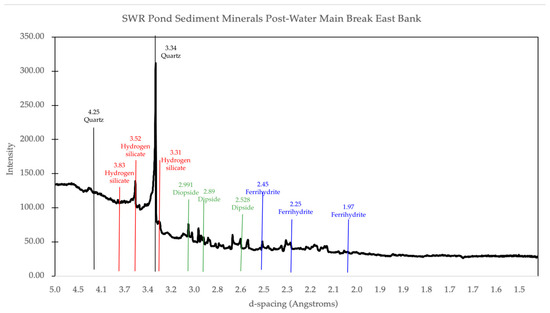
Figure 8.
Mineral matches from X-ray powder diffraction data for the east bank of the pond after the water main break. The main minerals identified from the peaks present are quartz, hydrogen silicate, diopside, and ferrihydrite, as indicated.
In contrast, the Old West sample contained clay minerals such as kaolinite and chlorite, which were completely absent in the Old East samples (Figure 9). These clay minerals are often derived from the erosion of sedimentary rocks and are consistent with the west portion’s closer proximity to the parking lot and road, which could contribute additional carbonate minerals via the erosion of asphalt. he presence of Al and Mg, detected in TES analysis, supports the identification of kaolinite and chlorite, as these elements are primary components of these minerals. This hypothesis is supported by the presence of wollastonite and calcite in the West samples. Following the water main break, the New West sample exhibited an even more pronounced presence of clay minerals, likely resulting from increased erosion and runoff caused by the disturbance (Figure 10).
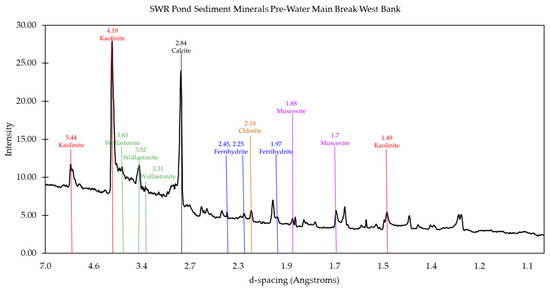
Figure 9.
Mineral matches from X-ray powder diffraction data for the west bank of the pond prior to the water main break. The main minerals identified from the peaks present are kaolinite, wollastonite, calcite, ferrihydrite, chlorite, and muscovite, as indicated.
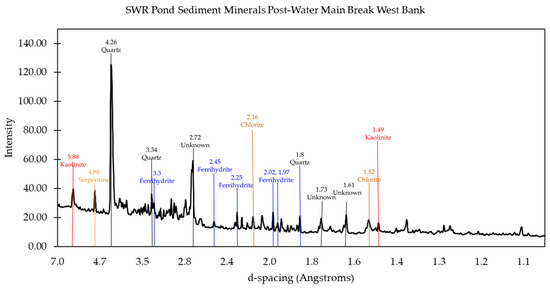
Figure 10.
Mineral matches from X-ray powder diffraction data for the west bank of the pond after the water main break. The main minerals identified from the peaks present are quartz, ferrihydrite, kaolinite and chlorite, as indicated.
4.4. Comparison of Results
The pre-water main break sediment from the eastern zone had higher counts of practically all elements other than Zn. In comparison, the post-water main break sediment in the western zones had higher counts of all elements. The elements in the pre-water main break sediment were found mostly in hotspots throughout the samples. In contrast, the elements in the post-water main break sediment were mostly homogenous throughout the sample. The lighter elements are more typically found within soil and sediment, and the amounts that they are found in are highly usual in proportion to each other in comparison to other studies [34].
This study aimed to evaluate the different effects of pollution from the water main break and other human contamination on a detention pond. Although the presence of heavy metals was expected to be significantly greater than before the water main break, most of the elements analyzed had a decrease in presence, if any change at all. The shift in the Mg percentage in the New East sample, as compared to that of the Old East sample, has the potential to be harmful to the macroinvertebrates and the biodiversity of the pond as a whole; however, not large enough to have a severe effect [29]. Nearly all the other changes are negligible; thus, they will have no additional impact on the wildlife and macroinvertebrates of the pond.
The mineral content data provided additional evidence supporting the impacts of the pollution that had occurred in the pond. The mineral content helped indicate the presence of some pollutants and their potential origin (Table 1). Additionally, some of the minerals confirmed that a large portion of the sediment samples were made up of commonly expected materials. Quartz, for example, is commonly found in sediment of this origin and was found in all samples taken from the pond, as expected. Minerals like diopside and hydrogen silicates indicate the presence of impacts from the pollution resulting from the water main break. On the other hand, kaolinite and chlorite both indicate pollution resulting from runoff, particularly coming from the asphalt and cement pathways adjacent to the pond.

Table 1.
Minerals detected using X-ray Powder Diffraction and their associated locations. Mineral presence is indicated with P, present, and the lack of presence is indicated by NP, not present. P+ indicates a higher concentration of a given mineral, relative to the concentration of the same mineral at other sampling locations.
5. Conclusions
This study indicates that the sediment composition of the retention pond at the Shoreham-Wading River High School had been notably altered and influenced by the anthropogenic runoff and disturbances caused by a water main break. In the eastern zone, the bursting of the galvanized pipes introduced elevated levels of zinc and minerals like ferrihydrite and diopside, demonstrating the chemical influence of the incident. The western zone displayed consistently elevated levels of heavy metals, likely influenced by the continuous exposure to runoff containing asphalt and concrete materials, further supported by the identification of minerals kaolinite and chlorite. Arsenic was detected with increasing levels in both zones, raising concerns about potential toxicity. Although some elemental differences were minor, the addition of new minerals and changes in elemental distribution indicate impacts of occasional and chronic anthropogenic disturbances. This emphasizes the need for continued monitoring, as slight elemental changes can have extensive effects on aquatic biodiversity and stability.
Author Contributions
Conceptualization, J.S. and D.S.; methodology, J.S., D.B., D.S., M.K., J.T., S.N., E.D., P.N. and A.P.; software, J.S., D.B., D.S., M.K., J.T., S.N., E.D., P.N. and A.P.; validation, J.S., D.B., D.S., M.K. and A.P.; formal analysis, J.S. and D.B.; investigation, J.S., D.B. and D.S.; resources, D.S. and A.P.; data curation, J.S., D.B., D.S., M.K., J.T., S.N., E.D., P.N. and A.P.; writing—original draft preparation, J.S. and D.B.; writing—review and editing, J.S., D.B., D.S., M.K., E.D., S.N., P.N. and A.P.; visualization, J.S., D.B., D.S., M.K. and A.P.; supervision, D.S., M.K. and A.P.; project administration, D.S. and A.P.; funding acquisition, D.S., M.K. and A.P. All authors have read and agreed to the published version of the manuscript.
Funding
The National Synchrotron Light Source II, a U.S. Department of Energy (DOE) Office of Workforce Development and Science User Facility, is operated for the DOE Office of Science by Brookhaven National Laboratory under Contract No. DE-SC0012704. Additional support was provided by the Office of Educational Programs at Brookhaven National Laboratory and Shoreham-Wading River School District.
Data Availability Statement
Data will be made available upon request.
Acknowledgments
We would like to acknowledge the support of the NSLS-II staff, specifically of beamlines SRX 5-ID, TES 8-BM, and XPD 28-ID-2, especially Y. Du, for assistance with data collection and analysis. We would also like to acknowledge the NSLS-II User Office, L. Miller, and the Office of Educational Programs, K. White, and S. Bronson for support of the SPARK program. We would like to acknowledge Shoreham-Wading River High School graduates and former SPARK researchers B. Donnelly, T. Parinello and T. Peperno for their assistance with sample preparation and data collection. We would like to acknowledge all teachers in the High School Spectroscopy Collaboration for feedback and guidance.
Conflicts of Interest
The authors declare no conflicts of interest.
Abbreviations
The following abbreviations are used in this manuscript:
| SRX | Submicron Resolution X-ray Spectroscopy |
| TES | Tender Energy X-ray Absorption Spectroscopy |
| NSLS-II | National Synchrotron Light Source II |
| BNL | Brookhaven National Laboratory |
| PyXRF | Python based X-ray Fluorescence Analysis Program |
| XPD | X-ray Powder Diffraction |
References
- Emenike, E.C.; Iwuozor, K.O.; Anidiobi, S.U. Heavy Metal Pollution in Aquaculture: Sources, Impacts and Mitigation Techniques. Biol. Trace Elem. Res. 2022, 200, 4476–4492. [Google Scholar] [CrossRef] [PubMed]
- Egemose, S.; Sønderup, M.J.; Grudinina, A.; Hansen, A.S.; Flindt, M.R. Heavy metal composition in stormwater and retention in ponds dependent on pond age, design and catchment type. Environ. Technol. 2015, 36, 959–969. [Google Scholar] [CrossRef]
- Watt, W.E.; Marsalek, J.; Anderson, B.C.; Jaskot, C. Physical and Chemical Characteristics of Sediments from a Stormwater Management Pond. Water Qual. Res. J. 1997, 32, 89–100. [Google Scholar] [CrossRef]
- Hwang, H.M.; Foster, G.D.; Roberts, J.R. Spatial distribution and accumulation of heavy metals in sediments of a constructed urban wetland. Chemosphere 2006, 63, 191–201. [Google Scholar]
- Cooke, S.E.; Prepas, E.E. Phosphorus dynamics in shallow lakes affected by non-point source agricultural runoff: Implications for aquatic ecosystems. J. Environ. Qual. 1998, 27, 362–368. [Google Scholar]
- Gledhill, D.G.; James, P.; Davies, D.H. Pond density as a determinant of aquatic species richness in an urban landscape. Landsc. Ecol. 2008, 23, 1219–1230. [Google Scholar] [CrossRef]
- Marsalek, J.; Marsalek, P.M. Characteristics of sediments from a stormwater management pond. Water Sci. Technol. 1997, 36, 117–122. [Google Scholar] [CrossRef]
- Wium-Andersen, T.; Nielsen, A.H.; Hvitved-Jakobsen, T.; Vollertsen, J. Heavy metals, PAHs and toxicity in stormwater wet detention ponds. Water Sci. Technol. 2011, 64, 503–511. [Google Scholar] [CrossRef]
- Irving, E.C.; Lowell, R.B.; Culp, J.M.; Liber, K.; Xie, Q.; Kerrich, R. Effects of arsenic speciation and low dissolved oxygen condition on the toxicity of arsenic to a lotic mayfly. Environ. Toxicol. Chem. 2008, 27, 583–590. [Google Scholar] [CrossRef]
- United States Geological Survey. Hardness of Water. Available online: https://www.usgs.gov/special-topics/water-science-school/science/hardness-water (accessed on 11 April 2025).
- Government of Canada. Framework for Addressing and Managing Aquatic Contaminated Sites Under the Federal Contaminated Sites Action Plan (FCSAP), V2.1. Available online: https://www.canada.ca/en/environment-climate-change/services/federal-contaminated-sites/publications/aquatic-sites-framework-v2-1.html (accessed on 12 September 2022).
- Makisha, N.; Chukhin, V. Determination of Corrosion Rate in Galvanized Pipes in Centralized Hot Water Supply Systems. Appl. Sci. 2023, 13, 10564. [Google Scholar] [CrossRef]
- Sun, Z.; Sokolova, E.; Brittain, J.E.; Saltveit, S.J.; Rauch, S.; Meland, S. Impact of environmental factors on aquatic biodiversity in roadside stormwater ponds. Sci. Rep. 2019, 9, 5994. [Google Scholar] [CrossRef] [PubMed]
- Shanbehzadeh, S.; Dastjerdi, M.V.; Hassanzadeh, A.; Kiyanizadeh, T. Heavy metals in water and sediment: A case study of Tembi River. J. Environ. Public Health 2014, 1, 848720. [Google Scholar] [CrossRef]
- Dubey, D.; Kumar, S.; Dutta, V. Anthropogenic disturbances influence mineral and elemental constituents of freshwater lake sediments. Environ. Monit. Assess. 2023, 195, 1459. [Google Scholar] [CrossRef]
- Welch, S.A.; McAdams, B.C.; Goldsmith, S.T.; Trierweiler, A.M.; Von Bargen, J.M.; Deuerling, K.; Carey, A.E. Impact of anthropogenic disturbance on the chemistry of a small urban pond. Appl. Geochem. 2017, 83, 158–170. [Google Scholar] [CrossRef]
- Minkina, T.; Nevidomskaya, D.; Bauer, T.; Shuvaeva, V.; Soldatov, A.; Mandzhieva, S.; Zubavichus, Y.; Trigub, A. Determining the speciation of Zn in soils around the sediment ponds of chemical plants by XRD and XAFS spectroscopy and sequential extraction. Sci. Total Environ. 2018, 634, 1165–1173. [Google Scholar] [CrossRef] [PubMed]
- Google Map of Shoreham Wading-River Pond. Available online: https://www.google.com/maps/@40.9425384,-72.8686227,78m/data=!3m1!1e3?entry=ttu&g_ep=EgoyMDI1MDQwOS4wIKXMDSoASAFQAw%3D%3D (accessed on 11 April 2025).
- Brookhaven National Laboratory. National Synchrotron Light Source II. Submicron Resolution X-Ray Spectroscopy. Available online: https://www.bnl.gov/nsls2/beamlines/beamline.php?r=5-ID (accessed on 21 May 2020).
- Northrup, P. The TES beamline (8-BM) at NSLS-II: Tender-Energy spatially resolved x-ray absorption spectroscopy and x-ray fluorescence imaging. Synchrotron Radiat. 2019, 26, 2064–2074. [Google Scholar] [CrossRef] [PubMed]
- Shi, X.; Ghose, S.; Dooryhee, E. Performance calculations of the X-ray powder diffraction beamline at NSLS-II. Synchrotron Radiat. 2013, 20, 234–242. [Google Scholar] [CrossRef]
- About PyXRF. Available online: https://nsls-ii.github.io/PyXRF/ (accessed on 12 February 2024).
- GitHub-Dioptas. Available online: https://github.com/Dioptas/Dioptas (accessed on 27 January 2025).
- American Mineralogist Crystal Structure Database. Available online: https://rruff.geo.arizona.edu/AMS/amcsd.php (accessed on 27 January 2025).
- Kumar, B.; Senthil Kumar, K.; Priya, M.; Mukhopadhyay, D.; Shah, R. Distribution, partitioning, bioaccumulation of trace elements in water, sediment and fish from sewage fed fish ponds in eastern Kolkata, India. Toxicol. Environ. Chem. 2010, 92, 243–260. [Google Scholar] [CrossRef]
- Bishop, C.A.; Struger, J.; Shirose, L.J.; Dunn, L.; Campbell, G.D. Contamination and Wildlife Communities in Stormwater Detention Ponds in Guelph and the Greater Toronto Area, Ontario, 1997 and 1998 Part II—Contamination and Biological Effects of Contamination. Water Qual. Res. J. 2000, 35, 437–474. [Google Scholar] [CrossRef]
- Malaj, E.; Grote, M.; Schäfer, R.B.; Brack, W.; von der Ohe, P.C. Physiological sensitivity of freshwater macroinvertebrates to heavy metals. Environ. Toxicol. Chem. 2012, 31, 1754–1764. [Google Scholar] [CrossRef]
- Morgan, D.V.; Board, K. An Introduction to Semiconductor Microtechnology, 2nd ed.; John Wiley & Sons: Chichester, UK, 1991; p. 72. [Google Scholar]
- Rapant, S.; Cvečková, V.; Fajčíková, K.; Sedláková, D.; Stehlíková, B. Impact of Calcium and Magnesium in Groundwater and Drinking Water on the Health of Inhabitants of the Slovak Republic. Int. J. Environ. Res. Public Health 2017, 14, 278. [Google Scholar] [CrossRef] [PubMed]
- Boardman, D.C. The Determination of Calcium-magnesium Ratios in Sedimentary Rocks. Proc. Iowa Acad. Sci. 1953, 60, 330–332. [Google Scholar]
- Senze, M.; Kowalska-Góralska, M.; Czyż, K.; Wondołowska-Grabowska, A.; Łuczyńska, J. Aluminum in Bottom Sediments of the Lower Silesian Rivers Supplying Dam Reservoirs vs. Selected Chemical Parameters. Int. J. Environ. Res. Public Health 2021, 18, 13170. [Google Scholar] [CrossRef] [PubMed]
- LibreTexts Geosciences. Weathering and Erosion. Available online: https://geo.libretexts.org/Courses/Gettysburg_College/Book%3A_An_Introduction_to_Geology_%28Johnson_Affolter_Inkenbrandt_and_Mosher%29/07%3A_Weathering_Erosion_and_Sedimentary_Rocks/7.02%3A_Weathering_and_Erosion (accessed on 25 November 2024).
- Peinerud, E.K. Interpretation of Si concentrations in lake sediments: Three case studies. Environ. Geol. 2000, 40, 64–72. [Google Scholar] [CrossRef]
- Kaur, G.; Pandey, O.P.; Singh, K. Optical, structural, and mechanical properties of different valence-cation-doped bismuth vanadate oxides. Phys. Status Solidi 2012, 209, 1231–1238. [Google Scholar] [CrossRef]
Disclaimer/Publisher’s Note: The statements, opinions and data contained in all publications are solely those of the individual author(s) and contributor(s) and not of MDPI and/or the editor(s). MDPI and/or the editor(s) disclaim responsibility for any injury to people or property resulting from any ideas, methods, instructions or products referred to in the content. |
© 2025 by the authors. Licensee MDPI, Basel, Switzerland. This article is an open access article distributed under the terms and conditions of the Creative Commons Attribution (CC BY) license (https://creativecommons.org/licenses/by/4.0/).