1. Introduction
Neutron radiography is a powerful tool for visualizing an object non-destructively and is widely used in various application studies because of its specific image contrast through interaction with the atomic nucleus in objects [
1]. However, radiography with high penetrating power often suffers from a lack of image contrast because of transparency, which makes observation of some objects difficult.
Neutrons can be represented as de Broglie waves, and the phase of the wave is modulated by an object. Phase imaging, which visualizes phase modulation, has attracted attention as an approach that extends conventional radiography [
2]. Although a high-brilliance source is usually required for phase imaging, with the advent of the Talbot–Lau interferometer [
3], which is composed of three transmission gratings, phase imaging has been realized even with incoherent neutron sources [
4].
The Talbot–Lau interferometer can quantify the refraction of neutron waves. This makes phase imaging that allows the quantification of the differential phase shift by an object feasible. In addition, a scattering image (or visibility contrast image) can be extracted from the measurement simultaneously. The image contains information on fine structures that are smaller than the spatial resolution of the system [
5] and is used for magnetic structural analysis [
6,
7]. However, neutron phase imaging is essentially performed at large-scale facilities based on nuclear reactors or large-scale accelerators.
In industry, the need for on-site use of non-destructive inspection of metals and composite materials, which are too large to inspect with X-rays, is increasing. For this purpose, the RIKEN accelerator-driven compact neutron source (RANS) [
8,
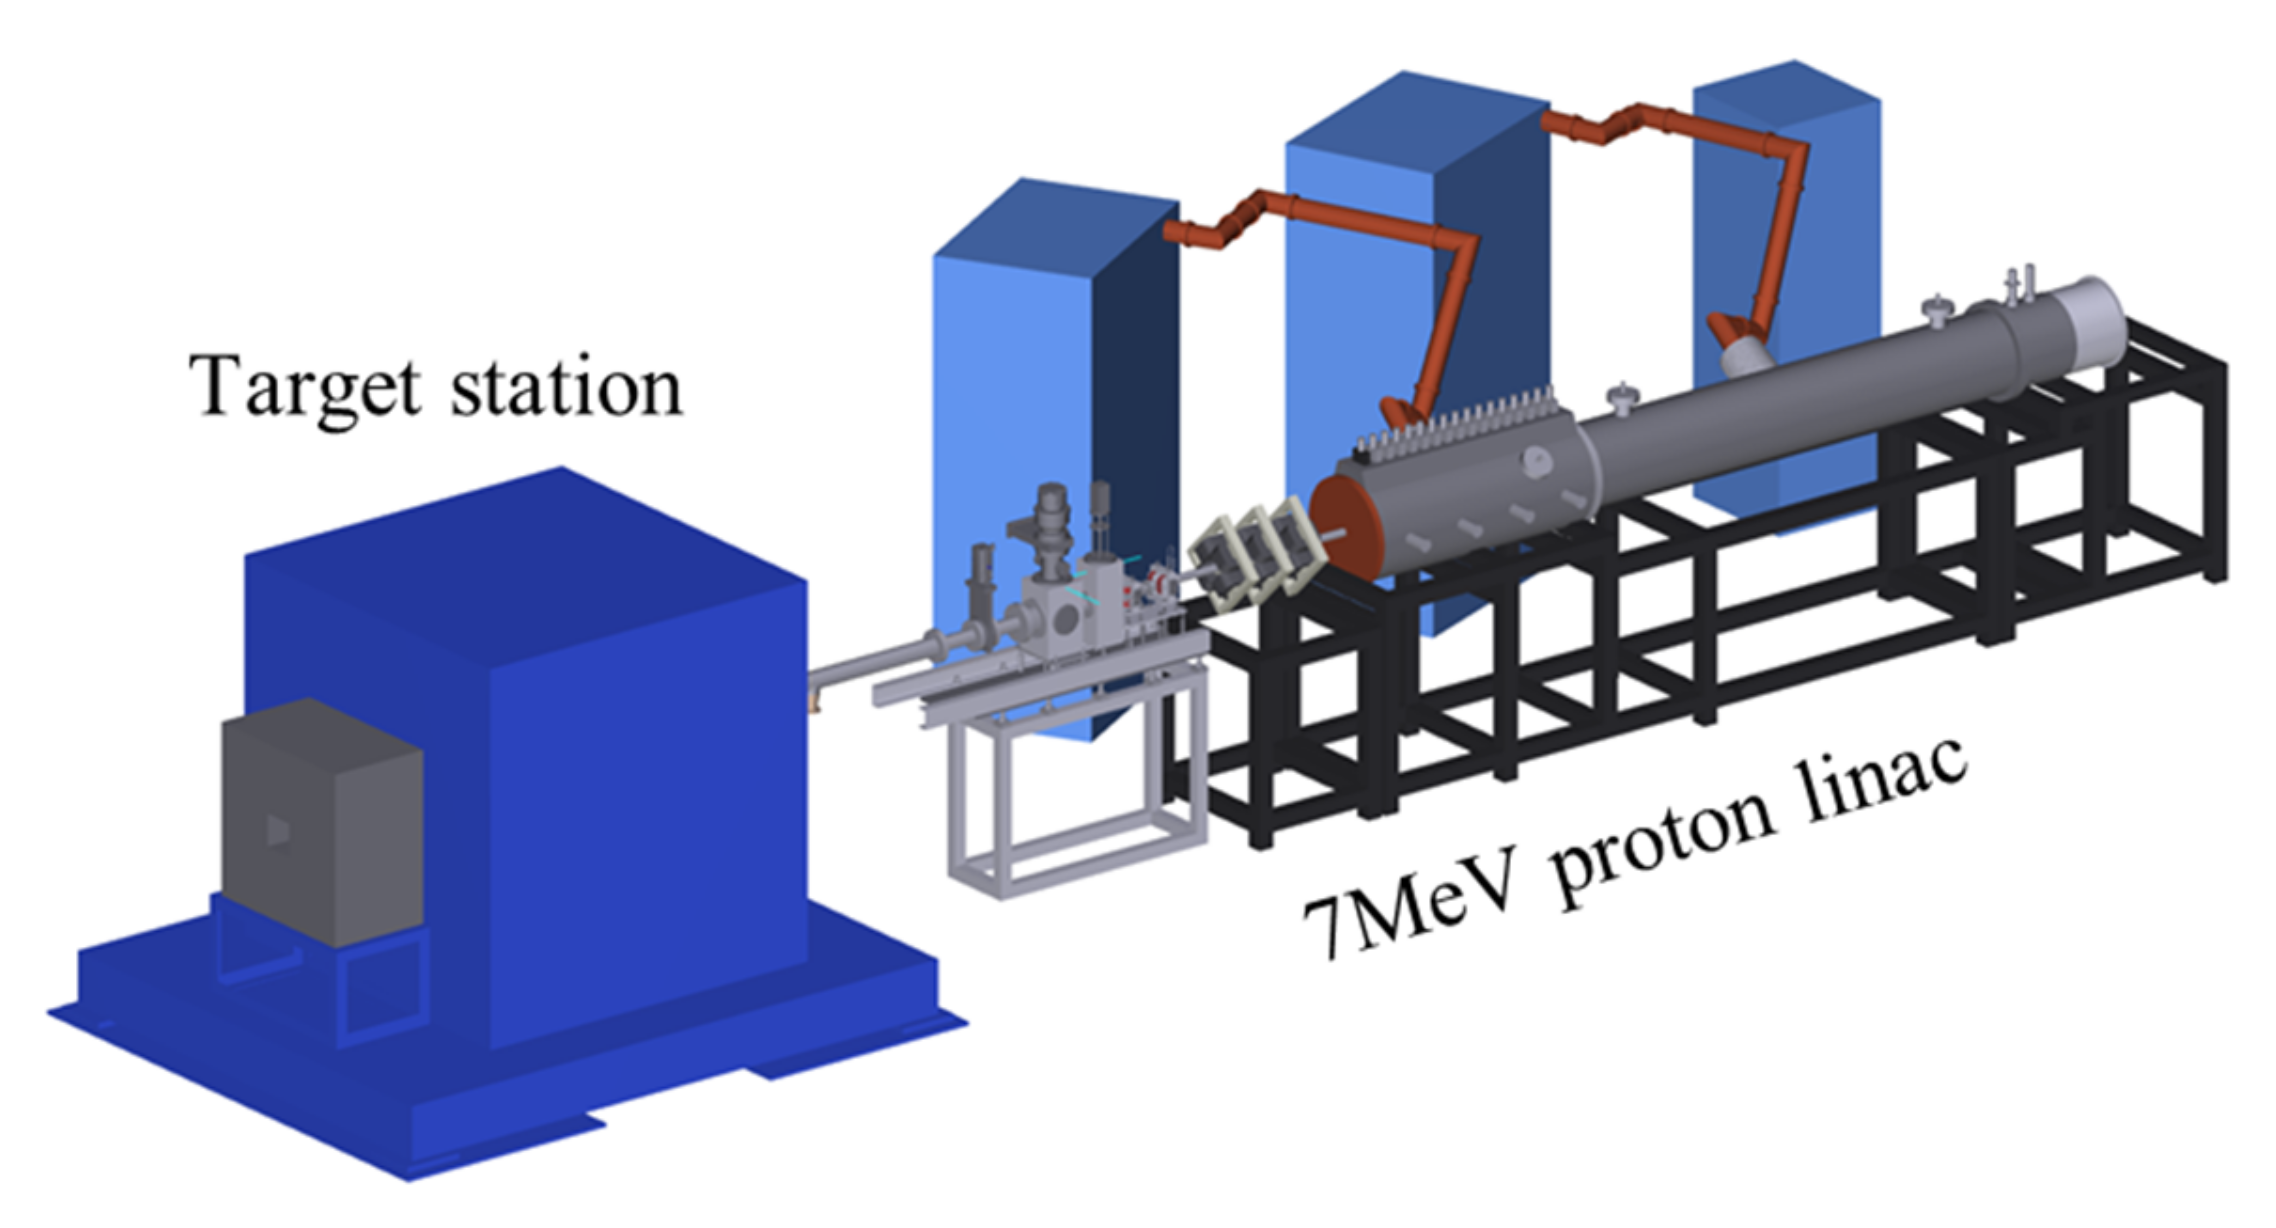
9] has been in operation since 2013. RANS research and development have two major goals: (1) to establish a compact low-energy neutron non-destructive evaluation system on site, of a floor-standing type for industrial use, and (2) to invent a transportable compact neutron system for the preventive maintenance of large-scale constructions, such as bridges. A schematic drawing of RANS is shown in
Figure 1. Pulse neutrons are generated through the 9Be + p reaction of 7-MeV protons with a 300-μm beryllium target. Thermal neutrons are available with a 4 cm thick polyethylene (PE) moderator placed just after the beryllium target.
To construct a Talbot–Lau interferometer, gadolinium (Gd) absorption gratings with high-aspect-ratio lamellae are required. For this purpose, an improved oblique evaporation method [
10] was used. Using fabricated Gd gratings, a compact Talbot–Lau interferometer that is approximately 700 mm along the beam axis was designed and constructed so that the wavelength of 2.37 Å was optimal for operation. Thermal neutrons with a peak energy of approximately 50 meV (wavelength: 1.28 Å) [
11] that were generated by the PE moderator were introduced to the interferometer. A time-of-flight (TOF) position-sensitive detector was employed, and images formed by the neutrons around the wavelength of 2.37 Å were used for phase imaging. In this study, in addition to the details of the phase imaging setup, the feasibility of neutron phase imaging using the RANS is described, along with the results obtained for metal rod samples.
2. Talbot–Lau Interferometer
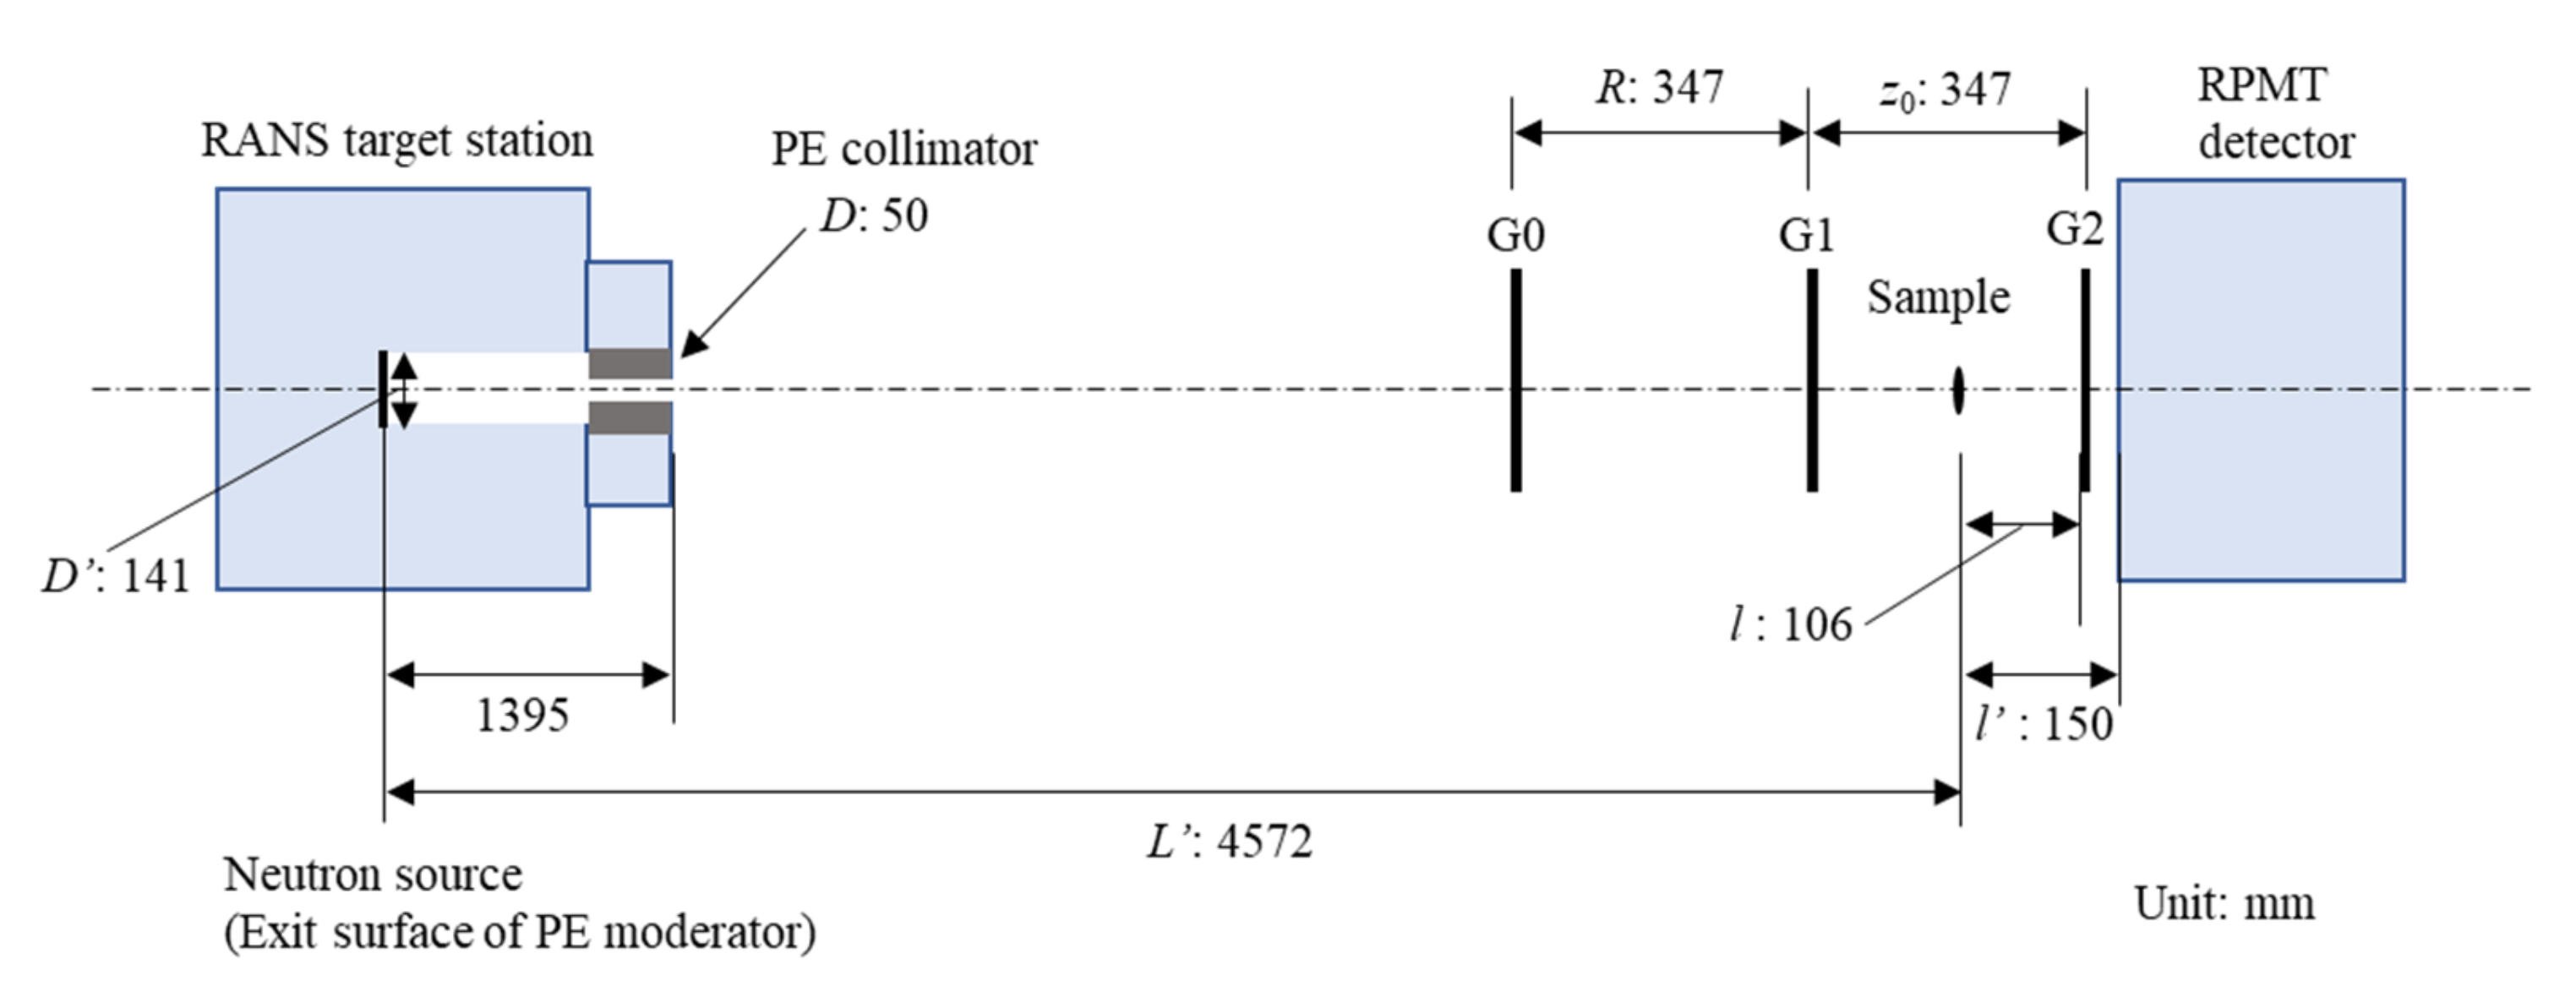
The layout of the Talbot–Lau interferometer using the RANS is shown in
Figure 2. The Talbot–Lau interferometer is composed of three transmission gratings (G0, G1, and G2) with pitches of
d0,
d1, and
d2, respectively. The function of the interferometer is based on the self-imaging effect (Talbot effect [
12] or fractional Talbot effect) caused by G1. According to the fractional Talbot effect, high-contrast striped patterns appear at propagation lengths
where
λ is the de Broglie wavelength of neutrons, and
p is the fractional Talbot order, which satisfies
p =
m + 1/2 (
m: positive integer) when a
π/2 phase grating is used for G1. Here,
M is the magnification of the self-image, defined as
where
R is the distance between G0 and G1. For self-image formation, the G1 grating must be irradiated by spatially coherent neutrons with a spatial coherence length that is comparable to or longer than
pd1. To establish this condition, even with an incoherent source, a G0 grating (a slit array) is introduced. When G0 satisfies the condition
the self-image generated by the neutrons through each slit of G0 is constructively overlaid at the G2 position. Thus, the following relationship is satisfied:
The spatial coherence condition is sufficiently satisfied if the slit opening width is smaller than half of
d0 [
13].
When an object is inserted (in this study, between G1 and G2), the self-image is deformed according to refraction and scattering by the object. However, a self-image with a pitch on the order of micrometers is not generally resolved by a neutron image detector, and G2 is used to visualize the deformation by generating a moiré pattern (moiré fringes), which is easily resolved by the image detector.
The lateral shift of moiré fringes with regard to the local moiré fringe period (in other words, the phase shift
Φ of moiré fringes) is measured using phase-stepping measurements [
14]. The beam deflection angle
θ caused by refraction at the object is given by
where
l is the distance between the object and G2. The differential phase shift of the neutron wave at an object is given by 2
πθ/
λ.
In addition to
Φ, the visibility of the moiré fringes is modulated by the sample. A scattering image can be obtained by extracting the change in visibility. This contrast is sensitive to scatterers in the sample, whose sizes are comparable to the autocorrelation length,
λl/
d2 [
15].
An interferometer to be combined with a compact source should also be designed to be compact. For this reason, a symmetrical geometry was introduced, where the G0–G1 distance is equal to the G1–G2 distance (i.e.,
R =
z0). The design parameters of the gratings are presented in
Table 1. The pitches of G0 and G2 were set to 18 μm (
d0 =
d2, because
R =
z0). The duty cycles (the ratios of an opening width to a grating pitch) were set at 0.27 and 0.5, respectively, by considering a figure of merit of Talbot–Lau interferometry [
13]. The design wavelength of the interferometer was selected as 2.37 Å; therefore, the distances
R and
z0 were 347 mm (
p = 0.5). G0 was set at 3984 mm from the neutron source (the exit surface of the PE moderator) of the RANS. The length of the system, including the neutron source, was approximately 5 m, with an interferometer approximately 700 mm in length. This is considerably compact in comparison with other systems (for example, the total length of the J-PARC system is 18 m, including a 1.6 m interferometer [
16]).
3. Neutron Gratings
G0 and G2 of the Talbot–Lau interferometer should be absorption gratings that can optimally block neutrons using lamellar structures. Gd is the most preferable material for neutron absorption gratings because it has the largest absorption cross-section for cold and thermal neutrons [
2]. Nevertheless, a Gd lamellar structure higher than a few tens of micrometers is necessary to block thermal neutrons sufficiently. Considering that the grating pitch is normally in the order of micrometers, high-aspect-ratio structures must be formed by Gd. Metallic-glass imprinting [
17] and oblique evaporation [
18] methods have been developed to fabricate Gd gratings. To fabricate a large Gd grating with a controlled Gd lamella shape, an improved oblique evaporation method has been developed that repeats Gd evaporation onto a Si grating by controlling the Gd incident angles against Si lamellae [
10,
19].
Figure 3a,b show photographs of G0 and G2 fabricated with an area of 64 mm in the lamella direction (vertical) and 40 mm in the orthogonal direction. A scanning electron microscopy (SEM) image of a cross-section of a grating fabricated under the same conditions as G2 is shown in
Figure 3c. Gd lamellae with a height greater than 40 μm and a duty cycle of 0.5 were successfully fabricated.
For G1, a silicon phase grating was fabricated using the Bosch process [
20] with a pitch of 9 μm. The height of the silicon lamella of G1 was 32 μm, which caused
π/2 phase shift for neutrons of 2.37-Å wavelength.
4. Experiment
The RANS generated pulsed neutrons with a repetition rate of 104 Hz. A position-sensitive photomultiplier tube (PS-PMT) [
21] with a spatial resolution of approximately 1 mm was placed 44 mm behind G2. Because the PS-PMT can differentiate events of incident neutrons by position and time, wavelength-resolved neutron images are obtained by TOF analysis.
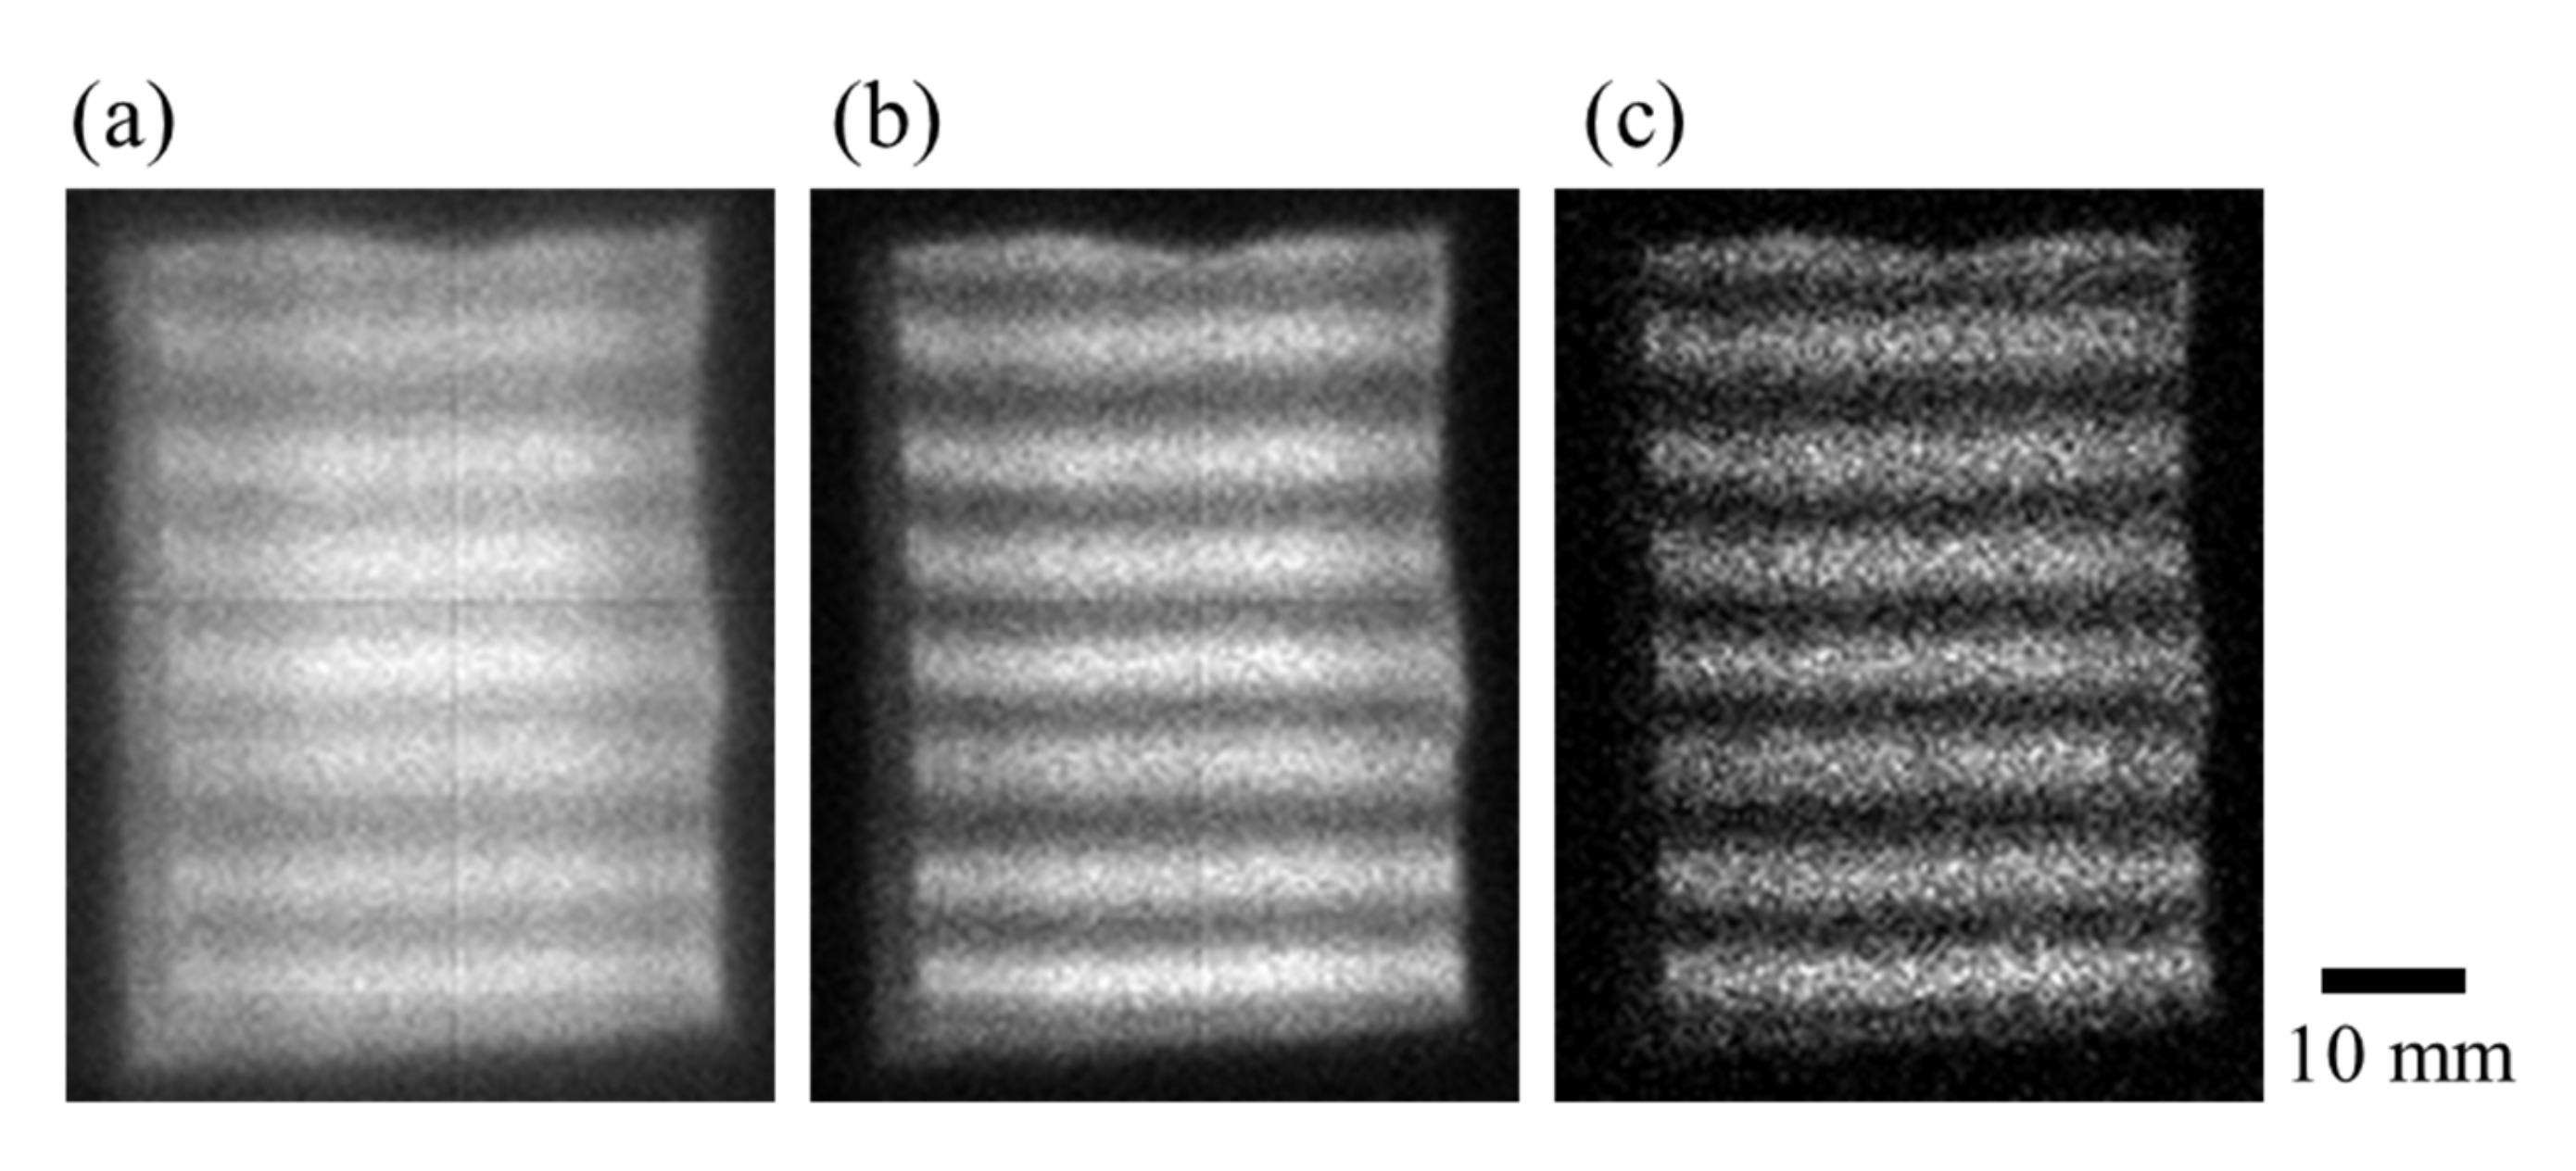
Figure 4 shows the moiré patterns obtained with an exposure time of 300 s at an average proton beam current of 20 μA. Neutrons reaching outside the grating area (40 × 64 mm) were blocked by B
4C blended rubber sheets and boronated PE blocks to reduce stray scattering noise. The visibility of the moiré patterns was assessed by the ratio of the zeroth-order to the first-order Fourier coefficients of the curves obtained by the phase-stepping measurement. The visibility of neutrons only around the design wavelength (2.37 Å) extracted by the TOF treatment was 0.59, as shown in
Figure 4c. In the sample measurement shown below, the TOF range was expanded to 1.2–3.6 Å, because the wavelength range of
λ ±
λ/2 contributes to the formation of a moiré pattern constructively [
16] and an increased flux is ensured. The resultant visibility was 0.37—see
Figure 4b.
The sample to be measured was set between G1 and G2 with
l = 106 mm. The phase-stepping measurement was performed by moving G0 in the transverse direction of the lamella with a regular step of
d0/5 (i.e., 3.6 μm).
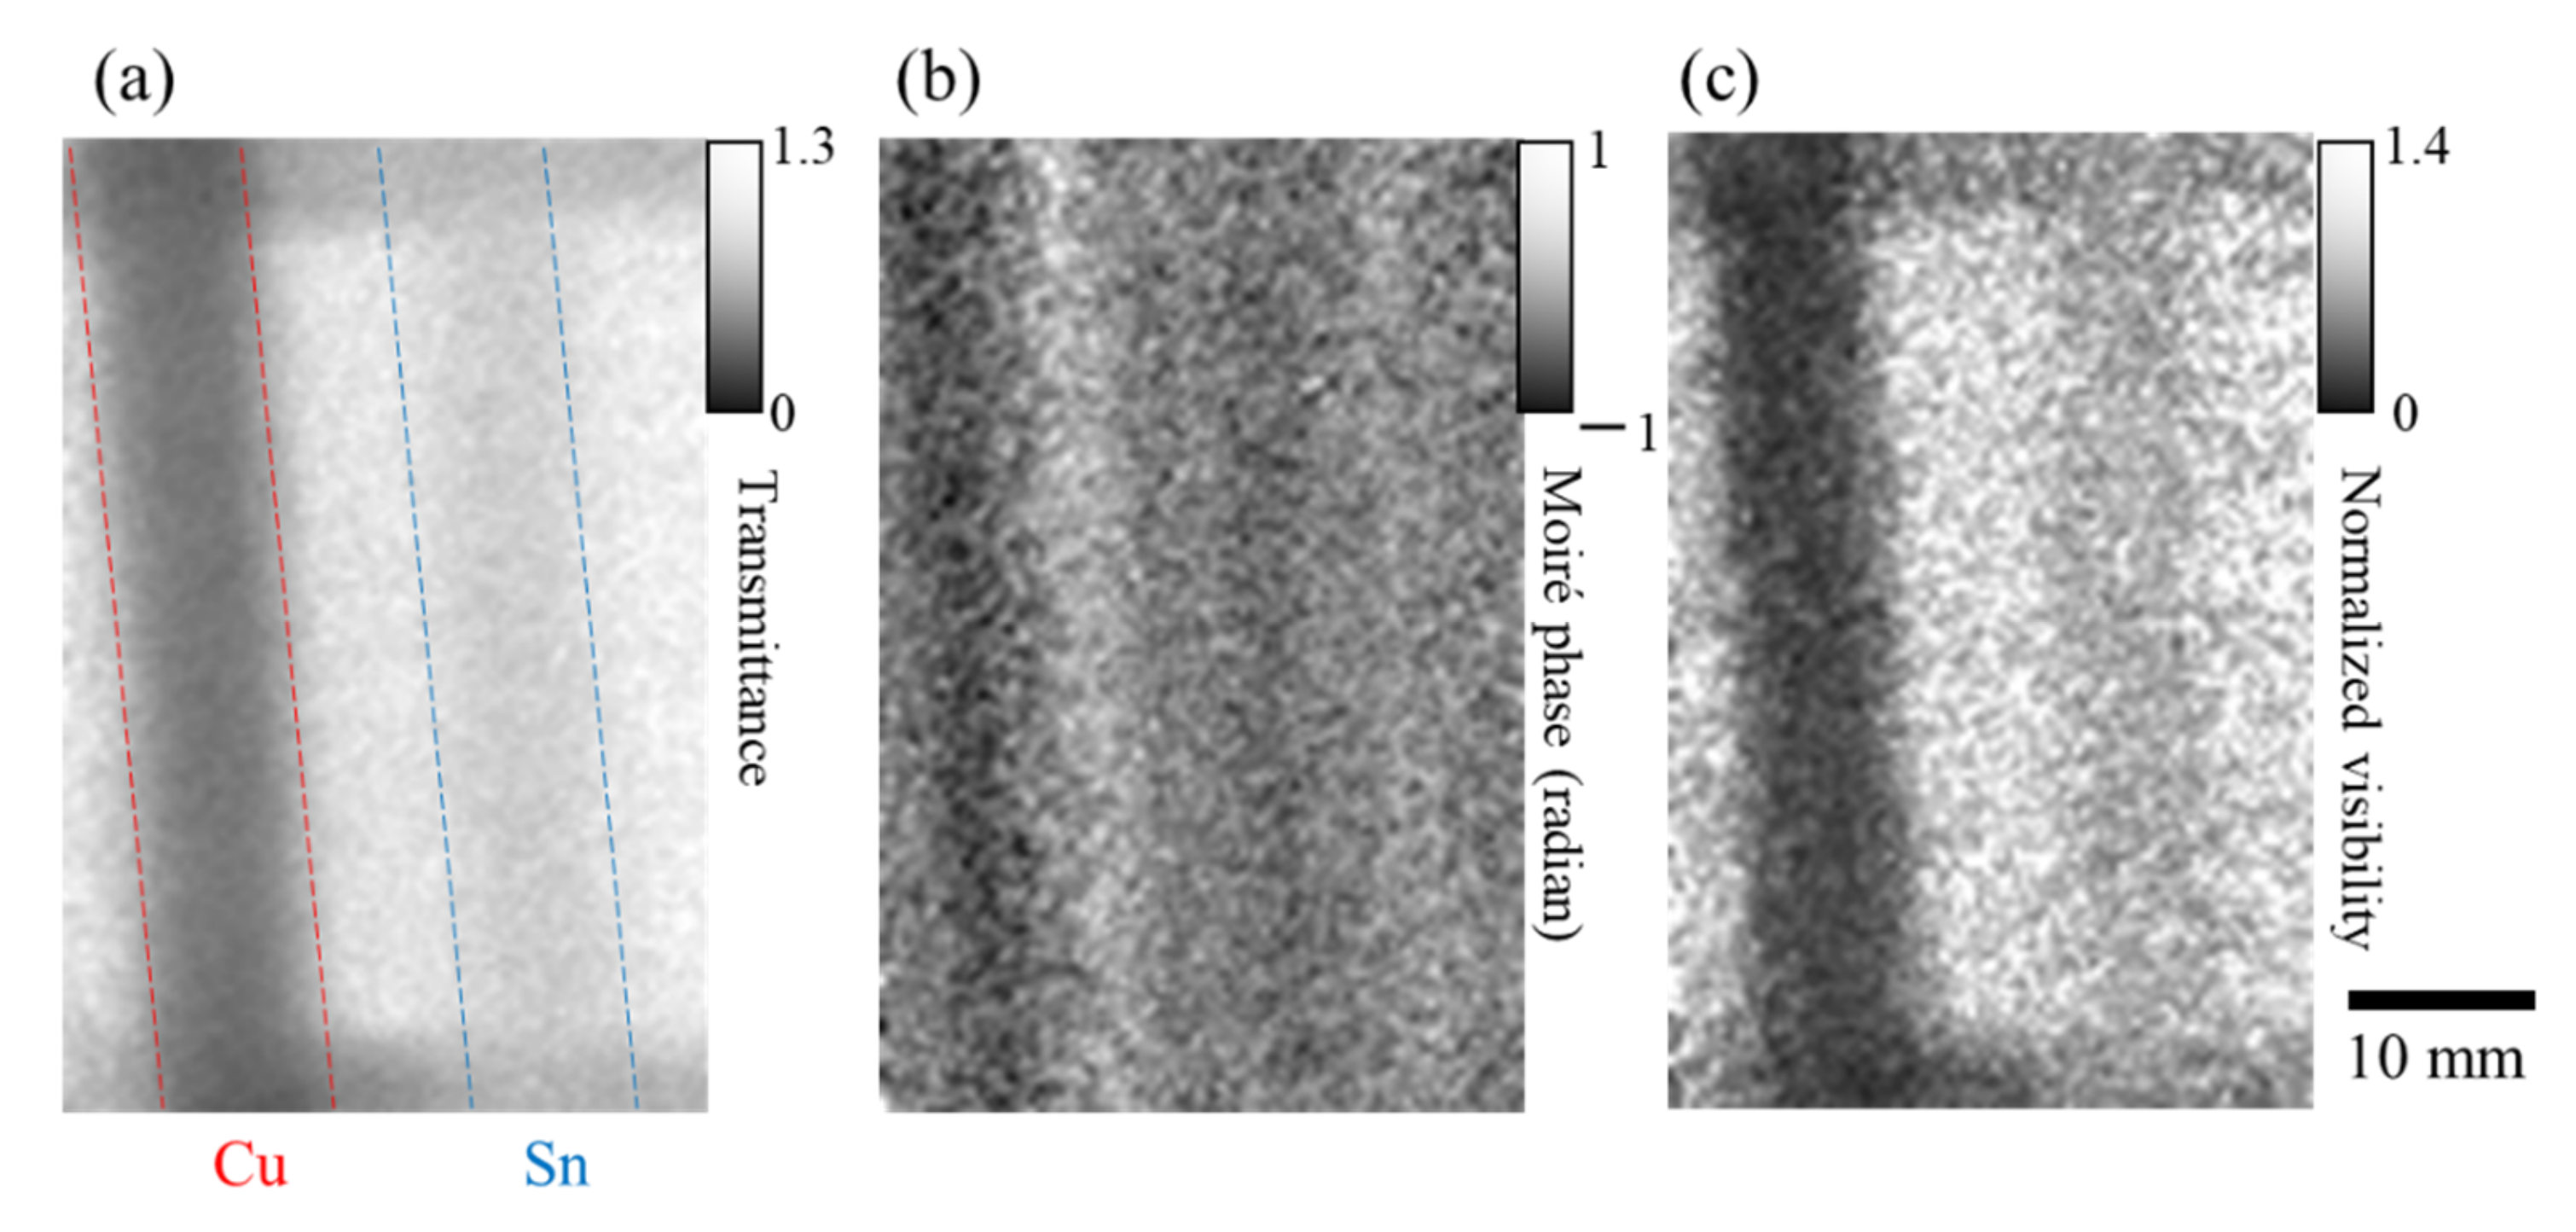
Figure 5 shows the results obtained for a copper rod (left) and a tin rod (right) with a diameter of 10 mm. The exposure time for each step was 300 s with an average proton beam current of 35 μA. An absorption image, a differential phase image, and a scattering image (a normalized visibility image) were calculated using the phase-stepping measurement with the sample and the same measurement without the sample. The position errors of G0 in the phase-stepping measurement induced artifacts in the resultant images. An error estimation algorithm [
22] was used to reduce these errors.
In phase imaging using a Talbot–Lau interferometer, it is essential to secure a finite distance l between a sample and G2 (i.e., distance l’ between a sample and an imaging detector) to detect refraction and scattering by a sample, while a sample should be set just in front of an imaging detector in conventional radiography to avoid blurring caused by the size of the source. Therefore, the blurring effect because of the finite sample-detector distance should be considered in phase imaging. The larger the l, the higher the sensitivity of refraction, as suggested by Equation (5), but the larger the l, the lower the spatial resolution. Thus, the spatial resolution and phase-detection sensitivity have a tradeoff relationship.
The spatial resolution can be geometrically estimated using Dl’/L, where D is the effective source size, and L is the distance between the effective source and the sample. The RANS target station was equipped with a PE collimator with a hole 50 mm in diameter, and the distance from the source to its exit was 1395 mm. When the collimator hole is regarded as an effective neutron source, the theoretical spatial resolution is 2.4 mm. However, the experimental resolution value obtained by analyzing a transmission image of the edge of a steel plate 6 mm in thickness (without gratings) was 3.2 mm. Assuming that the effective source is the exit of the moderator, Dl’/L’ is 4.6 mm. This result suggests that the collimator did not work ideally in the imaging system. Further collimation is necessary to improve the spatial resolution of neutron phase imaging, and a more detailed study is planned to investigate the source properties and design an improved source structure.
The distance l also affects the property of the scattering image that is relevant to the structures unresolvable by the system resolution. The autocorrelation length λl/d2 was approximately 1.4 μm in the system. A structural analysis covering a range from sub-micrometer to several micrometers is possible with scattering images measured by changing l, which is included in future experimental plans.
Further developments in grating fabrication should improve the performance of phase imaging. Enlargement of the grating area is an important development issue because the grating area determines the field of view. The fabrication of a higher Gd lamella is also needed.
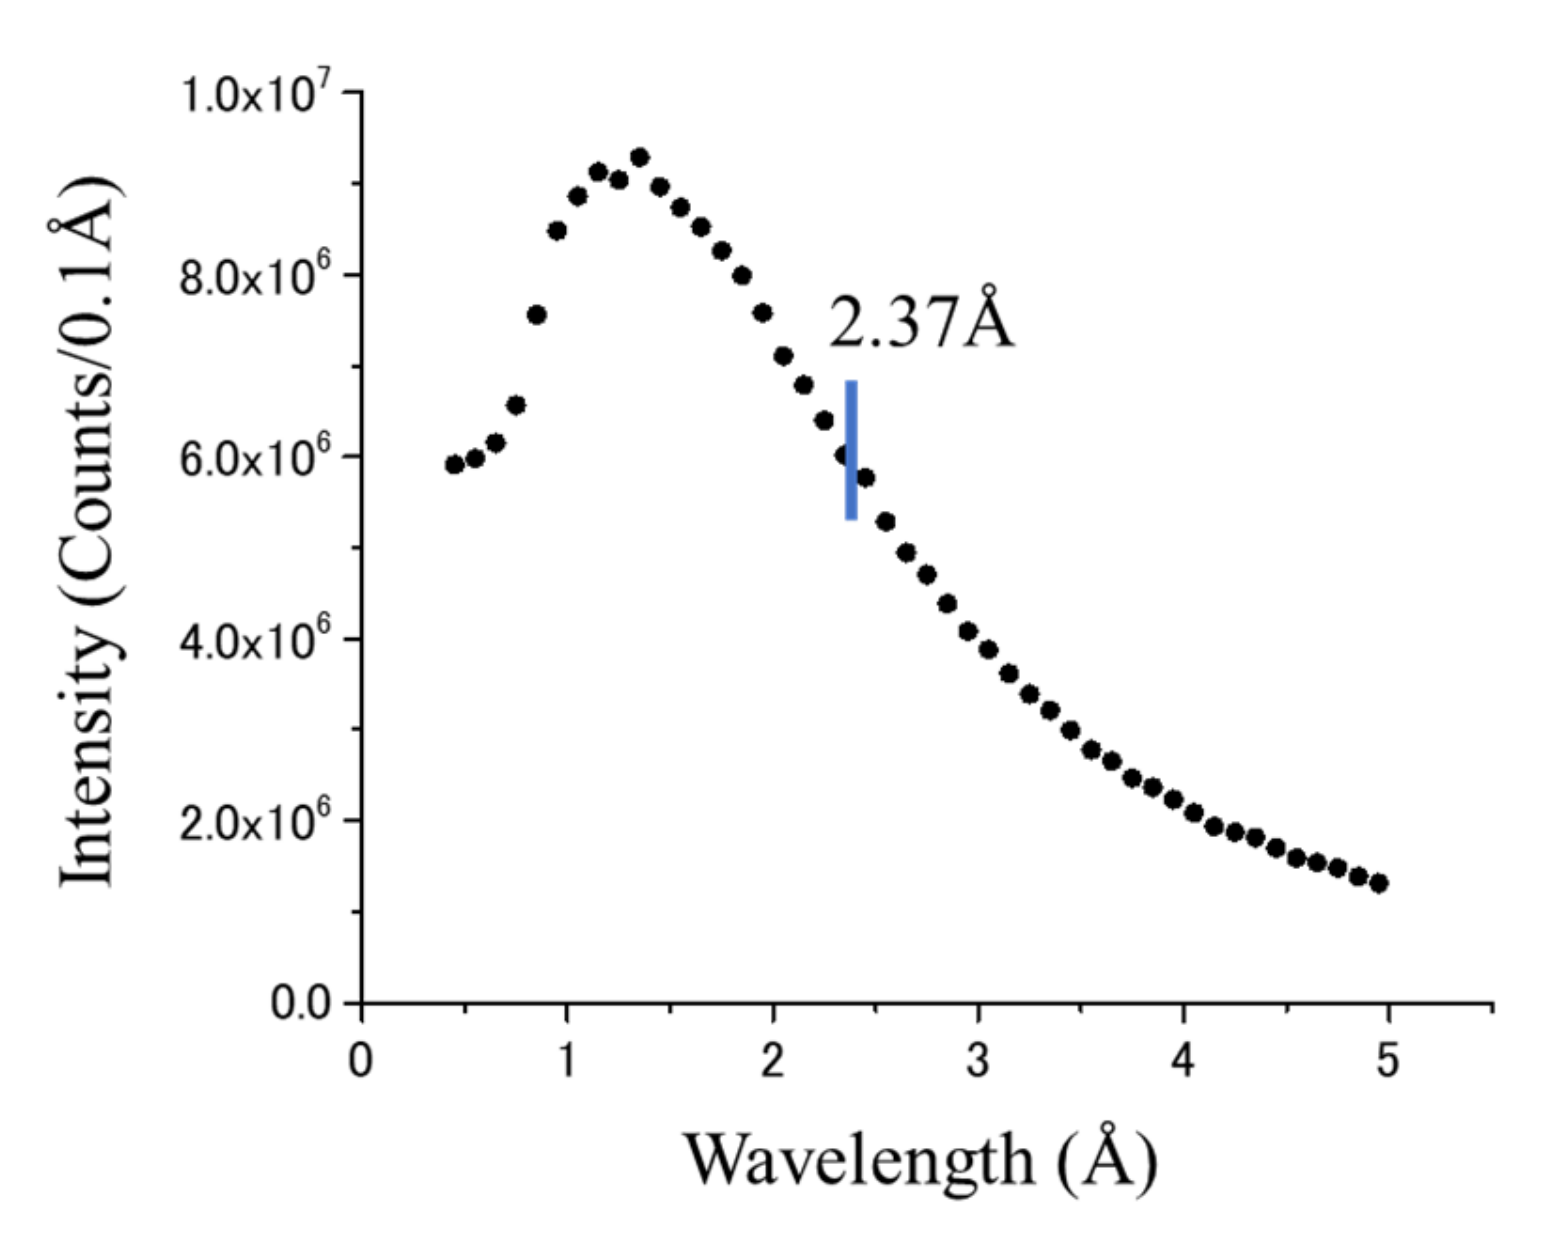
Figure 6 shows the RANS thermal neutron spectrum obtained by TOF separation using the PS-PMT. Because the RANS peak wavelength is near 1.25 Å [
11], the development of absorption gratings with higher lamellae should make it possible to use the RANS more effectively. These efforts should make it possible to evaluate thicker objects.
In addition, the proton beam current of the RANS was limited to 35 μA because of the condition of the accelerator. The maximum current of the proton beam should be increased to 100 μA or more by tuning the accelerator, which will make it possible to perform phase imaging with shorter exposures. Furthermore, a smaller neutron source, the RANS-II (total length 5 m) [
23], is currently in operation. Neutron phase imaging especially for on-site non-destructive inspection is an attractive challenge with this source as a next step.
5. Conclusions
The feasibility of neutron phase imaging using the RANS was demonstrated. Neutron moiré patterns were obtained using a Talbot–Lau interferometer with gadolinium gratings fabricated using the improved oblique evaporation method, wavelength discrimination using pulsed neutrons, and a TOF detector. The phase imaging experiment was performed with cold neutrons with a wavelength of 2.37 Å using a system with a total length of 10 m or less, including the measurement system. The spatial resolution was 4.2 mm and the total exposure time was 25 min. The current performance is preliminary, but the neutron phase imaging technique, which is compatible with a compact neutron source system, provides flexible modalities that can be applied to transparent materials beyond conventional neutron radiography. By expanding the field of view and using shorter-wavelength neutrons, it should be possible to observe large-scale specimens. Observation of sample dynamics, three-dimensional measurement using tomography, etc. should be within the scope of the development of neutron phase imaging with the RANS.


 ,
, 

