Article

Nanopore Formation in CeO2 Single Crystal by Ion Irradiation: A Molecular Dynamics Study

1
Department of Materials Science and Engineering, Graduate School of Science and Engineering, Ibaraki University, 4-12-1 Nakanarusawa, Hitachi 316-8511, Japan
2
Japan Atomic Energy Agency (JAEA), 2-4 Shirakata Shirane, Tokai 319-1195, Japan
3
The Wakasa Wan Energy Research Center, 64-52-1 Nagatani, Tsuruga 914-0192, Japan
*
Author to whom correspondence should be addressed.
Quantum Beam Sci. 2021, 5(4), 32; https://doi.org/10.3390/qubs5040032
Submission received: 15 October 2021 / Revised: 7 November 2021 / Accepted: 9 November 2021 / Published: 18 November 2021

Abstract

:
The nanopore formation process that occurs by supplying a thermal spike to single crystal CeO2 has been simulated using a molecular dynamics method. As the initial condition, high thermal energy was supplied to the atoms in a nano-cylinder placed at the center of a fluorite structure. A nanopore was generated abruptly at around 0.3 ps after the irradiation, grew to its maximum size at 0.5 ps, shrank during the time to 1.0 ps, and finally equilibrated. The nanopore size increased with increasing effective stopping power gSe (i.e., the thermal energy deposited per unit length in the specimen), but it became saturated when gSe was 0.8 keV/nm or more. This finding will provide useful information for precise control of the size of nanopores. Our simulation confirmed nanopore formation found in the actual experiment, irradiation of CeO2 with swift heavy ions, but could not reproduce crystalline hillock formation just above the nanopores.

1. Introduction

When oxide metals are irradiated by high-energy heavy ions, nano-sized protrusions and pores are produced on the surface and inside the specimen, respectively. For example, in an irradiated NiO specimen, nano-sized protrusions and cylindrically shaped nanopores were generated simultaneously [1]. Using transmission electron microscopy (TEM), Jensen et al. [2] observed hillocks at both ends of tracks in Yttrium Iron Garnet (YIG) induced by high-energy -C60 ions. They believed that the matter was emitted from the ion track, leaving the spherical hillocks on the sample surface at the entrance and exit. Recently, Ishikawa et al. [3] found that hemispherical protrusions and nanopores were also generated in CeO2 by high-energy ion beam irradiation. Subsequently Ishikawa et al. [4] observed ion tracks and hillocks produced by swift heavy ions of different velocities in Y3Fe5O12 by TEM. They found the dimensions of the hillocks increase as a function of stopping power, Se. The data can be interpreted by the lifetime of the melt region produced by irradiation. Ion-irradiated CeO2 was studied extensively regarding its optical reflectivity [5] and spectroscopic characteristics [6], defects [7,8,9,10], grain size effects [11], X-ray Photoelectron Spectroscopy (XPS) [12], and effects of irradiation temperature on final structure [13].
Nanopore formation is an interesting phenomenon from the viewpoint of nano-order fabrication of materials and can lead to the realization of highly functional materials such as catalysts [14]. Therefore, it is crucial to clarify the formation mechanism of nano-sized protrusions and cylindrically shaped nanopores. Since high-energy beam irradiation is a non-equilibrium process and its relaxation time is very short, it is difficult to clarify such a mechanism only by an actual experiment. Molecular dynamics (MD) simulation provides a useful tool for the analysis of such a process because it can calculate the trajectories of individual atoms during a short time period.
In our previous papers, using computer-aided simulations, we studied the effects of high-energy, heavy-ion irradiation [15,16,17,18,19] as a theme in the development of a new generation of nuclear fuels with a high burn-up ratio. Employing MD simulations, we evaluated the disorder of a single crystal structure of specimens irradiated by fast particles. Our MD simulations elaborated the structural change followed by the high-energy dissipation of a nano-scale region in a single crystal of CeO2 after irradiation [18,19]. Yablinsky et al. [20] analyzed the structure of ion tracks and investigated thermal spikes in CeO2 with energy depositions using MD simulation. Medvedev et al. [21] developed the Monte-Carlo code TREKIS (Time-Resolved Electron Kinetics in swift heavy-ion Irradiated Solid) which models how a penetrating swift heavy ion (SHI) excites the electron subsystems of various solids, and the generated fast electrons spread spatially. Subsequently, the same group proposed a hybrid approach that consisted of the Monte-Carlo code TREKIS and the classical molecular dynamics code LAMMPS (Large-scale Atomic/Molecular Massively Parallel Simulator) for lattice atoms to simulate the formation process of a cylindrical track of about 2 nm diameter in Al2O3 irradiated by Xe 167 MeV ions [22]. Then, Rymzhanov et al. [23] simulated a structure in overlapping swift heavy-ion track regions in Al2O3 and found good coincidence with observation results of irradiated Al2O3 by high resolution TEM. Another paper by Rymzhanov et al. [24] examined swift heavy-ion irradiation of forsterite (Mg2SiO4) and the effects of the ion energy and its energy losses on the track radius were explained, and the track formation thresholds was determined [24]. Rymzhanov et al. [25] also clarified that different ion tracks were produced in MgO, Al2O3, and Y3Al5O12 (YAG) by irradiation with Xe (176 MeV) ions, whereas no ion tracks in MgO, discontinuous distorted crystalline tracks in Al2O3 and continuous amorphous tracks in YAG were detected. Recently, Rymzhanov et al. [26] studied the irradiation process of MgO, CaF2, and Y3Al5O12 (YAG) with fast ions. They found MgO and CaF2 showed recovery of transient damage in the surface region, forming a spherically shaped nano-hillock, whereas YAG showed almost no recovery of the transient disorder, forming an amorphous hillock. The movie they attached as supplemental material demonstrates nano-hillock formation of CaF2 irradiated by 200 MeV Au. Some of the above same researchers teamed with Karlušić et al. [27] to research Al2O3 and MgO irradiated under grazing incidence with an I beam of 23 MeV. In this study, they found grooves surrounded with nano-hillocks on MgO surfaces and smoother, roll-like discontinuous structures on the surfaces of Al2O3.
In the present study, we used an MD method to simulate the nanopore structure formation process in a single crystal CeO2 with two free surfaces by supplying a thermal spike. Structural analysis was done for the obtained specimens. We evaluated the number of Frenkel pairs as a function of the thermal energy deposited per unit length in the specimen, gSe, which represents the beam strength. We classified various types of oxygen Frenkel pairs by the distance between the vacancy and the corresponding oxygen atom.

2. Simulation Method

2.1. Molecular Dynamics

Concerning the MD simulation method, we adopted the same method as our previous work [19], except that the specimens have a free surface. Therefore, the calculation method is only outlined as follows. The Ce and O atoms were laid out to form the fluorite structure unit cell. Then, the unit cell was cloned 6 times each in <010> and <100> directions and 4 times in the <001> direction. The dimensions of the CeO2 crystal were 3.25 nm × 3.25 nm × 2.33 nm, whereas those of the calculation region were 3.25 nm × 3.25 nm × 3.25 nm. There was a free space on the upper and lower sides of the CeO2 crystal along the <001> direction to mimic the free surface. Figure 1a shows the unit structure of the CeO2 fluorite structure and Figure 1b shows the whole system for calculation.
In order to calculate the interaction between the atoms, we used the potential type proposed by Inaba et al. [28]. This is the Born–Mayer–Huggins potential type, which has a function form as
ϕ i ( r i j ) = z i z j e 2 r i j + f 0 ( b i + b j ) e x p ( a i + a j r i j b i + b j ) c i c j r i j 6
where rij is the distance between ions i and j, zi is the effective valence of an ion i, e is the electron charge, f0 is a constant to adjust the unit, ci and cj are the parameters of the molecular interaction term, and ai and bi are the parameters of the repulsion term. For the electrostatic interactions, the Ewald method was applied. The potential cut-off was 1.37 nm for short range interaction and for the real part of the Ewald summation. The potential parameters were determined to reproduce the lattice parameters at various temperatures and the bulk modulus of CeO2. The fitted parameters for CeO2 are presented in Table 1.
A cylindrical region with a diameter of 1.0 nm located at the center of the calculation region in the <001> direction was considered as the irradiation beam trajectory. Using a MD method, we initially relaxed the structure at the temperature of 298 K before a high thermal energy was applied to the cylindrical region. This temperature was set as typical ambient temperature, or room temperature. Thermal energy is a part of the energy deposited by the heavy-ion irradiation. The present study names this thermal energy as an effective stopping power, and it is described as gSe. The parameter g in gSe signifies the ratio of thermal energy transferred from stopping power to the lattice as the vibration energy. In the MD simulation, the high thermal energy was applied to the cylindrical region by setting the velocity of the atoms in the region to values ranging from gSe = 0.0 to 1.6 keV/nm with 0.1 keV/nm energy bins according to the Maxwell distribution. According to the experiment by Ishikawa et al. [3], Se = 32.0 keV/nm for 200 MeV Au ion. The maximum value of gSe for our simulation is gSe = 1.6 keV/nm, thus the energy transfer ratio g = 0.05. According to TREKIS, a 167 MeV Xe ion gives Se = 21, 24.9 and 25 keV/nm for MgO, Al2O3 and YAG, respectively, and it gives a radial distribution of the excess lattice energy density around the trajectory of the irradiated ion (see Figure 2 in reference [25]). A rough estimation of gSe can be made from the excess lattice energy of MgO and Al2O3 as gSe = 2 keV/nm and the value of g is the same order as ours. The temperature of the region outside the cylindrical region with a diameter of 2.0 nm was kept at 298 K by the velocity scaling method [29]. In <010>, <001> and <100> directions, the periodic boundary condition was considered. The simulation duration was 10,000 molecular dynamic intervals, each taking 0.3 fs, summing up to 3 ps.

2.2. Structure Analysis

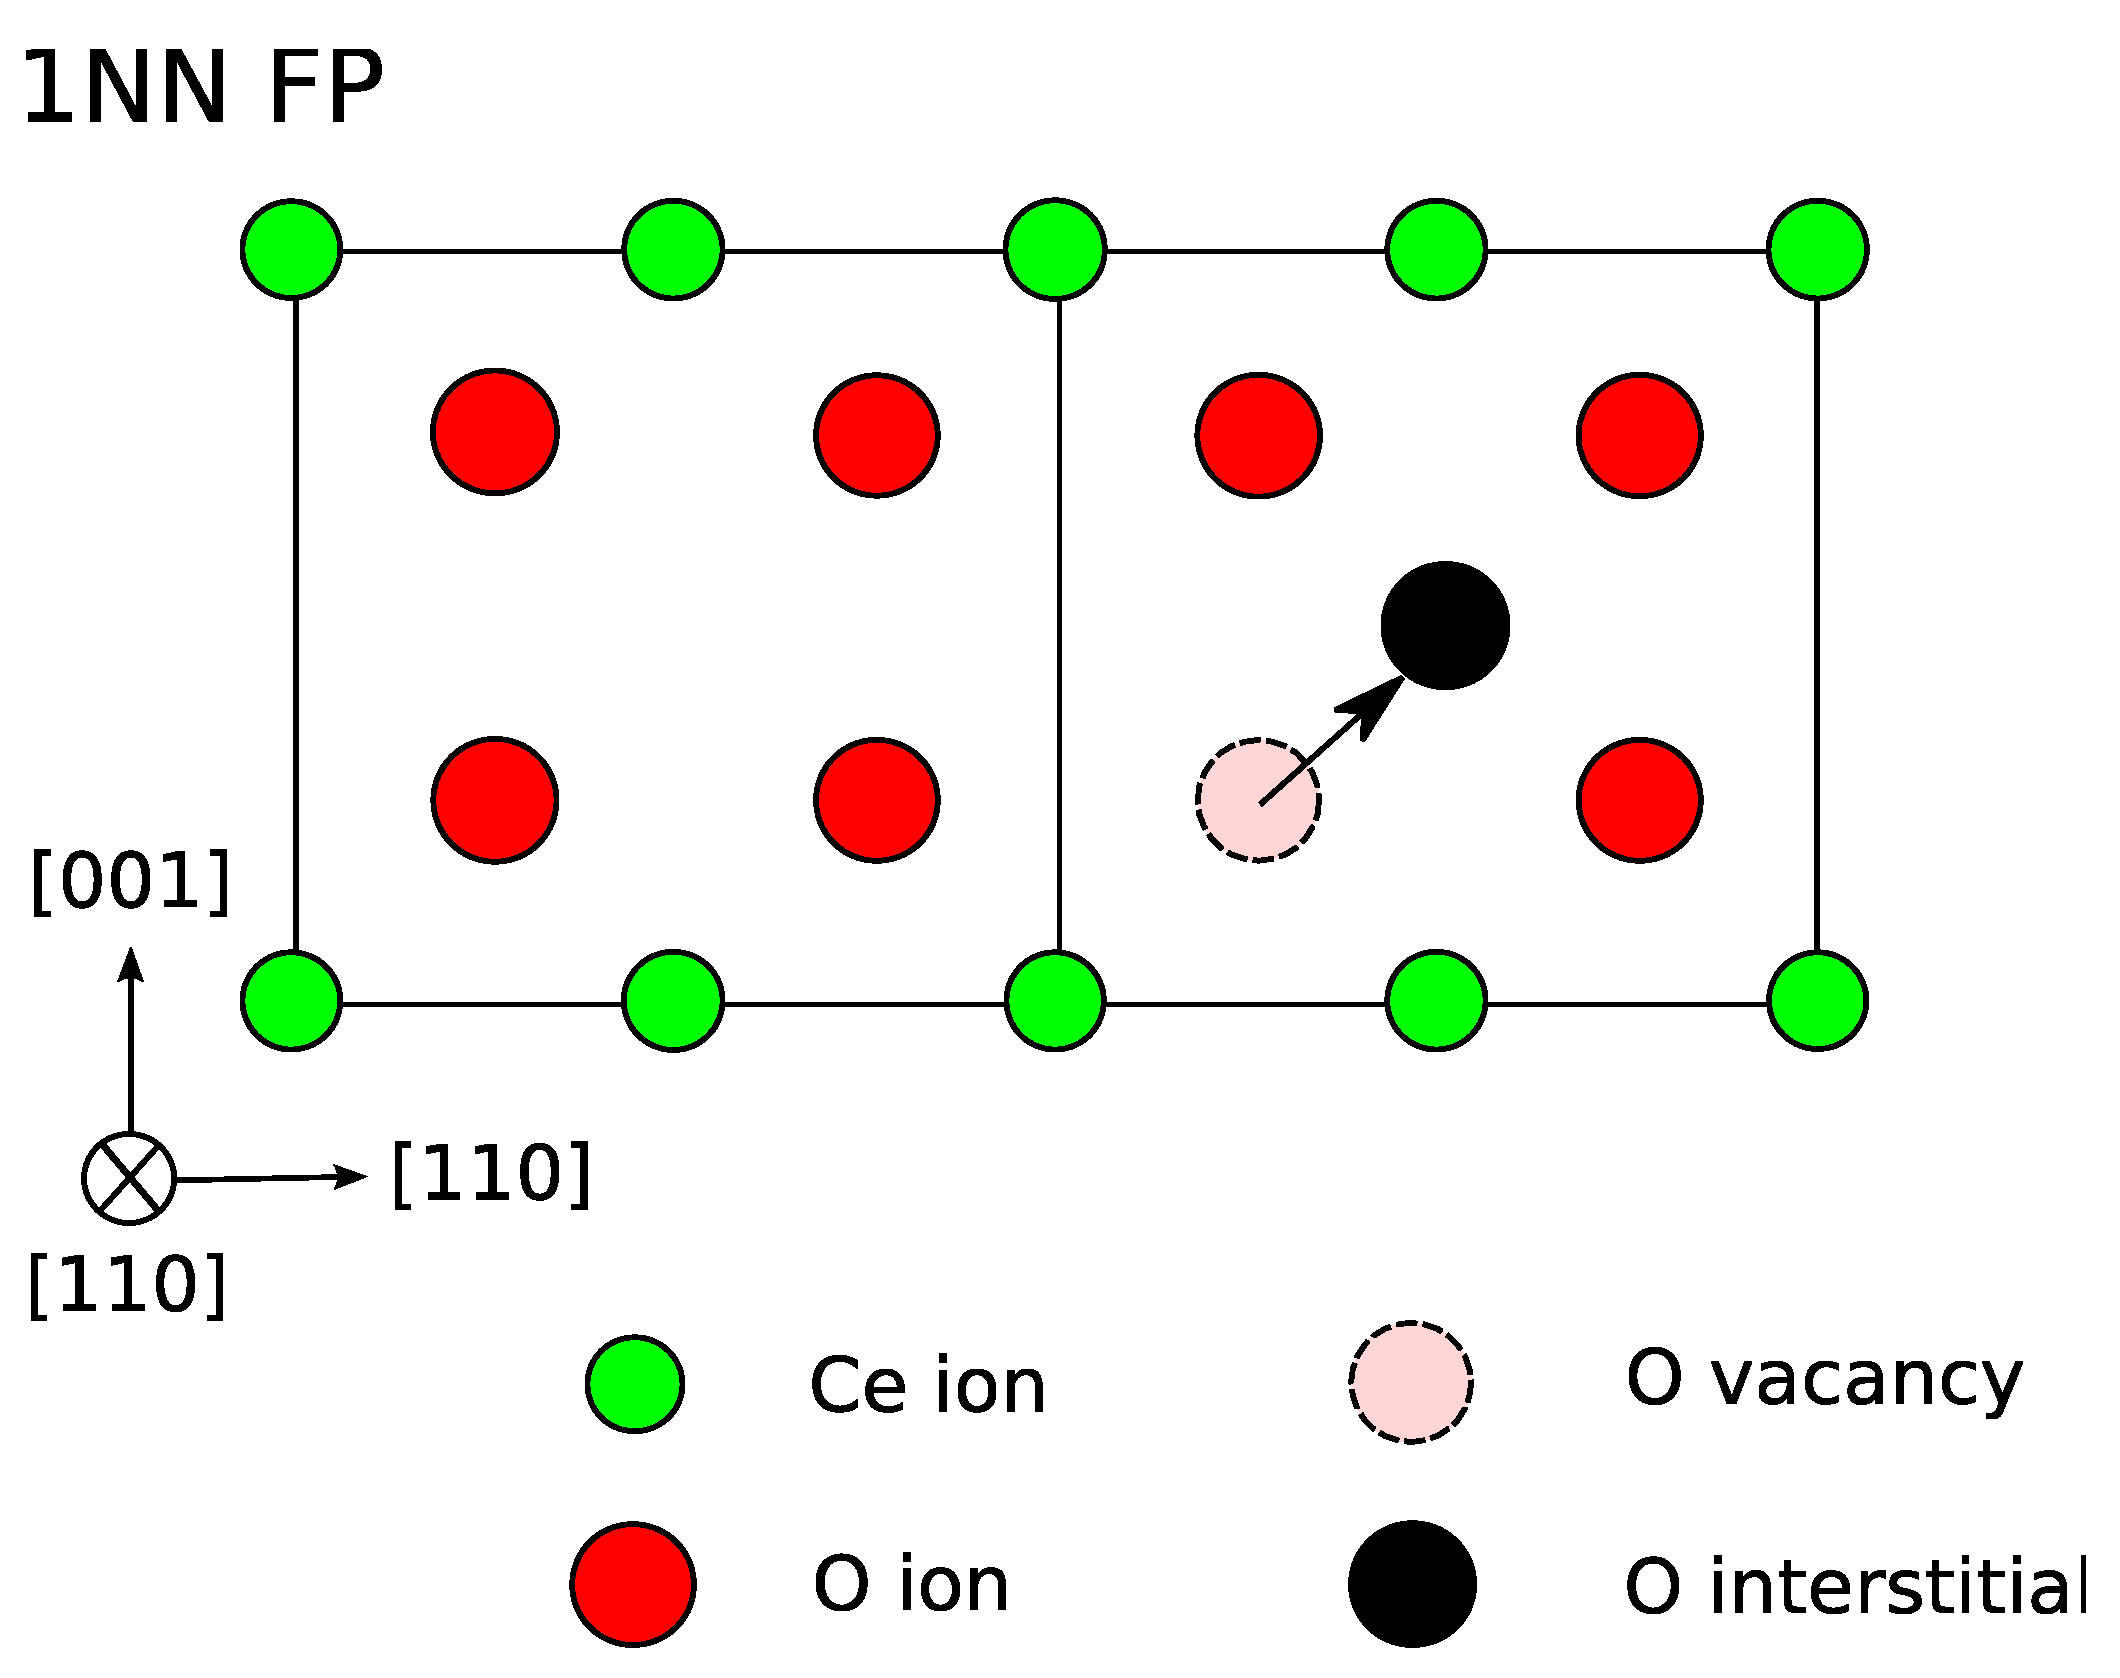
A vacancy is defined as the vacant site in the CeO2 fluorite structure, such that the distance between the vacant site and the nearest atom from the site is larger than the atomic radius of O or Ce originally set at the vacant site, 0.097 nm (for O) and 0.138 nm (for Ce). This is what we call the “Lindemann criterion”, and it may overestimate the number of vacancies. An oxygen Frenkel pair is defined as the pair of a vacant site and the oxygen atom which escaped from the site. Oxygen Frenkel pairs can be classified according to the distance between the vacant site and the oxygen atom that was originally located at the site, such as 1NN (1st nearest neighbor) Frenkel pair, 2NN Frenkel pair, and so on [30]. Figure 2 shows an example of a 1NN Frenkel pair, and Table 2 lists the distance between the vacant site and the oxygen atom for iNN Frenkel pairs (i = 1, 2, …, 7). We evaluated the number of vacancies and Frenkel pairs in the irradiated specimen as a function of time and as a function of gSe.

3. Results and Discussion

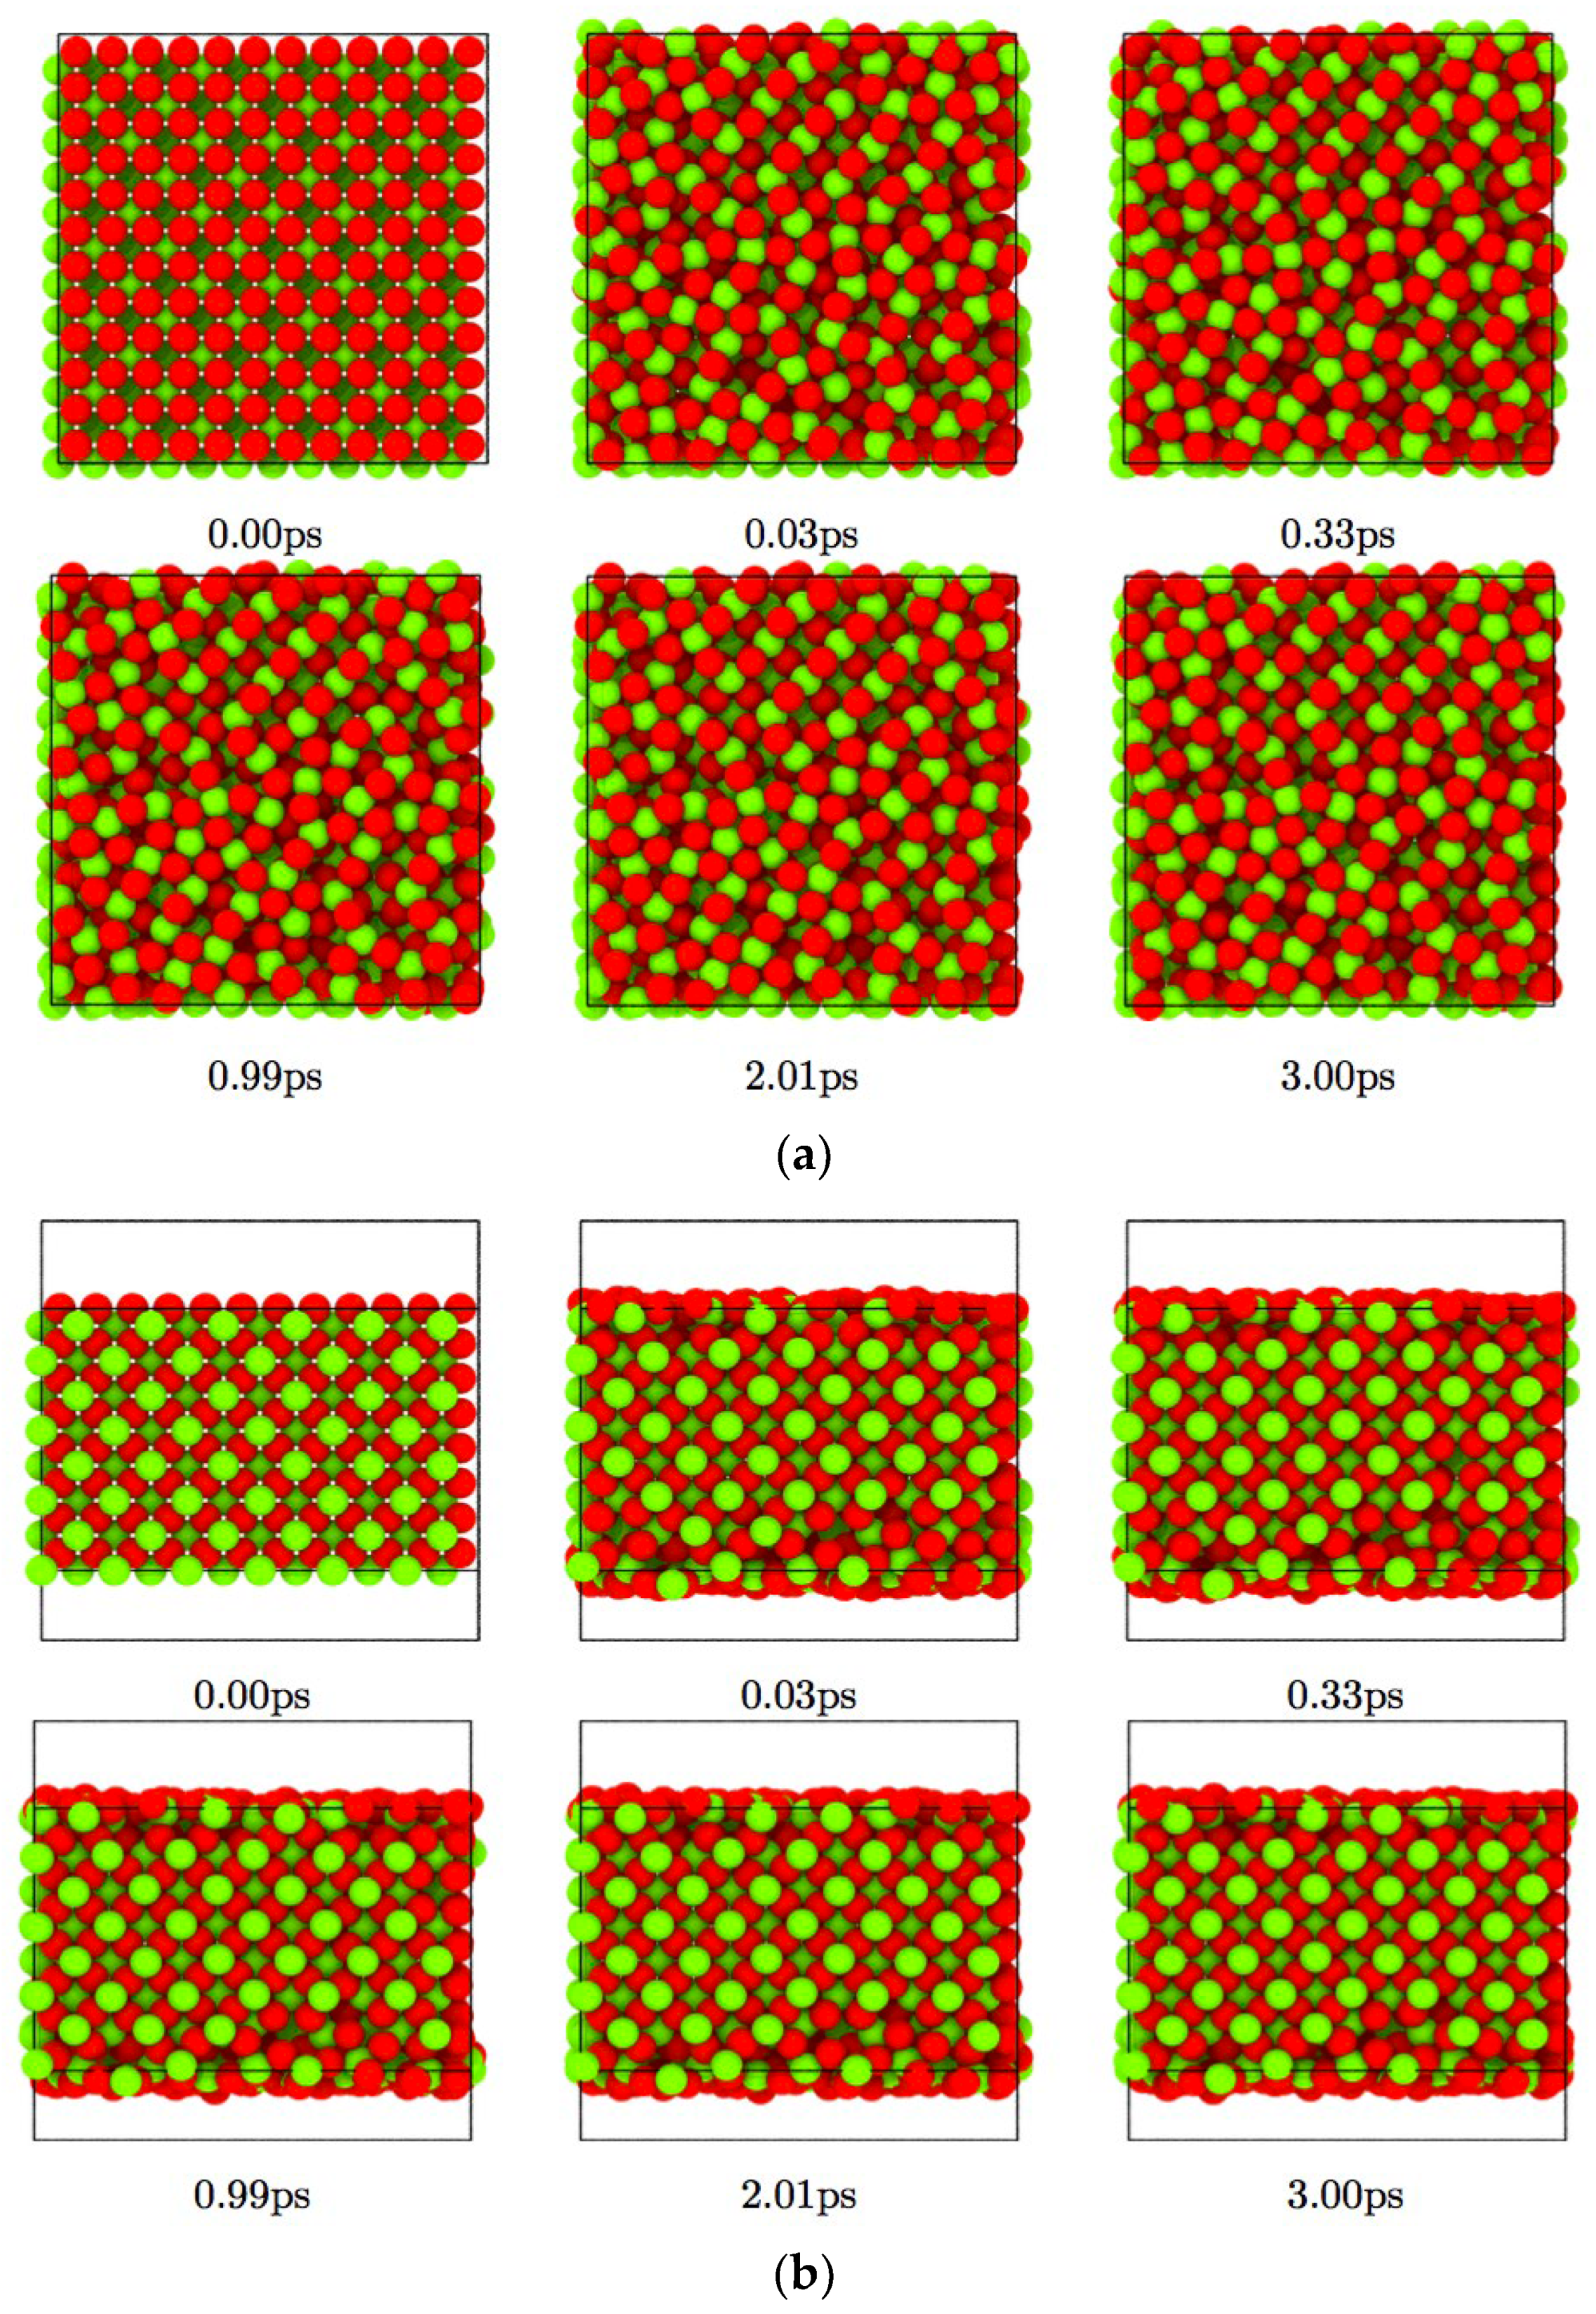
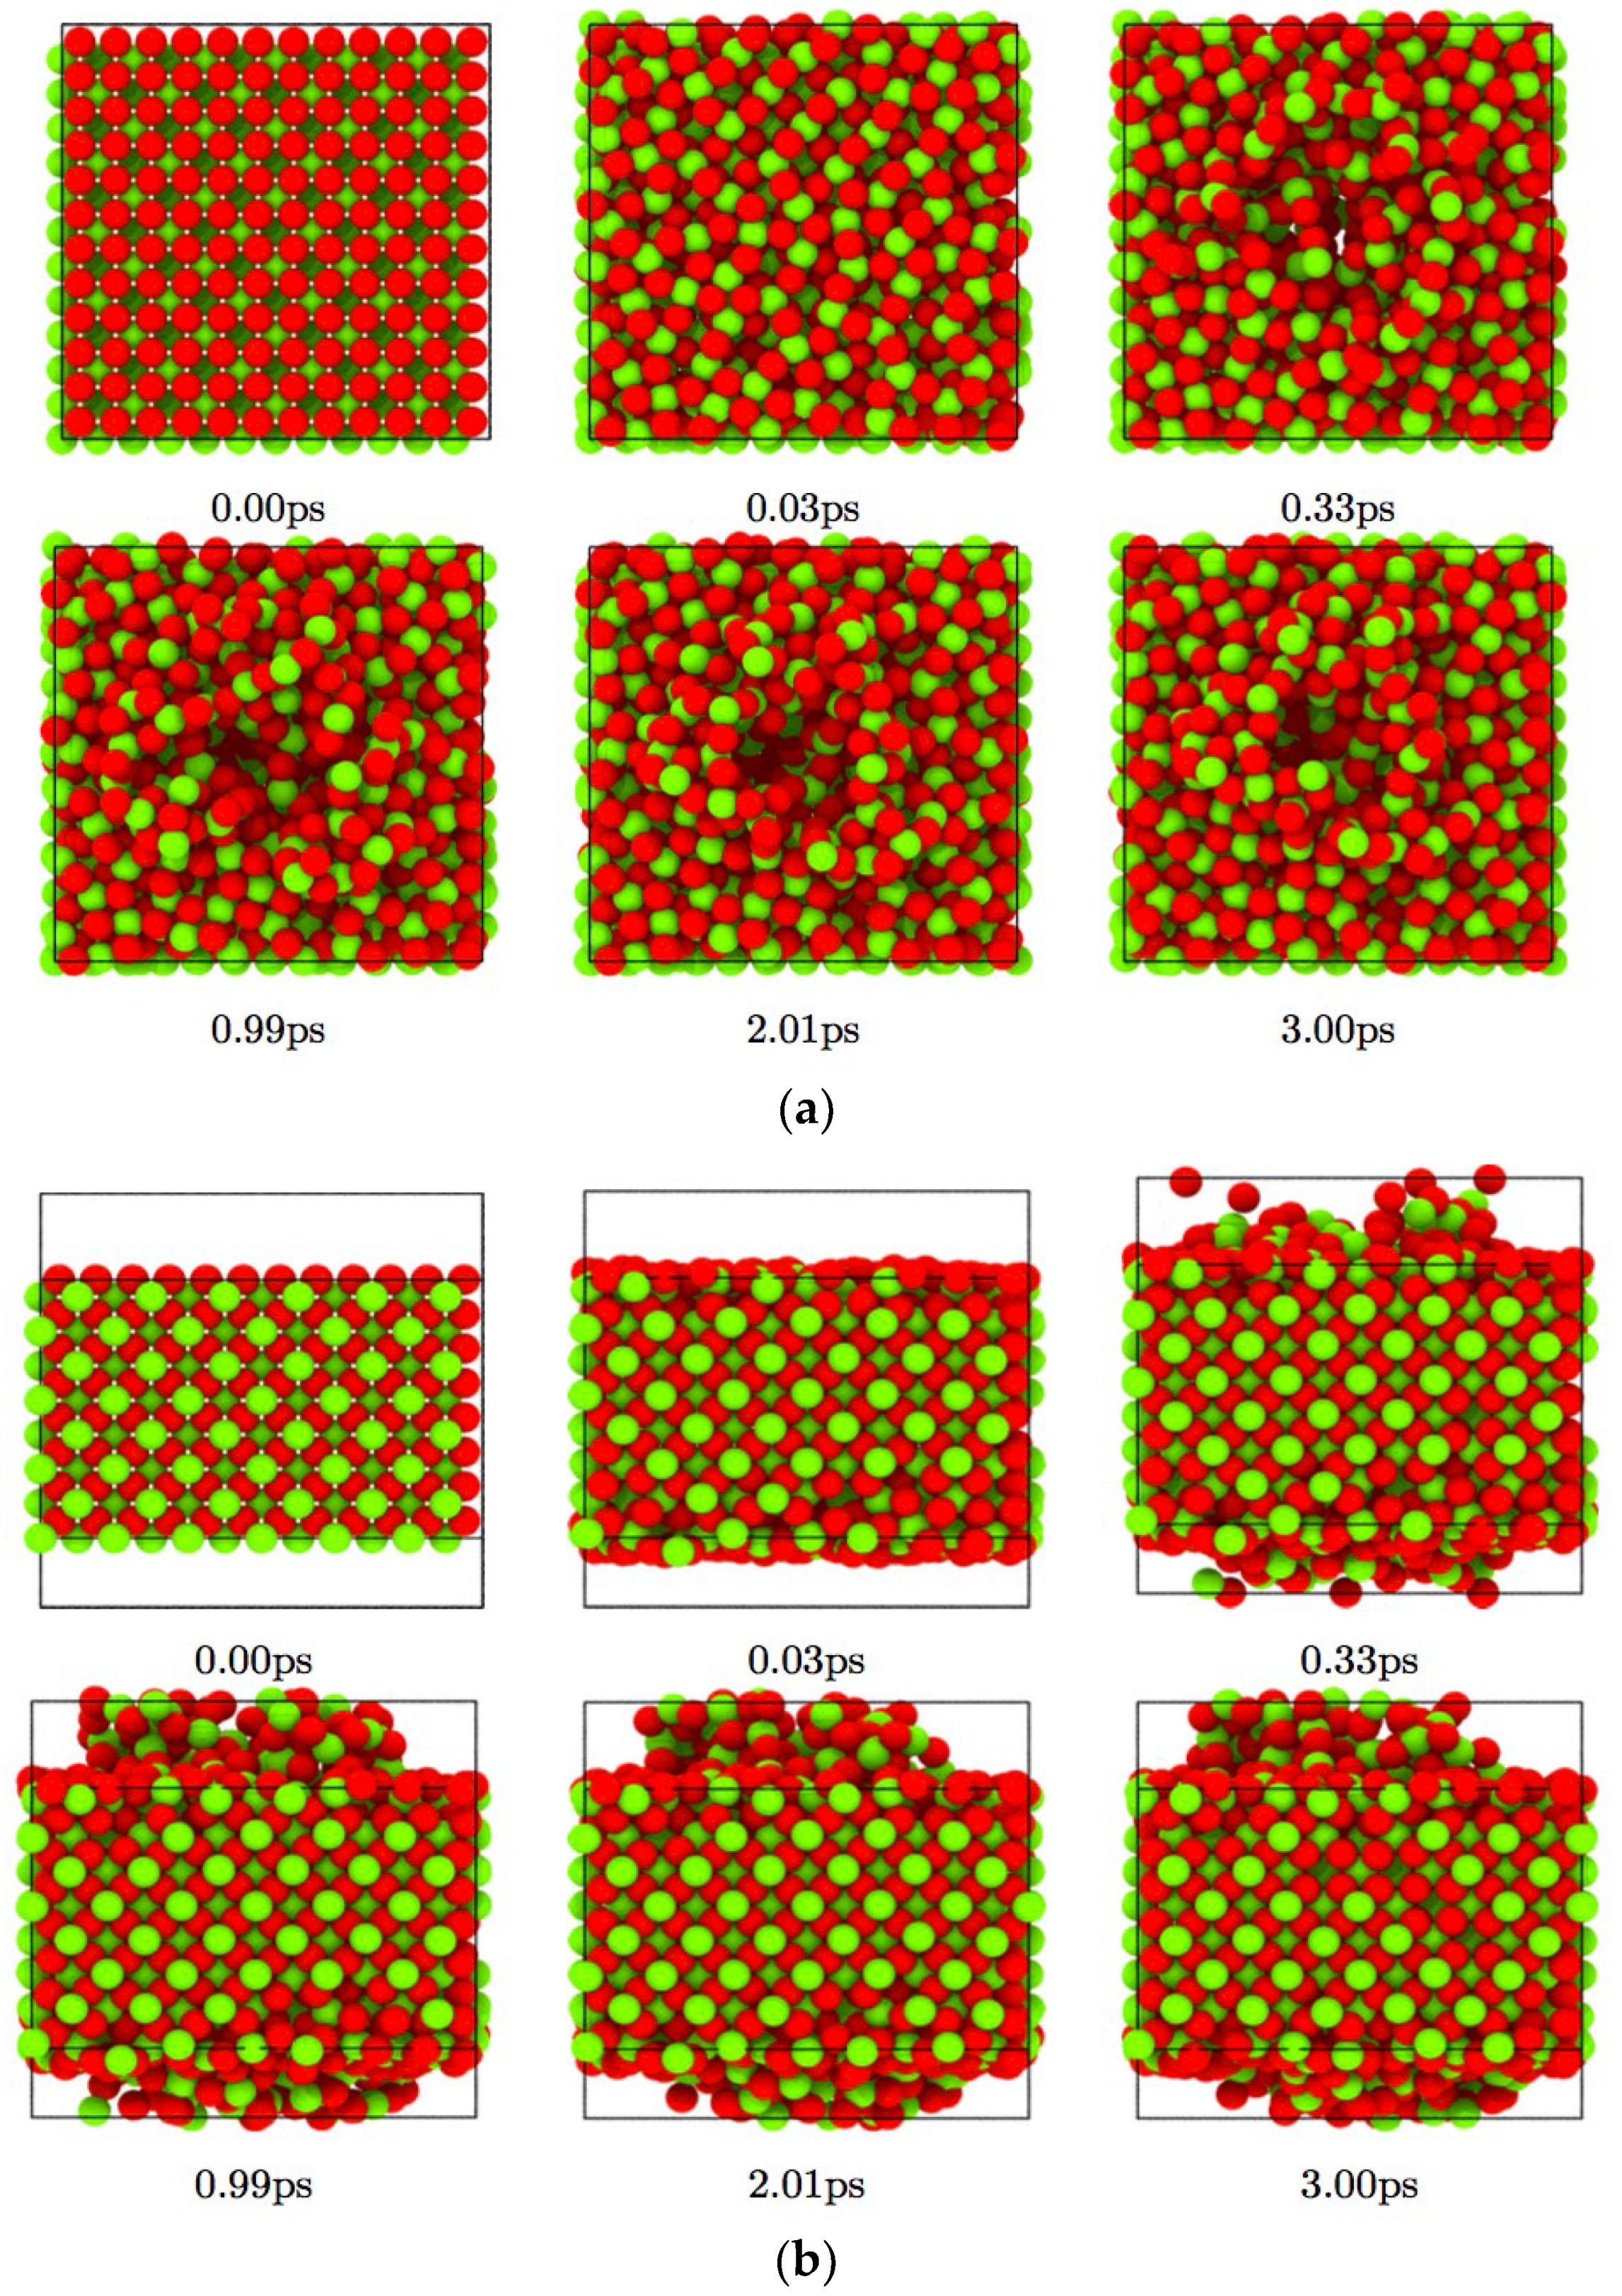
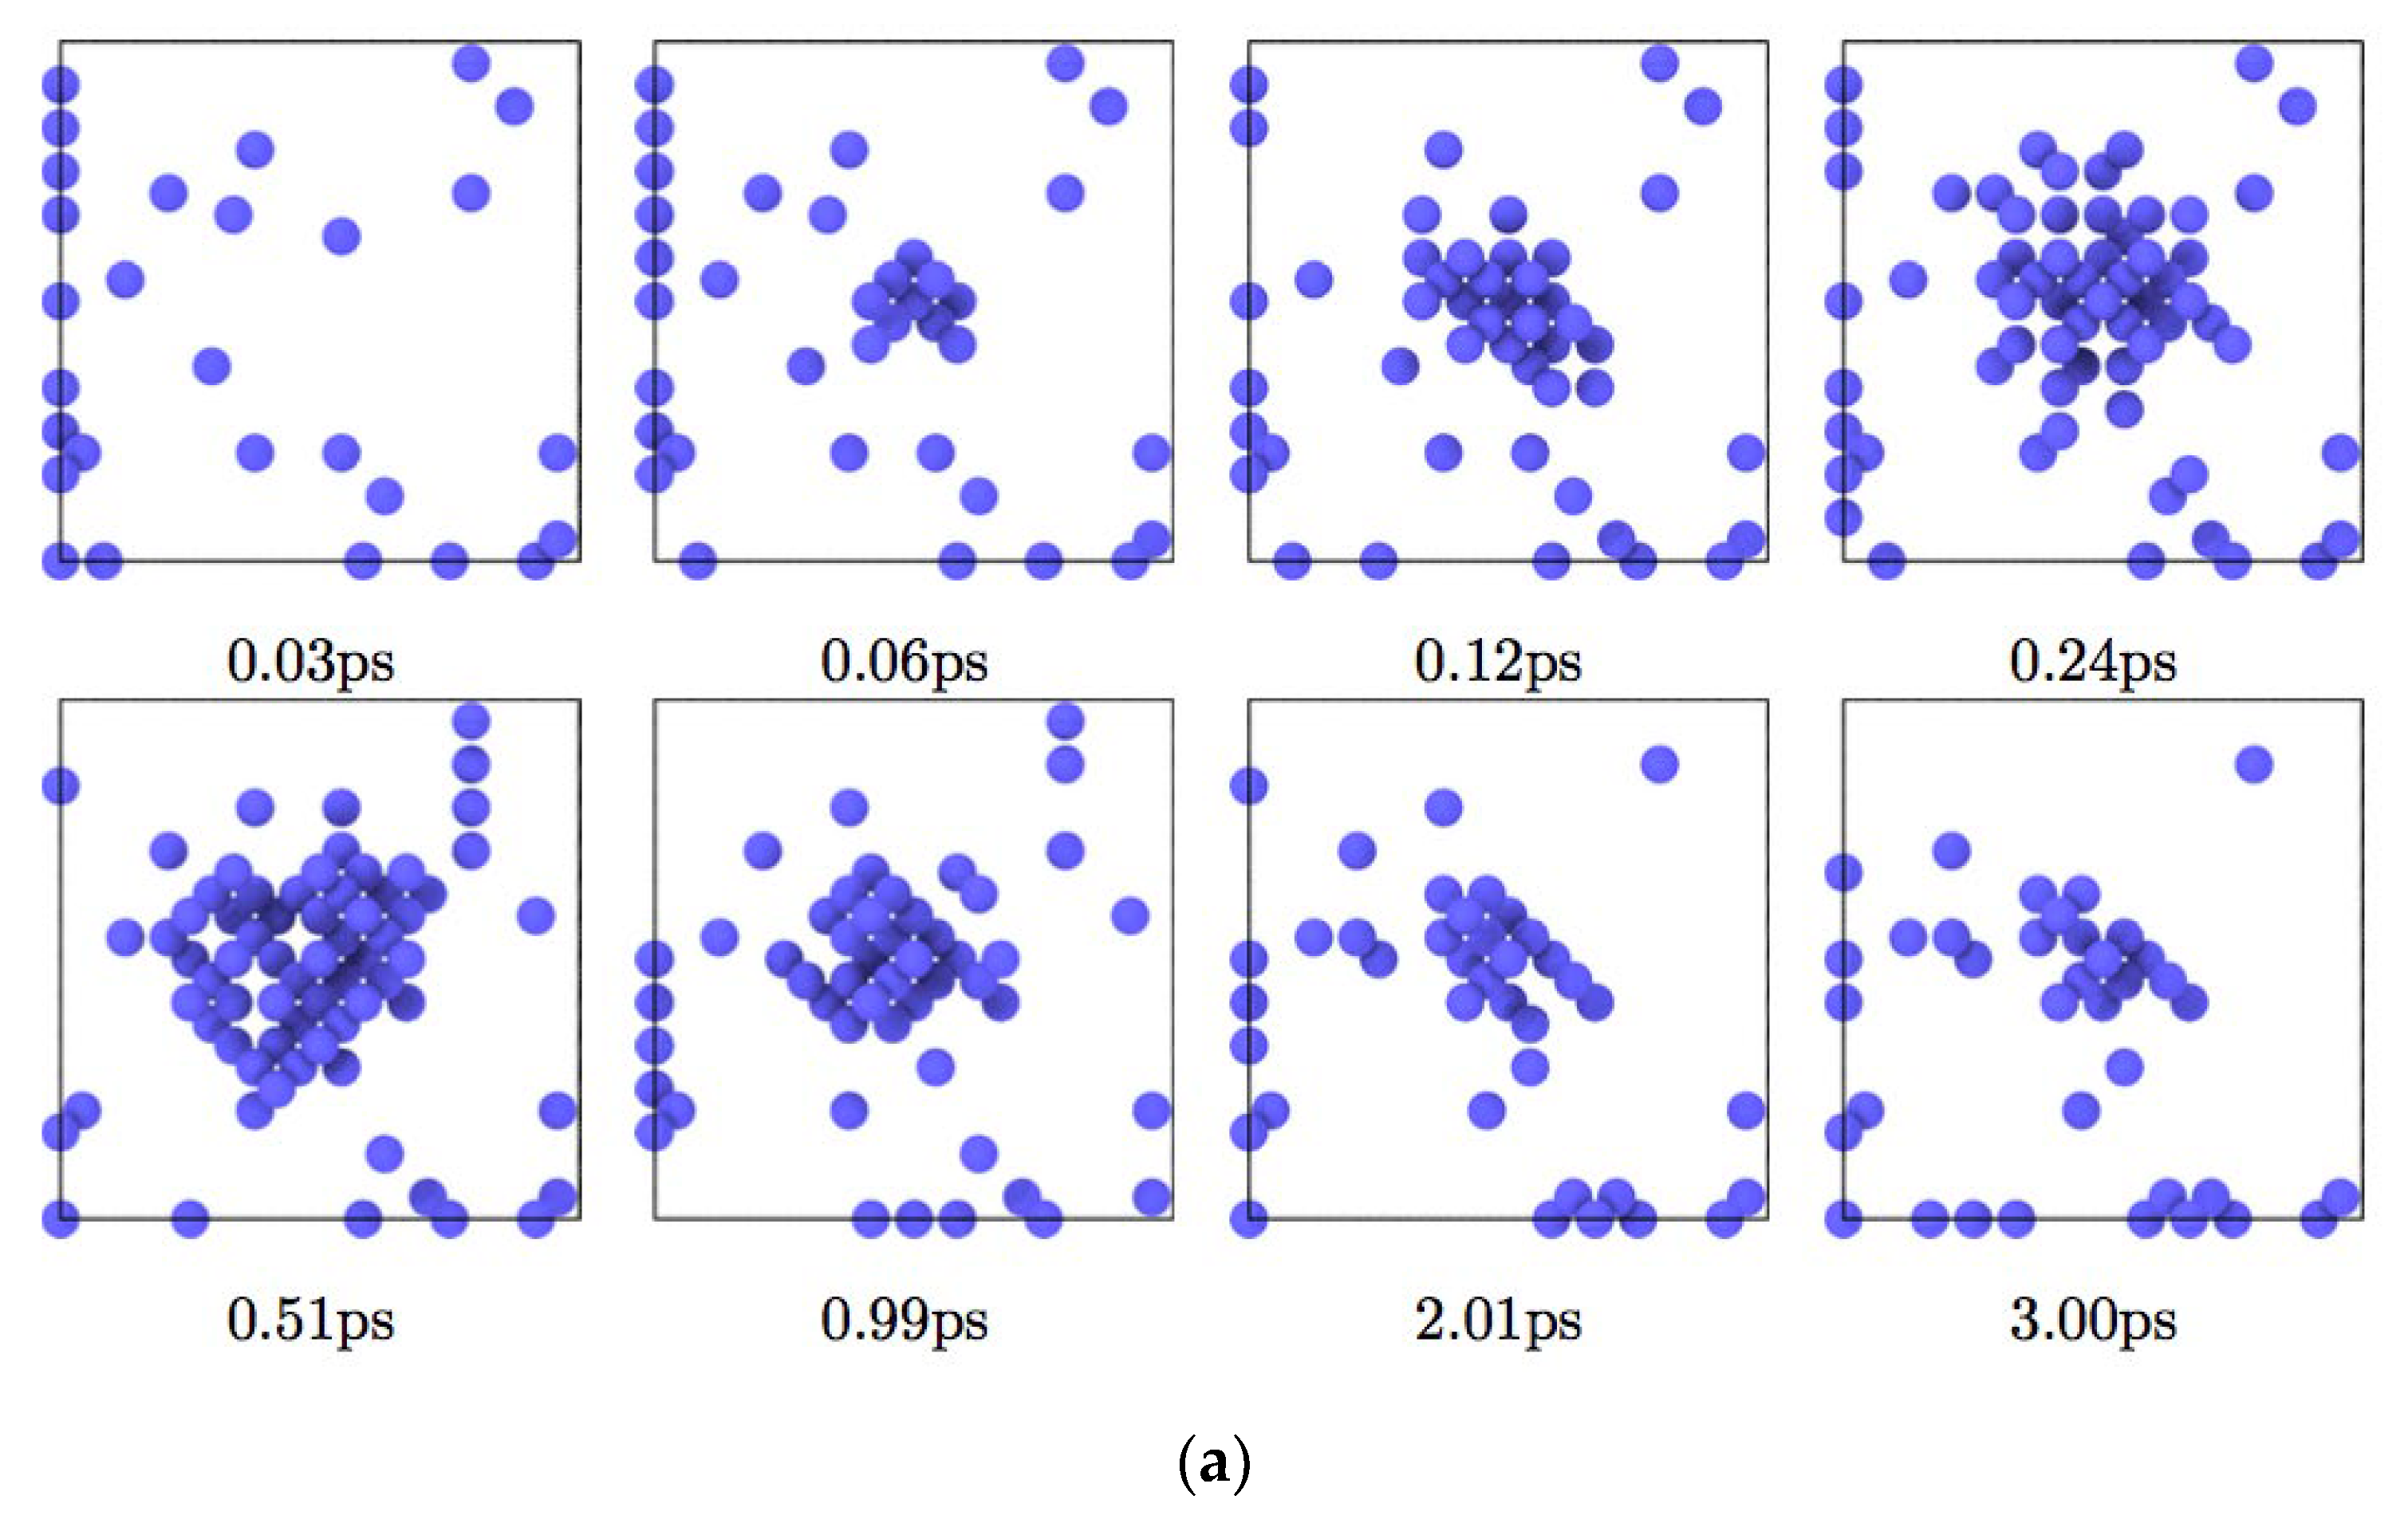
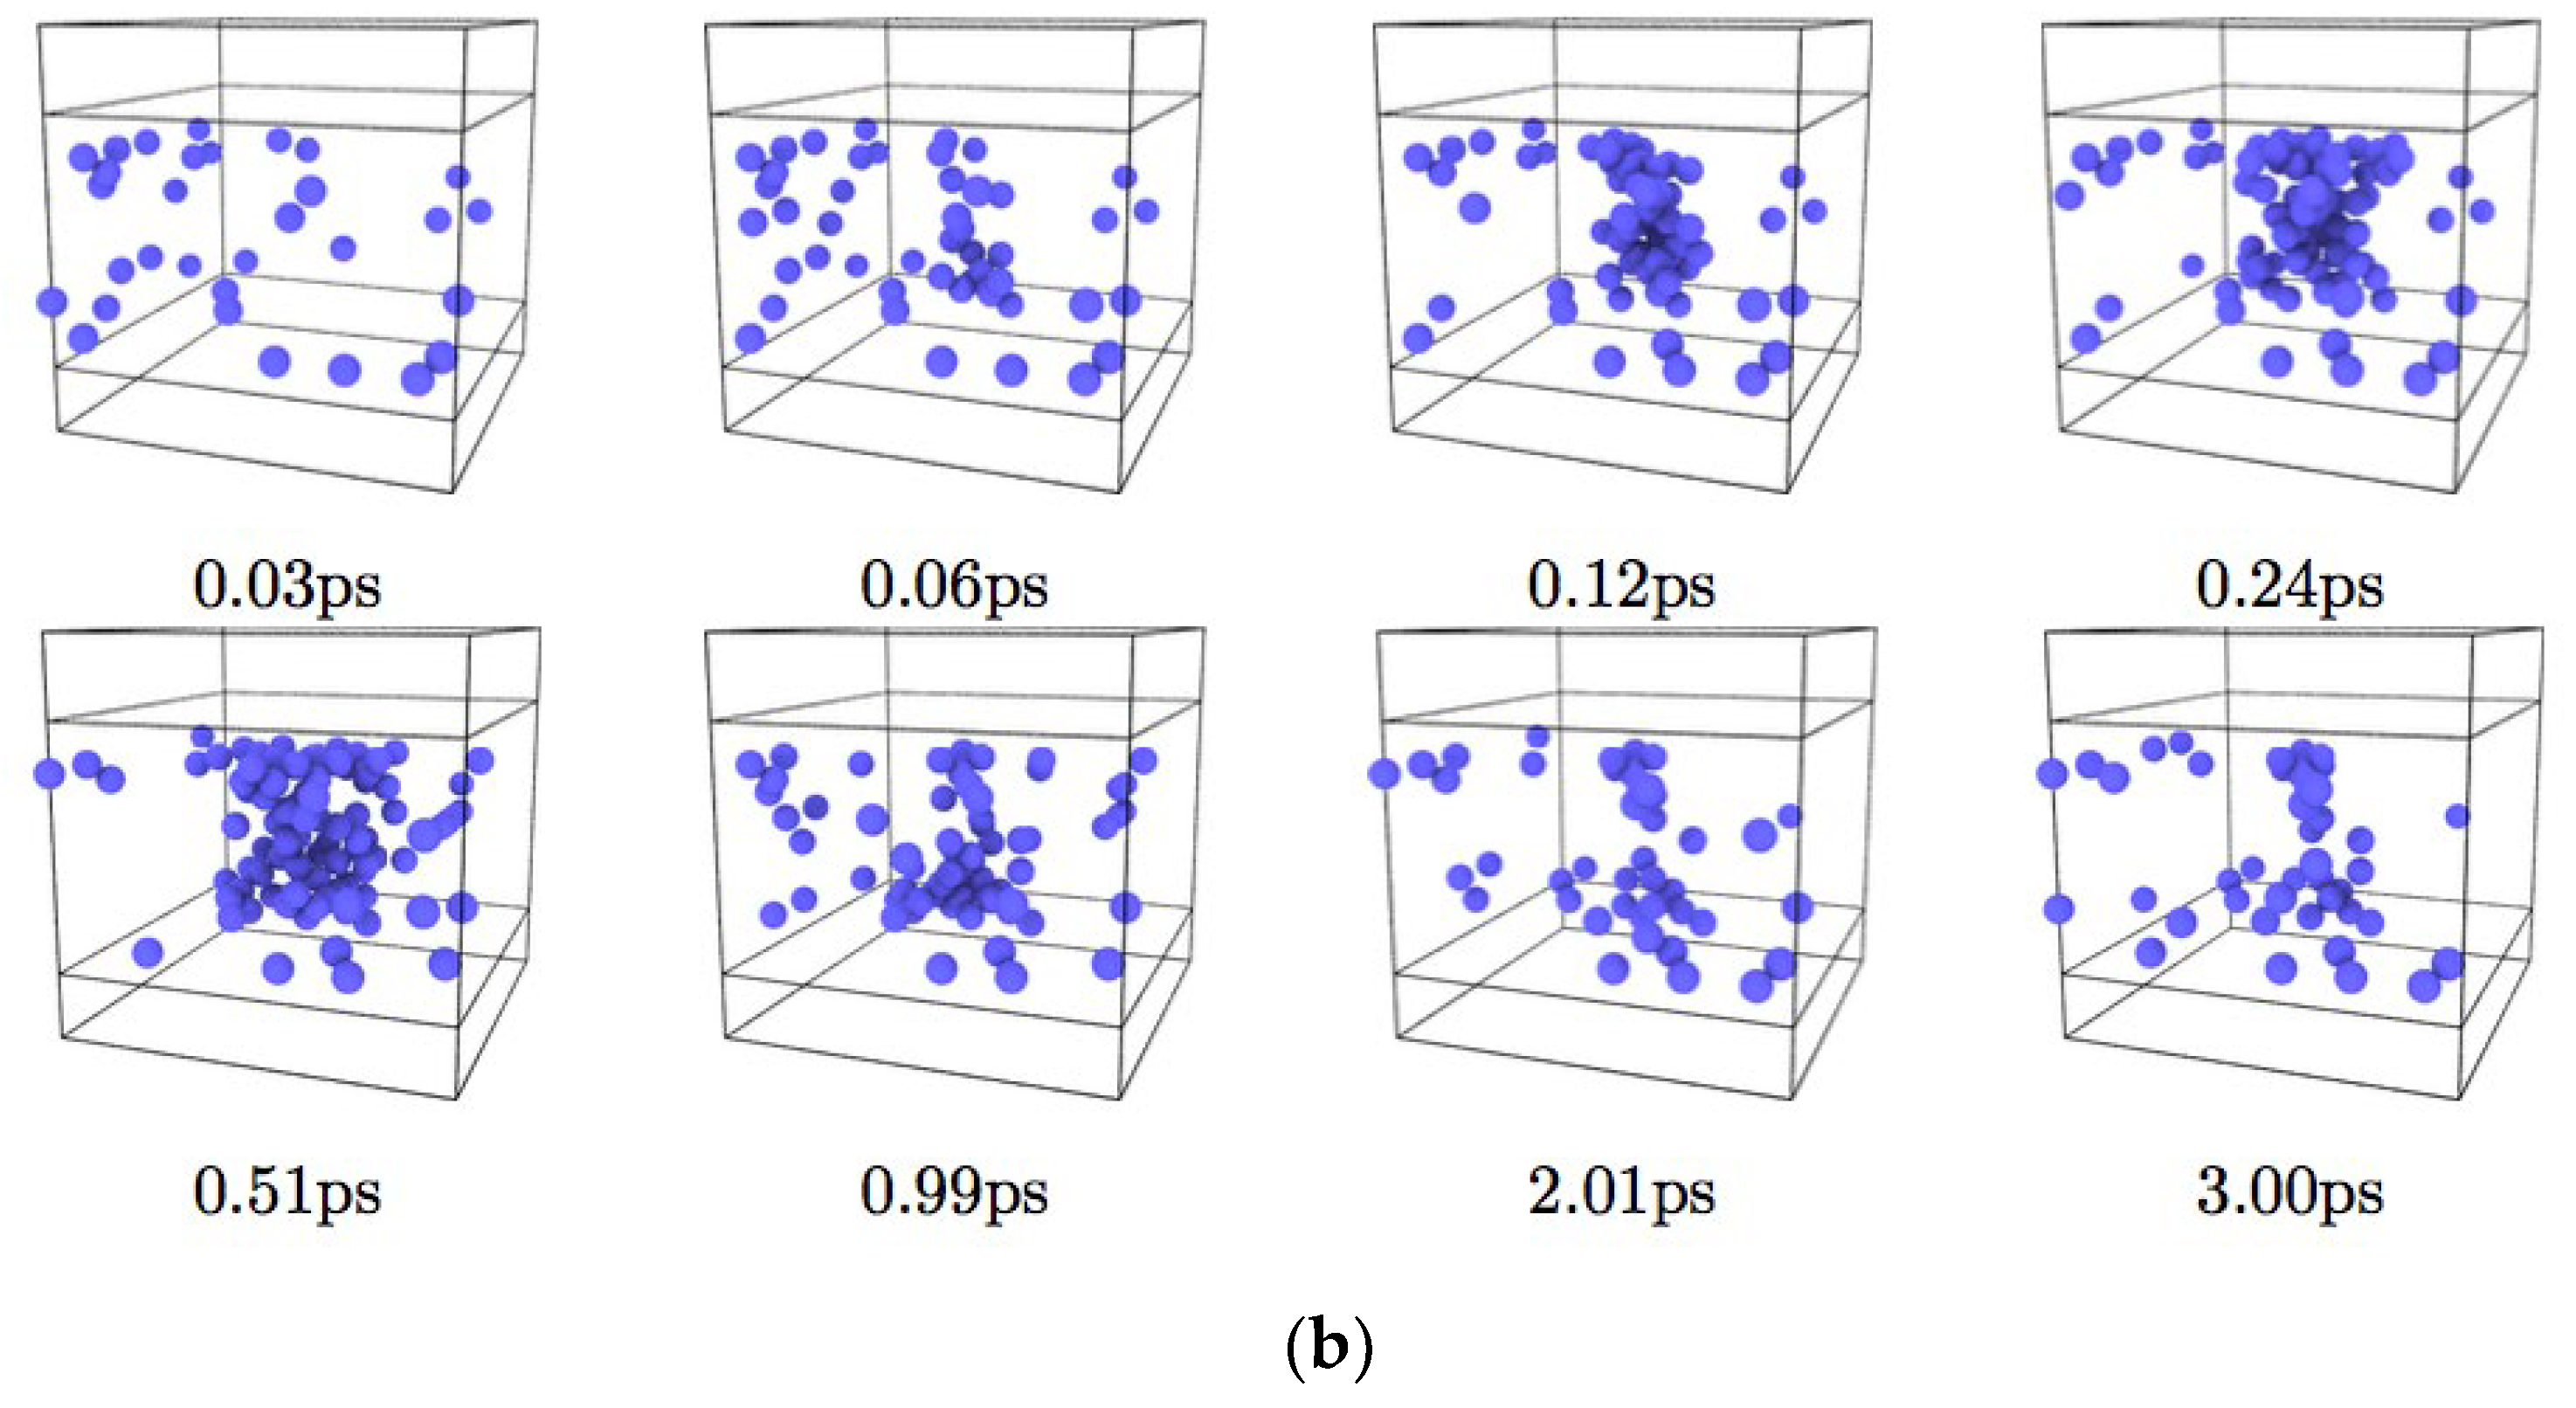
Structural changes of the CeO2 systems after the irradiation, as viewed from <001> and <100> directions, are shown in Figure 3 and Figure 4 for the values of gSe = 0.0 and 0.8 keV/nm, respectively. The number of ejected atoms increased with increasing gSe value.
Figure 3 indicates that the surface of the specimen showed disorder even when gSe = 0.0 keV/nm. This means that the disorder on the surface is not generated by irradiation. Therefore, we neglect the surface atoms for the structural analysis in order to clarify the formation process of the nanopore. In this case, no defects were found in the interior of the specimen; however, there is the possibility that defects are created at gSe = 0.0 keV/nm. The thermal energy provides the system necessary for the creation of defects. However, the ambient temperature is room temperature that is around 1/40 eV, which is low compared with the defect formation energy. Therefore, the defect creation event is rare, and no defects were found in the calculated system. We see the creation of defects among many specimens prepared, but this is out of our scope in the present study. As can be seen from Figure 4, a nanopore was formed in the specimen by ejection of the atoms located in the central region. In the case of gSe = 0.4 keV/nm, a nanopore was also produced but its diameter was smaller than that of gSe = 0.8 keV/nm.
It is interesting to compare this figure with our previous result for computer simulation of irradiation of CeO2 single crystals with no free surface. The Ce sublattice was stable up to gSe = 1.5 keV/nm, and even at gSe = 2.0 keV/nm only several interstitial atoms were found as defects (see Figure 4 in reference [19]). It can be considered that the Ce sublattice damage is confined near the surface of the irradiated region compared with the O sublattice damage. To elaborate the nanopore formation process, the time change of the total number of vacancies for the various values of gSe was calculated.
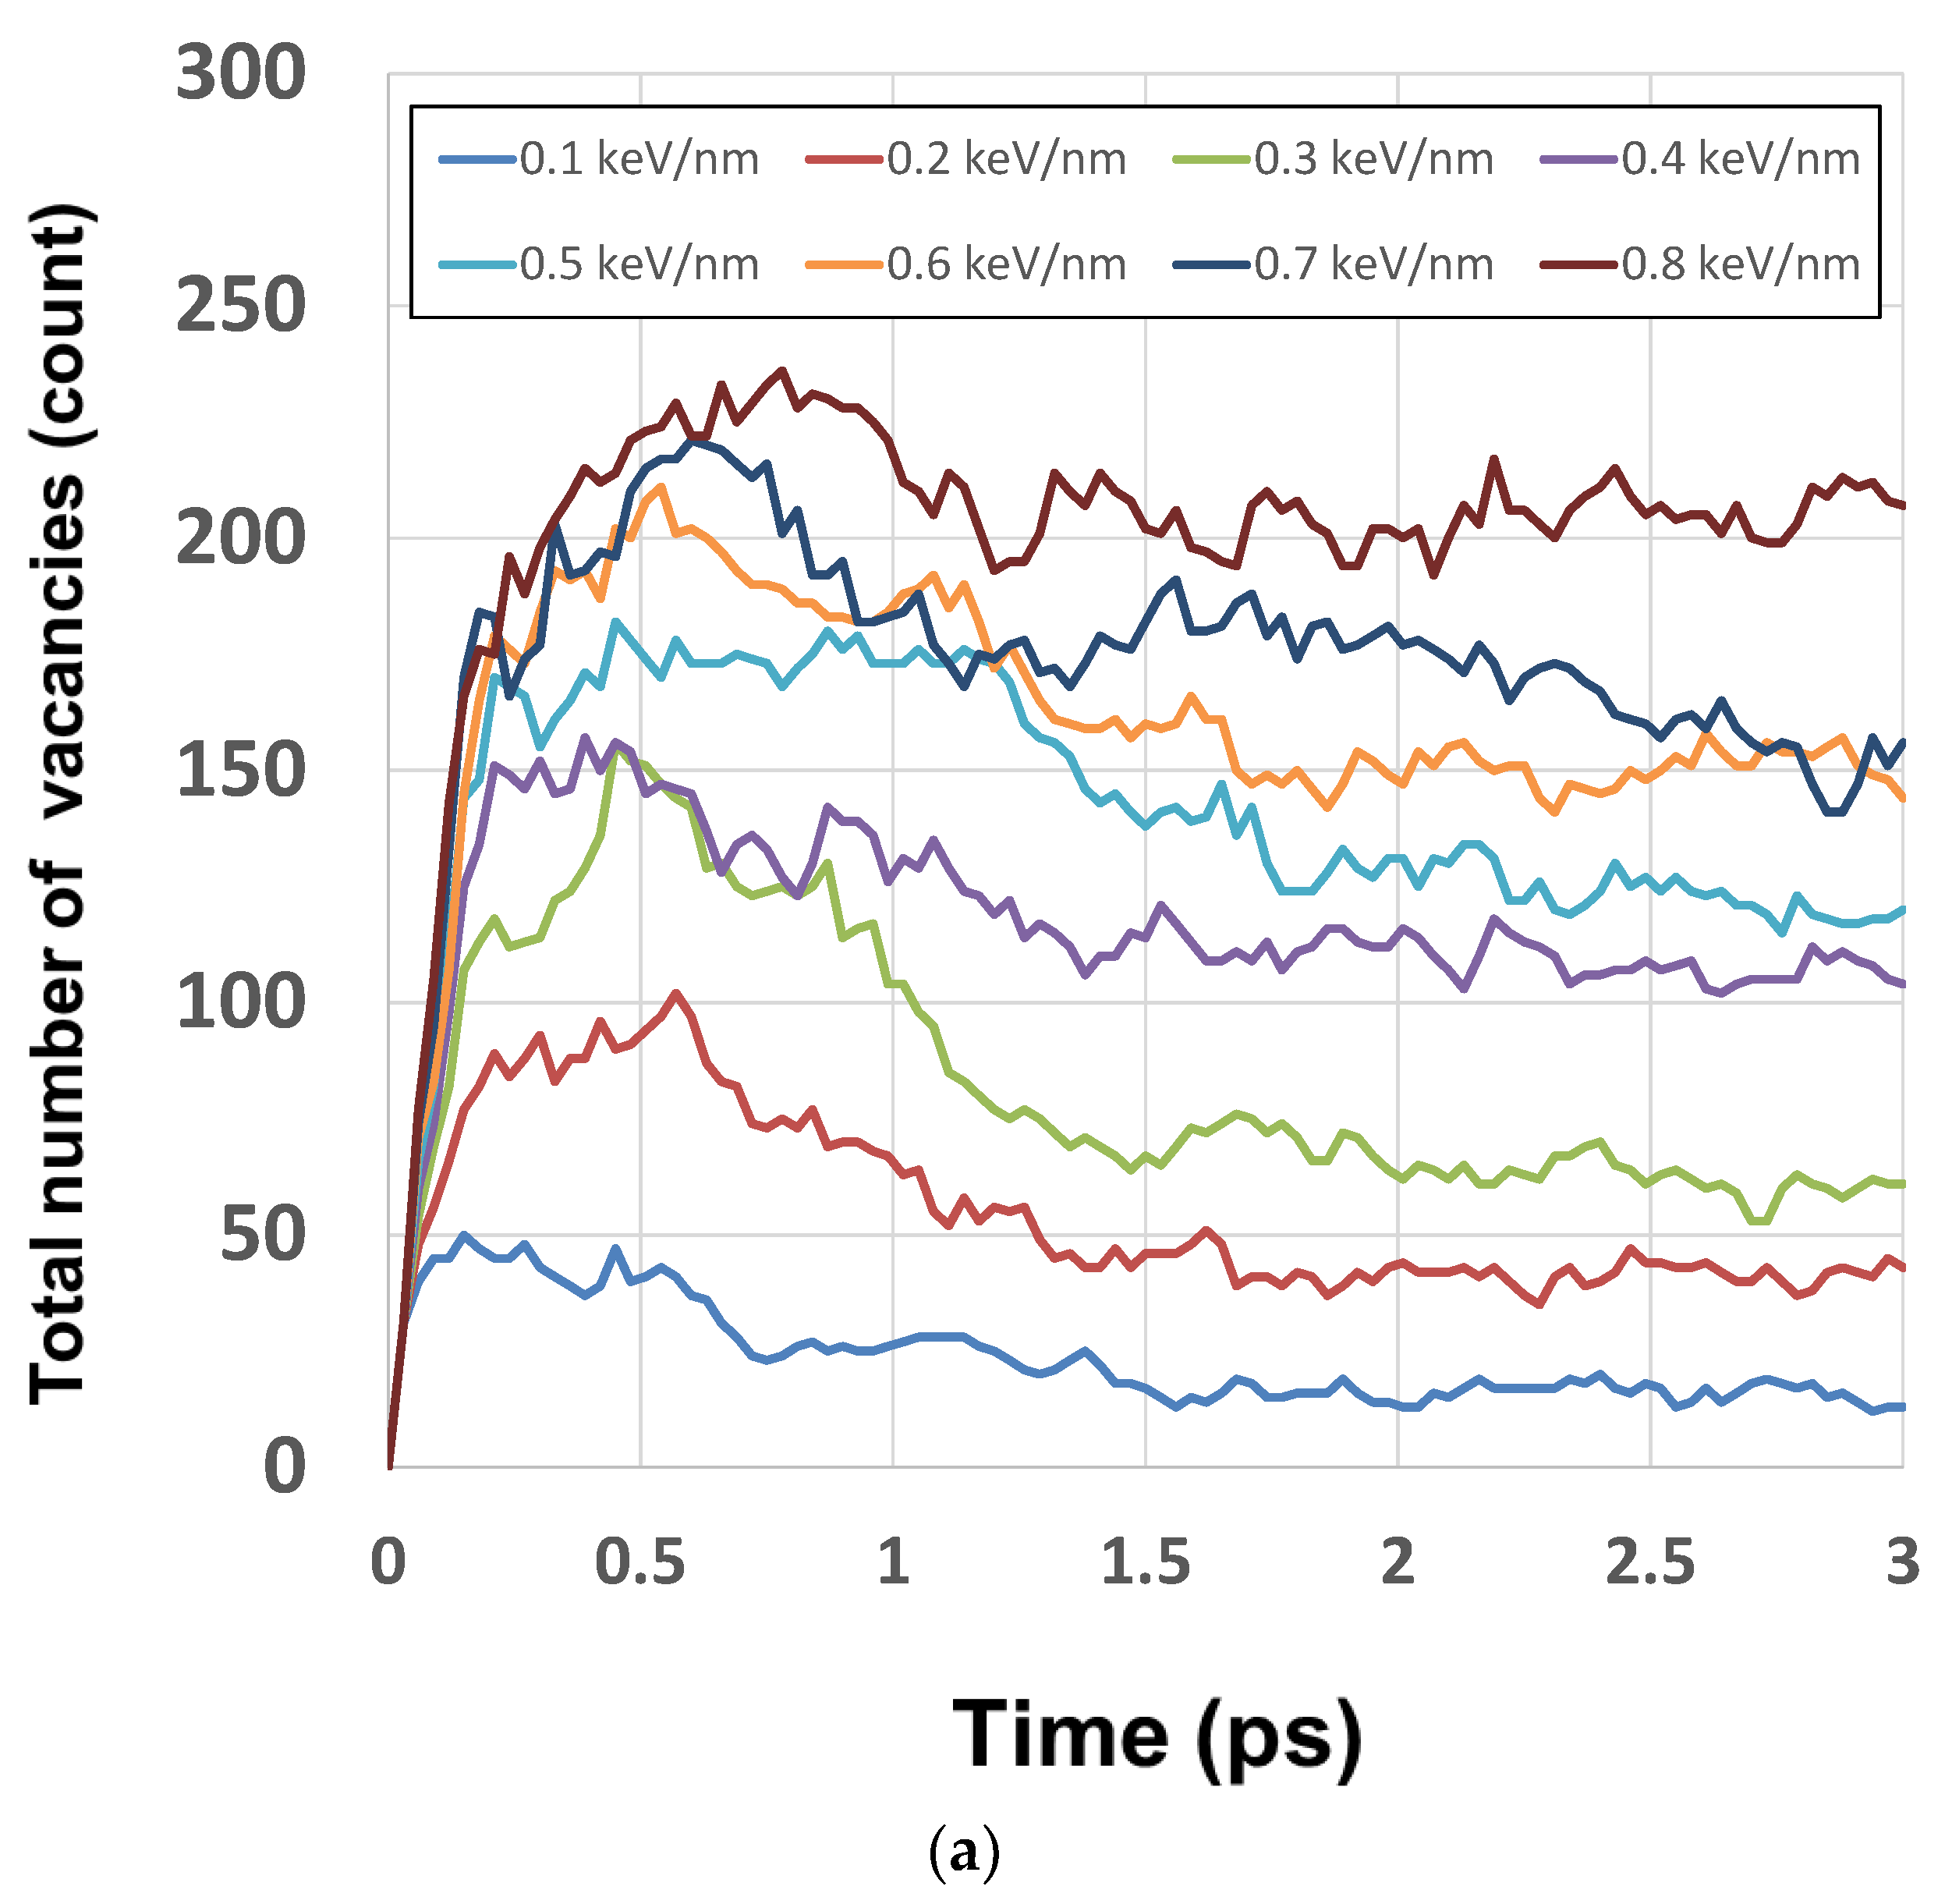
Figure 5a,b show the results for gSe = 0.1–0.8 and 0.8–1.6 keV/nm, respectively. (No defect was found in the interior of the specimen at gSe = 0.0 keV/nm because of the low temperature 298 K.) For all these gSe cases, the number of vacancies increased abruptly up to 0.2 ps after the irradiation. It increased further and reached the maximum, then gradually decreased until 1.5 ps and equilibrated to a constant value after that. The equilibrated number of vacancies increased as gSe increased for the low values of gSe less than 0.8 keV/nm and converged to a constant value around 200 when gSe was larger than 0.8 keV/nm. It is noteworthy that the number of atoms in the region where vacancies were counted is 1296. In the range of gSe = 0.1–0.8 keV/nm, the more thermal energy given, the more disordered the structure. However, in the range of 0.8–1.6 keV/nm, the additional thermal energy cannot change the structure drastically because the structure is already disordered. If the same amount of energy is given to an ordered and a disordered structure, the increment of entropy of the ordered structure is much larger than that of the disordered structure.
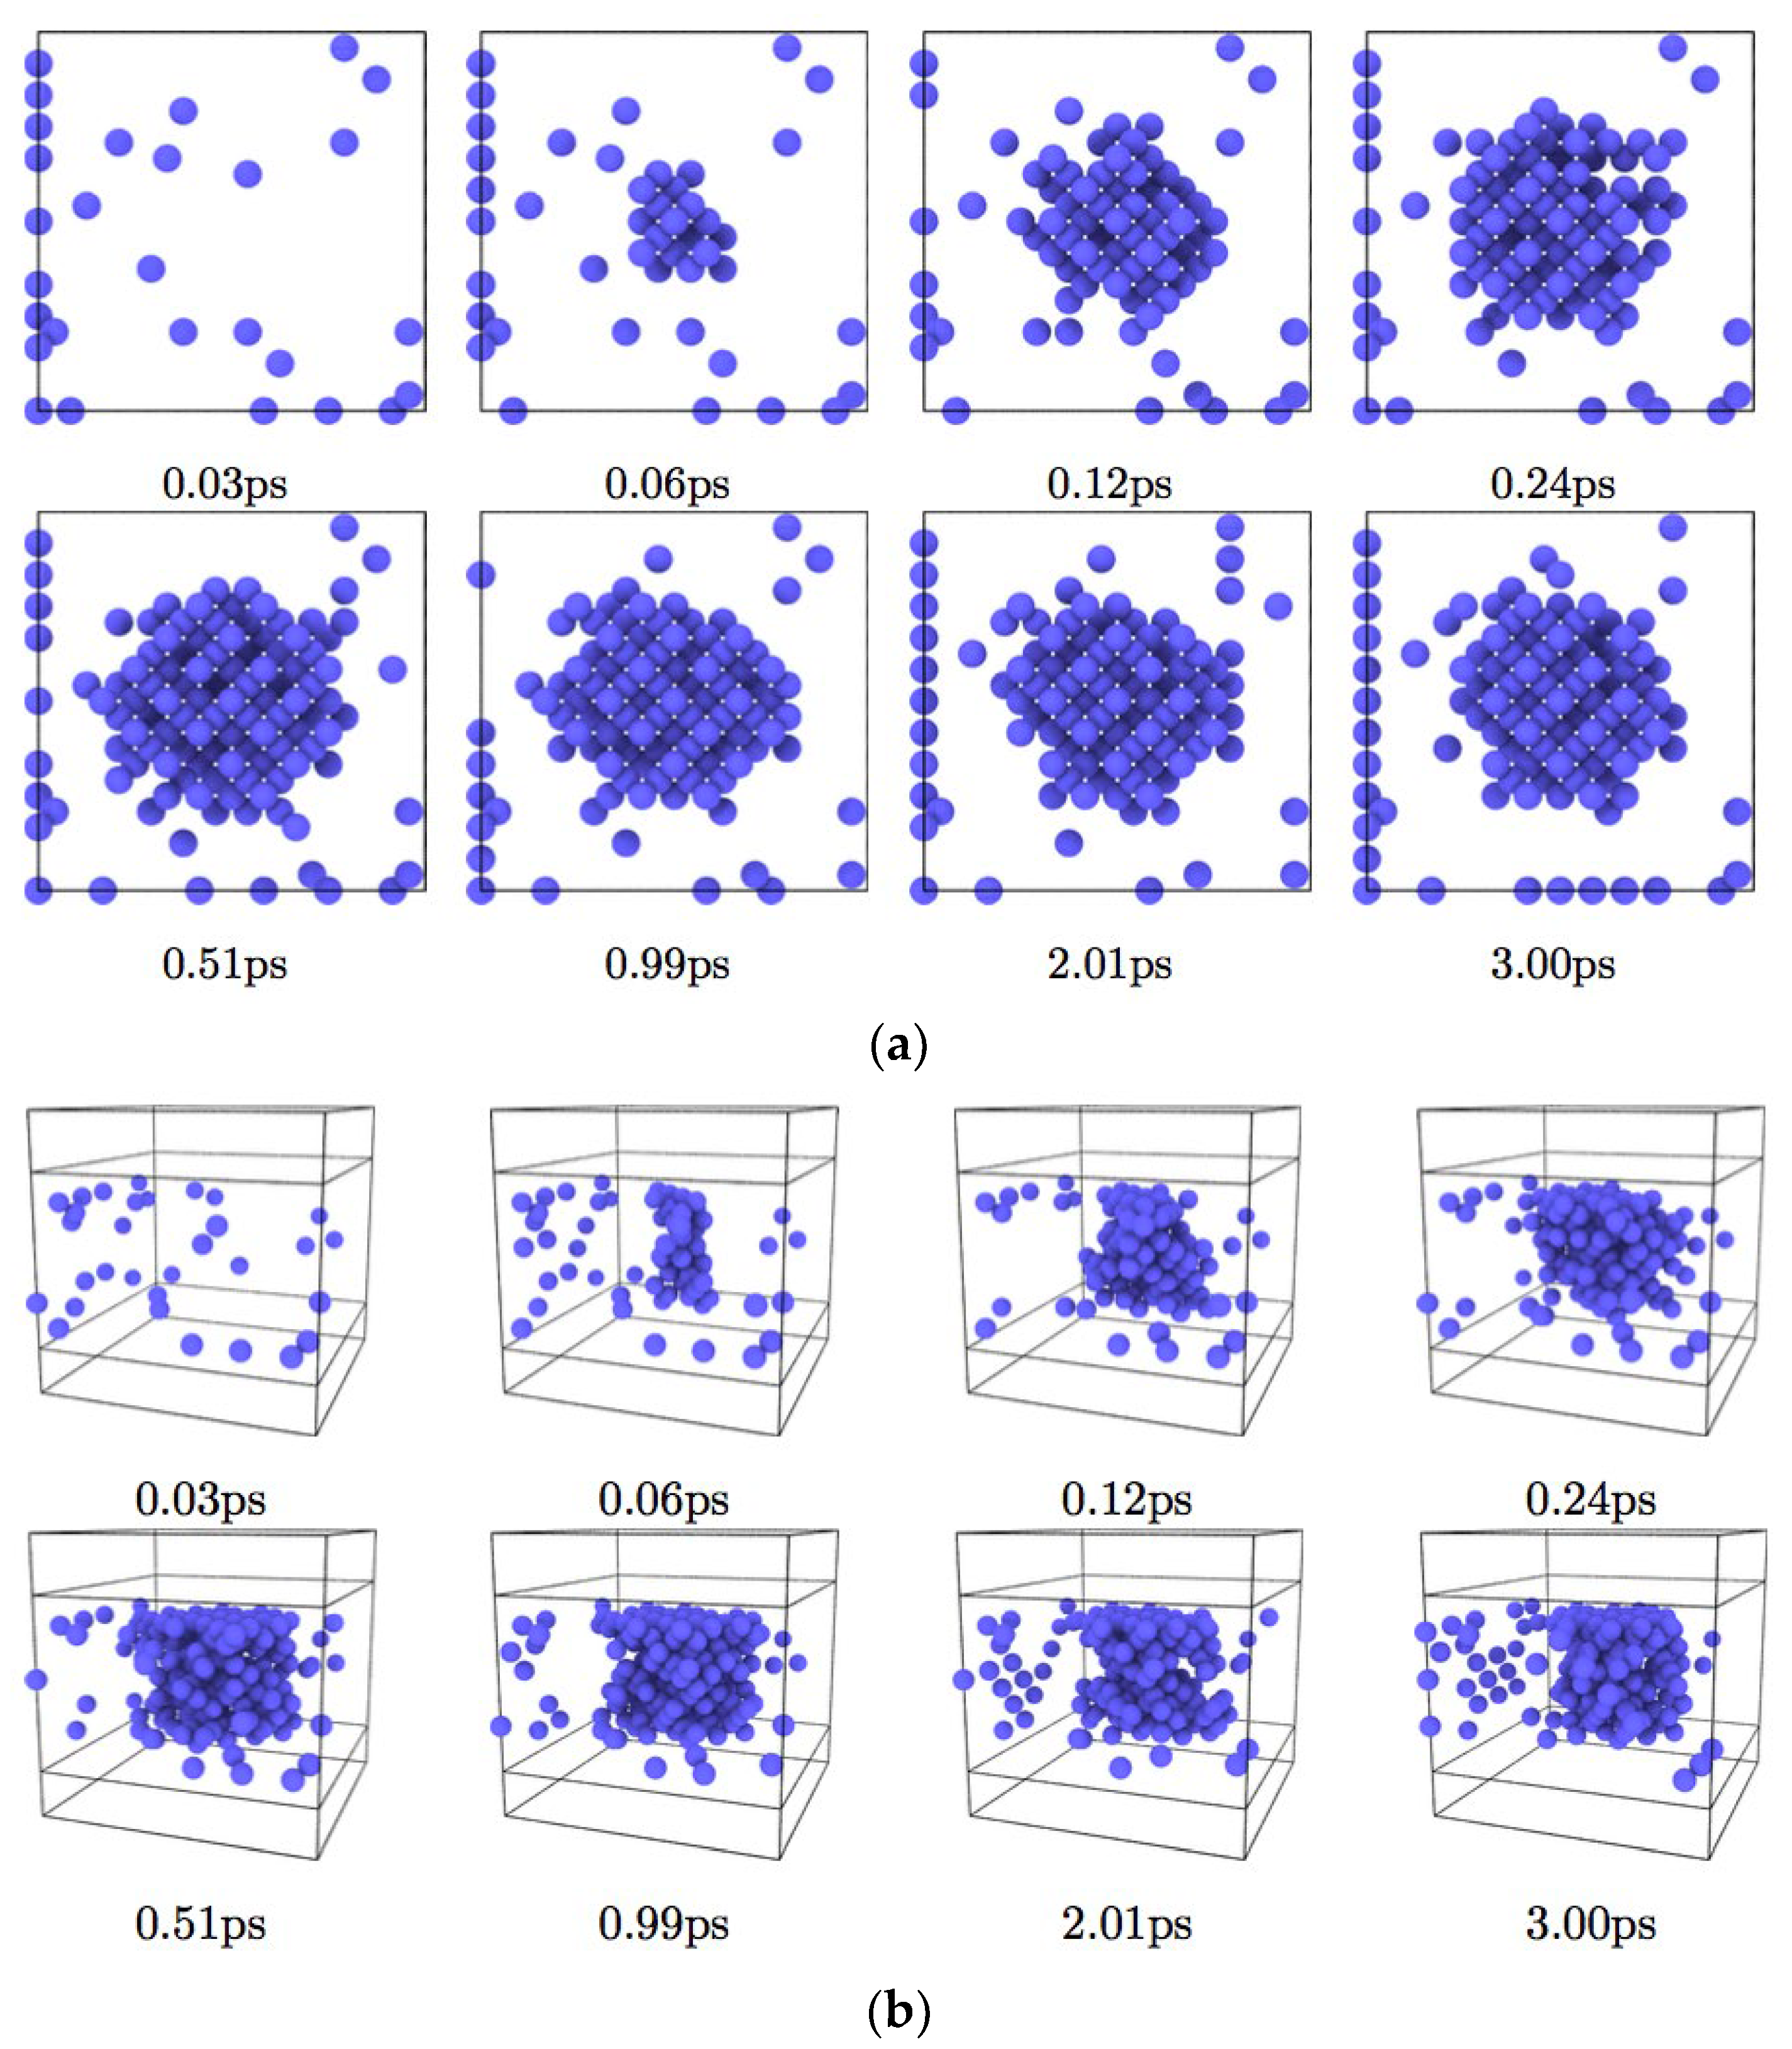
The distributions of vacancies in the CeO2 systems viewed from <001> and <100> directions are shown in Figure 6 and Figure 7 for the values of gSe = 0.2 and 0.8 keV/nm, respectively. The nanopore was formed abruptly at around 0.3 ps after the irradiation and grew to its maximum size at 0.5 ps, then it shrank during the time to 1.0 ps and finally became equilibrated. The size of the nanopore increased as gSe increased, but it saturated when gSe was 0.8 keV/nm or more. This finding will provide useful information for precise control of the size of the nanopore.
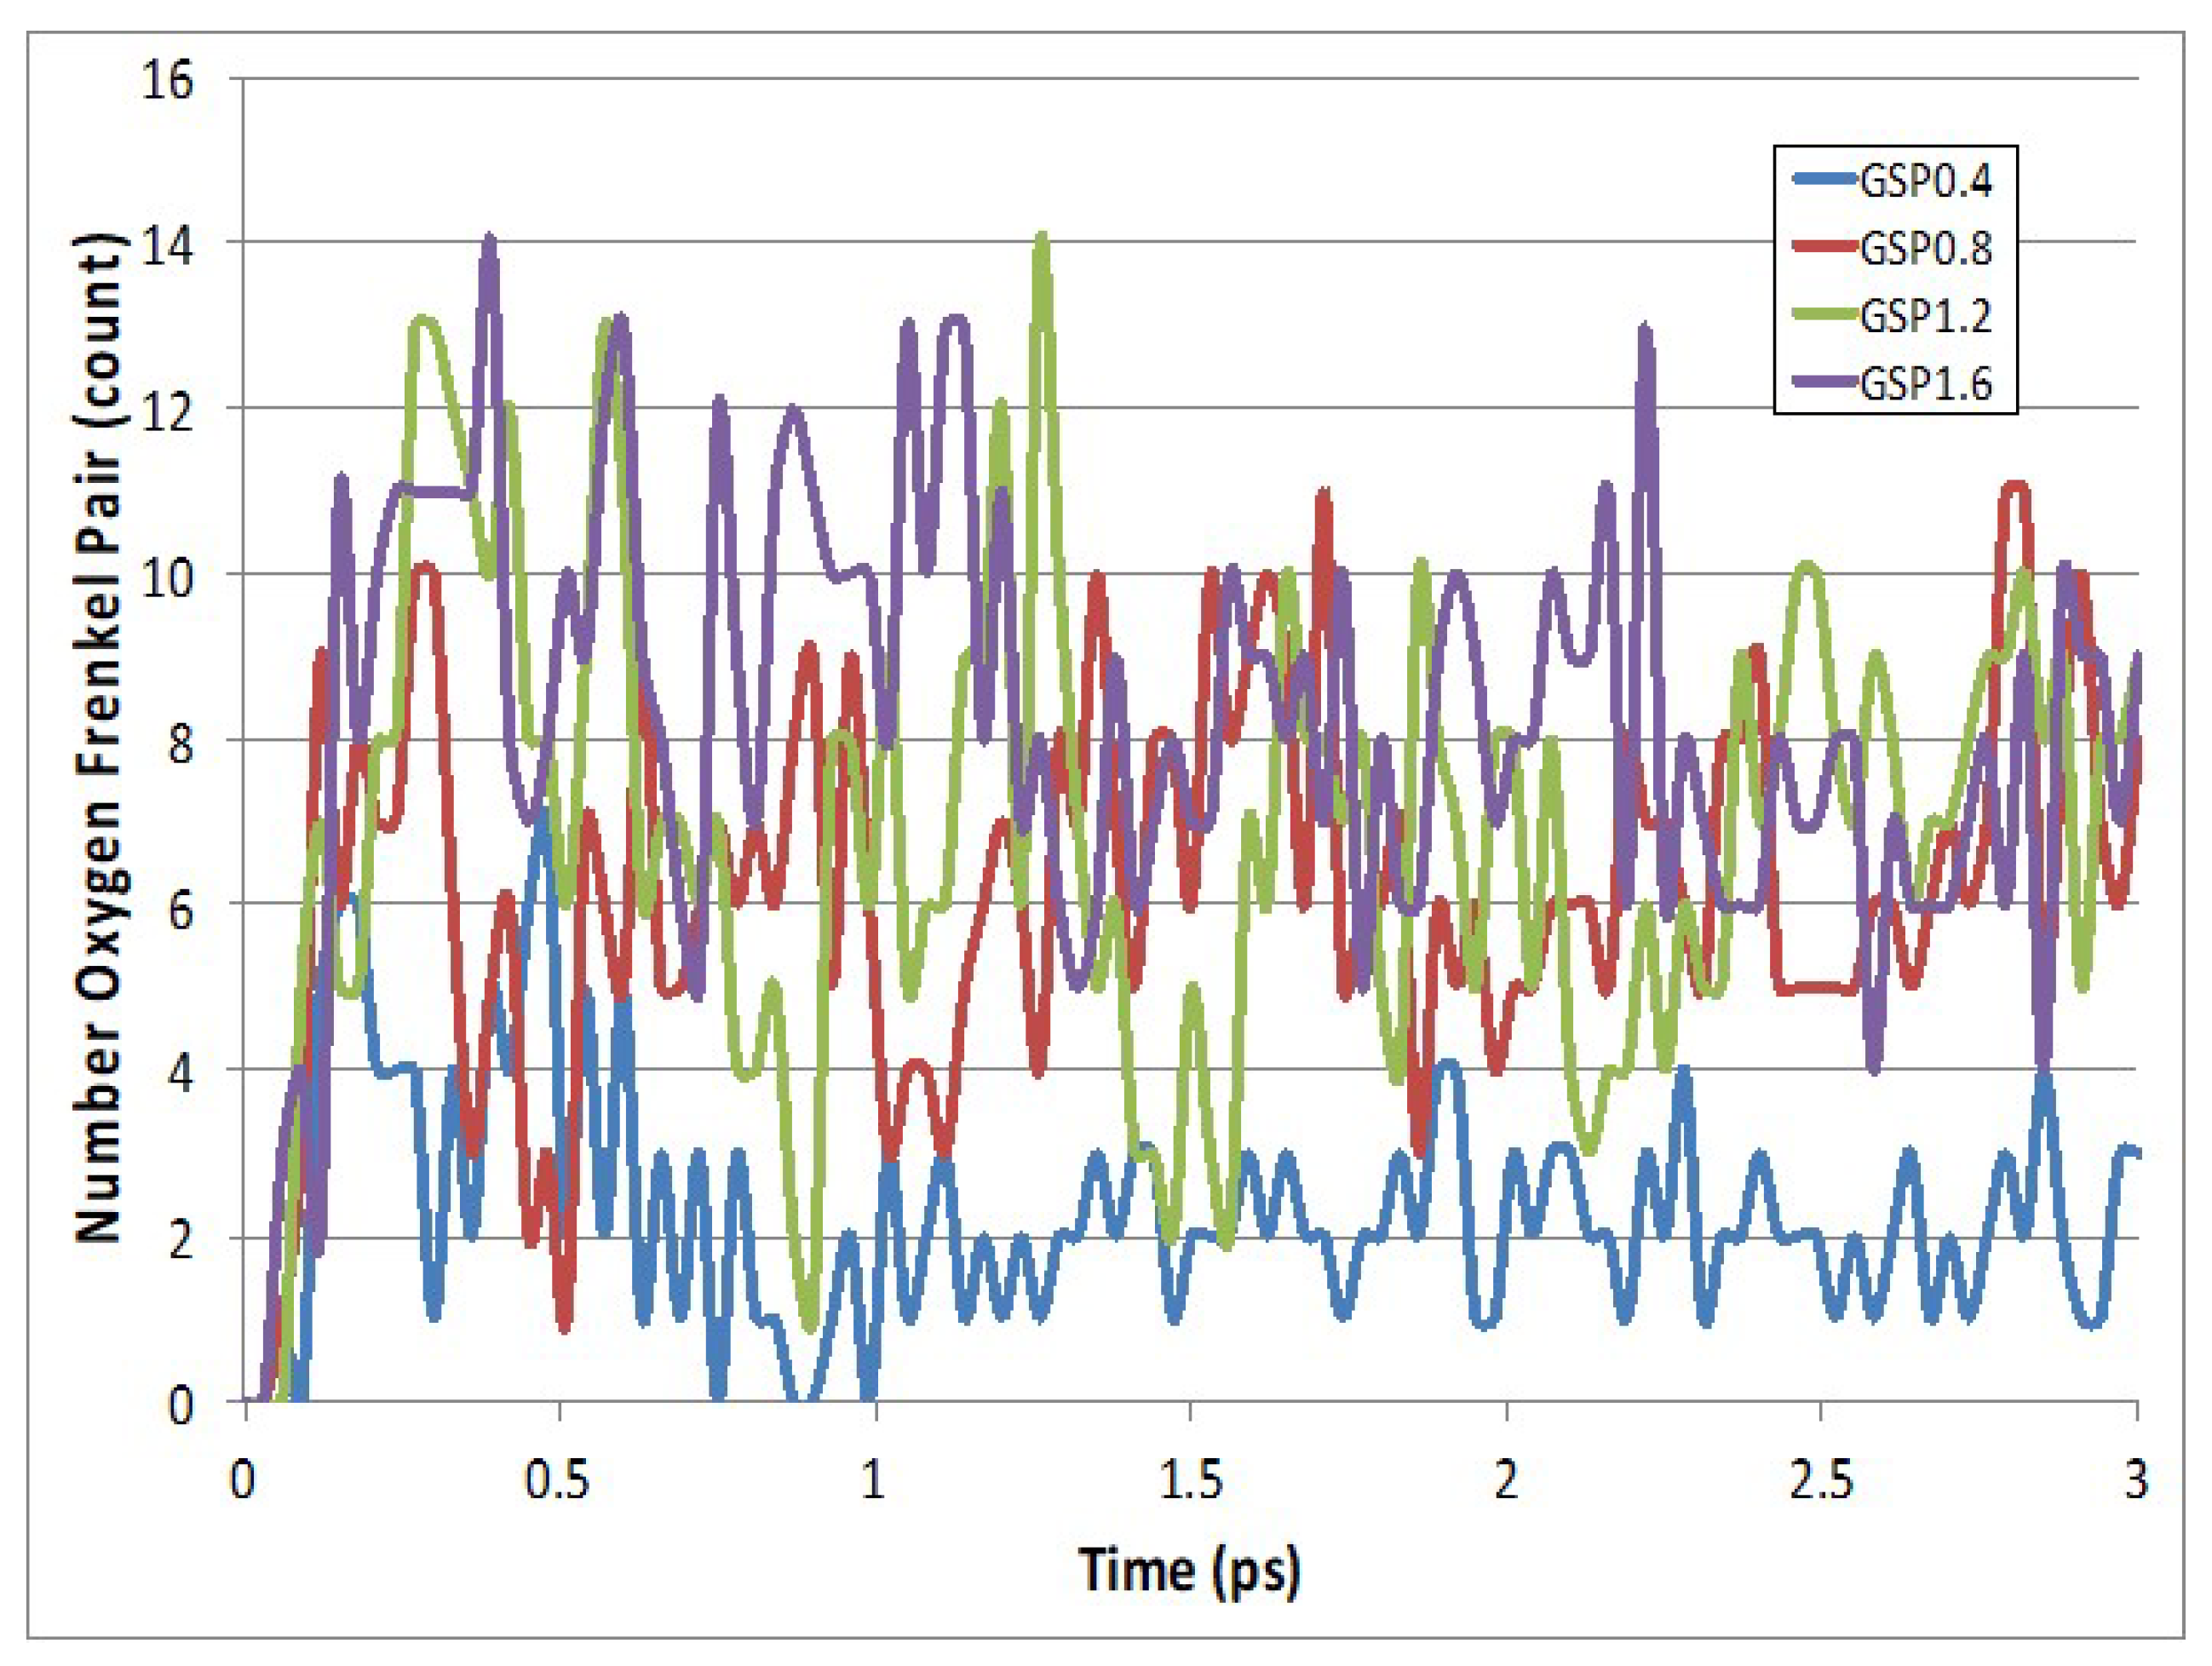
Figure 8 shows the time change of oxygen Frenkel pairs for gSe = 0.4, 0.8, 1.2, and 1.6 keV/nm. The number of oxygen Frenkel pairs could be separated into two categories, higher gSe (0.8, 1.2 and1.6 keV/nm) and lower gSe (0.4 keV/nm). The number of oxygen Frenkel pairs in the higher gSe category was larger than that of the lower gSe category; however, there was no clear correlation between the Frenkel pairs and gSe in the higher category. This behavior was similar to that for the number of vacancies and the radius of the nanopore. It should be noted that the number of oxygen Frenkel pairs is one order of magnitude lower than the total number of vacancies shown in Figure 5. This difference comes from the difference of definition of vacancy and Frenkel pairs. As shown in Table 2, the distance between the vacant site and the escaped oxygen atom should be larger than 0.234 nm. In contrast, the corresponding distances defined for the vacancy are much smaller than that for oxygen Frenkel pairs, 0.097 nm (for O) and 0.138 nm (for Ce). The time averaged distribution of the iNN oxygen Frenkel pairs, where i = 1, 2, …, 7, is shown for the values of gSe = 0.4, 0.8, 1.2, and 1.6 keV/nm in Figure 9a–d, respectively. As seen from these figures, the short-distance Frenkel pairs, 1NN to 4NN, were in the majority for lower gSe (0.4 keV/nm), whereas the long-distance Frenkel pairs were found for the higher values of gSe (0.8, 1.2 and1.6 keV/nm).
In the case of CeO2, the displacement threshold energy for O is 20–30 eV, much smaller than that for Ce 50–60 eV [30]. Therefore, oxygen-induced defects are a sensitive indicator for the ion irradiation process. Oxygen Frenkel pairs are important because the aggregation of multiple oxygen Frenkel pairs acts as a source of dislocation loops [31]. The dislocation loops create a high-strain energy region, which becomes an initial point of crack formation and propagation in the irradiated specimen.
As can be seen from Figure 4, no hemispherical protrusion was observed on the surfaces; only disordered atoms were seen. In our simulation, the outside of the CeO2 is a free space, thus cooling by adiabatic extension could not occur. As Schattat et al. [1] pointed out, cooling by adiabatic extension is critical to obtain the hemispherical protrusion, especially for crystallizing as in the CeO2 case. We considered that the protrusion was in a vapor-like state initially and then was cooled significantly by adiabatic expansion into a hemispherical-shaped crystal (see Figures 2 and 5 in reference [3]). This process is significant and resembles the cluster formation process in the cluster-beam deposition method; the cylindrical region (the nanopore) acts similar to a nozzle in the cluster-beam deposition apparatus [32,33].
The animation of the formation process of the nano-hillock of CaF2 presented by Rymzhanov et al. [26] suggests that a strong Coulomb interaction plays an important role in forming the nano-hillock structure with single crystalline form. Karlušić et al. [27] simulated the formation process of the nano-hillock of MgO and Al2O3 with two different charge states, equilibrium charge state Zeff = +8.47 and fixed charge state Zeff = +6. They showed that the nano-hillock was formed for the equilibrium charge state, whereas a very small nano-hillock (Al2O3) or no nano-hillock (MgO) was formed for the fixed charge state. This finding also supports the importance of the strong Coulomb interaction. For the present case of CeO2, the equilibrium charge state of Ce is Zeff = +2.7 and the fixed charge state is Zeff = +4, indicating a weak Coulomb interaction. In addition, it should be noted that hillock formation experiment/simulation for the system with a free surface was done with 23 MeV I ion giving Se= 8.53 keV/nm (MgO) and 9.1 keV/nm (Al2O3), estimated by the SRIM code [27], whereas the irradiation experiment/simulation for the bulk system was done with 167 MeV Xe ion giving Se= 21 keV/nm (MgO), 24.9 keV/nm (Al2O3) [25]. This leads to another possible mechanism for nano-hillock formation: moderately strong beam irradiation to a strong Coulomb interaction system with a free surface.

4. Conclusions

Using the MD method, we simulated the nanopore formation process by applying a thermal spike to single crystal CeO2. The nanopore was formed abruptly at around 0.3 ps after the irradiation and grew to its maximum size at 0.5 ps. Then, it shrank in the time to 1.0 ps and was finally equilibrated. The nanopore size increased with increasing effective stopping power gSe (i.e., the thermal energy deposited per unit length in the specimen), but it saturated when gSe was 0.8 keV/nm or more. This finding will provide useful information for precise control of the size of the nanopores. We classified oxygen Frenkel pairs into seven types using the distance between the vacant site and the corresponding oxygen atom. Irrespective of the value of gSe, the number of interstitial ions became the maximum immediately after irradiation. Subsequently, interstitial ions occupied the vacancies to lower the system energy. When gSe was low, the vast majority of Frenkel pairs were the short-distance type and when gSe was high, both short-distance and long-distance types of Frenkel pairs were produced.
The present study has clarified the essence feature of the nanopore formation process by irradiation; however, there are several issues that should be addressed in further investigations: (i) the MD simulation box is small compared with the radius of cylindrical hole. (ii) The length to width ratio of the track deviates from that of actual experiment. (iii) Several MD simulations per Se are required to confirm quantitative information.

Author Contributions

Conceptualization, Y.S. and A.I.; methodology, Y.S.; software, Y.S.; validation, Y.S. and R.K.; investigation, R.K.; data curation, R.K.; writing—original draft preparation, Y.S.; writing—review and editing, N.I. and A.I.; visualization, R.K.; supervision, A.I.; project administration, Y.S.; funding acquisition, N.I. All authors have read and agreed to the published version of the manuscript.

Funding

This research was funded by JSPS KAKENHI Grant Numbers 16K06963 and 20K05389.

Institutional Review Board Statement

Not applicable.

Informed Consent Statement

Not applicable.

Acknowledgments

Tomoaki Akabane (a former graduate student at Ibaraki University, currently with Fuji Film Medical IT Solutions, Inc. (Tokyo, Japan)) is acknowledged for the development of the program for molecular dynamics simulation.

Conflicts of Interest

The authors declare no conflict of interest. The funders had no role in the design of the study; in the collection, analyses, or interpretation of data; in the writing of the manuscript, or in the decision to publish the results.

References

  1. Schattat, B.; Bolse, W.; Klaumuenzer, S.; Zizak, I.; Scholz, R. Cylindrical nanopores in NiO induced by swift heavy ions. Appl. Phys. Lett. 2005, 87, 173110. [Google Scholar] [CrossRef]
  2. Jensen, J.; Dunlop, A.; Della-Negra, S.; Pascard, H. Tracks in YIG induced by MeV C 60 ions. Nucl. Instrum. Methods B 1998, 135, 295–301. [Google Scholar] [CrossRef]
  3. Ishikawa, N.; Okubo, N.; Taguchi, T. Experimental evidence of crystalline hillocks created by irradiation of CeO2 with swift heavy ions: TEM study. Nanotechnology 2015, 26, 355701. [Google Scholar] [CrossRef] [PubMed]
  4. Ishikawa, N.; Taguchi, T.; Kitamura, A.; Szenes, G.; Toimil-Molares, M.E.; Trautmann, C. TEM analysis of ion tracks and hillocks produced by swift heavy ions of different velocities in Y3Fe5O12. J. Appl. Phys. 2020, 127, 055902. [Google Scholar] [CrossRef]
  5. Costantini, J.-M.; Lelong, G.; Guillaumet, M.; Gourier, D.; Takaki, S.; Ishikawa, N.; Watanabe, H.; Yasuda, K. Optical reflectivity of ion-irradiated cerium dioxide sinters. J. Appl. Phys. 2019, 126, 175902. [Google Scholar] [CrossRef]
  6. Costantini, J.-M.; Gutierrez, G.; Watanabe, H.; Yasuda, K.; Takaki, S.; Lelong, G.; Guillaumet, M.; Weber, W.J. Optical spectroscopy study of modifications induced in cerium dioxide by electron and ion irradiations. Philos. Mag. 2019, 99, 1695–1714. [Google Scholar] [CrossRef] [Green Version]
  7. Palomares, R.I.; Shamblin, J.; Tracy, C.L.; Neuefeind, J.; Ewing, R.C.; Trautmann, C.; Lang, M. Defect accumulation in swift heavy ion-irradiated CeO2 and ThO2. J. Mater. Chem. A 2017, 5, 12193. [Google Scholar] [CrossRef]
  8. Graham, J.T.; Zhang, Y.; Weber, W.J. Irradiation-induced defect formation and damage accumulation in single crystal CeO2. J. Nucl. Mater. 2018, 498, 400–408. [Google Scholar] [CrossRef]
  9. Shelyug, A.; Palomares, R.I.; Lang, M.; Navrotsky, A. Energetics of defect production in fluorite-structured CeO2 induced by highly ionizing radiation. Phys. Rev. Mater. 2018, 2, 093607. [Google Scholar] [CrossRef]
  10. Costantini, J.-M.; Miro, S.; Touati, N.; Binet, L.; Wallez, G.; Lelong, G.; Guillaumet, M.; Weber, W.J. Defects induced in cerium dioxide single crystals by electron irradiation. J. Appl. Phys. 2018, 123, 025901. [Google Scholar] [CrossRef]
  11. Cureton, W.F.; Palomares, R.I.; Walters, J.; Tracy, C.L.; Chen, C.-H.; Ewing, R.C.; Baldinozzi, G.; Lian, J.; Trautmann, C.; Lang, M. Grain size effects on irradiated CeO2, ThO2, and UO2. Acta Mater. 2018, 160, 47–56. [Google Scholar] [CrossRef]
  12. Maslakov, K.I.; Teterin, Y.A.; Popel, A.J.; Teterin, A.Y.; Ivanov, K.E.; Kalmykov, S.N.; Petrov, V.G.; Petrov, P.K.; Farnan, I. XPS study of ion irradiated and unirradiated CeO2 bulk and thin film samples. Appl. Surf. Sci. 2018, 448, 154–162. [Google Scholar] [CrossRef]
  13. Cureton, W.F.; Palomares, R.I.; Tracy, C.L.; O’Quinn, E.C.; Walters, J.; Zdorovets, M.; Ewing, R.C.; Toulemonde, M.; Lang, M. Effects of irradiation temperature on the response of CeO2, ThO2, and UO2 to highly ionizing radiation. J. Nucl. Mater. 2019, 525, 83–91. [Google Scholar] [CrossRef]
  14. Abanades, S.; Flamant, G. Thermochemical hydrogen production from a two-step solar driven water-splitting cycle based on cerium oxides. Sol. Energy 2006, 80, 1611–1623. [Google Scholar] [CrossRef]
  15. Sasajima, Y.; Onuki, H.; Ishikawa, N.; Iwase, A. Computer simulation of high-energy-ion irradiation of SiO2. Trans. MRS-J. 2013, 38, 497–502. [Google Scholar]
  16. Sasajima, Y.; Ajima, N.; Osada, T.; Ishikawa, N.; Iwase, A. Molecular dynamics simulation of fast particle irradiation to the Gd2O3-doped CeO2. Nucl. Instrum. Methods B 2013, 316, 176–182. [Google Scholar] [CrossRef]
  17. Sasajima, Y.; Osada, T.; Ishikawa, N.; Iwase, A. Computer simulation of high-energy-ion irradiation of uranium dioxide. Nucl. Instrum. Methods B 2013, 314, 195–201. [Google Scholar] [CrossRef]
  18. Sasajima, Y.; Ajima, N.; Osada, T.; Ishikawa, N.; Iwase, A. Molecular dynamics simulation of fast particle irradiation to the single crystal CeO2. Nucl. Instrum. Methods B 2013, 314, 202–207. [Google Scholar] [CrossRef]
  19. Sasajima, Y.; Ajima, N.; Kaminaga, R.; Ishikawa, N.; Iwase, A. Structure analysis of the defects generated by a thermal spike in single crystal CeO2: A molecular dynamics study. Nucl. Instrum. Methods B 2019, 440, 118–125. [Google Scholar] [CrossRef]
  20. Yablinsky, C.A.; Devanathan, R.; Pakarinen, J.; Gan, J.; Severin, D.; Trautmann, C.; Allen, T. Characterization of swift heavy ion irradiation damage in ceria. J. Mater. Res. 2015, 30, 1473–1484. [Google Scholar] [CrossRef]
  21. Medvedev, N.A.; Rymzhanov, R.A.; Volkov, A.E. Time-resolved electron kinetics in swift heavy ion irradiated solids. J. Phys. D 2015, 48, 355303. [Google Scholar] [CrossRef]
  22. Rymzhanov, R.A.; Medvedev, N.; Volkov, A.E. Damage threshold and structure of swift heavy ion tracks in Al2O3. J. Phys. D Appl. Phys. 2017, 50, 475301. [Google Scholar] [CrossRef]
  23. Rymzhanova, R.A.; Medvedev, N.; Volkova, A.E.; O’Connell, J.H.; Skuratova, V.A. Overlap of swift heavy ion tracks in Al2O3. Nucl. Instrum. Methods B 2018, 435, 121–125. [Google Scholar] [CrossRef]
  24. Rymzhanova, R.A.; Gorbunovd, S.A.; Medvedeve, N.; Volkova, A.E. Damage along swift heavy ion trajectory. Nucl. Instrum. Methods B 2019, 440, 25–35. [Google Scholar] [CrossRef]
  25. Rymzhanov, R.A.; Medvedev, N.; O’Connell, J.H.; Janse van Vuuren, A.; Skuratov, V.A.; Volkov, A.E. Recrystallization as the governing mechanism of ion track formation. Sci. Rep. 2019, 9, 3837. [Google Scholar] [CrossRef] [PubMed]
  26. Rymzhanov, R.A.; O’Connell, J.H.; Janse van Vuuren, A.; Skuatov, V.A.; Medvedev, N.; Volkov, A.E. Insight into picosecond kinetics of insulator surface under ionizing radiation. J. Appl. Phys. 2020, 127, 015901. [Google Scholar] [CrossRef]
  27. Karlušić, M.; Rymzhanov, R.A.; O’Connell, J.H.; Bröckers, L.; Tomić, L.K.; Siketić, Z.; Fazinić, S.; Dubček, P.; Jakšić, M.; Provatas, G.; et al. Mechanisms of surface nanostructuring of Al2O3 and MgO by grazing incidence irradiation with swift heavy ions. Surf. Interfaces 2021, 27, 101508. [Google Scholar] [CrossRef]
  28. Inaba, H.; Sagawa, R.; Hayashi, H.; Kawamura, K. Molecular dynamics simulation of gadolinia-doped ceria. Solid State Ion. 1999, 122, 95–103. [Google Scholar] [CrossRef]
  29. Sadus, R.J. Molecular Simulation of Fuids–Theory, Algorithms and Object-Orientation; Elsevier: Amsterdam, The Netherlands, 2002; p. 305. [Google Scholar]
  30. Shiiyama, K.; Yamamoto, T.; Takahashi, T.; Guglielmetti, A.; Chartier, A.; Yasuda, K.; Matsumura, S.; Yasunaga, K.; Meis, C. Molecular dynamics simulations of oxygen Frenkel pairs in cerium dioxide. Nucl. Instrum. Methods B 2010, 268, 2980–2983. [Google Scholar] [CrossRef]
  31. Yasunaga, K.; Yasuda, K.; Matsumura, S.; Sonoda, T. Electron energy-dependent formation of dislocation loops in CeO2. Nucl. Instrum. Methods B 2008, 266, 2877–2881. [Google Scholar] [CrossRef]
  32. Takaoka, H. Ionized Cluster Beam Technique for Deposition and Epitaxy. Ph.D. Thesis, Kyoto University, Kyoto, Japan, 23 July 1981; pp. 45–50. [Google Scholar] [CrossRef]
  33. Yamada, I.; Takaoka, H. Ionized Cluster Beams: Physics and Technology. Jpn. J. Appl. Phys. 1993, 32, 2121. [Google Scholar] [CrossRef]
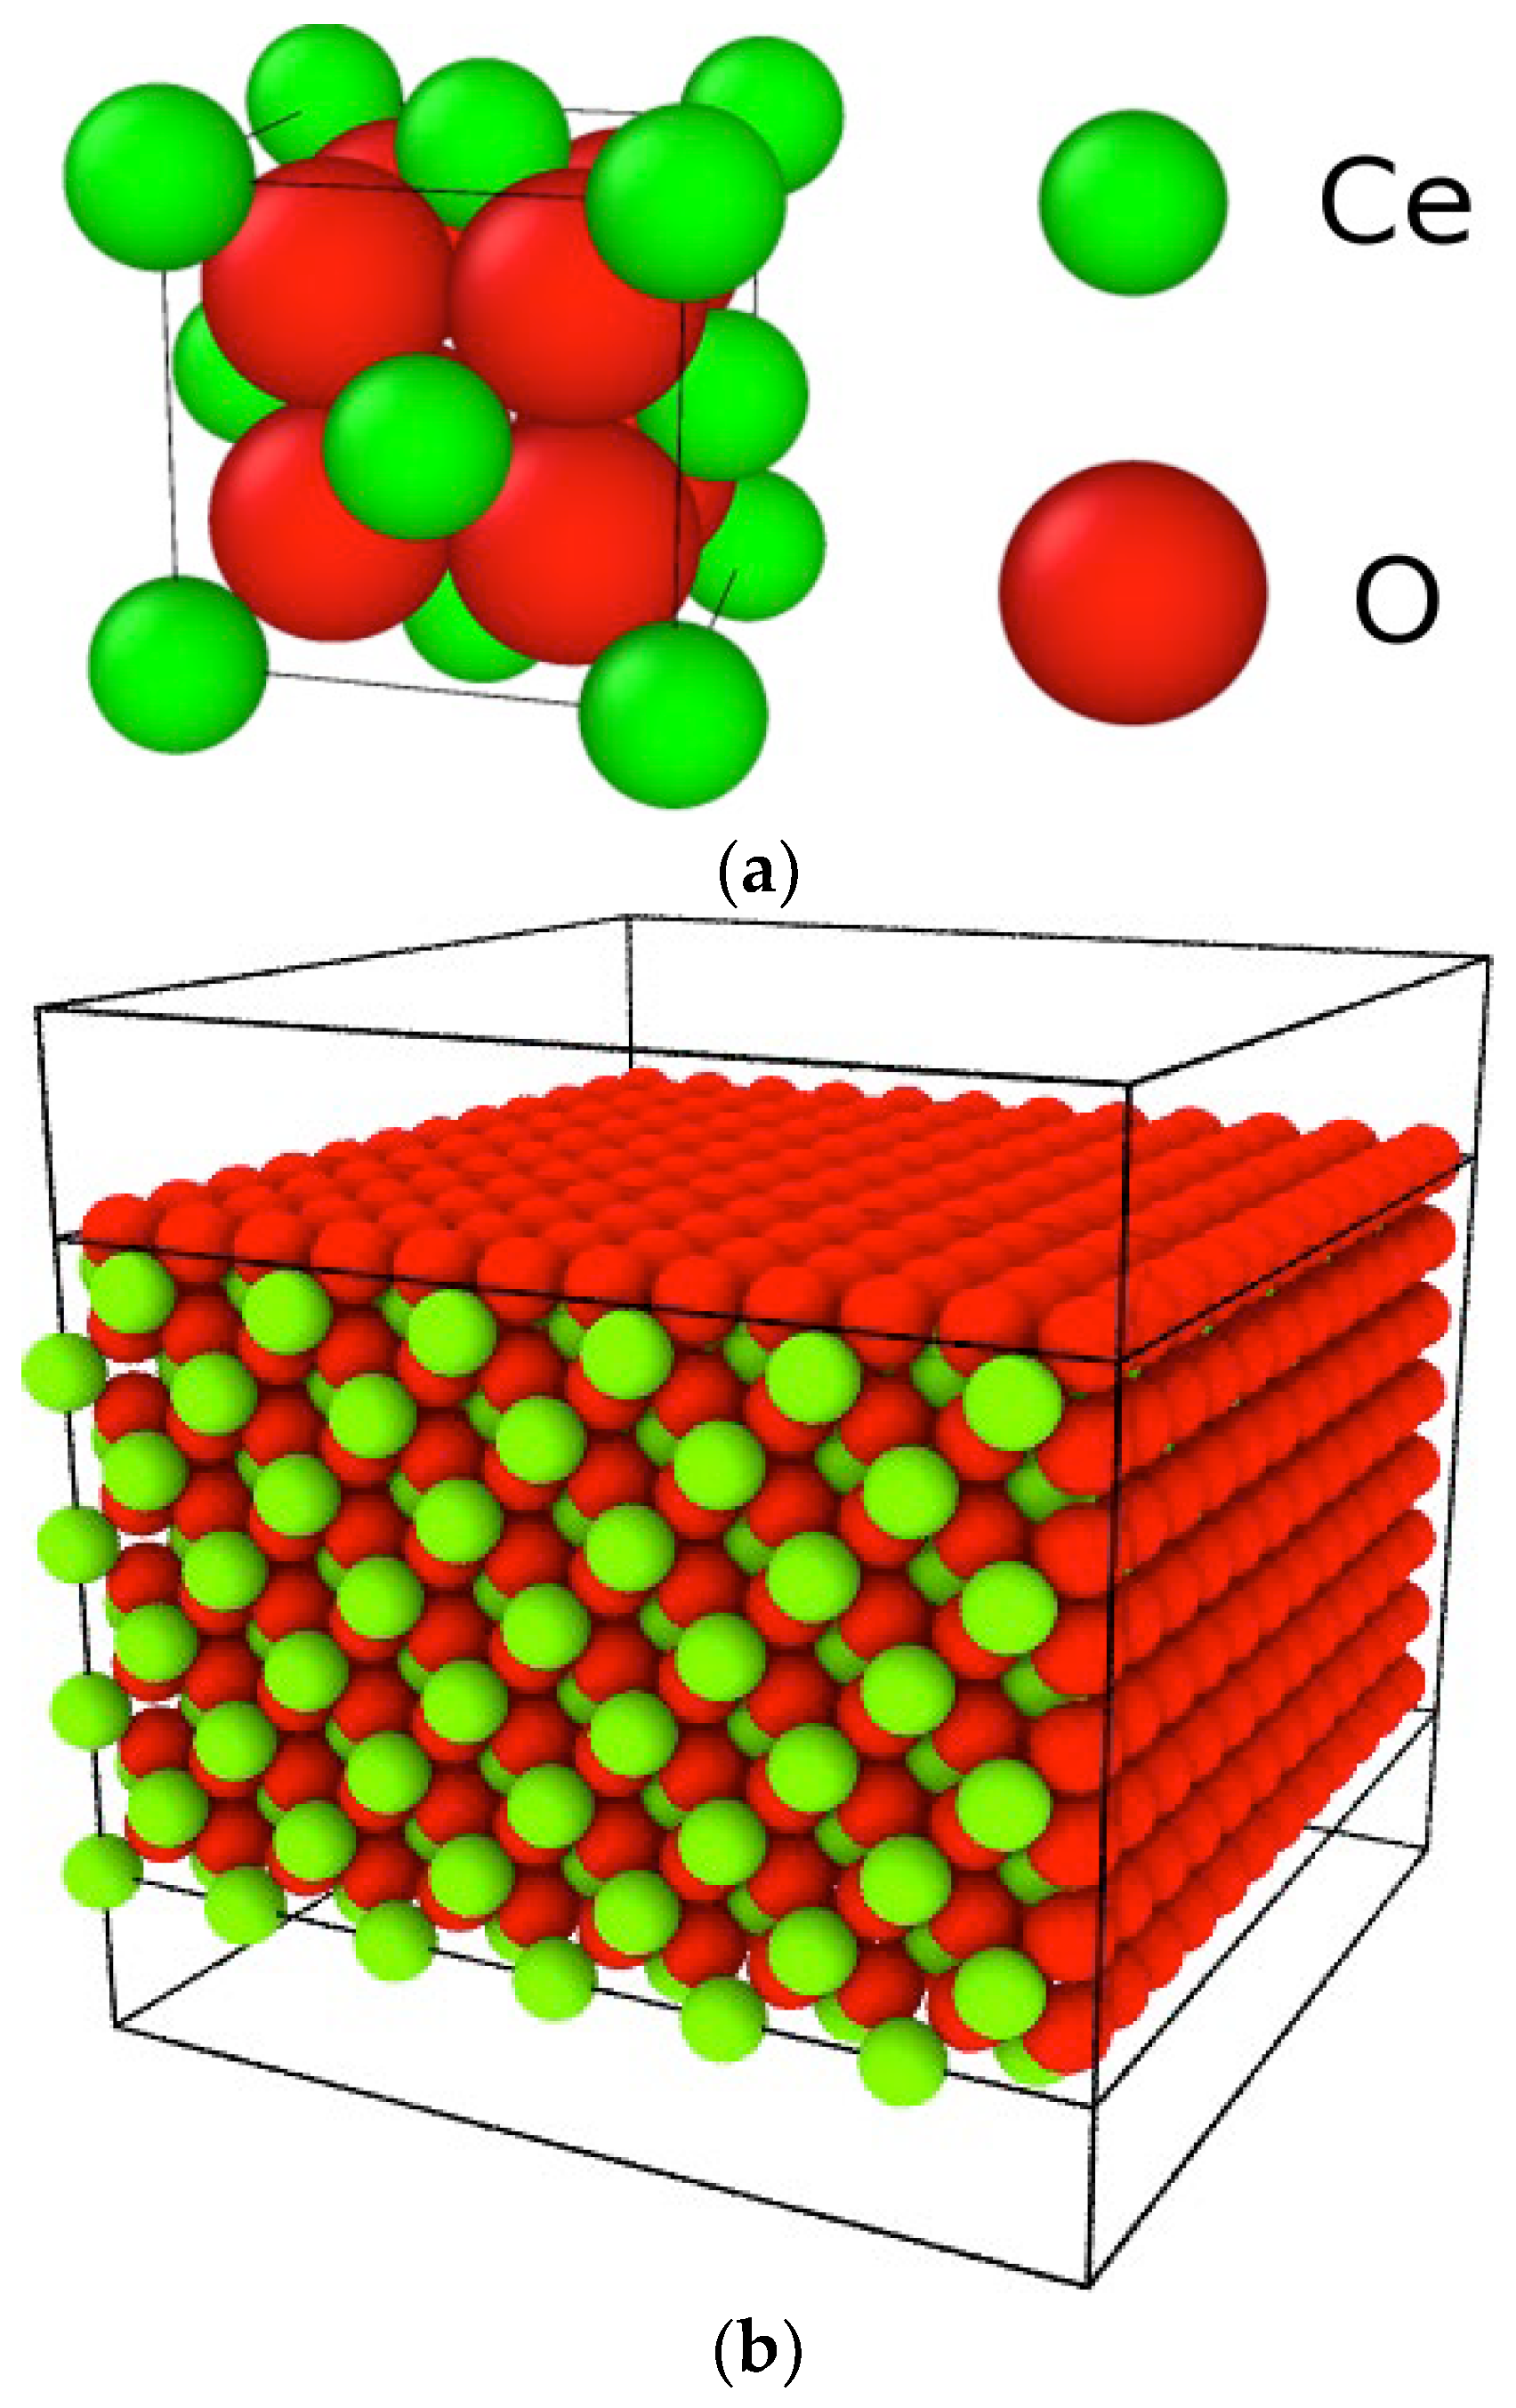
Figure 1. (a) The unit structure of CeO2 fluorite. (b) The whole system for calculation.
Qubs 05 00032 g001
Figure 2. An example 1NN Frenkel pair.
Qubs 05 00032 g002
Figure 3. Structural change of the CeO2 systems viewed from (a) <001> and (b) <100> directions after the irradiation and for gSe = 0.0 keV/nm.
Qubs 05 00032 g003
Figure 4. Structural change of the CeO2 systems viewed from (a) <001> and (b) <100> directions after the irradiation and for gSe = 0.8 keV/nm.
Qubs 05 00032 g004
Figure 5. Time change of the total number of vacancies for the values of (a) gSe = 0.1–0.8 keV/nm and (b) gSe = 0.8–1.6 keV/nm.
Qubs 05 00032 g005aQubs 05 00032 g005b
Figure 6. Distributions of vacancies in the CeO2 systems viewed from (a) <001> and (b) <100> directions for the values of gSe = 0.2 keV/nm.
Qubs 05 00032 g006aQubs 05 00032 g006b
Figure 7. Distributions of vacancies in the CeO2 systems viewed from (a) <001> and (b) <100> directions for the values of gSe = 0.8 keV/nm.
Qubs 05 00032 g007
Figure 8. Time change of oxygen Frenkel pairs for gSe = 0.4, 0.8, 1.2, and1.6 keV/nm.
Qubs 05 00032 g008
Figure 9. The time averaged distribution of iNN oxygen Frenkel pair, where i = 1, 2, …, 7, is shown for the values of gSe = 0.4, 0.8, 1.2, and1.6 keV/nm in (ad), respectively.
Qubs 05 00032 g009aQubs 05 00032 g009b
Table 1. Potential parameters for CeO2 [28].
ParametersCe 4+O 2−
z2.700−1.350
a (nm)0.13300.1847
b (nm)0.004540.0166
c (J0.5(nm)3mol−0.5)0.001.294
f04.071964.07196
Table 2. Distance between the vacant site and oxygen atom for iNN Frenkel pairs (i = 1, 2, …,7).
Type (NN: Nearest Neighbor)Distance (nm)
1NN0.234
2NN0.449
3NN0.590
4NN0.703
5NN0.800
6NN0.887
7NN0.966
Publisher’s Note: MDPI stays neutral with regard to jurisdictional claims in published maps and institutional affiliations.