First Experiment of Spin Contrast Variation Small-Angle Neutron Scattering on the iMATERIA Instrument at J-PARC

 , ,
, ,
Abstract
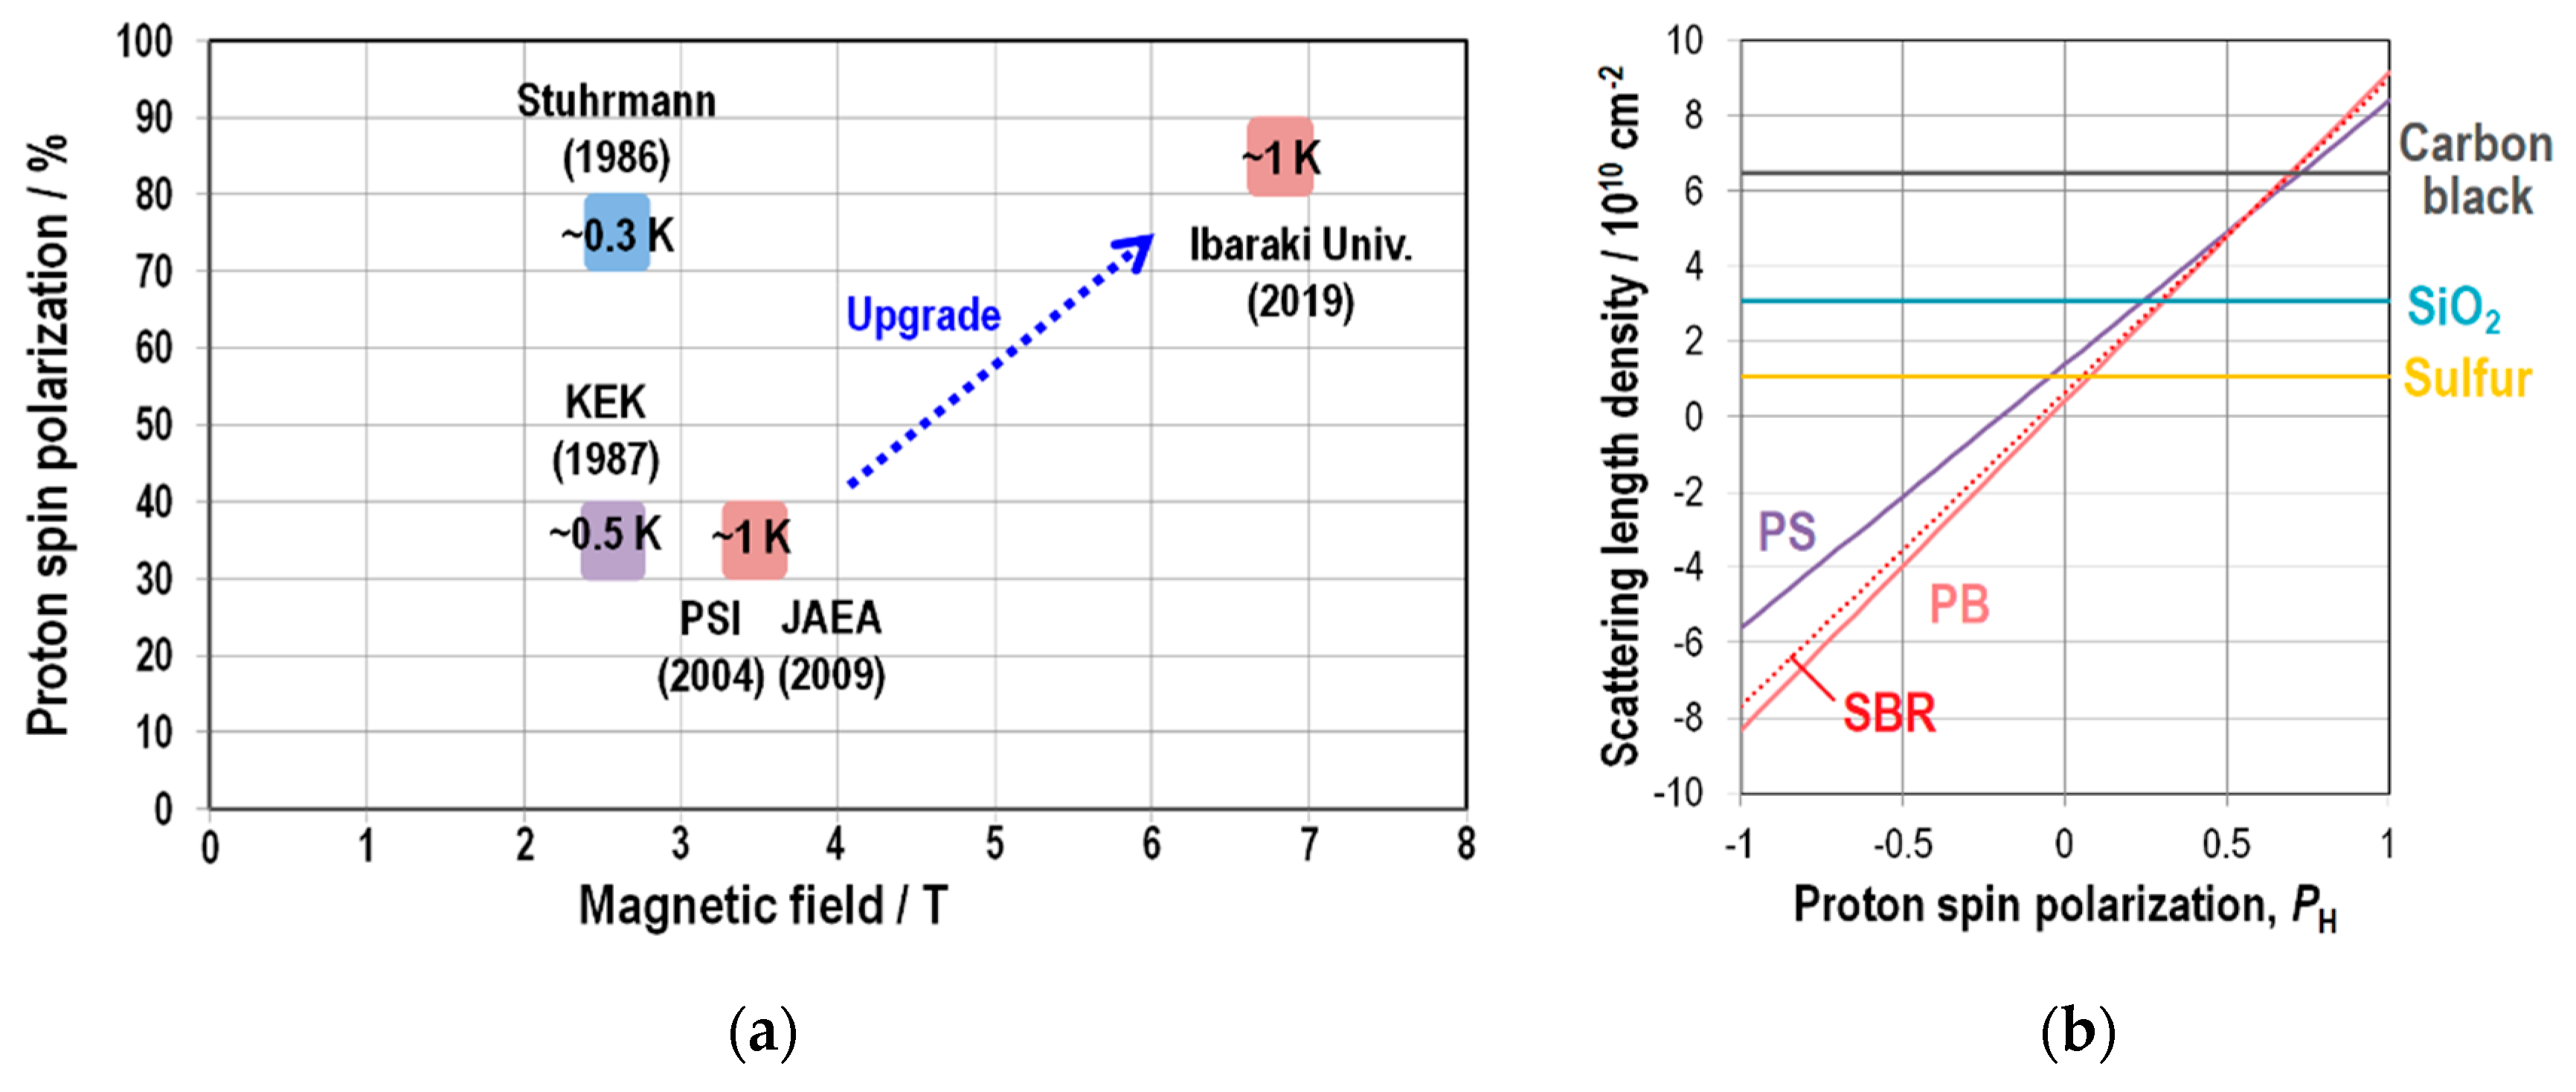
1. Introduction
2. Experiment
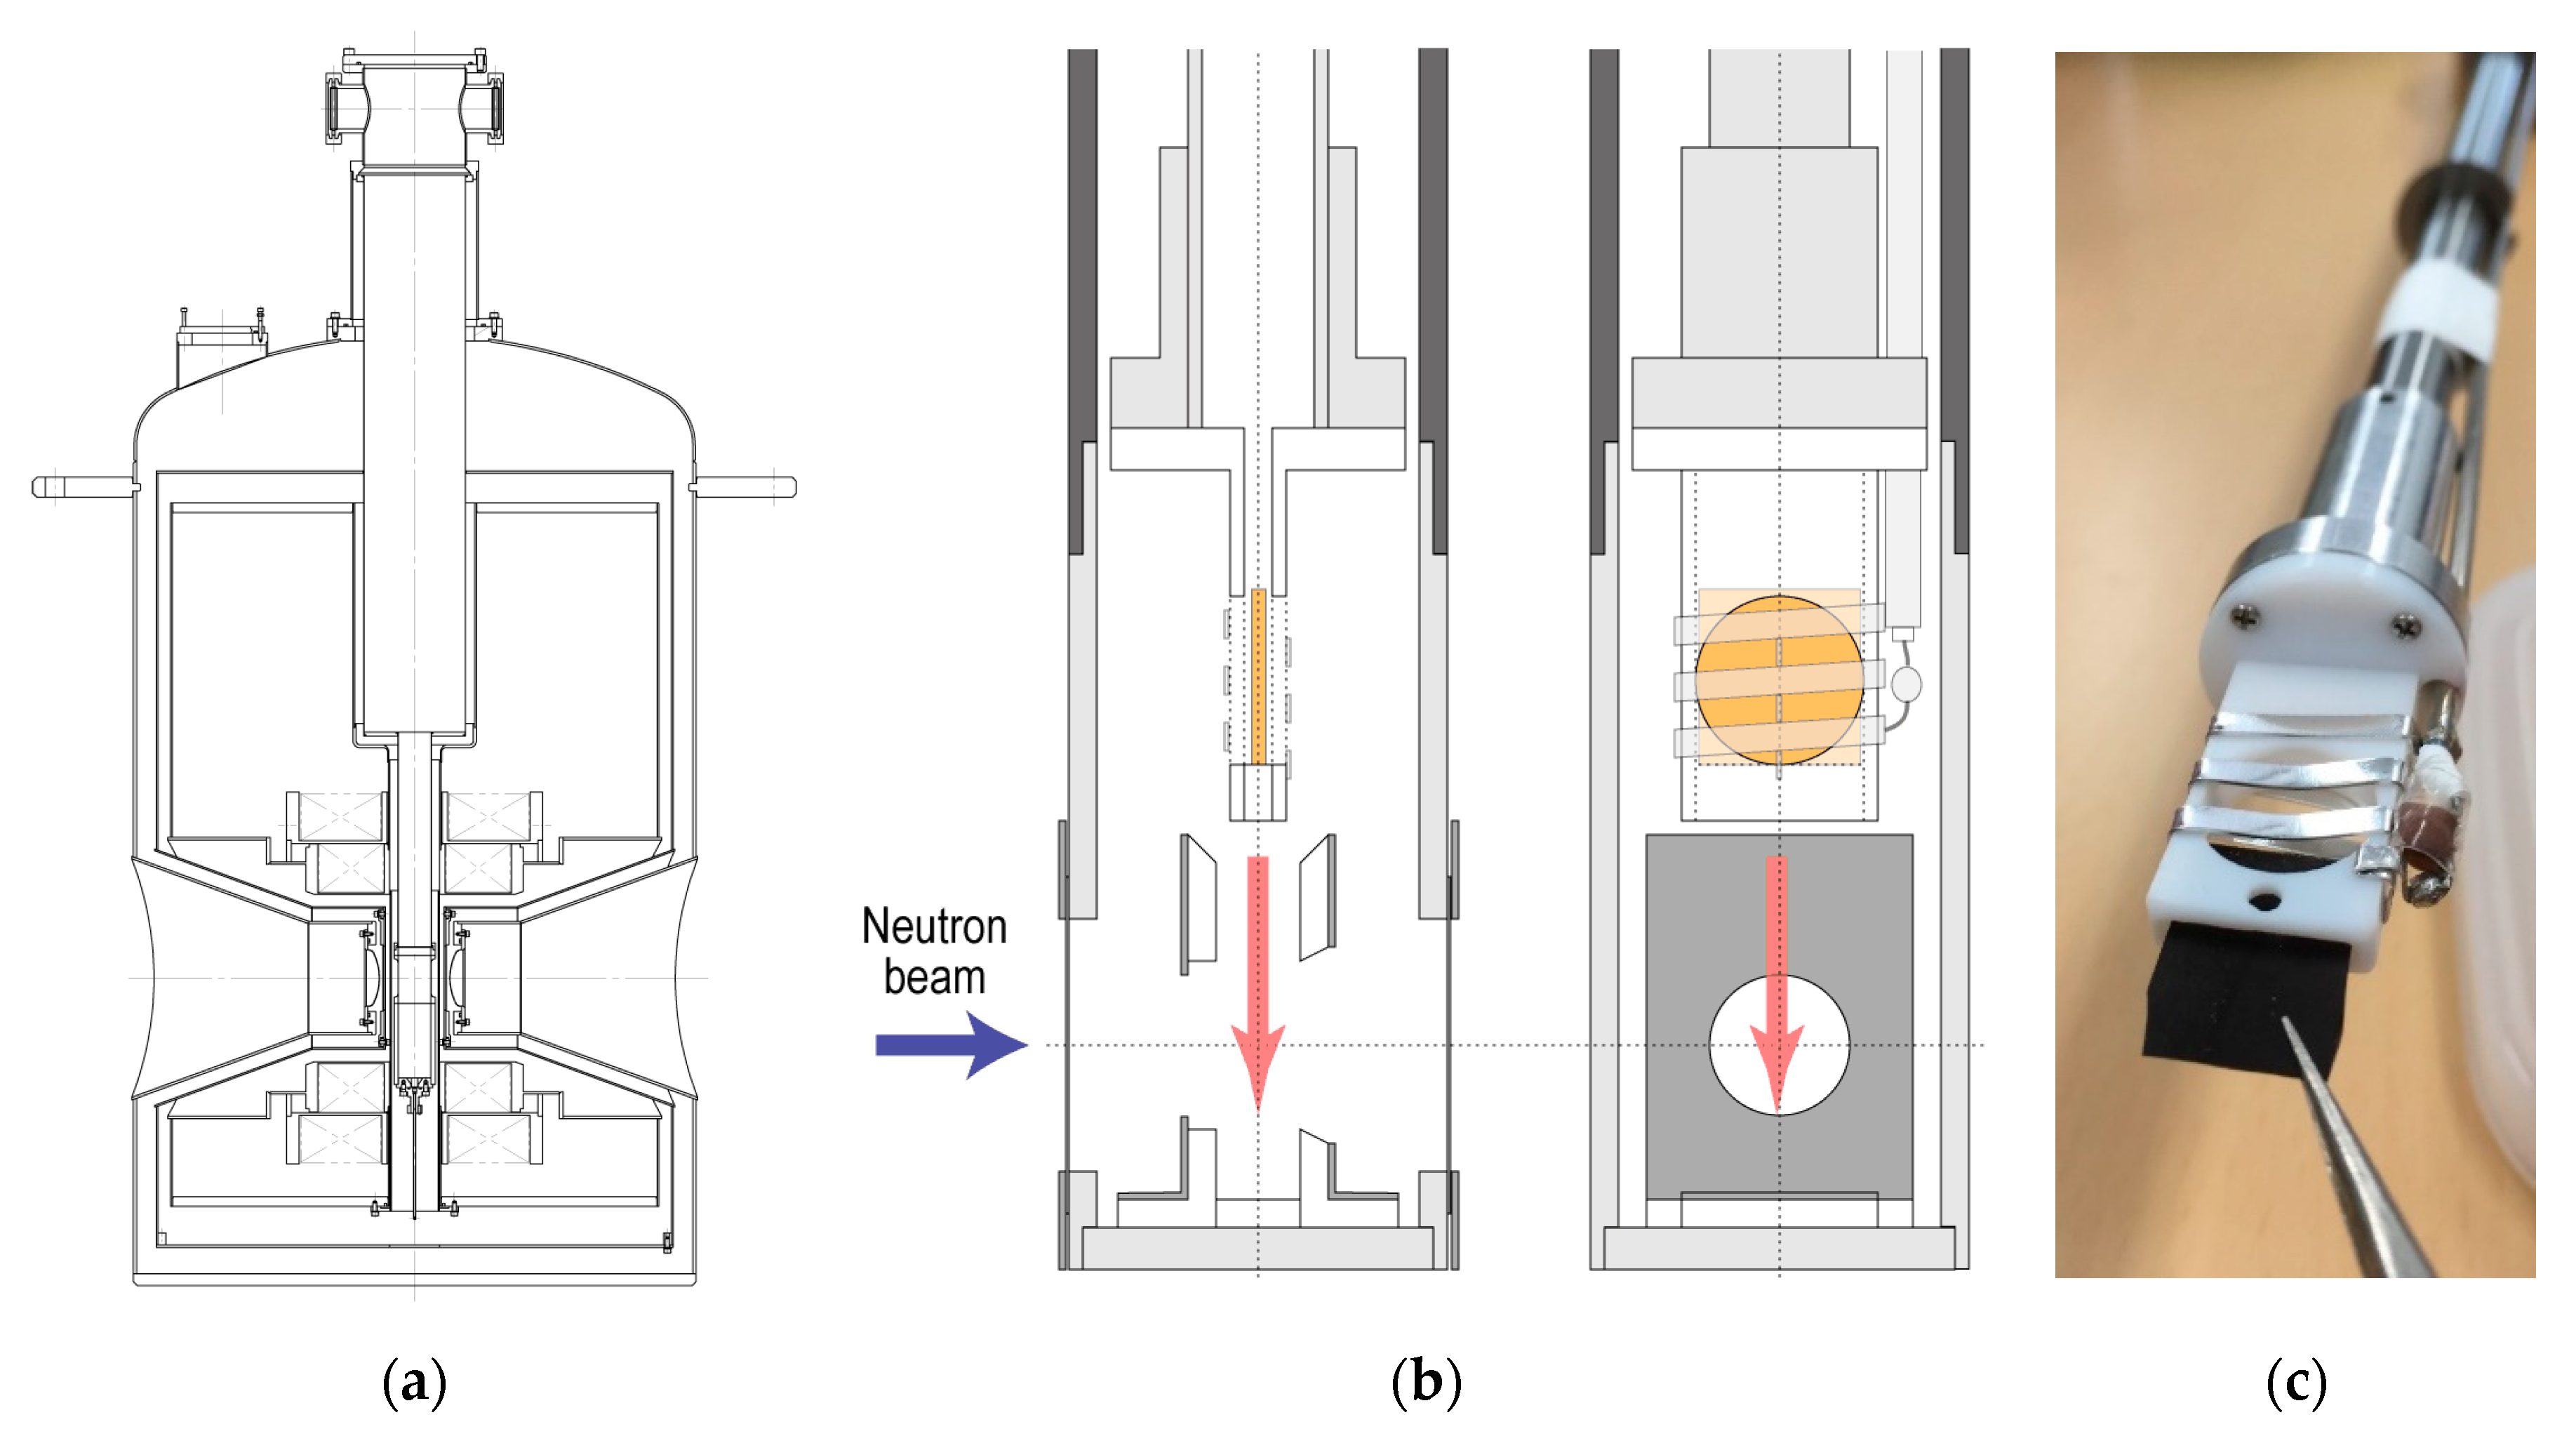
2.1. DNP Apparatus
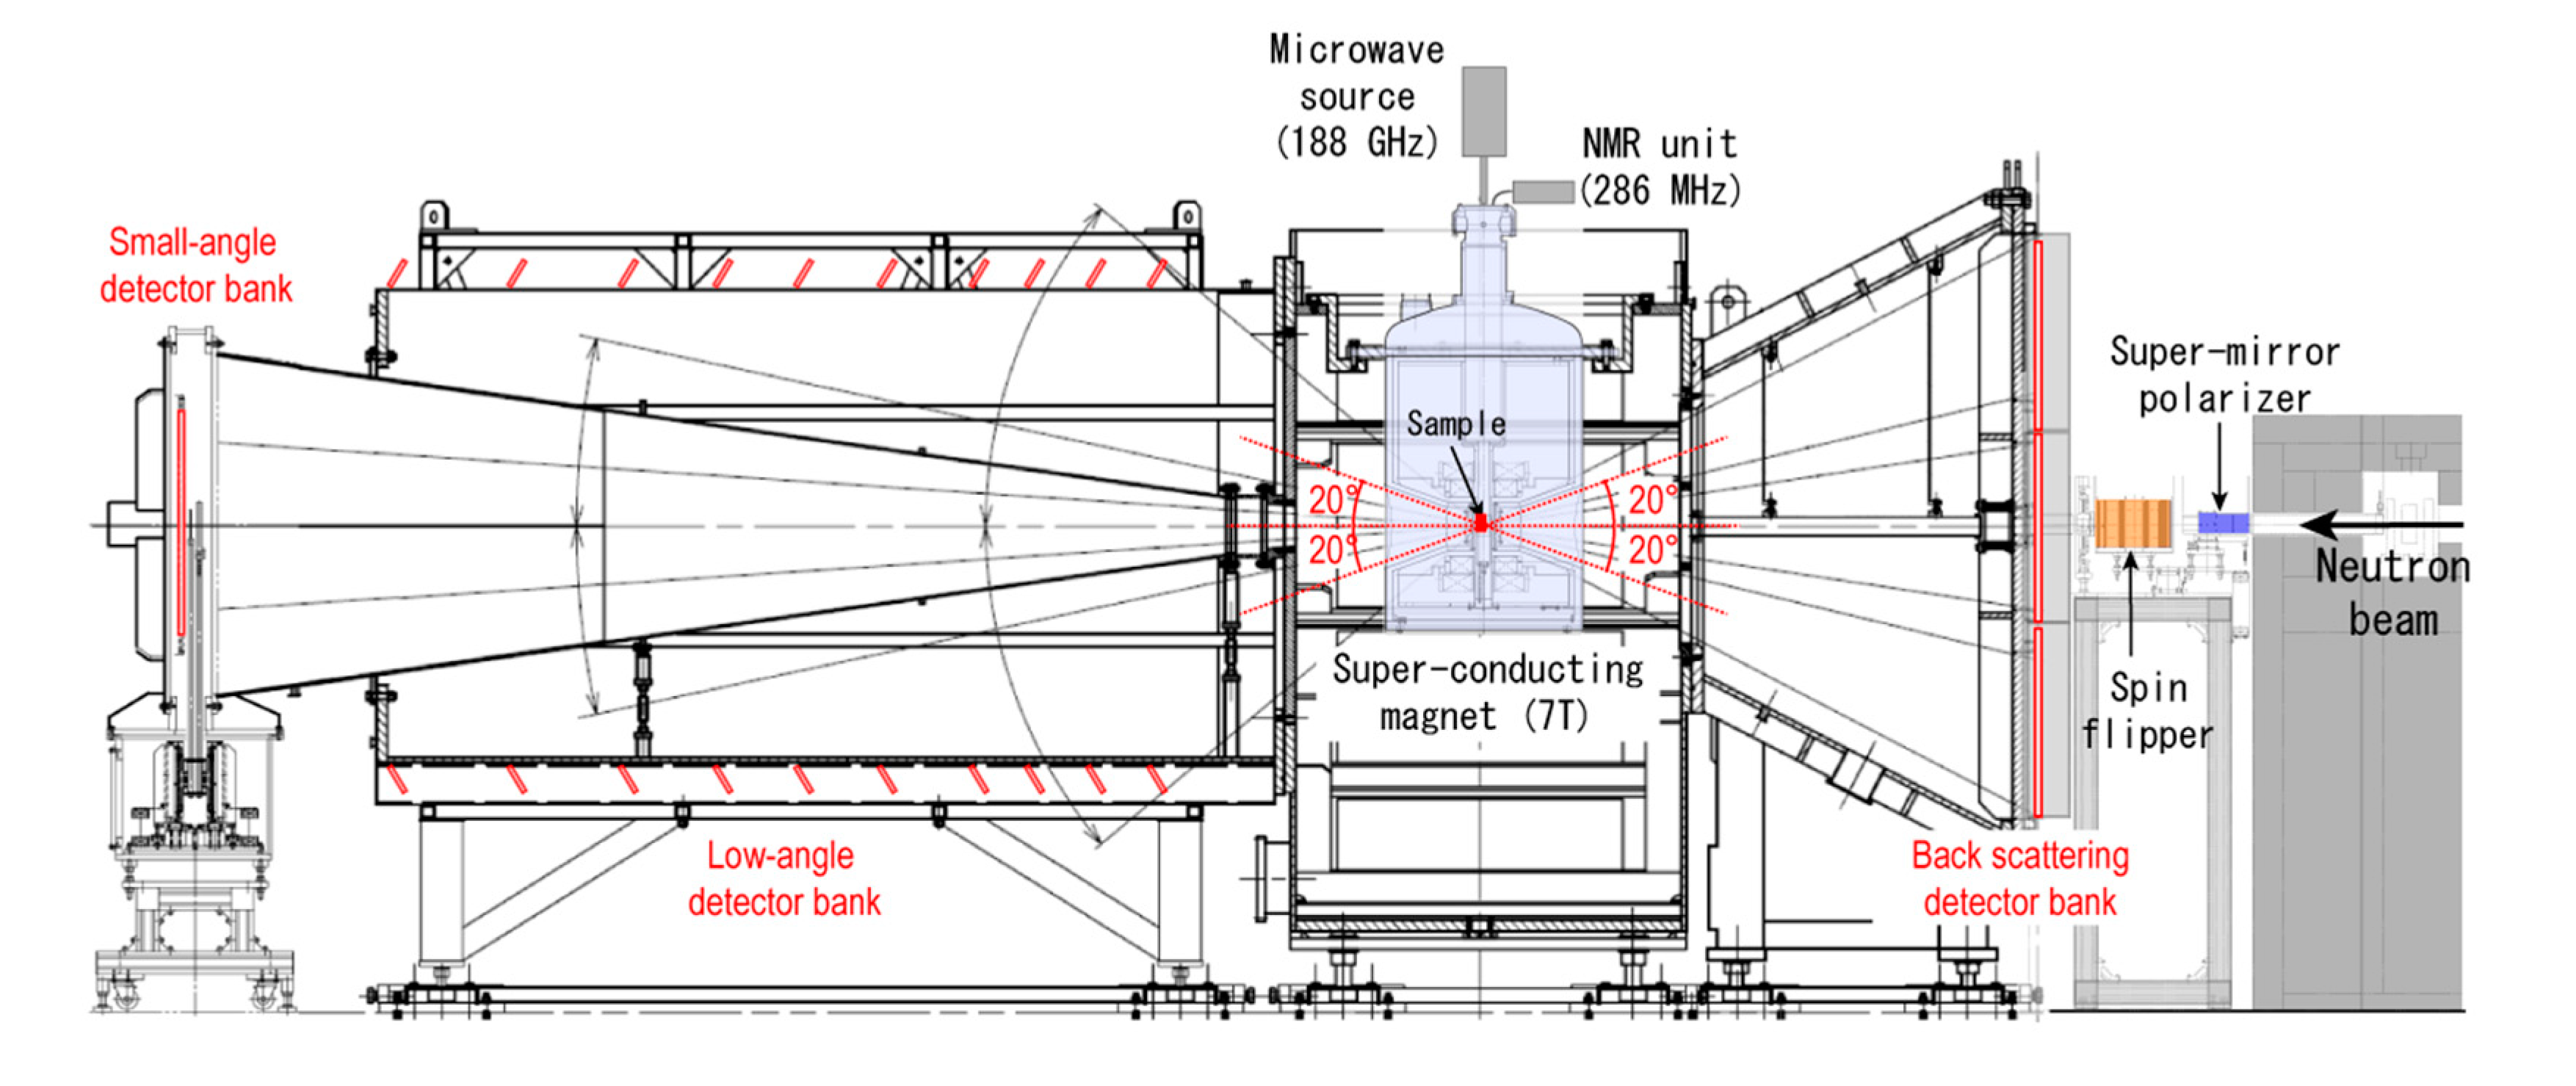
2.2. SANS Instrument (BL20 iMATERIA)
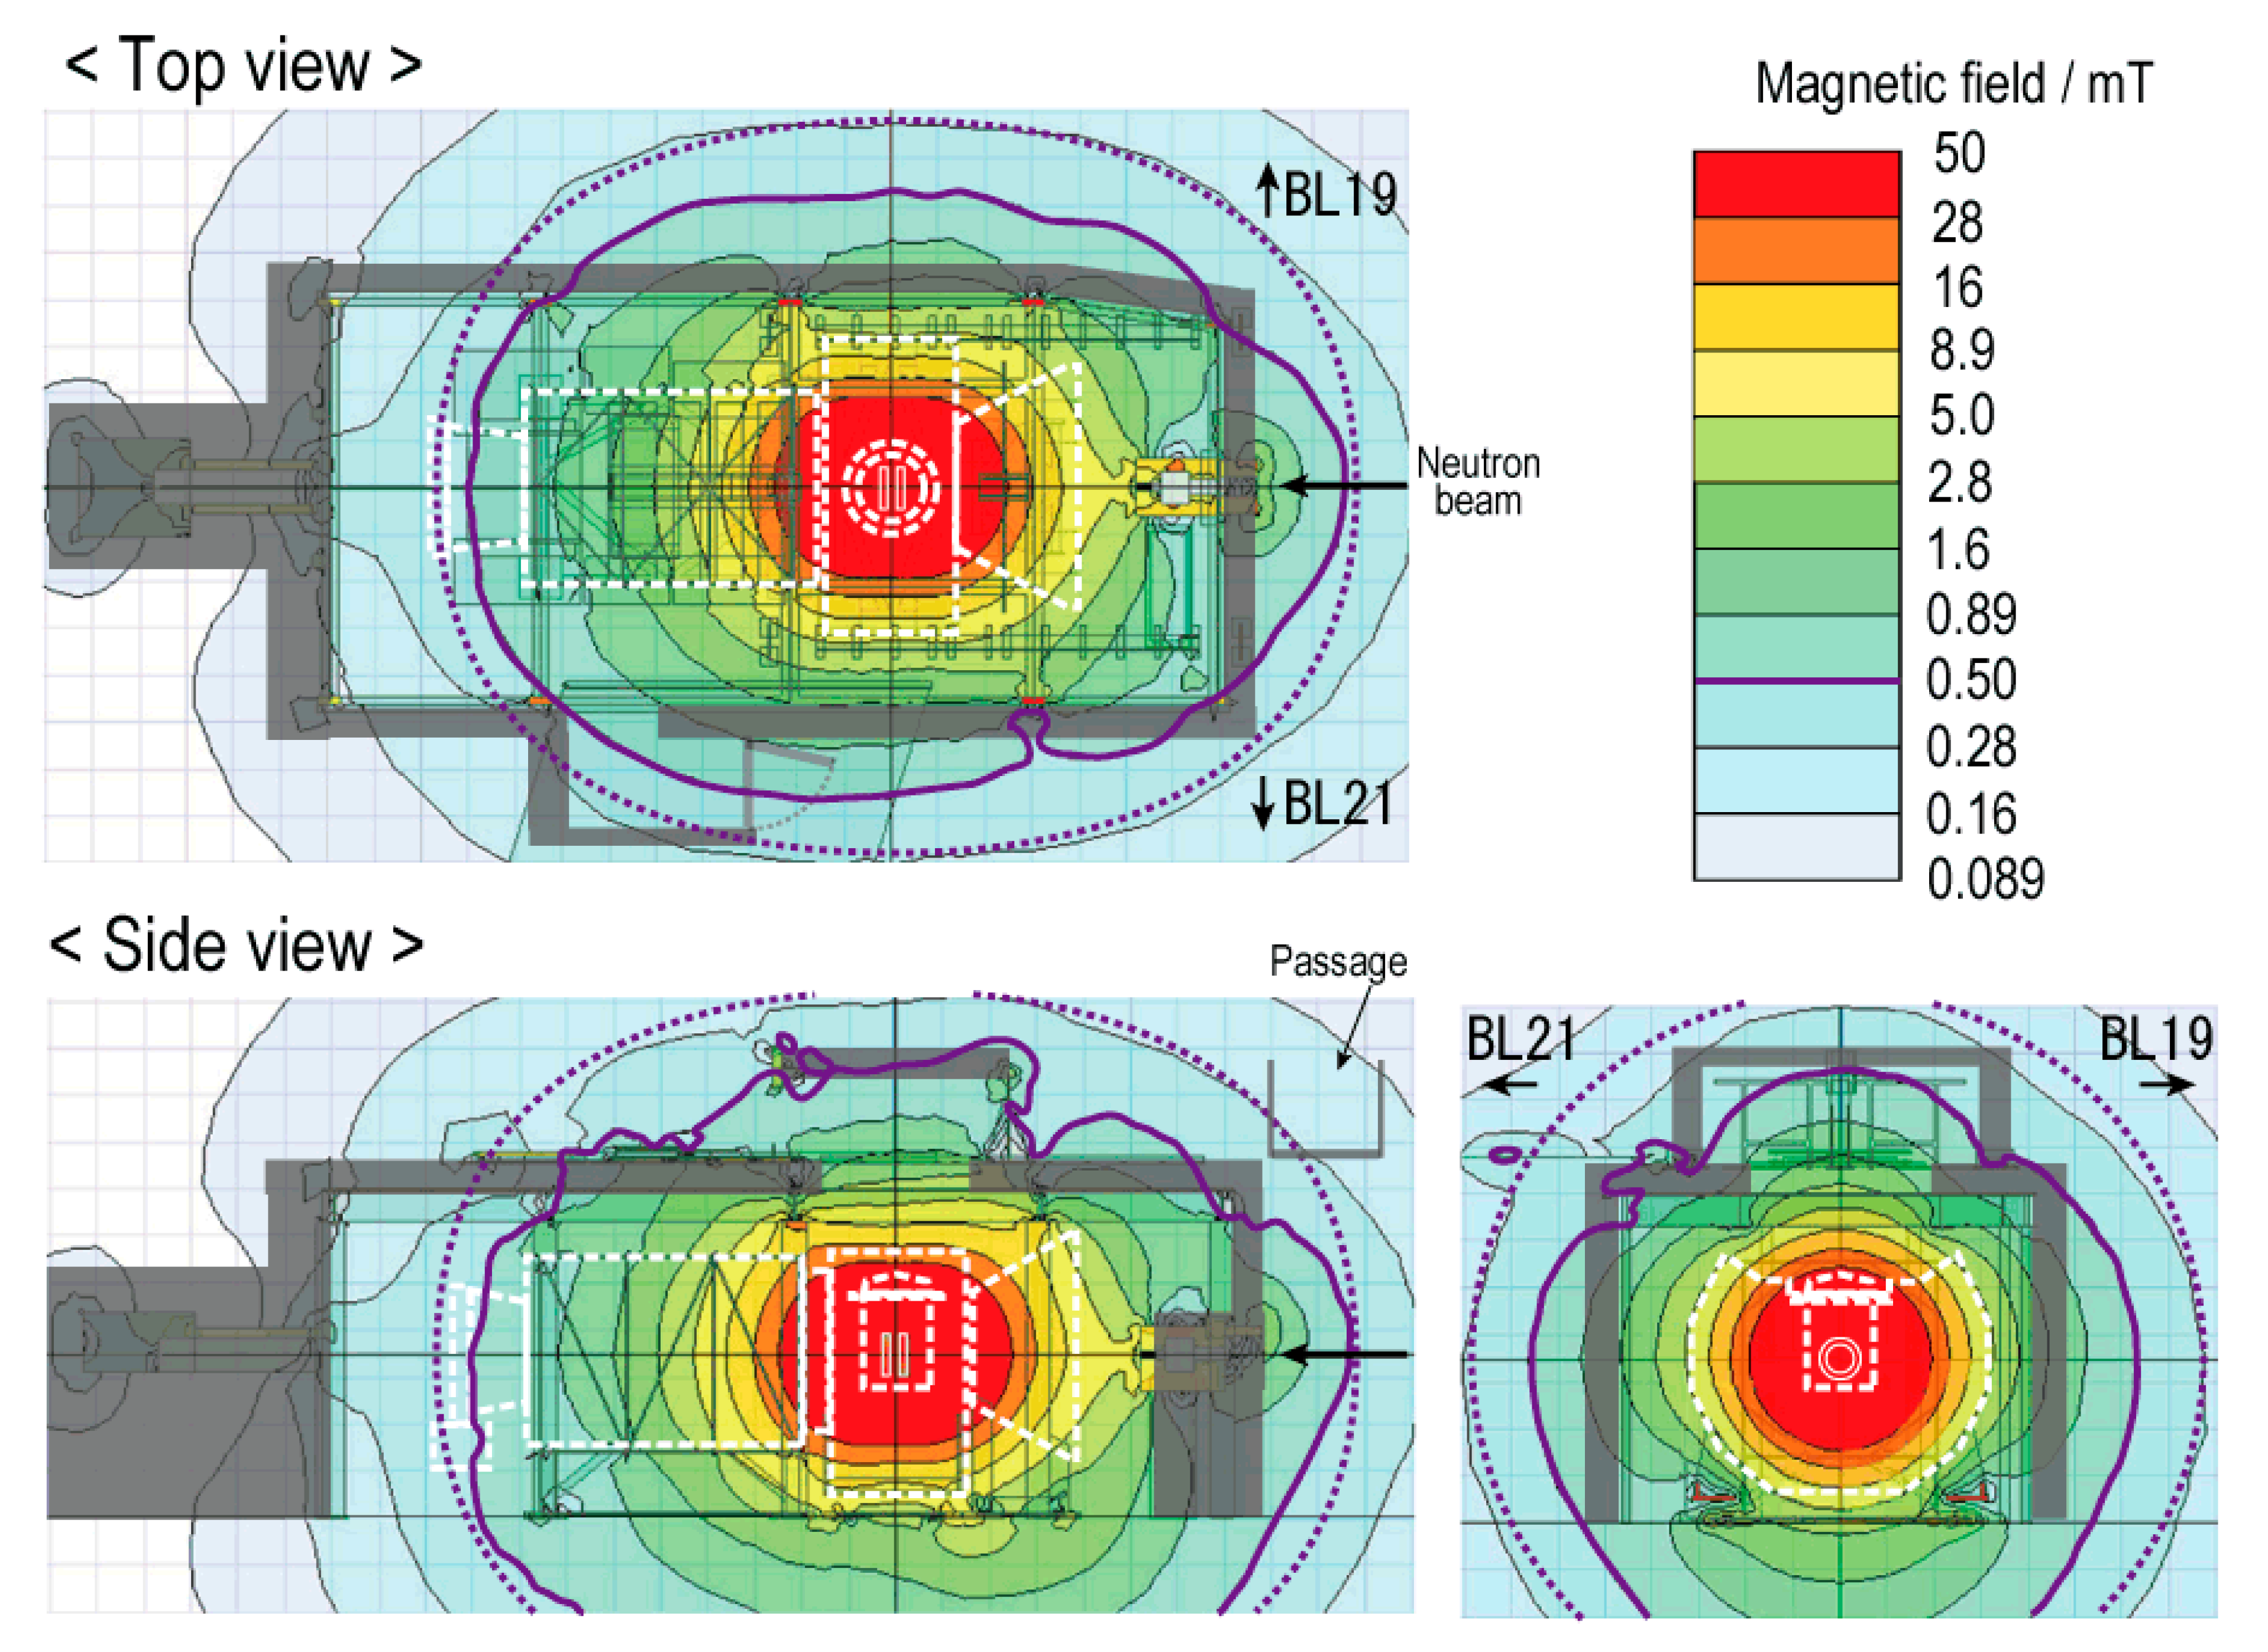
2.3. Stray Magnetic Field
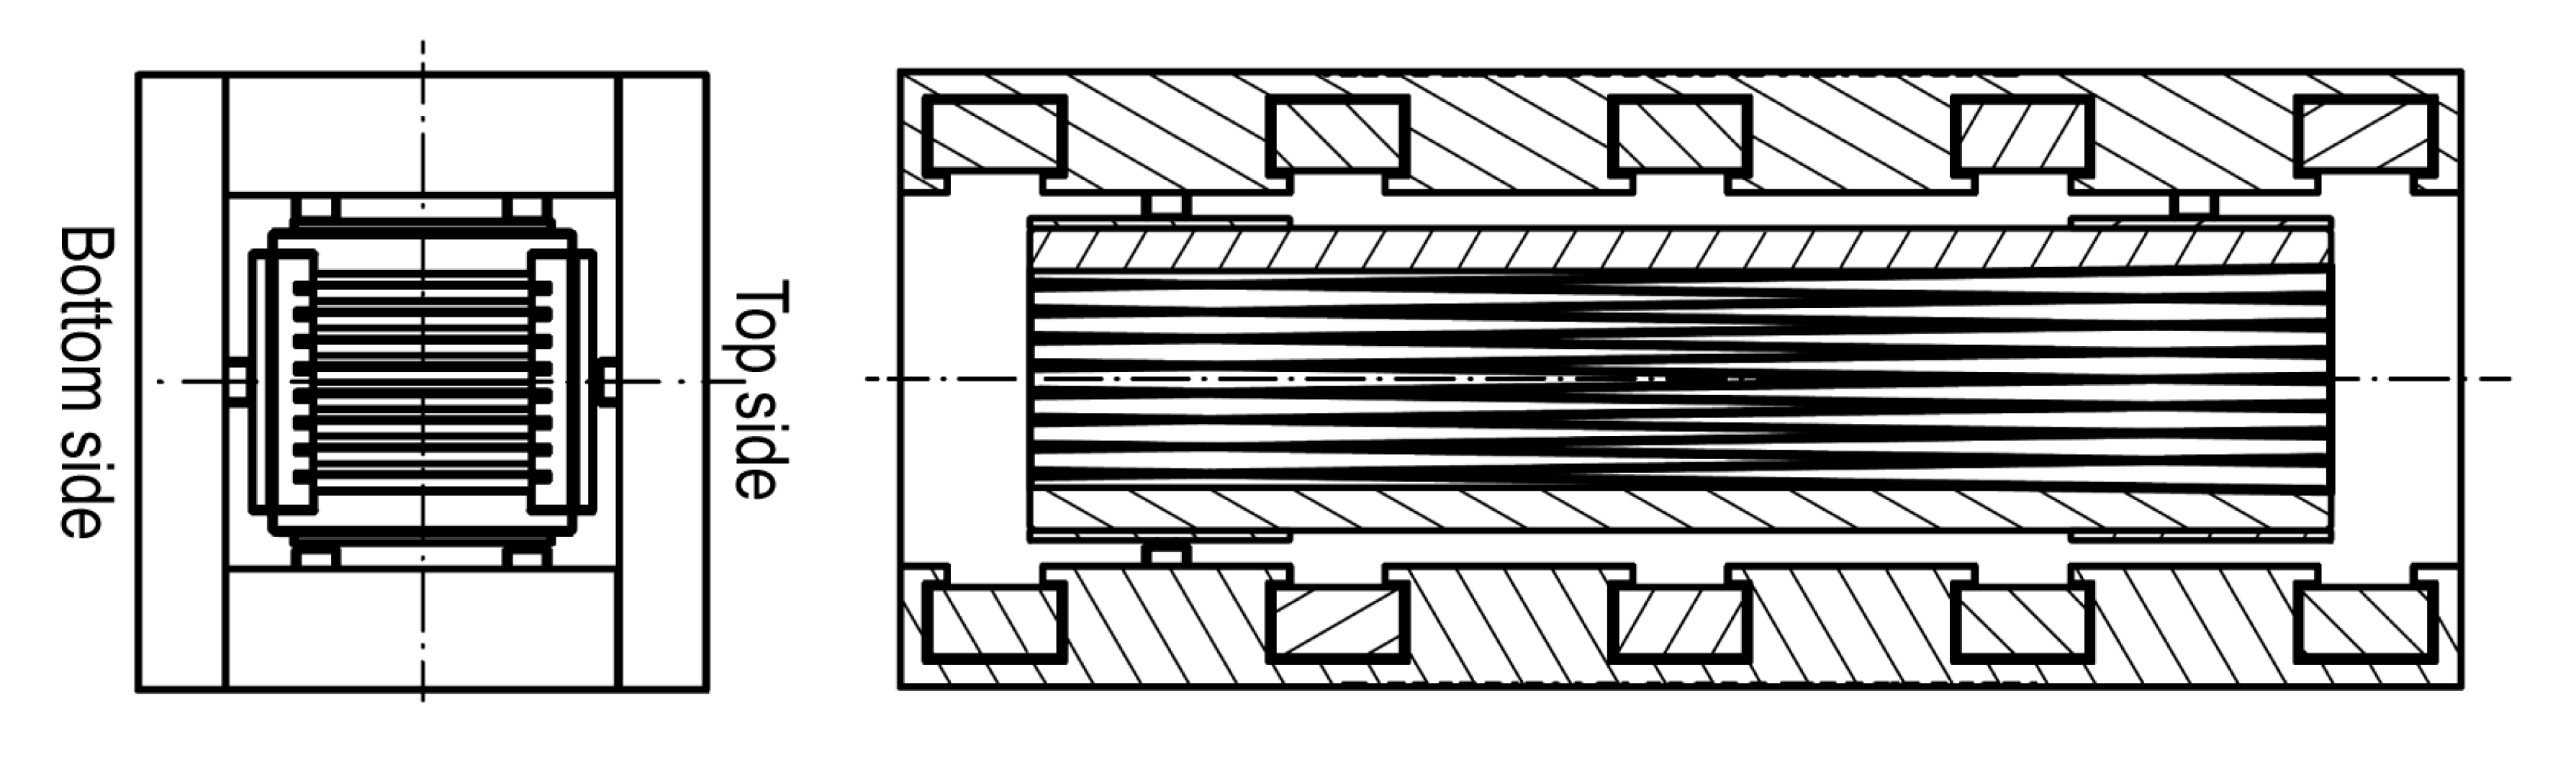
2.4. Supermirror Polarizer
2.5. Sample Preparation
3. Results and Discussion
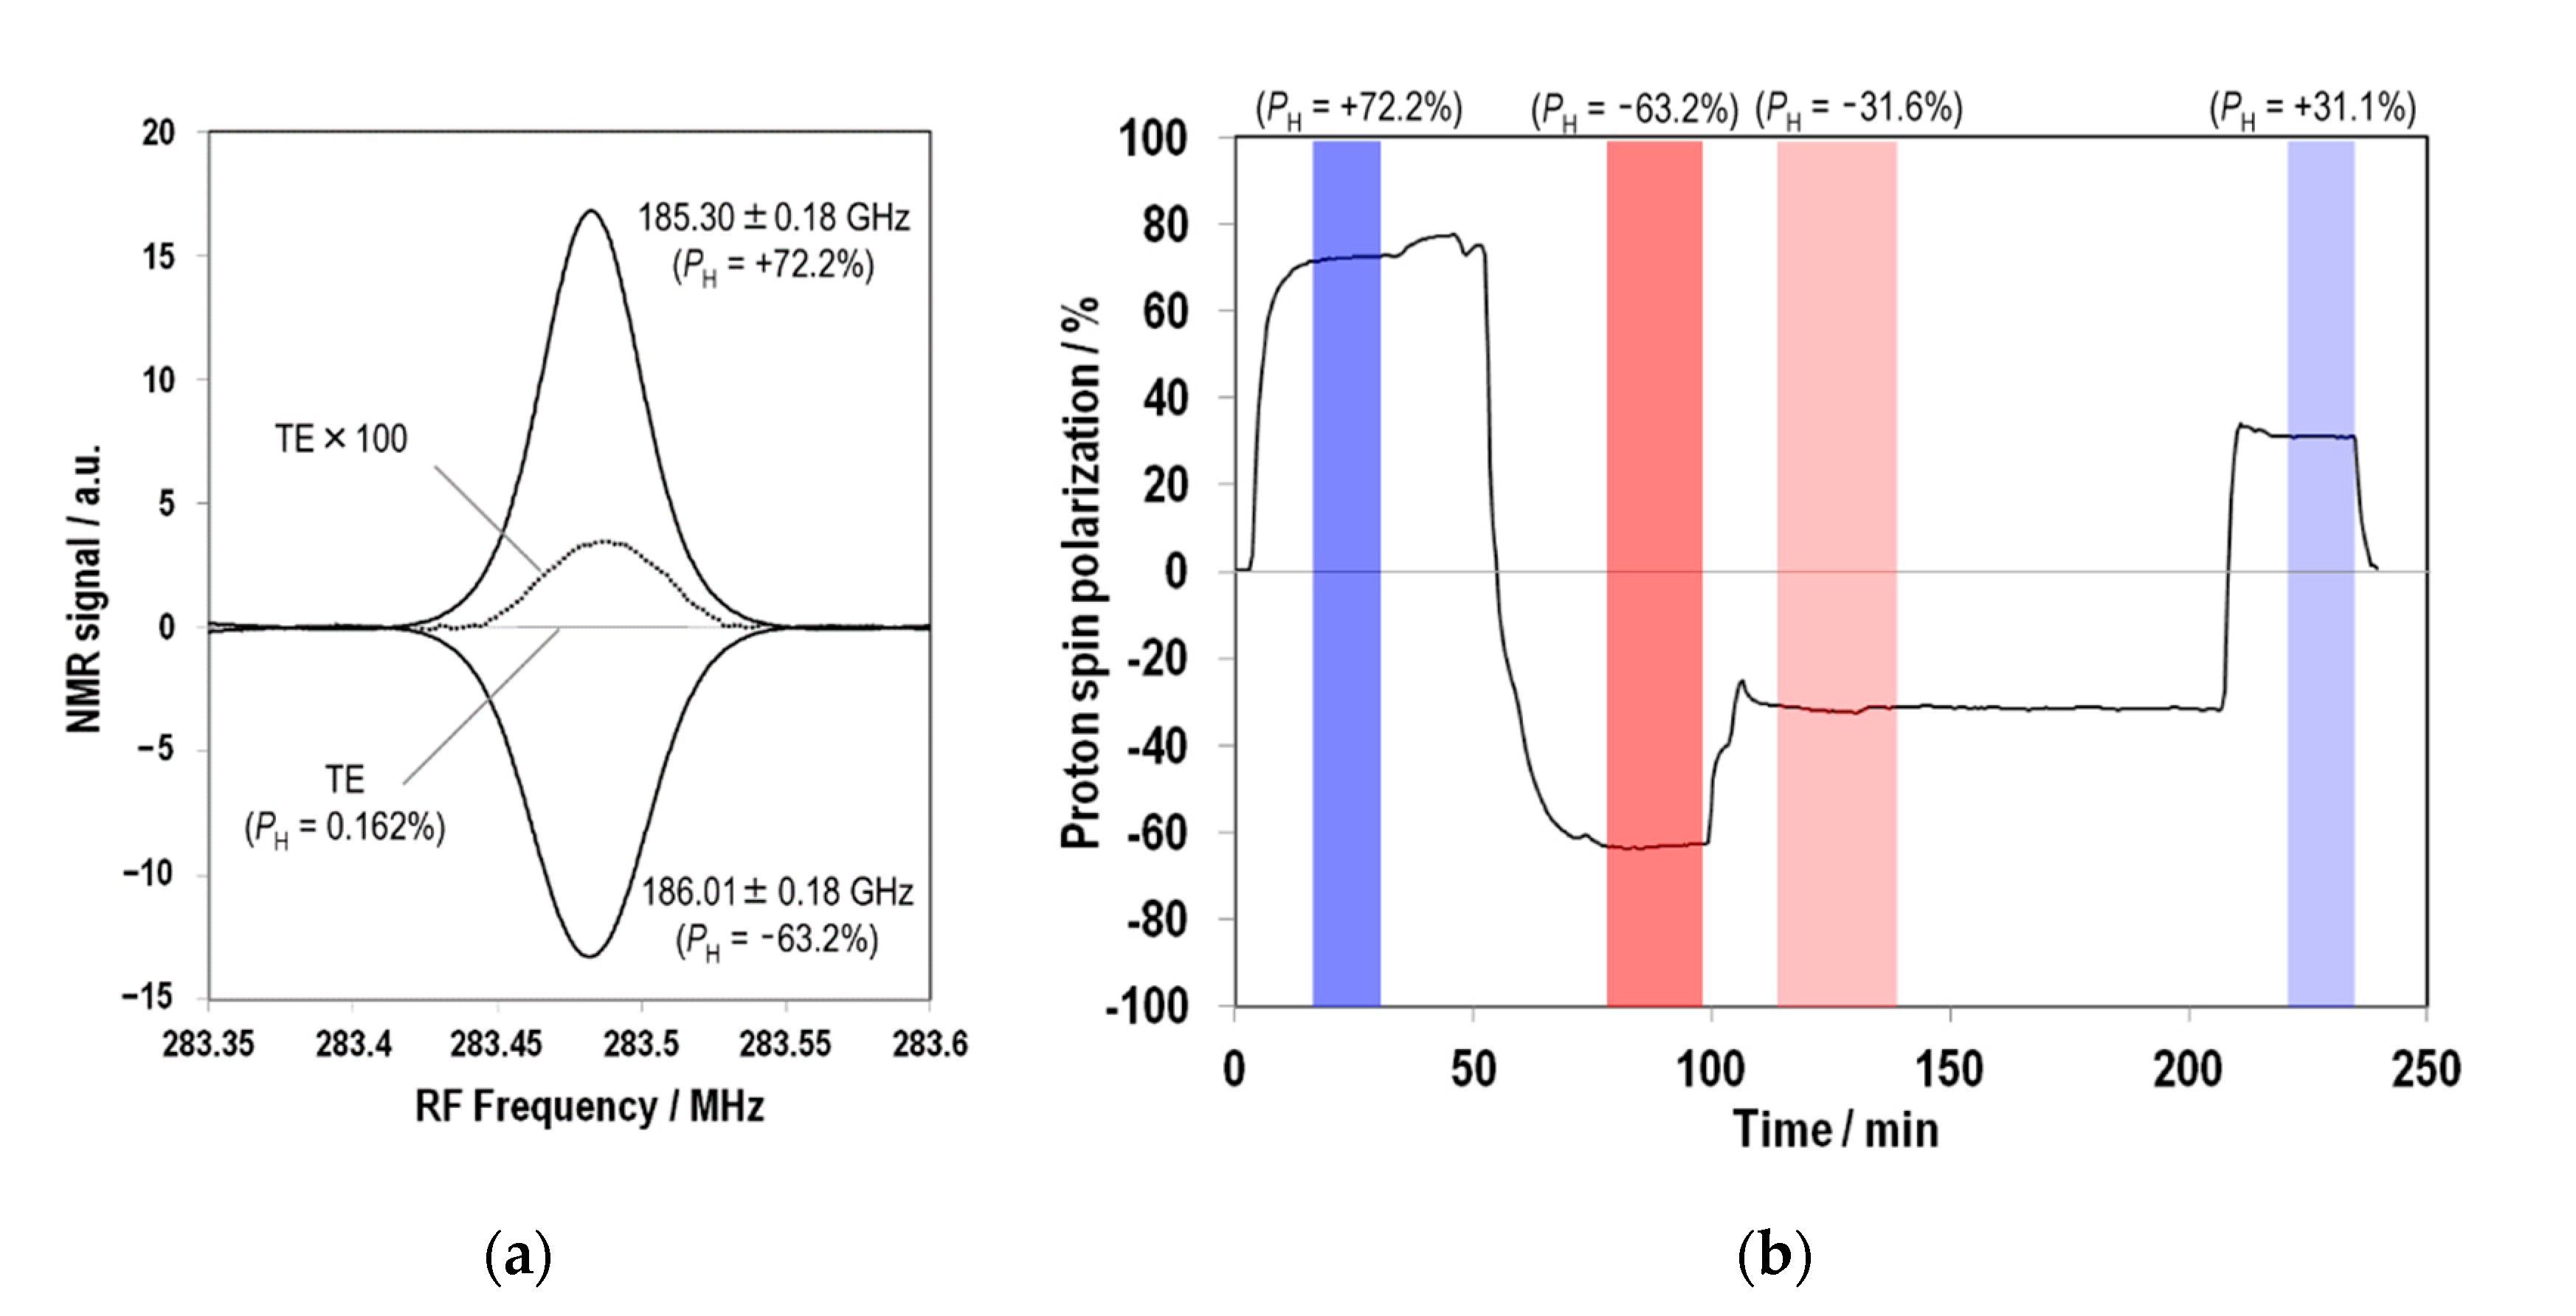
3.1. NMR Determination of PH
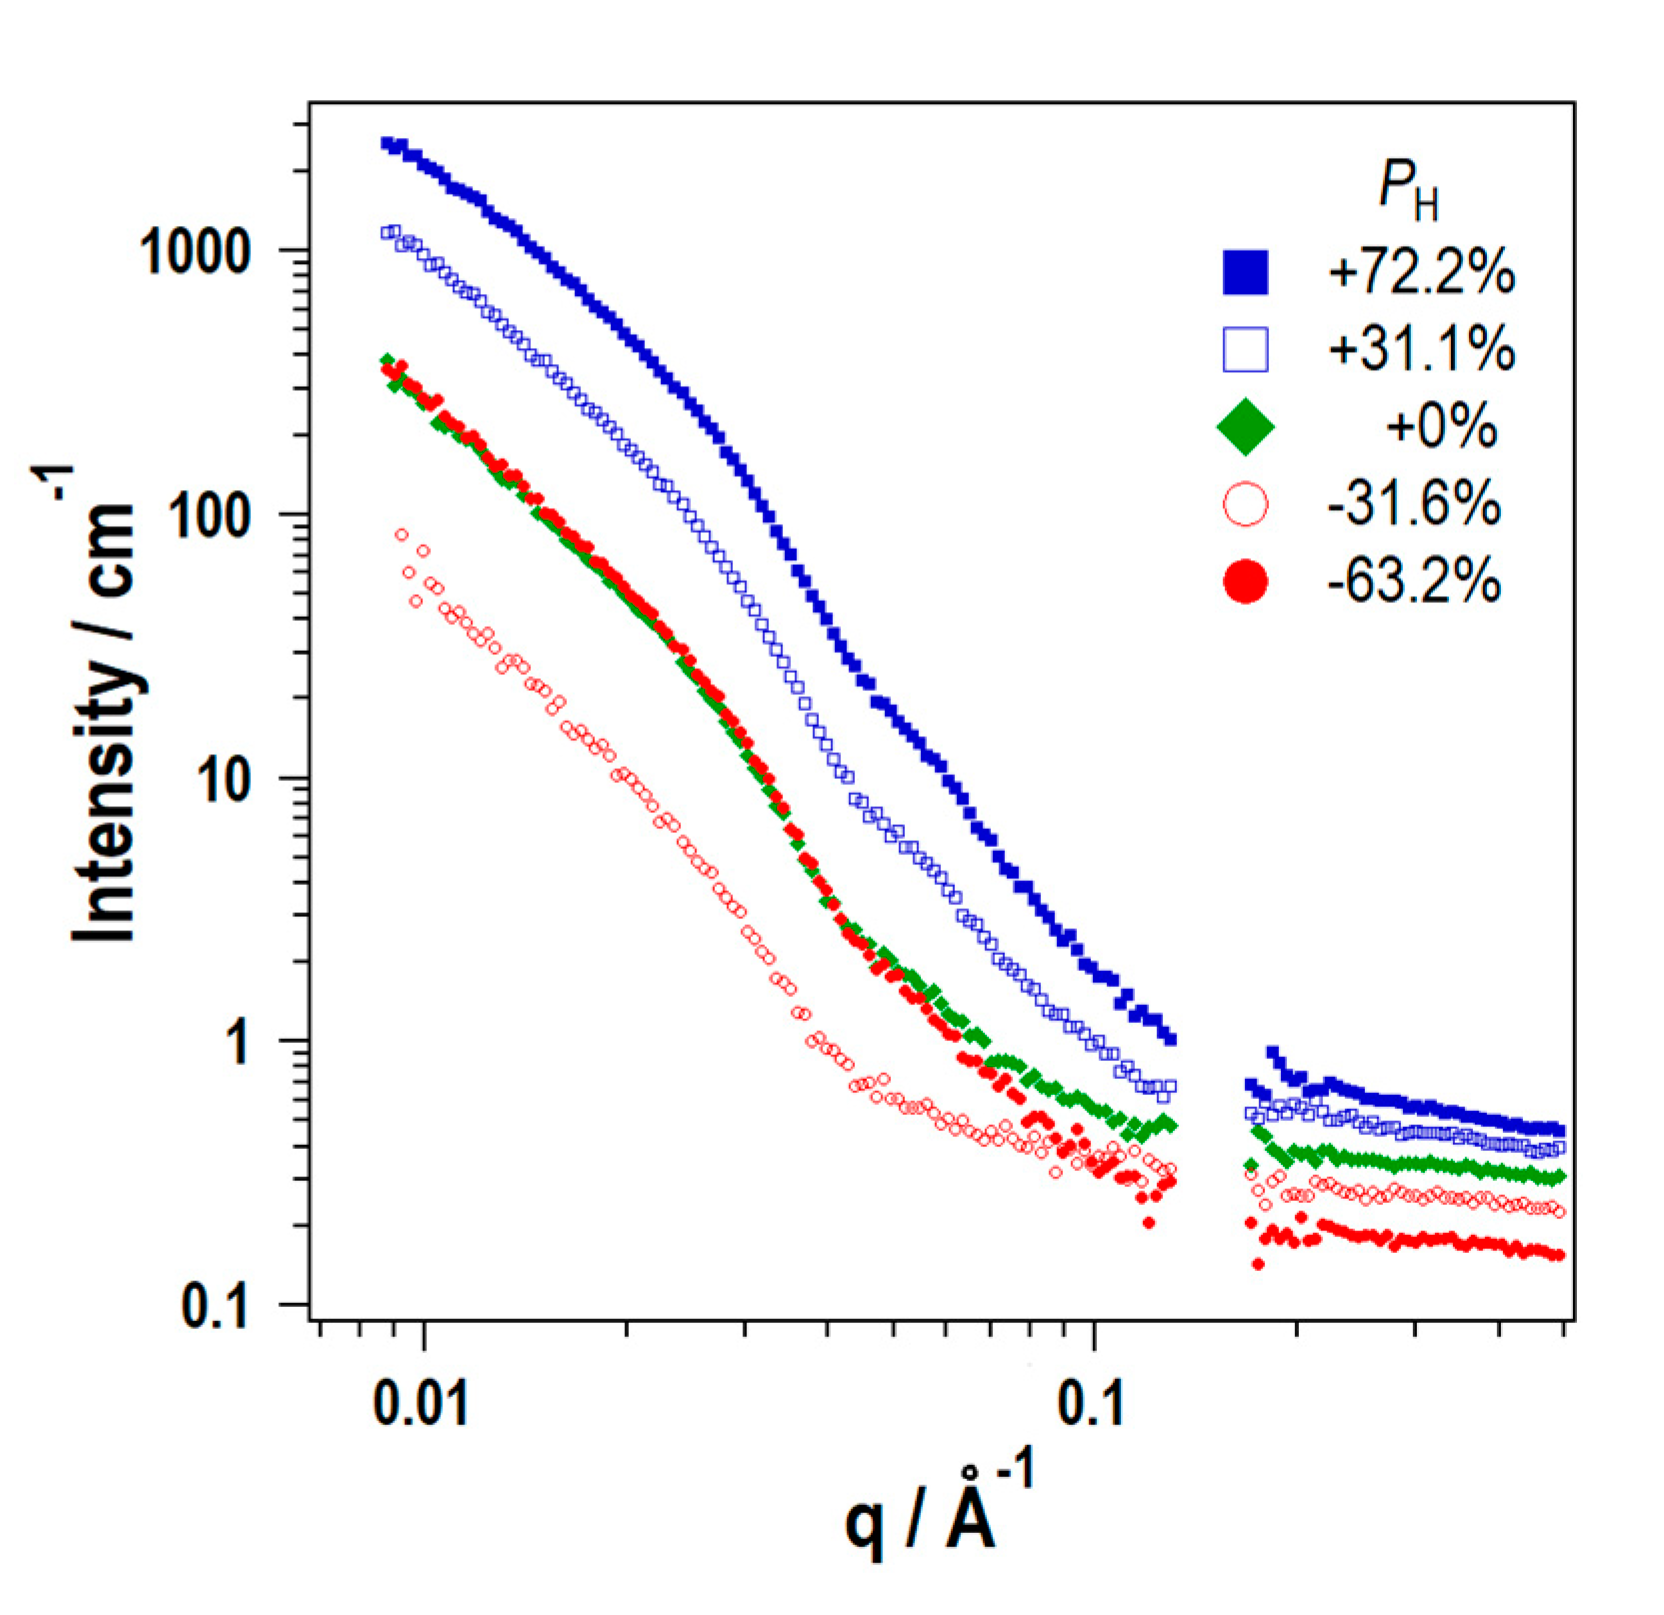
3.2. SANS Profile under DNP Condition
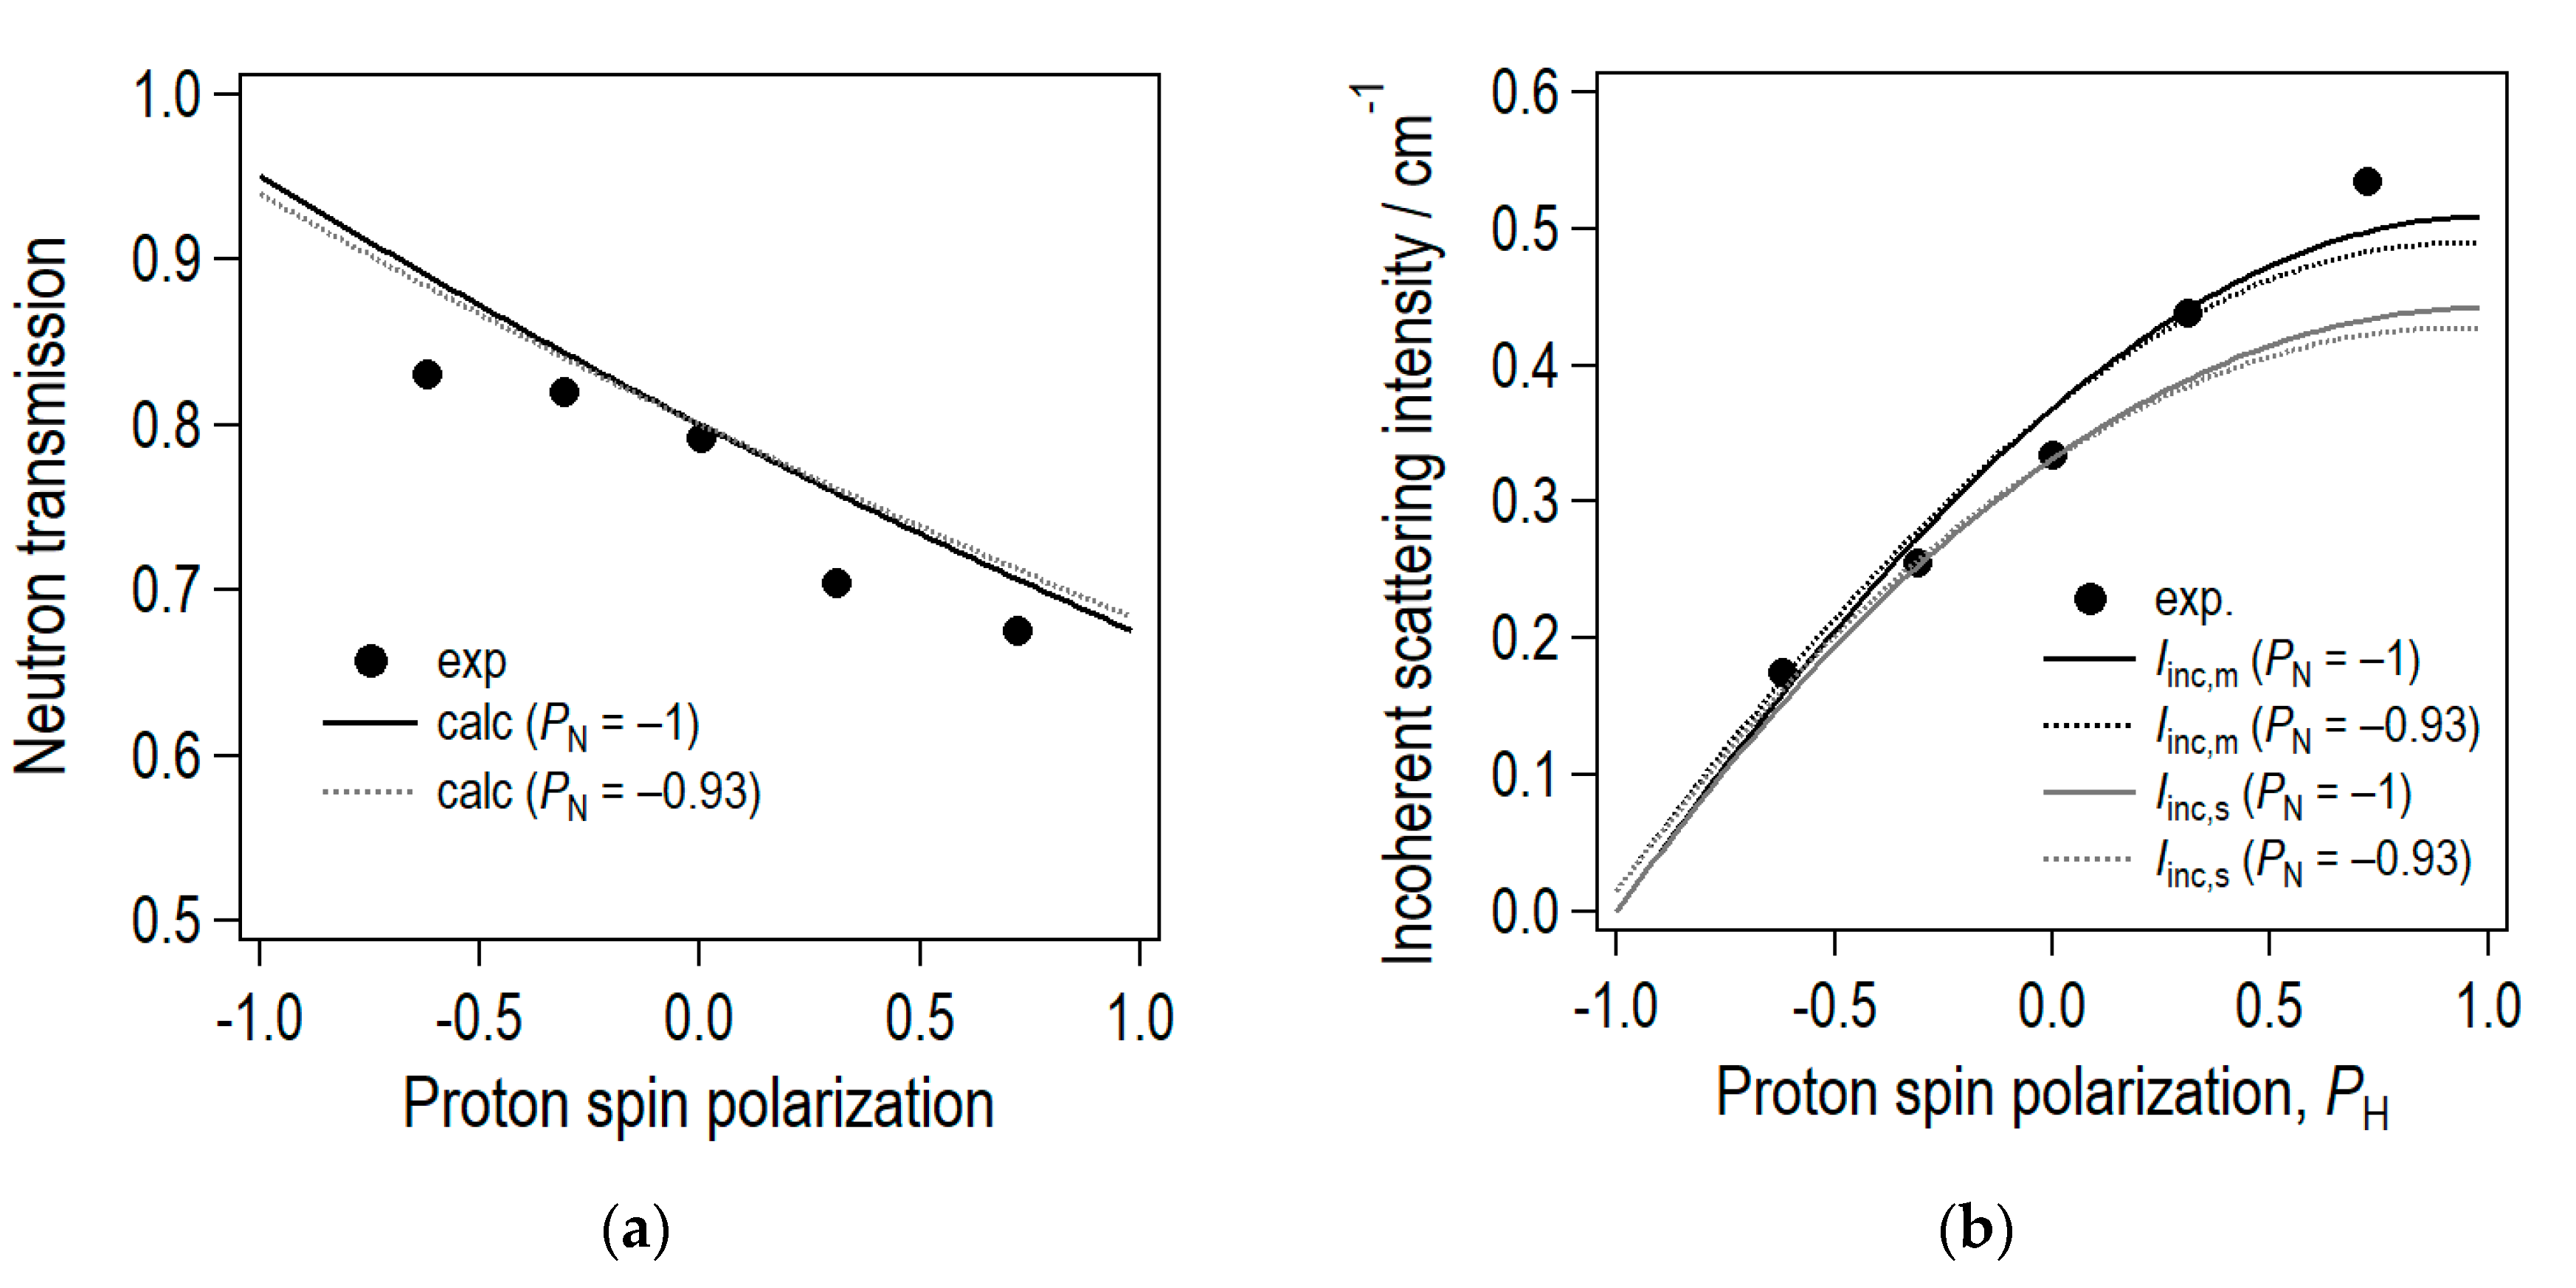
3.3. PH Dependence of Neutron Transmission
3.4. PH Dependence of Incoherent Scattering Intensity
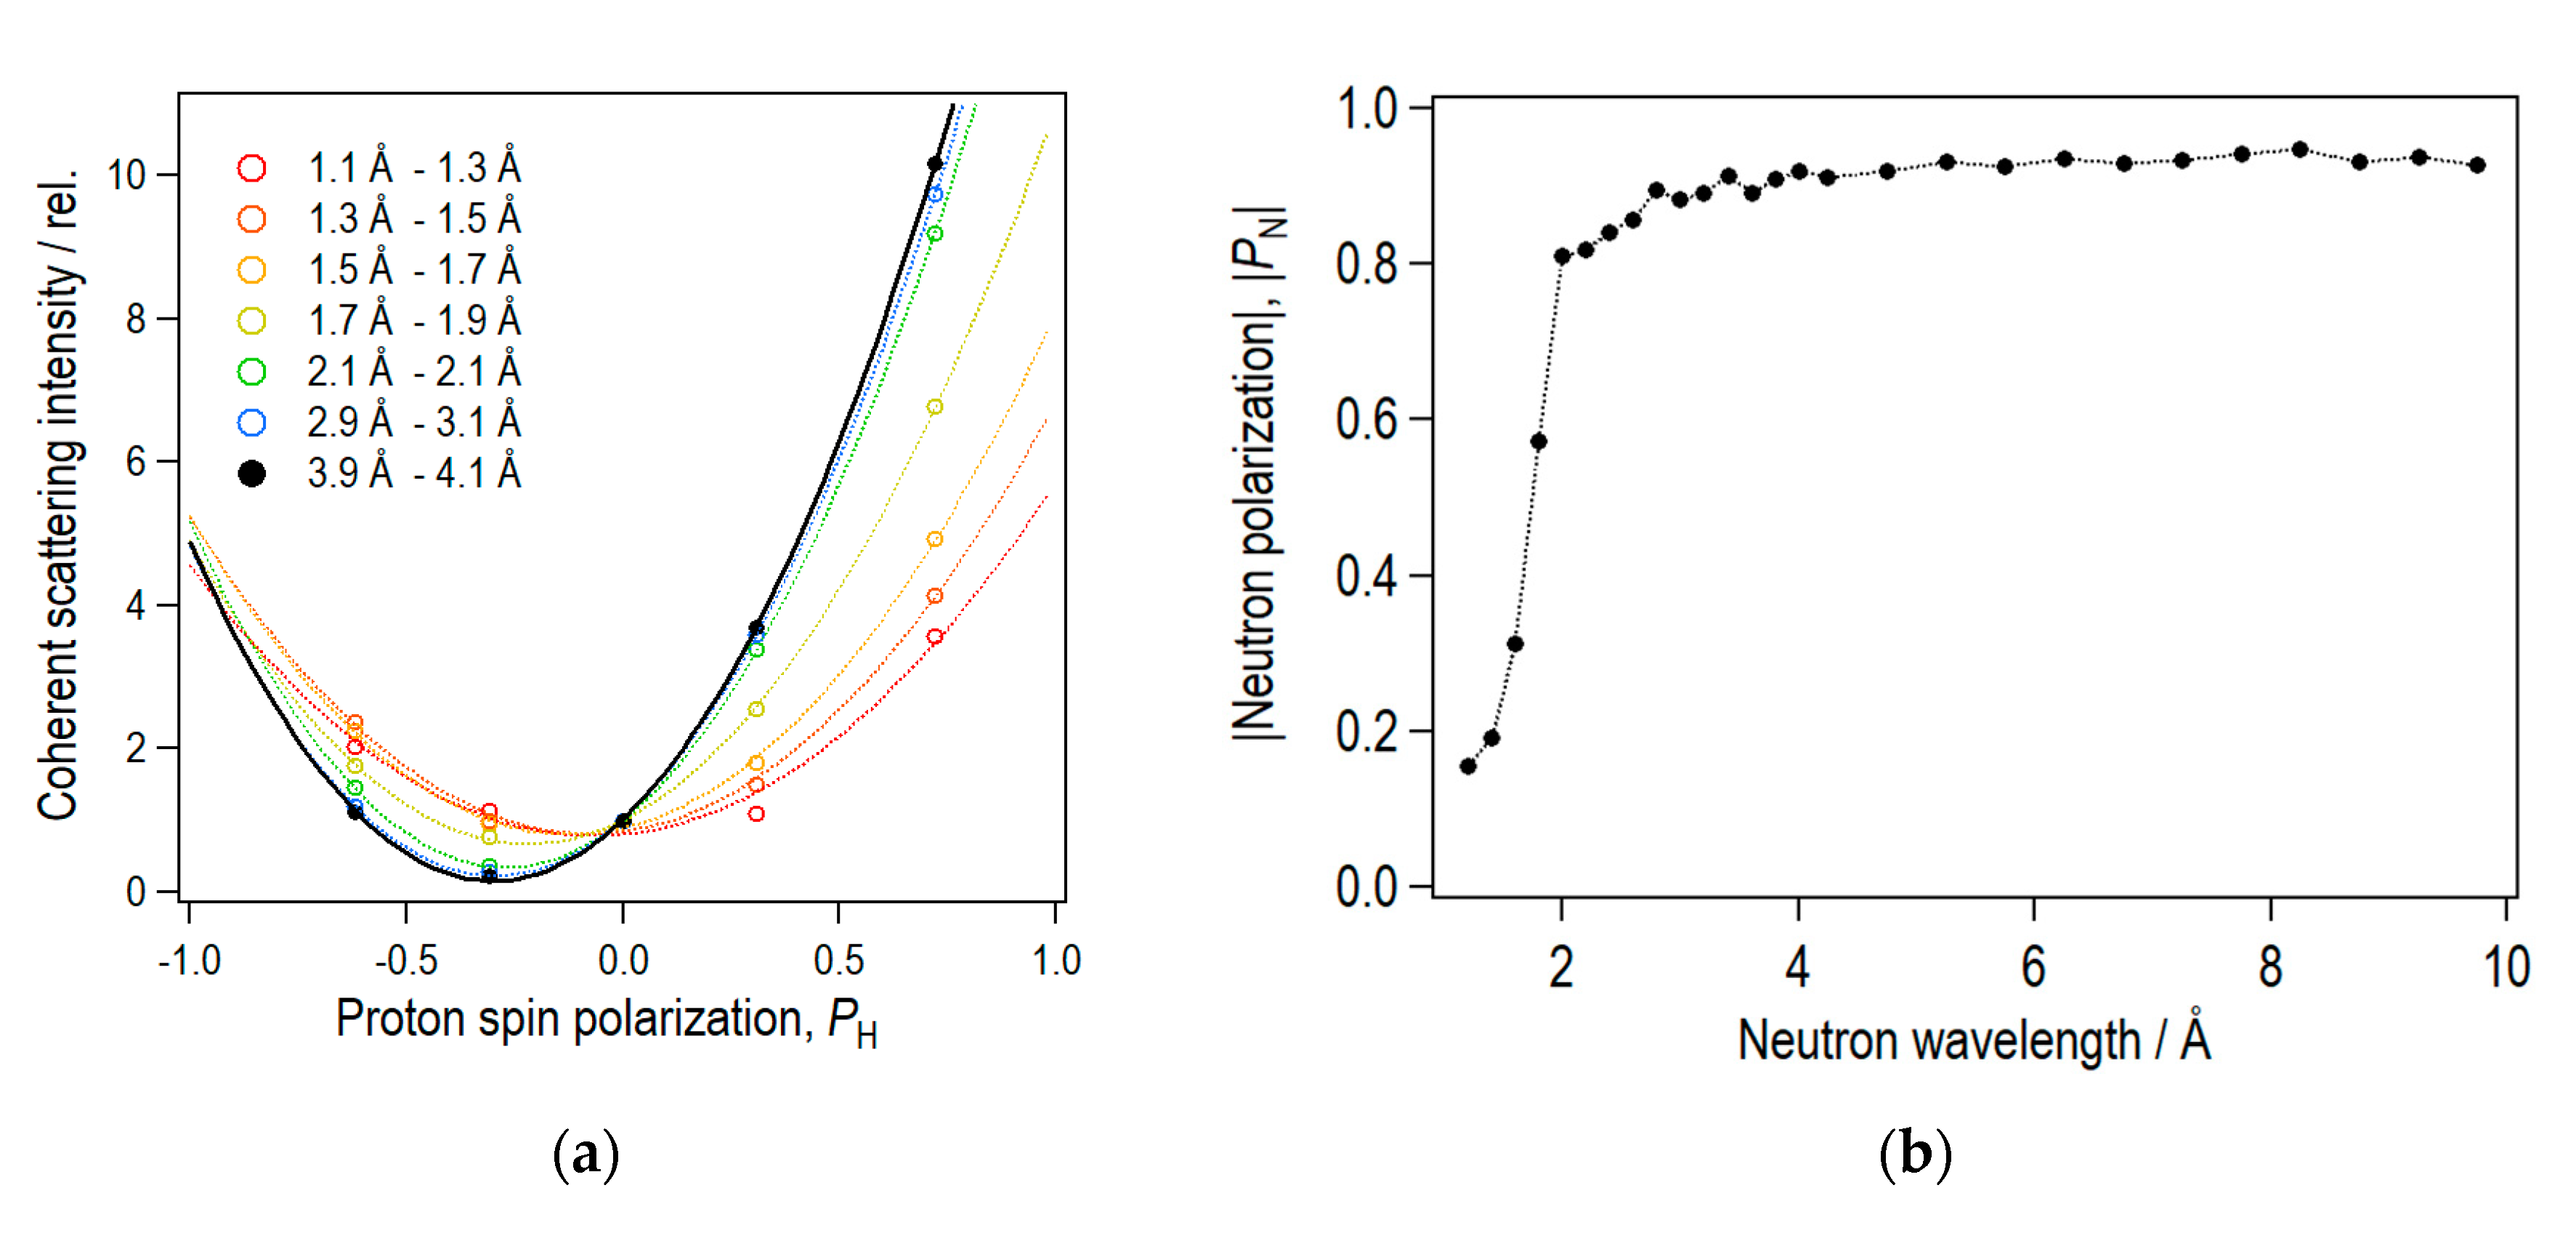
3.5. PH Dependence of Coherent Scattering Intensity and Detemination of PN
= (αA − αB)2 + 2(αA − αB)(βA − βB)PNPH + (βA − βB)2PH2.
4. Conclusions
Author Contributions
Funding
Acknowledgments
Conflicts of Interest
References
- Abragam, A.; Goldman, M. Principles of dynamic nuclear polarization. Rep. Prog. Phys. 1978, 41, 395–467. [Google Scholar] [CrossRef]
- Niinikoski, T.O. The Physics of Polarized Targets; Cambridge University Press: Cambridge, UK, 2020; pp. 155–198. [Google Scholar]
- Bunyatova, E.I. Free radicals and polarized target. Nucl. Instr. Meth. Phys. Res. A 2004, 526, 22–27. [Google Scholar] [CrossRef]
- Noda, Y.; Kumada, T.; Hashimoto, T.; Koizumi, S. Small-angle neutron scattering study of dynamically polarized polyethylenes. Physica B 2009, 404, 2572–2574. [Google Scholar] [CrossRef]
- Noda, Y.; Kumada, T.; Hashimoto, T.; Koizumi, S. Inhomogeneous dynamic nuclear polarization of protons in a lamella-forming diblock copolymer investigated by a small-angle neutron scattering method. J. Appl. Cryst. 2011, 44, 503–513. [Google Scholar] [CrossRef]
- Noda, Y.; Koizumi, S.; Masui, T.; Mashita, R.; Kishimoto, H.; Yamaguchi, D.; Kumada, T.; Takata, S.; Ohishi, K.; Suzuki, J. Contrast variation by dynamic nuclear polarization and time-of-flight small-angle neutron scattering. I. Application to industrial multi-component nanocomposites. J. Appl. Cryst. 2016, 49, 2036–2045. [Google Scholar] [CrossRef] [PubMed]
- Stuhrmann, H.B.; Schärpf, O.; Krumpolc, M.; Niinikoski, T.O.; Rieubland, M.; Rijllart, A. Dynamic nuclear polarisation of biological matter. Eur. Biophys. J. 1986, 14, 1–6. [Google Scholar] [CrossRef] [PubMed]
- Masuda, Y. Neutron scattering by inhomogeneous distribution of proton polarization produced by the dynamic nuclear polarization. Hyperfine Interact. 1987, 35, 1071–1074. [Google Scholar] [CrossRef]
- Van den Brandt, B.; Glättli, H.; Grillo, I.; Hautle, P.; Jouve, H.; Kohlbrecher, J.; Konter, J.A.; Leymarie, E.; Mango, S.; May, R.P.; et al. Time-resolved nuclear spin-dependent small-angle neutron scattering from polarized proton domains in deuterated solutions. Eur. Phys. J. B 2006, 49, 157–165. [Google Scholar]
- Kumada, T.; Noda, Y.; Hashimoto, T.; Koizumi, S. Dynamic nuclear polarization system for the SANS-J-II spectrometer at JAEA. Physica B 2009, 404, 2637–2639. [Google Scholar] [CrossRef]
- Noda, Y.; Koizumi, S. Dynamic nuclear polarization apparatus for contrast variation neutron scattering experiments on iMATERIA spectrometer at J-PARC. Nucl. Instr. Meth. Phys. Res. A 2019, 923, 127–133. [Google Scholar] [CrossRef]
- Ishigaki, T.; Hoshikawa, A.; Yonemura, M.; Morishima, T.; Kamiyama, T.; Oishi, R.; Aizawa, K.; Sakuma, T.; Tomota, Y.; Arai, M.; et al. IBARAKI materials design diffractometer (iMATERIA)—Versatile neutron diffractometer at J-PARC. Nucl. Instr. Meth. Phys. Res. A 2009, 600, 189–191. [Google Scholar] [CrossRef]
- Takada, H.; Haga, K.; Teshigawara, M.; Aso, T.; Meigo, S.; Kogawa, H.; Naoe, T.; Wakui, T.; Ooi, M.; Harada, M.; et al. Materials and Life Science Experimental Facility at the Japan Proton Accelerator Research Complex I: Pulsed Spallation Neutron Source. Quantum Beam Sci. 2017, 1, 8. [Google Scholar] [CrossRef]
- Nakajima, K.; Kawakita, Y.; Itoh, S.; Abe, J.; Aizawa, K.; Aoki, H.; Endo, H.; Fujita, M.; Funakoshi, K.; Gong, W.; et al. Materials and Life Science Experimental Facility (MLF) at the Japan Proton Accelerator Research Complex II: Neutron Scattering Instruments. Quantum Beam Sci. 2017, 1, 9. [Google Scholar] [CrossRef]
- Sakasai, K.; Satoh, S.; Seya, T.; Nakamura, T.; Toh, K.; Yamagishi, H.; Soyama, K.; Yamazaki, D.; Maruyama, R.; Oku, T.; et al. Materials and Life Science Experimental Facility at the Japan Proton Accelerator Research Complex III: Neutron Devices and Computational and Sample Environments. Quantum Beam Sci. 2017, 1, 10. [Google Scholar] [CrossRef]
- International Commission on Non-Ionizing Radiation Protection. Guidelines on limits of exposure to static magnetic field. Health Phys. 2009, 96, 504–514. [Google Scholar] [CrossRef] [PubMed]
- Shinohara, T.; Suzuki, J.; Oku, T.; Takata, S.; Kira, H.; Suzuya, K.; Aizawa, K.; Arai, M.; Otomo, T.; Sugiyama, M. Design of a neutron polarizer using polarizing super mirror for the TOF-SANS instrument at the J-PARC. Physica B 2009, 404, 2640–2642. [Google Scholar] [CrossRef]
- Shinohara, T.; Hiroi, K.; Su, Y.; Kai, T.; Nakatani, T.; Oikawa, K.; Segawa, M.; Hayashida, H.; Parker, J.D.; Matsumoto, Y.; et al. Polarization analysis for magnetic field imaging at RADEN in J-PARC/MLF. Phys. Conf. Ser. 2017, 862, 012025. [Google Scholar] [CrossRef]
- Sears, V.F. Neutron scattering lengths and cross sections. Neutron News 1992, 3, 26–37. [Google Scholar]
- Shibayama, M.; Nagao, M.; Okabe, S.; Karino, T. Evaluation of incoherent neutron scattering from softmatter. J. Phys. Soc. Jpn. 2005, 74, 2728–2736. [Google Scholar] [CrossRef]
- Glättli, H.; Goldman, M. 21. Nuclear Magnetism. Methods Exp. Phys. 1987, 23C, 241–286. [Google Scholar]


| Component | SBR | Silica | Plasticizer Oil | Silane-Coupling Agent | Organic Accelerators | Sulfur |
|---|---|---|---|---|---|---|
| Volume fraction/% | 64.7 | 15.5 | 15.1 | 2.3 | 1.8 | 0.46 |
© 2020 by the authors. Licensee MDPI, Basel, Switzerland. This article is an open access article distributed under the terms and conditions of the Creative Commons Attribution (CC BY) license (http://creativecommons.org/licenses/by/4.0/).
Share and Cite
Noda, Y.; Maeda, T.; Oku, T.; Koizumi, S.; Masui, T.; Kishimoto, H. First Experiment of Spin Contrast Variation Small-Angle Neutron Scattering on the iMATERIA Instrument at J-PARC. Quantum Beam Sci. 2020, 4, 33. https://doi.org/10.3390/qubs4040033
Noda Y, Maeda T, Oku T, Koizumi S, Masui T, Kishimoto H. First Experiment of Spin Contrast Variation Small-Angle Neutron Scattering on the iMATERIA Instrument at J-PARC. Quantum Beam Science. 2020; 4(4):33. https://doi.org/10.3390/qubs4040033
Chicago/Turabian StyleNoda, Yohei, Tomoki Maeda, Takayuki Oku, Satoshi Koizumi, Tomomi Masui, and Hiroyuki Kishimoto. 2020. "First Experiment of Spin Contrast Variation Small-Angle Neutron Scattering on the iMATERIA Instrument at J-PARC" Quantum Beam Science 4, no. 4: 33. https://doi.org/10.3390/qubs4040033
APA StyleNoda, Y., Maeda, T., Oku, T., Koizumi, S., Masui, T., & Kishimoto, H. (2020). First Experiment of Spin Contrast Variation Small-Angle Neutron Scattering on the iMATERIA Instrument at J-PARC. Quantum Beam Science, 4(4), 33. https://doi.org/10.3390/qubs4040033