Abstract
Mechanical loading scenarios, comparable to a deep rolling process, were reproduced in static indentation experiments on AISI 4140H steel samples with a cylindrical deep rolling tool and investigated in situ with synchrotron radiation at the European Synchrotron Radiation Facility (ESRF) on beamline ID11. Through the use of spatially resolved diffraction data, two-dimensional (2D) equivalent von Mises stress maps were recorded during loading and after unloading. The material modifications were analyzed in the material below the contact zone for different loading conditions. It was demonstrated that the characteristics of internal material load and residual stress distributions can be evaluated through data fitting and the effect of the applied force could be linked to the stress fields by an empirical model. The experimental values were then compared to a contact mechanics approach in order to analyze the correlation between the theoretical maximum loading stresses and the stored elastic residual stresses remaining by considering the dissipation of a certain amount of energy through plastic deformation.
1. Introduction
It is well-known that the increased compressive residual stress in the near surface region of a deep rolled material increases the fatigue resistance of a machined part, as investigated by Kloos and Adelmann [1] with dynamic strength tests. Knowledge of the interdependence between externally applied force, as well as the contact geometry and the resulting residual stress state, enables achieving a manufacturing target and the improvement of the components’ service properties, as analyzed by Scholtes and Macherauch [2] with local fatigue strength concepts and Schulze [3] for different mechanical processes. In order to reach this aim, it is essential to analyze the transient material state leading to the remaining observed material modifications. Synchrotron radiation has been shown to be a useful tool for determining material modifications through diffraction analysis, which has also been used by Scholtes and Macherauch [2] for material state evaluation as large penetration depths at high photon energy and high brilliance allow the rapid acquisition of data. The different methods are well indicated for in situ analysis of the material state, for example, through the width of a processed sample in transmission geometry without interfering with the analyzed material itself, as it is the case when sensors are embedded into the target material as done by Dumstorff and Lang [4]. In situ X-ray diffraction investigations during a manufacturing process have already been performed by Uhlmann et al. [5] using synchrotron radiation along multiple measurement positions for an orthogonal cutting process. These experiments were performed in transmission geometry and followed the local strain and stress development around the contact zone of the cutting tool, as well as the evolution of texture in the machined sample.
In this study, mechanical loading scenarios, comparable to a deep rolling process, were reproduced in static indentation experiments on quenched and tempered AISI 4140H steel samples with a cylindrical deep rolling tool. Initial findings for the stress fields at a single contact force were reported by Meyer et al. [6]. Previous work concentrated on establishing the analysis method for the stresses and categorizing the extended strain fields in the material. This led to an interest in concentrating further on specific components during force application, such as the equivalent loading stress distribution and residual stresses in direction parallel to the surface, as shown by Meyer et al. [7]. Measurements with high spatial resolution were performed in situ during and after loading using synchrotron radiation at the European Synchrotron Radiation Facility (ESRF) on beamline ID11. The evaluation of strain and stress state was achieved after azimuthal integration of diffraction frames at each measured position. Through the use of determined 2D stress maps, the material modifications could be analyzed below the contact zone for different loading conditions with the aim of establishing a connection between internal material loads and resulting residual stress state. Furthermore, an elastic contact mechanics approach was applied in order to analyze the correlation between the theoretical maximum loading stresses and the remaining stored elastic residual stresses.
2. Materials and Methods
The experiments were performed with specimens of 42CrMo4 steel (AISI 4140H) of 2.8 mm thickness, 20 mm height, and 80 mm length. In Table 1 the chemical composition is shown. They were quenched to 60 °C in oil after soaking for 2 h at 850 °C and finally tempered at 400 °C for 4 h (504 HV1 (QT)), with a yield strength of 1440 MPa and UTS at 1570 MPA. After heat treatment, the samples were electrochemically polished (100 µm of each side) to remove any influence from previous machining and the oxidation layer.

Table 1.
Chemical composition in mass% of steel AISI 4140H (EN 42CrMo4).
The in situ experiments were performed with a custom-built deep rolling device mounted in Beamline ID11 EH1 at ESRF by using a monochromatic beam of 100 keV photon energy with a beamsize of 50 × 50 µm. Measurements in transmission geometry were performed by using a 2D CCD camera of type FReLoN 2k, with system characteristics as reported by Labyche et al. [8]. The deep rolling frame was designed with a high stiffness frame, a linear motor drive with a sample clamping and a modified hydrostatic deep rolling tool (cylinder) from Ecoroll AG, Celle, Germany at fixed position. With this experimental setup, the uniformly loaded and deformed region below the cylindrical tool was scanned by moving the whole frame on a x-, y-, z-table of the diffractometer, as seen in Figure 1a. The 2D strain fields were reconstructed from the area of 4 × 4 mm2 around the contact point. Measurement positions were distributed in this area with a spatial resolution up to 50 µm. A “full-field” measurement consisted of complete, symmetrical scans to both sides of the contact point with up to 960 points, whereas for most measurements the symmetric properties of the strain fields were taken into account and only a “half-field” measurement was done on one-half of the strain field, consisting of 440 points. The experimental setup is shown in Figure 1b.
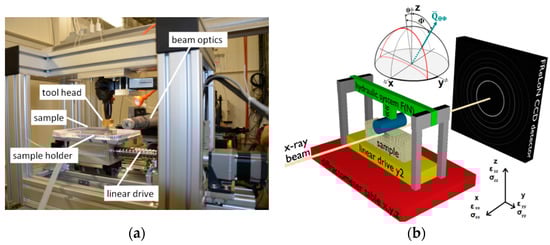
Figure 1.
Deep rolling frame mounted in beamline ID11 in (a) frontal view (detector side) and (b) sketch of the experimental setup and scanning geometry [6,7].
The tungsten-carbide rolling cylinder (width 15 mm, diameter 13 mm) was applied to the sample surface through the hydrostatic system with five loading pressures 200, 250, 300, 350, and 400 bar (resulting in a contact force of 2000, 2500, 3000, 3400, and 3900 N with an error of ±100 N), without sample or tool movement (quasi-static indentation). In the resulting full-field and half-field 2D strain and stress maps, the contact point is located at (y = 0, z = 0).
3. Theoretical Approach and Analysis
Strain was analyzed from the diffraction ring of the residual martensitic microstructure {211}-reflection, after radial transformation and azimuthal integration of the images through pyFAI software, programmed and optimized for this data type by Ashiotis et al. [9]. The azimuthally integrated values of 36 segments of 10° width were fitted through the fundamental equation for X-ray strain determination in the Debye–Scherrer method as used by Zeilinger et al. [10] for transmission experiments with nanoindentation in order to determine the different strain components.
This equation with the average diffraction angle of the {211}-reflection of the material, at an angle of around θ = 3.025°, and the azimuthal angle of a segment on the Debye–Scherrer diffraction ring, gives the strain components. Since contact is established along the whole width of the material, the material under contact is mainly in a plane strain state except negligible contributions of plane stress state at the surface boundary. With this, several strain components can be assumed zero, i.e., εxx = 0, εxz = 0, and εxy = 0. The approach is comparable to the orthogonal cutting setup and the strain state confirmed through FEM-simulation by Uhlmann et al. [5] for a similar transmission geometry. Thus, for further analysis the fundamental equation was reduced to Equation (1):
The strains analyzed are the normal strain εzz (vertical z direction in the sample coordinate system), the longitudinal strain εyy (horizontal y direction), and a shear strain component εyz (yz direction). The strain values of the peaks were extracted with a pseudo-Voigt function. A mean error of ± 60 µm/m [µstrains] was achieved using the reduced equation at confidence interval of 95%.
Overall performance of the fitting procedure shows that the assumption of plain strain state matches well with the experimental data. In order to convert the measured strains to stresses, the isotropic stiffness tensor was applied to the calculated strain components in the defined sample coordinate system, as given by Noyan and Cohen [11].
To evaluate the combined stress state of the components for the field in loading condition, the von Mises equivalent stress was calculated for experimental and theoretical values through the following Equation (2).
It allows a comparative approach between the different stress distributions and comparison to the material properties. The shear stress component can be neglected for calculations directly under the contact point, because the only significant shear stress fields are projected at an symmetric 45° angle into the material.
For the theoretical description of the loading case, an elastic contact mechanics approach was tested by using the elastic contact mechanics formula as published by Budynas and Nisbet [12]. A line contact with a length corresponding to the sample thickness (2.8 mm) was used to determine the stress state under the contact point with the selected forces. The material parameters used were: 210 GPa Young’s modulus E (220 GPa for the X-ray elastic constants calculations [13]) and 0.28 Poisson’s ratio ν for the steel samples, and 600 GPa Young’s modulus and 0.22 Poisson’s ratio for the WC cylindrical tool with a contact length of 2.8 mm and a tool diameter of 13 mm.
4. Results and Discussion
4.1. Stress Distribution during Deep Rolling
The full field 2D maps of the stress component σeq(y,z) measured under load with 3000 N are shown in Figure 2. The result exhibits a clear mirror symmetry at the line below the contact point (y = 0). For a more in-depth discussion of the constituting stress fields in σyy, σxx, σyz, and σzz refer to the initial results from Meyer et al. [7].
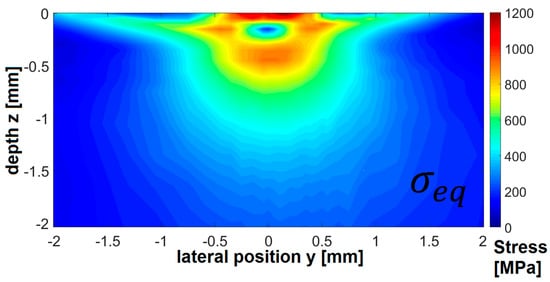
Figure 2.
Internal full stress fields below the contact point at 3000 N external force in equivalent σeq(y,z) stress.
The equivalent stress has a local minimum below the contact point followed by a local maximum in greater depth. At the contact surface, the highest stresses can be observed, as seen in Figure 2, but diffraction peak overlap with the tool complicates the analysis for this region. It has been shown that the equivalent stress distribution is dominated by the contribution of the σzz(y,z) stress component. The overall distribution is similar to the dynamic case with a moving contact point, as was measured in a previous study with this setup by Meyer et al. [7], but the residual stress generation and transition cannot be analyzed precisely without a second measurement after the contact.
The internal stress fields of σeq(y,z) during loading for the five different applied forces and with the constant contact geometry are displayed in Figure 3. This internal stress field is expected to be connected to the compressive residual stress state resulting after unloading. For increasing force, the intensity of the stress field and its distribution in depth increases, while the general shape and the local minimum under the contact point are more or less unchanged in the present range of tolerance for the determination of depth position. To compare the evolution of stress during loading and analyze the distribution characteristics, the depth profiles of σeq(y = 0,z) have been extracted up to 4.15 mm.
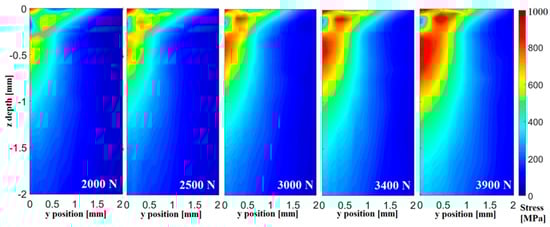
Figure 3.
Equivalent stress maps (half fields) for σeq(y,z) under load for 5 forces.
The equivalent stress starts at a high level in the contact region. This can be attributed to local plastic deformation at the contact surface. Below the surface, a local minimum is present directly under the deformed layer, followed by a maximum at a depth of about 0.4 to 0.8 mm, which decreases slowly over several millimeters in depth. Increasing applied contact force increases the maximum stress value. It can also be observed for the five applied forces that all distributions exhibit a similar slow decrease in deep regions up to maximum measurement depth at 4.15 mm, excluding the top region in the first 0.15 mm where the plastic surface deformation and the interference from tool diffraction peaks take place. The measurement window shows that stresses below the contact point already affect regions much deeper than 4 mm in this loading condition.
The detailed analysis of the stress distribution regarding the affected depth and the maximum stress values can be achieved by fitting extracted experimental curves with an optimized fit function. It was found that a variation of the probability density function of the Weibull distribution, given by Pararai et al. [14], as used in failure analysis, gives a very good approximation for the progression of the experimental data. The first increase and maximum can be fitted along with the asymmetric “tail” of the stress distribution into the material while complying with the limits . For better use with the data, a normalized distribution for the maximum value and an amplitude parameter σmax was included in Equation (3). Since α, β, and λ are not connected to physical material or process parameters, z is to be considered dimensionless.
The maximum equivalent stress , its depth position z0, as well as the width of the asymmetric function at a value of 500 MPa (W500MPa) were directly evaluated from the fit in order to determine field propagation in depth and analyze the influence of the force on these characteristic values. An example of the experimental stress distribution under load with 3000 N with the fitted function is shown in Figure 4. It can be observed that this model can achieve a very reliable fit of the stress distribution, while it should be noted that the distribution is tailored to the found stress distributions and not equally applicable to other line shapes without modification. The free fit parameters β, λ, and α are only slightly correlated to each other, which shows that the fitting function is not over parametrized, but it still allows fixing of the β-variable for one dataset during loading or after unloading, constraining the error for the extracted values.
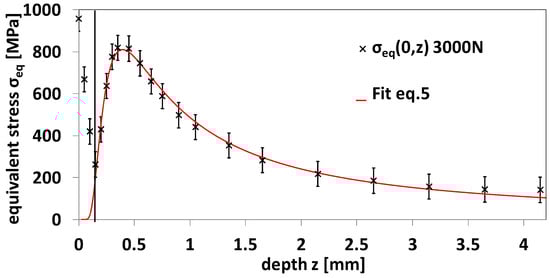
Figure 4.
Fit for experimental data of equivalent stress distribution σeq,3000N(0,z) in depth during loading.
The results gathered from this approach are shown in Table 2, where an increase in maximum equivalent stress with increasing force can be noted while the other extracted values show no clear trend. For the whole force range, fitted values have an adjusted coefficient of determination > 0.9.
Table 2.
Fit values of the internal stress distribution σeq(0,z) for Equation (3) during loading.
In comparison, if the force is increased by 95(±7)%, an increase of 54(±10)% is achieved in maximum equivalent stress. For the width of the distribution in depth, an increase can be detected, which agrees with theoretical predictions. The setup, however, is not sensitive enough to show if the maximum position also shifts deeper at higher loads, as predicted. The correlation between applied force and maximum stress or peak width is shown in Figure 5a,b. Exemplary √F fit functions were added since this parameter was found to be universal for the values from elastic theory calculations.
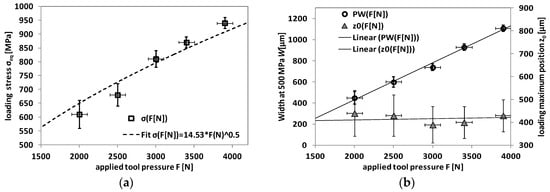
Figure 5.
(a) Equivalent stress maximum over applied force F[N] and (b) width of fit function over applied force F[N] for internal equivalent stresses during loading.
4.2. Stress State after Unloading
The same procedure for obtaining 2D stress maps as used under load has been applied after removing the load, and the results are presented in Figure 6. For the field after unloading, the residual stresses are still concentrated around the contact point with different distributions for each principal stress component. The top layers (about 0.2 mm) present unexpected stress distributions with laterally constant values for longitudinal, transversal, and normal stress components, where no processing took place. In the region of plastic deformation, due to the roller contact, a “cavity-like” shape of this abnormality can also be distinguished. This is attributed to a surface anomaly that can originate from a non-parallelism of the sample surface and of the X-ray beam in thickness direction, which results in different z heights along the thickness of the sample, or from a shift of the sample surface in the z direction. These effects lead to pseudo stress values in σyy, σxx, and σzz, but not the σyz component, due to a geometrical shift of the center of gravity of the diffracting volume. These top layers, therefore, need to be neglected in the evaluation of the results. In Figure 6, a compressive stress of the σyy component is found with a radial distribution around the contact point (about 2 mm around the center point), where maxima appear in the plastically displaced material to each side, whereas directly below the contact point, lower compressive stresses are generated and compensated with tensile stresses of around 30 MPa in depth.
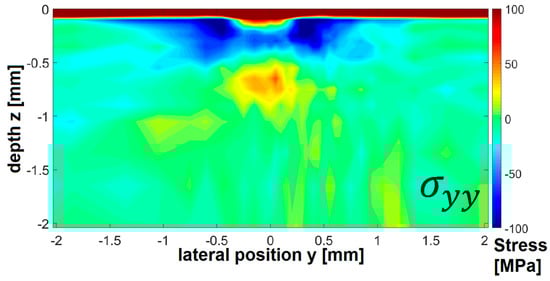
Figure 6.
Internal full residual stress fields below the contact point after unloading of 3000 N external force in equivalent σyy(y,z).
Figure 7 presents the measured 2D half-field stress maps of the stress component σyy after unloading for the same five loading forces as given in Figure 4. The region with high compressive residual stress at the side of the contact point grows continuously with increasing applied force, as well as the level of compressive stresses.
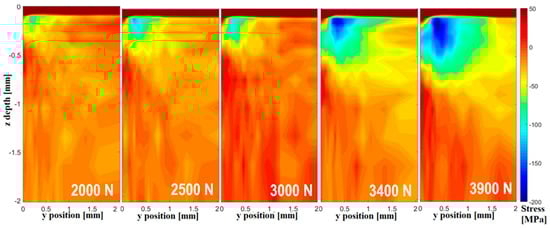
Figure 7.
Longitudinal residual stress maps (half fields) for σyy(y,z) after unloading with 5 forces.
For the residual stress field to the side of the contact point, it can be observed that the maximum of compressive residual stresses after unloading σyy,max scales with the applied force, increasing from a maximum of −80(±25) MPa for 2000 N to −190(±30) MPa at 3900 N, an increase of −130(±30)% (Table 3). These values were calculated from the average of 5 points with the highest compressive stress in the σyy(y,z) distribution.
Table 3.
Maximum values of the residual stress distribution σyy(y,z) after unloading.
The evolution of maximum residual stress is plotted as a function of the applied force in Figure 8. It is found that power law functions with a √F dependence can be used to describe the dependence of the determined characteristic values with the applied force in the considered force range which is much lower than elastic limit of the material. For higher contact forces, the power law curves would theoretically allow residual stress values higher than the elastic limit, therefore a limitation of the determined dependence to the considered force range between 2000 and 3900 N should be respected.
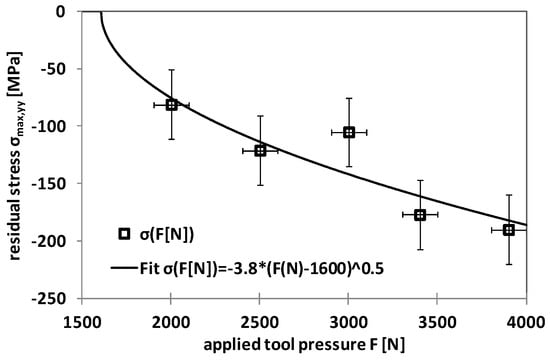
Figure 8.
Longitudinal residual stress maximum σmax,yy as a function of the applied force F[N].
4.3. Comparison of Experimental Results with Theoretical Contact Mechanics Approach
Calculations based on the formulas of the elastic Hertzian contact mechanics approach, as given by Budynas and Nisbet [12], were performed in order to evaluate the theoretical loading condition and link these to the experimental results. The theoretically calculated σyy(z), σxx(z), and σzz(z) values were again combined into an equivalent stress. This evaluation leads to a comparable stress distribution as the measured internal material stresses and can also be described by a variation of the considered function, Equation (3). It can be observed that for every applied force, the calculated elastic stress distribution is much higher than the experimental data and the theoretical maximum equivalent stress value is higher by a factor ≈2.1 as compared with the experiment, whereas the depth position of maximum stress calculated from contact mechanics approach is closer to the surface, as shown in Figure 9.
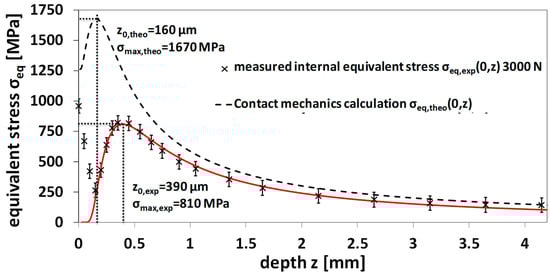
Figure 9.
Comparison of experimental data of equivalent stress distribution σeq(y,z) in depth at 3000 N load with theoretical elastic contact equivalent stress distribution.
These large differences are explained by the fully elastic approach of the contact mechanics calculation, which is a theoretical consideration, whereas, in the real case, plastic deformations take place instantaneously when the criterion for yielding is exceeded. Moreover, the measurements performed under load, therefore, reflect the plastically deformed state superimposed with applied elastic strain field, which shifts the measured stress level.
It can be seen that the maximum values from the theoretical elastic approach show an increasing difference as compared with the experimental data measured under load, which can be attributed to an increasing plastic deformation influence in the process. On the one hand, if the yield strength of the material is used as a criterion for the theoretical von Mises equivalent stress in elastic contact, a loading force of F(Mises,Yield) = 2200 N results as a threshold value to achieve a plastic deformation.
On the other hand, for the corresponding residual equivalent stresses, the √F relationship found for experimental residual stress evolution (Figure 8) can be extrapolated to lower forces and a zero intercept is reached at F(exp,Yield) = 1600 ± 400 N. At a lower applied load, no measurable residual stresses should be generated. This value is lower than the calculated theoretical limit. It can be assumed, that for the elastic-plastic deformation in the experimental case, the convex indenter shape can concentrate a higher amount of loading stress which leads to higher deformation than in the elastic calculation, where both contact surfaces flatten out in response, and therefore lead to local modifications of the contact geometry and create plastic deformation directly at the contact surface.
Keeping the limitations in mind, a comparison with theoretical Hertzian contact mechanics allows a comprehensive analysis of the relationship between a theoretical approach and in situ measured experimental values of internal material load and resulting residual stress distribution. For the measured equivalent stress during loading and the residual stress, it can be observed that the √F fits give a good approximation for the expected material behavior, close to the yield point in Figure 10a. Since a direct comparison with the theoretical approach is preferable, in Figure 10b the same values are shown as a function of the theoretical equivalent stress. In this case, a linear correlation is found for the measured loading stresses and the resulting residual stresses.
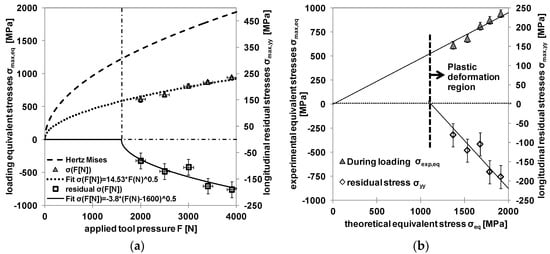
Figure 10.
Comparison of (a) experimental maximum stresses and (b) graphical representation of σeq,max(0,z) and σyy,max(y,z) over the maximum theoretical equivalent stress σeq,theo,max(0,z).
It has to be kept in mind that the relationship between internal material load and the theoretical values does not remain linear in higher force range and depends on a set of material and experimental parameters such as yield strength, ultimate strength, work hardening during plastic deformation, as well as the contact geometry.
5. Conclusions
Through the use of an in situ loading frame, detailed mappings for the material stress state in the samples were determined based on high energy synchrotron X-ray diffraction experiments. From the propagation of the in situ measured internal material stress field of steel AISI 4140H it was shown that the maximum equivalent stress and depth distribution of initiated stresses, depending on force during contact, is influenced by the applied force and can be modeled by power law functions. In the material state with a hardness of 47 HRC, the decrease of the equivalent stress field in depth was modeled with a tailored fit function, for loading condition and after unloading. It is observed that parameters extracted from the loading equivalent stresses and the achieved residual equivalent stresses are represented by power law functions, which are derived from classical elastic theory, and a clear correlation between external process parameters and internal and resulting material changes, is found. By using an equivalent stress approach, the difference between elastic values and the elasto-plastic loading equivalent stresses was shown and an increase of the plastic deformation component depending on the force was found, as expected. The determined correlations allow calculation of the achievable residual stress state or the expected internal material load in the material through a theoretical approach for a specific set of mechanical contact parameters. Considering different material properties, contact geometries, and force ranges, the development of a process parameter independent approach to predict the generated residual stresses in a deep rolling process is possible.
Author Contributions
Data curation, H.M.; Investigation, H.M. and J.E.; Project administration, J.E.; Software, H.M.; Writing—original draft, H.M.; Writing—review & editing, J.E. All authors have read and agreed to the published version of the manuscript.
Funding
This research was funded by German Research Foundation (Deutsche Forschungsgemeinschaft, DFG) project number 223500200.
Acknowledgments
The experiments were performed on beamline ID11 at the European Synchrotron Radiation Facility (ESRF), Grenoble, France. We are grateful to Jonathan Wright at the ESRF for providing assistance in using beamline ID11. We gratefully acknowledge the funding by the German Research Foundation (Deutsche Forschungsgemeinschaft, DFG) for financial support of subproject C01 within the CRC TRR 136 “Process Signatures”, project number 223500200.
Conflicts of Interest
The authors declare no conflict of interest.
References
- Kloos, K.H.; Adelmann, J. Schwingfestigkeitssteigerung durch Festwalzen. Mater. Und. Werkst. 1988, 19, 15–23. [Google Scholar] [CrossRef]
- Scholtes, B.; Macherauch, E. Auswirkungen mechanischer Randschichtverformungen auf das Festigkeitsverhalten metallischer Werkstoffe. Z. Met. 1986, 77, 322. [Google Scholar]
- Schulze, V. Modern Mechanical Surface Treatment: States, Stability, Effects; John Wiley & Sons: Hoboken, NJ, USA, 2006. [Google Scholar]
- Dumstorff, G.; Lang, W. Investigations on the Impact of Material-Integrated Sensors with the Help of FEM-Based Modeling. Sensors 2015, 15, 2336–2353. [Google Scholar] [CrossRef] [PubMed]
- Uhlmann, E.; Henze, S.; Gerstenberger, R.; Brömmelhoff, K.; Reimers, W.; Fischer, T.; Schell, N. An extended shear angle model derived from in situ strain measurements during orthogonal cutting. Prod. Eng. 2013, 7, 401–408. [Google Scholar] [CrossRef]
- Meyer, H.; Epp, J.; Zoch, H.W. In situ X-Ray Diffraction Investigation of Surface Modifications in a Deep Rolling Process under Static Condition. Mater. Res. Proc. 2017, 2, 431–436. [Google Scholar]
- Meyer, H.; Epp, J. In Situ X-ray Diffraction Analysis of Stresses during Deep Rolling of Steel. Quantum Beam Sci. 2018, 2, 20. [Google Scholar] [CrossRef]
- Labiche, J.A.C.; Segura-Puchades, J.; Van Brussel, D.; Moy, J.P. FRELON camera: Fast REadout LOw noise. ESRF Newsl. 1996, 25, 41–43. [Google Scholar]
- Ashiotis, G.; Deschildre, A.; Nawaz, Z.; Wright, J.P.; Karkoulis, D.; Picca, F.E.; Kieffer, J. The fast azimuthal integration Python library: pyFAI. J. Appl. Crystallogr. 2015, 48, 510–519. [Google Scholar] [CrossRef] [PubMed]
- Zeilinger, A.; Todt, J.; Krywka, C.; Müller, M.; Ecker, W.; Sartory, B.; Keckes, J. In-situ observation of cross-sectional microstructural changes and stress distributions in fracturing TiN thin film during nanoindentation. Sci. Rep. 2016, 6, 22670. [Google Scholar] [CrossRef] [PubMed]
- Noyan, I.C.; Cohen, J.B. Residual Stress: Measurement by Diffraction and Interpretation; Springer: Berlin/Heidelberg, Germany, 2013. [Google Scholar]
- Budynas, R.G.; Nisbett, K.J. Shigley’s Mechanical Engineering Design, 9th ed.; McGraw-Hill: New York, NY, USA, 2010. [Google Scholar]
- Eigenmann, B.; Macherauch, E. Röntgenographische Untersuchung von Spannungszuständen in Werkstoffen. Mater. Und. Werkst. 1995, 26, 148–160. [Google Scholar] [CrossRef]
- Pararai, M.; Warahena-Liyanage, G.; Oluyede, B.O. A new class of generalized inverse Weibull distribution with applications. J. Appl. Math. Bioinform. 2014, 4, 17. [Google Scholar]
© 2020 by the authors. Licensee MDPI, Basel, Switzerland. This article is an open access article distributed under the terms and conditions of the Creative Commons Attribution (CC BY) license (http://creativecommons.org/licenses/by/4.0/).