1. Introduction
The structural design of buildings is a complex task that involves the delicate balance of various parameters such as cost, safety, reliability, and performance. In addition to meeting building regulations, an optimal design should meet all of these requirements, which depends on the designer’s ability to find the right balance. Achieving an economical design is one possible outcome, but it may result in poor structural performance. Conversely, a design with excellent structural performance may come at a higher cost. Thus, the optimal solution is dependent on the designer’s experience and ability to consider and balance the key parameters in structural design. Most current design codes are mainly based on resistance and maximum interstory drift requirements, often neglecting the economic aspect and failing to assess the structural performance. For this reason, economic proposals are frequently chosen for implementation without proper consideration of the seismic performance. For this reason, it is crucial to incorporate additional parameters for a comprehensive assessment of the seismic performance of structures. A potential approach to achieve this is through the implementation of structural reliability analysis or by means of the failure probability evaluation. These parameters depend on various aspects that quantify the seismic event with respect to a performance indicator, so it is associated with different limit states of the structural system; however, it also depends on the designer’s ability toward an optimal solution.
Starting in the 70s, due to advancements in technology and computational sciences, new fields of study emerged, such as Artificial Intelligence. A very important branch of this field is optimization approaches, whose objective is to find one or several optimal solutions to a given problem. Within civil engineering, optimization can be divided into four categories: size optimization, shape optimization, topology optimization, and multi-objective optimization [
1], depending on four main elements [
2], and it is a very useful tool to maximize reliability, cost efficiency and environmental sustainability [
3]. One of the most widely used techniques in literature is genetic algorithms [
4]. They are based on the Theory of Evolution, and their operation is similar to that observed in natural selection. Firstly, a random population of possible solutions is created, which are evaluated through an objective function that evaluates various parameters and defines the solution capability. Then, the best individuals are selected from which descendants are generated, maintaining the genetic information of the best individuals. This procedure is repeated for a desired number of generations, where the creation of new and better individuals causes an optimal solution. There are numerous studies of these techniques for the design of structures under earthquakes, where most of them are based on minimizing the cost or weight of the structure but usually do not present the results obtained in detail, that is, dimensions of all structural elements, longitudinal and confinement reinforcing steel, and covering [
5,
6] while others studies try to provide more information about the structural designs but without taking into account the probability of failure [
7,
8,
9,
10,
11]. In multi-objective optimization genetic algorithms, the possible solutions are evaluated against several objective functions, and at the end, a set of efficient optimal solutions that receive the name Pareto Frontier are obtained. Commonly, in these studies, the objective functions are based on cost or weight and some parameter that defines the seismic performance of the structure, such as roof displacements or maximum interstory drifts [
12], maximizing the natural frequency of the system [
13] or minimize the collapse [
14]. Each one employed different construction systems or seismic response reduction mechanisms, obtaining different results.
Recently, various multi-objective optimization approaches have been proposed, including bat algorithm, grey wolf optimizer, flower pollination algorithm, and others [
15,
16,
17]. These algorithms were applied to optimize building structures, such as seismic design, steel frame structure design, and others [
18,
19,
20,
21]. Mergos [
22] proposed a novel optimization algorithm for the seismic design of building structures based on a flower pollination algorithm. All these studies demonstrate the potential of using AI-based optimization algorithms to efficiently and effectively optimize building structures. The results of all the studies can provide useful insights toward the design of efficient and cost-effective building structures. However, there are also some potential drawbacks that should be considered. One potential issue is the need for large amounts of data to train and validate the algorithms, which may not always be available or may be difficult to obtain. Additionally, some of the proposed algorithms may require extensive computing resources, which could limit their practical use in some settings.
Another consideration is the need for careful interpretation of the results, as optimizing for one objective may lead to trade-offs in other areas, such as increased costs or decreased performance in certain scenarios. Finally, the potential impact of the optimized design on other aspects of the building should be considered, for example, the possibility to obtain practical designs and to reduce the probability of failure of the buildings, which is the main objective of the present study. For this aim, the structural design of RC buildings located on a high seismic soft soil zone, specifically in Mexico City, is aimed to be optimized through this study. In a multi-objective approach, the probability of failure and the total cost will be estimated using advanced 3D modeling and nonlinear step-by-step analyses, with a focus on two main objectives: minimizing the cost and the probability of structural failure. A set of feasible solutions will be created using the NSGA-II procedure [
23,
24], which is one of the most used optimization algorithms by designers in determining the best structural solution while also considering other architectural requirements [
25,
26,
27,
28,
29,
30]. Practical and effective strategies for designing buildings in challenging environments are offered by this paper, providing a valuable contribution to the field of applications of artificial intelligence toward optimal design of structures under earthquakes. It is important to say that most of the studies for structural optimization rely on static loads and conventional design methods, especially for two-dimensional trusses and frames, while the presented approach is focused on NSGA-II to solve the problem by including structural reliability optimization through the control of maximum interstory drift and fragility curves via several nonlinear step-by-step seismic analysis. Moreover, the proposed approach minimizes the total costs, while in most of the studies, the weight is the parameter to be optimized. This combination enhances computational efficiency and provides a more robust solution for structural optimization.
2. Brief Description of the NSGA-II Technique
The NSGA-II technique has been widely used and modified; however, the general process consists of the following: an initial population (Pt) with N number of individuals is randomly generated, then their capacity to solve a specific problem is evaluated using 2 or more fitness functions (FF’s). Next, the population is ordered via different layers or classes called non-domination rank (irank) according to their FF values. Therefore, irank number 1 is constituted of non-dominated solutions. Later, the genetic selection operators are applied: binary tournament, crossover, and mutation in order to generate a size N offspring population (Ot) whose skills are also evaluated. The Pt and Ot populate units to form the Pt’ population of size 2 N, and again, they are classified in layers; from this moment, we know that the first layer is an approximation to the Pareto Frontier, a set of optimal or “non-dominated” solutions. Since Pt’ is of size of 2 N, the population Pt + 1 is created by taking the N best individuals from the layers contained in Pt’. In general, the first layer goes completely to Pt + 1 (elitism implementation), and then the fittest individuals (in lower irank) are taken from the following layers. If too many individuals are in the same layer, a niche technique is selected to maintain population diversity, known as crowding distance. Solutions in less crowded areas are preferred as they help maintain population diversity and spread the population more evenly over the Pareto Frontier. When Pt + 1 reaches N individuals, the number of generations is increased by one, and Pt + 1 now becomes Pt, and the use of genetic selection operators are used to obtain Pt + 1, evaluate their FF, and classify them. This procedure is repeated until it reaches the number of desired generations. Additionally, the algorithm is executed several times to guarantee the best individuals in the Pareto Frontier.
Despite being a method that is more than two decades old, it promises optimal solutions in any field of study. In the case of its recent application in structural engineering, it was applied in the structural design of cross-laminated timber-concrete composite floors optimizing thickness, weight and cost [
31], as well in the design of BRB’s-reinforced concrete tridimensional frames minimizing a maximum interstory drift function and cost [
9] and seismic design of planar irregular steel frames with BRB’s considering the cost and hysteretic energy ratio [
32]. On the other hand, in the case of sustainable design, it has been used to optimize the performance of residential buildings in energy terms by using 10 variables and three objective functions: minimum hours of thermal discomfort and minimum required energy for heating and cooling [
33]. Notice that the NSGA-II pseudocode is presented below, where the aforementioned operators are observed. The typical procedure of the NSGA-II approach is described in
Figure 1; for further information, see [
23,
24].
3. Methodology
3.1. Probability of Failure Evaluation
The focal point of this investigation revolves around the well-known Incremental Dynamic Analysis (IDA) and fragility curves to enhance the accuracy and efficiency of reliability assessments in structural engineering using artificial intelligence. Through a comprehensive exploration of dynamic structural behavior and the integration of AI, this study is a contribution toward the advancement of building design practices.
IDA is a powerful tool for evaluating structural performance at different ground motion intensity levels [
34]. By incrementally increasing the seismic excitation, IDA provides a detailed insight into the structural response, capturing nonlinearities and potential structural failure. The analysis enables engineers to quantify structural reliability by assessing the performance across a range of intensity levels, offering a more nuanced understanding compared to traditional static analyses. For this purpose, the maximum interstory drift (MID) is chosen as the engineering demand parameter (EDP). This specific selection allows us to precisely gauge the structural response for different intensities, ensuring a detailed and comprehensive evaluation of the building’s performance under seismic conditions. The incremental dynamic analysis for various reinforced concrete structures at several intensity levels was conducted through nonlinear step-by-step dynamic analysis by using the RUAUMOKO3D software 2017 [
35]. The earthquake ground motion records, chosen beforehand, have been scaled at different spectral accelerations at the first mode of vibration S
a(T
1) values ranging from 0.1 to 1.5 g.
Fragility curves, derived from IDA results, play a pivotal role in the reliability analysis process. These curves depict the probability of exceeding a predefined damage state as a function of the seismic intensity. By establishing a relationship between structural response and seismic input, fragility curves facilitate a probabilistic assessment of structural reliability. This approach enables engineers to make better decisions in the design process, considering uncertainties and variability inherent in real-world conditions. The fragility curves were estimated by assessing the probability of the reinforced concrete building’s failure when the EDP surpassed its reference value or exceedance rate for a given spectral acceleration. For the maximum interstory drift, a threshold value of 0.03 was selected, aligning with the specifications outlined in the current Mexican Building Code.
In the present work, the probability of failure was computed via Equation (1). Notice that for maximum interstory drift demands, a lognormal cumulative probability distribution was selected [
36].
In Equation (1),
and
are the geometric mean and standard deviation of the natural logarithm of the EDP, respectively, and are the standard normal cumulative distribution function. Notice that Bojórquez and Iervolino [
37] and Bojórquez et al. [
38] demonstrate that S
a(T
1) can be used as an intensity measure if the ground motion records are selected with similar spectral parameter Np as in the case of the present study.
3.2. Database of Beams and Columns
In order to randomly create individuals and perform the fundamental parameters of the NSGA-II optimization procedure, it is essential to develop a database of the variables of the selected problem. In this work, the variables correspond to the structural sections of the reinforced concrete frames: beams and columns. It is important to note that the specific sections obtained for each model were assessed to ensure compliance with the MBC for collapse and serviceability limit states. These databases are described below:
Beams: sections with a base dimension of 20 to 50 cm whose cambers vary from 1.5 to 3 times the base were considered. In addition, the top and bottom longitudinal steel reinforcement ratio per section with percentages according to the Mexican Building Code were considered in order to obtain ductile sections by using rebar ϕ 3/8″ to ϕ 1″. For the entire database, in the case of confinement reinforcement, only ϕ 3/8″ rebars were used. A total of 1024 sections were created and ordered according to their yielding moment (My).
Columns: in this case, square sections from 30 to 140 cm, with longitudinal steel reinforcement ratios from 1% to 4% using rebar ϕ 3/8″ to ϕ 1¼″, were considered. In the case of confinement reinforcement, rebar ϕ 3/8″ was used. For each section, their interaction diagram was calculated, and they were ordered by size, followed by their longitudinal steel ratio. In the same way as the beams, a total of 1024 sections were created.
A set of these database elements represents an individual. In order to carry out the genetic selection parameters, each individual is identified by means of a chromosome where their characteristics are stored, represented in binary code. A chromosome is an array of genes, and a gen is represented by an array of bits. A gene looks like: (1001011001), and a chromosome looks like (1001110101, 0101101001, 1010010110, 1000010101), where each gene represents the structural elements. The total number of combinations obtained in a binary code depends on the number of bits that are used, and it is calculated by the expression 2^bits. In order to represent 1024 different structural sections, 10 bits are necessary.
3.3. Reinforced Concrete Models
Demonstrating the efficacy of the aforementioned methodology, the design of two symmetrical three-dimensional reinforced concrete buildings, denoted as RC8 and RC12, comprising 8 and 12 stories, respectively, is proposed. These models were selected because most of the buildings in Mexico City are reinforced concrete structures with similar numbers of stories. In addition, many of the buildings that were damaged during the 1985 earthquake share these characteristics. These structures will feature 3 bays, each measuring 8 m in length, with interstory heights set at 3.5 m. A deliberate choice was made to employ 3 distinct types of beam and column sections for both models. In the case of the RC8 model, section variations occur every 3 levels, resulting in a specific type of beam and column section for levels 1–3, 4–6, and 7–8. Conversely, the RC12 model adopts a different section type every 4 levels. The schematic representation of this arrangement is illustrated in
Figure 2. Notice that the specified beam and column sections in the database were used for the seismic design of the buildings.
Each model will be characterized by 3 beam and column sections. Considering that each genetic element (section) is encoded by a 10-bit binary sequence, the chromosome of each model comprises a total of 60 bits. This encoding approach facilitates the representation of the structural elements, allowing a systematic exploration of the structural design space. The use of a binary representation serves as a foundational aspect in the subsequent application of the proposed optimization algorithm, providing a structured framework for the exploration of various design alternatives and their corresponding performance characteristics.
3.4. Earthquake Ground Motions
Thirty narrow-band seismic ground motion records taken from soft soil sites of Mexico City have been selected for the nonlinear analyses of the RC frames. Notice that the ground motions have been recorded in sites where several damages to buildings occurred during the 1985 Mexico Earthquake.
Table 1 illustrates the key issues of the ground motions. In
Table 1, PGA and PGV indicate peak ground acceleration and velocity, respectively. In addition, since the models to be designed are three-dimensional, it is necessary to consider the bidirectional components of the seismic records. This was achieved using the SRSS (Square Root of the Sum of the Squares) rule of the intensities in each direction. The elastic response spectra of the 30 ground motion records are shown in
Figure 3.
3.5. Fitness Functions
The key objective of this work is to find a set of optimal solutions for reinforced concrete structures with an excellent cost-seismic safety performance ratio. Therefore, the two fitness functions (FF) shown in Equations (2) and (3) were developed and are responsible for determining the solution capacity of the individuals.
F
1 represents the initial cost of the structure, (C
T) and it is obtained through the Equation (4), which considers the price of the main construction materials: concrete (C
C) and reinforcing steel (C
S), as well as the amount for labor cost (C
L) through a factor of the materials.
F
2 is used to calculate the structural performance of the RC frame through the analysis of the probability of the structural failure (
PF) considering the ground motions, scaling and issues detailed in
Section 3.
Constraint functions are added to both FFs, the purpose of which is to reduce the solution capacity of individuals who do not meet some fundamental criteria for all constructions. These constraints start with a value equal to 1 and increase as the individuals are penalized.
Dimension constraint (D
C): this was proposed for constructive terms, avoiding those cross sections of upper levels being larger than those of lower floors provided by Equation (5). For this, the cross-section dimensions of the frame are compared with the same section of the upper level. In addition, to prevent excessive stiffness decrease between consecutive levels, a decrease limit of 10 cm between consecutive columns is proposed, as shown in Equation (6).
where dj and d
j + 1 are the height or base dimension of a cross-section at j and j + 1 story, C
j and C
j + 1 are the dimensions of the columns of level j and j + 1.
Beam-column connection constraint (BC
C): in the same way as the previous constraint, this also corresponds to constructive conditions. It consists of penalizing those frames whose dimensions between columns and beams do not allow an adequate connection, that is, verify that in the n connections of the frame, the column’s height (c) is larger than the base of the beams (b) as shown in Equation (7).
Maximum interstory drift constraint (γC): in the event that the frame obtains a failure probability greater than 50% of exceeding the permissible maximum interstory drift according to the collapse limit state of Mexican Building Code (0.03), it is penalized according to the following Equation.
4. Numerical Results
In order to achieve the objectives of this manuscript, it is necessary to establish the conditions and properties of the models to determine the mechanical and dynamic characteristics, as well as the NSGA-II algorithm parameters. The parameters used in the present work are shown below:
Compressive strength of concrete (f’c): 24.5 MPa
Yield strength of reinforcing steel (fy): 410 MPa
Fixed columns at base
Live load: 17.66 MPa
Volumetric weight of reinforced concrete: 24 kN/m3
Elastic Modulus of concrete: 24 GPa
Shear modulus of concrete: 9 GPa
Individuals per generation: 100
Number of generations: 100.
On the other hand, a computer program that combines the seismic analysis of reinforced concrete structures with the NSGA-II technique was developed. This program considers the incremental dynamic analysis of the three-dimensional models under 30 narrow-band ground motion records illustrated in
Table 1. To evaluate the seismic performance of the buildings, the above data were combined with the dynamic time-history analysis considering a damping equal to 5% of the critical. The behavior of the reinforced concrete elements was achieved with the modified Takeda degrading stiffness hysteresis rule with unloading (α) and reloading (β) stiffness factors of 0.4 and 0.6, respectively, rigid block lengths at the nodes equal to the dimensions of the sections used and concentrated plasticity at the ends of the members at a distance equal to the effective depth plus the rigid block. To effectively demonstrate the procedure of the applied methodology, a flow chart is presented in
Figure 4.
4.1. Structural Model RC8
As explained above, the initial population is generated randomly. Due to this, most of the individuals are penalized, mainly for construction issues such as the beam-column connections or sections of upper stories with greater dimensions than those of lower levels.
Figure 5 shows the FF of the individuals of the first generation, where a wide variability is observed, F
1 and F
2 ranging between
$400,000 and
$4,300,000 USD and 0.75 and 27, respectively.
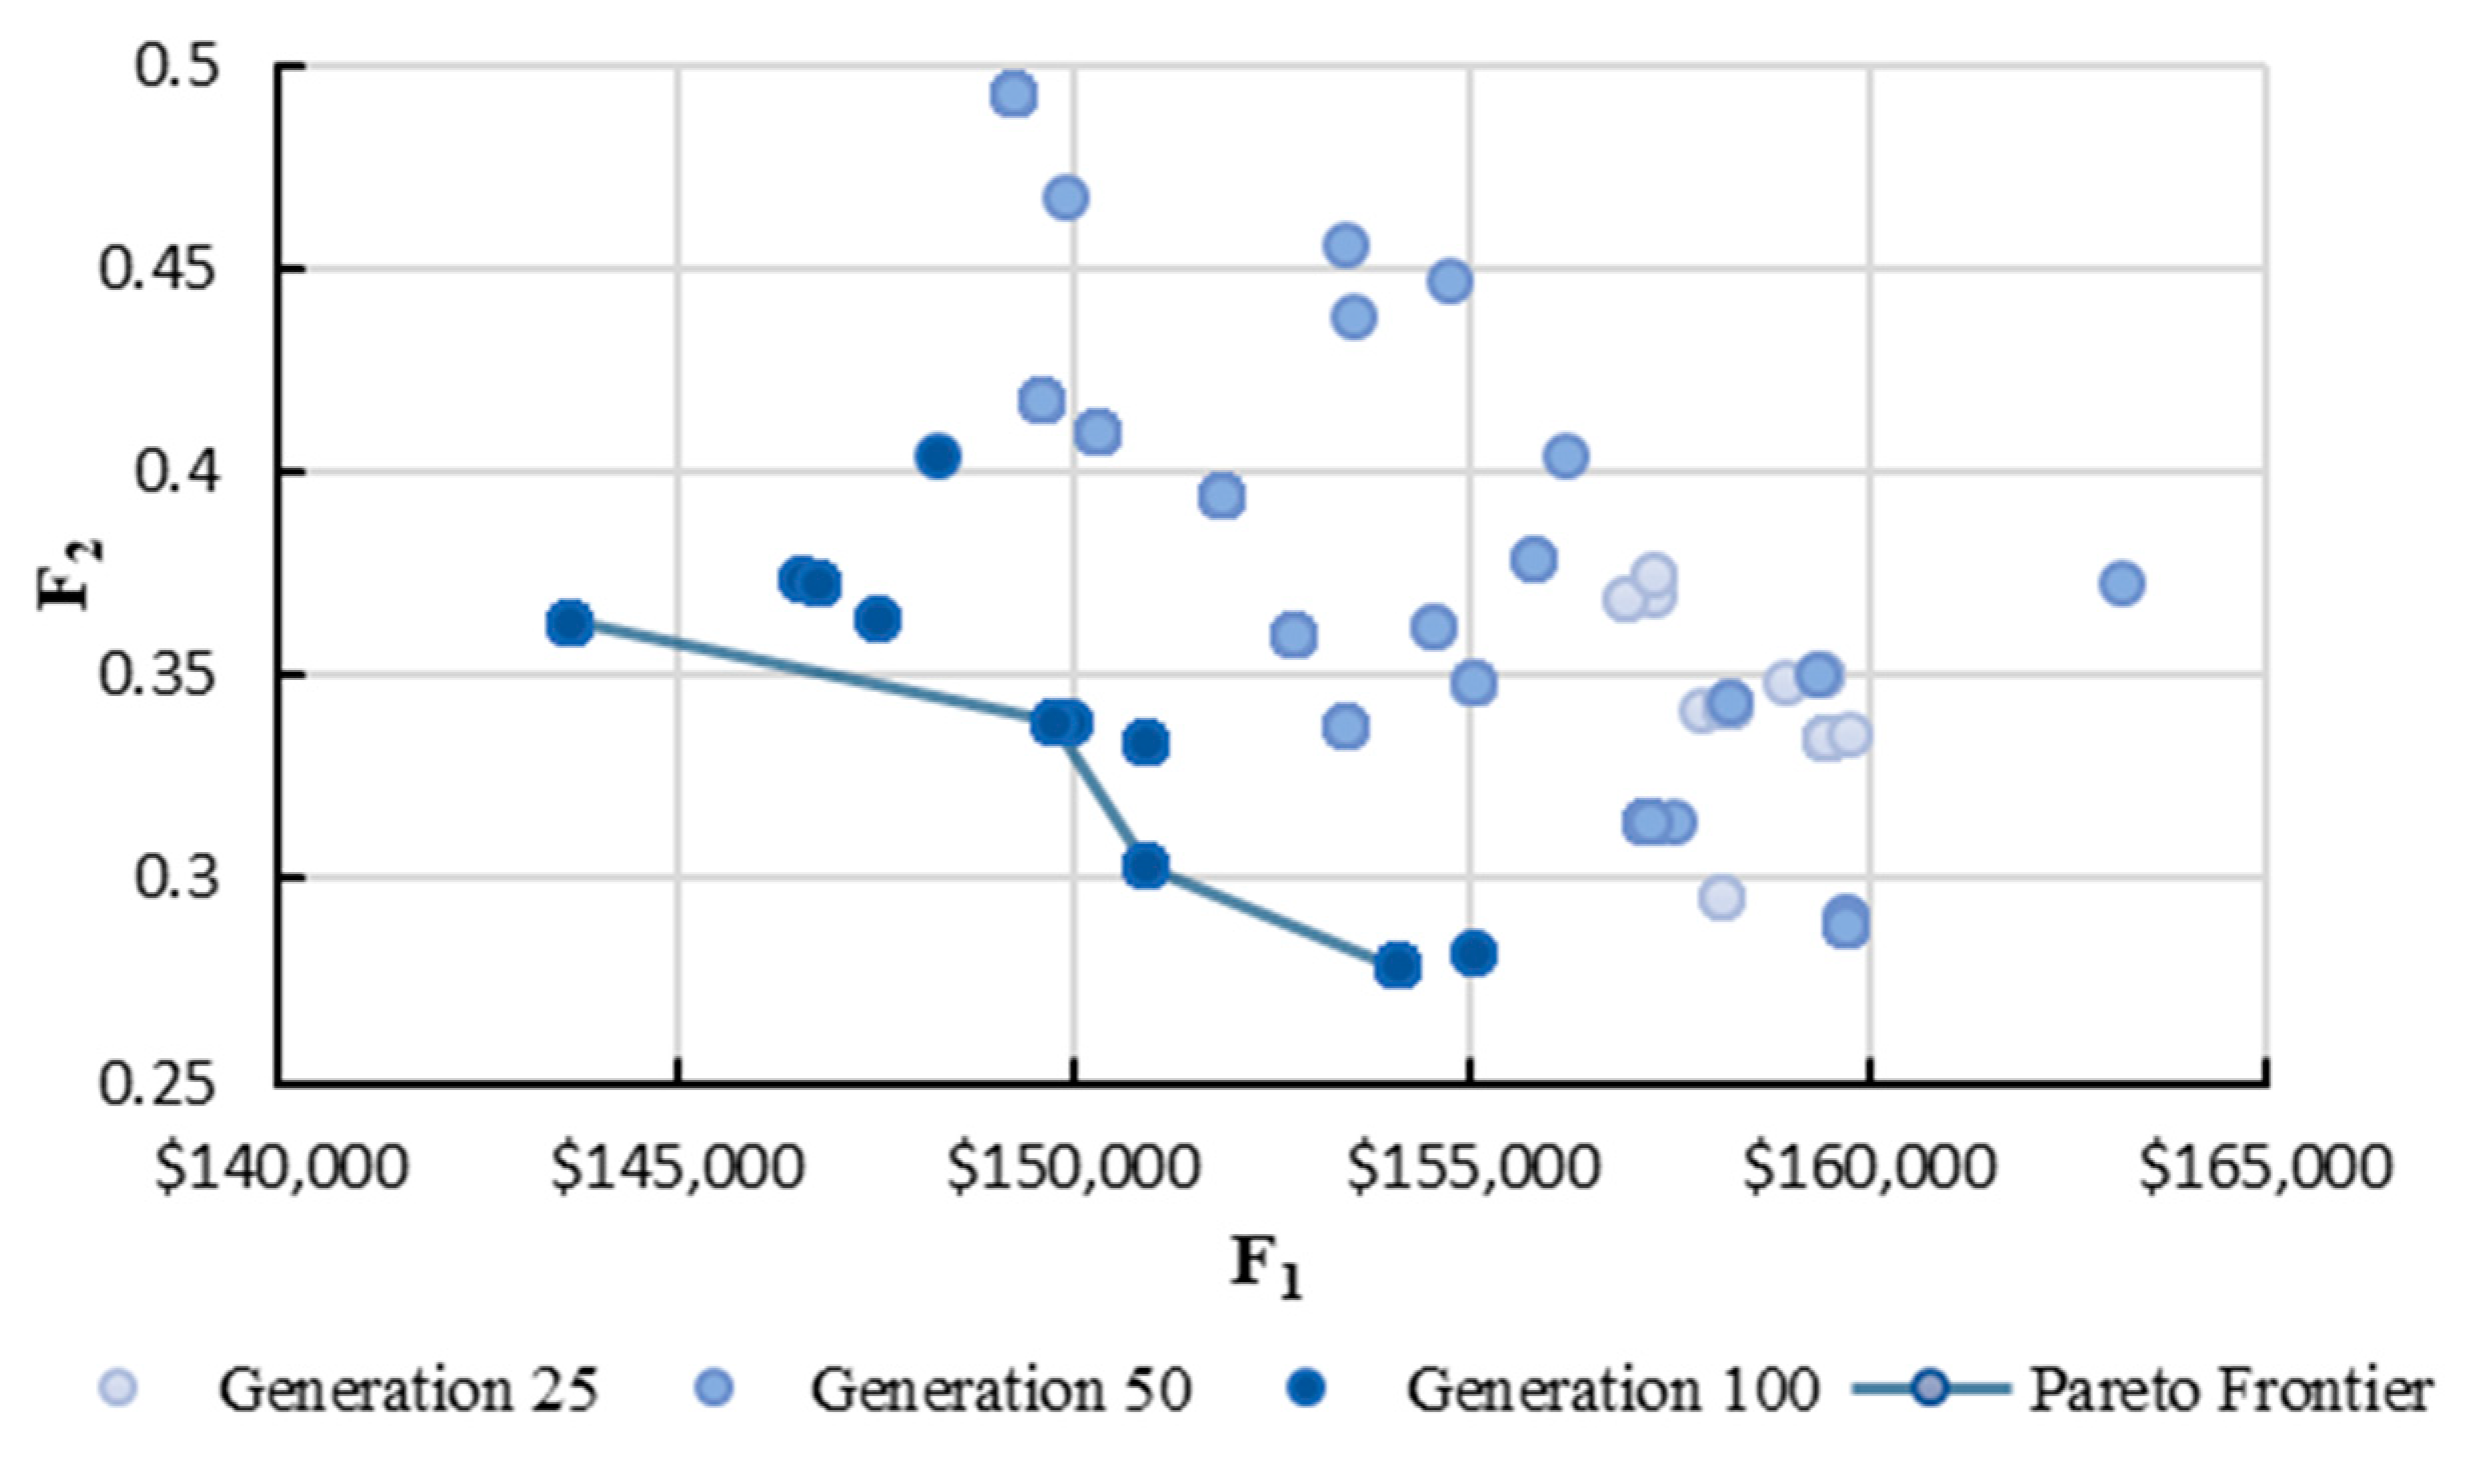
As the genetic algorithm progresses, the worst individuals are eliminated, and the best ones are crossed, decreasing the penalties, and better solutions are obtained. This is observed in
Figure 6, where the best solutions obtained in three different generations are compared. In generation 25, there are few solutions with FF close to the optimal (Pareto Frontier); however, in generation 50, a considerable increase of possible solutions toward the optimal structure is observed. In the last generation, there was a reduction in the number of possible solutions, but there is an improvement in its FF; this is due to the fact that the best solutions begin to be repeated, replacing the dominant solutions obtained in previous generations.
In
Figure 6, the line represents the probability of failure objective function, which is composed of four frames with FF values very close to each other, and they are shown in
Table 2. As it was expected, the greater the dimension of the sections, the probability of failure tends to be reduced, but the cost of the structural model increases.
In multi-objective optimization, one solution is difficult to be better than the others; however, when choosing a design, it is very common to lean towards the most economical. The cheaper structure has a cost of
$143,678.92 USD; the beams and columns at different stories are represented in
Figure 7,
Figure 8 and
Figure 9. It is important to indicate that among the non-dominated solutions, those with the lowest cost were selected as the final solution from the Pareto Frontier. This approach was adopted to address the complexity of multi-objective optimization by emphasizing cost.
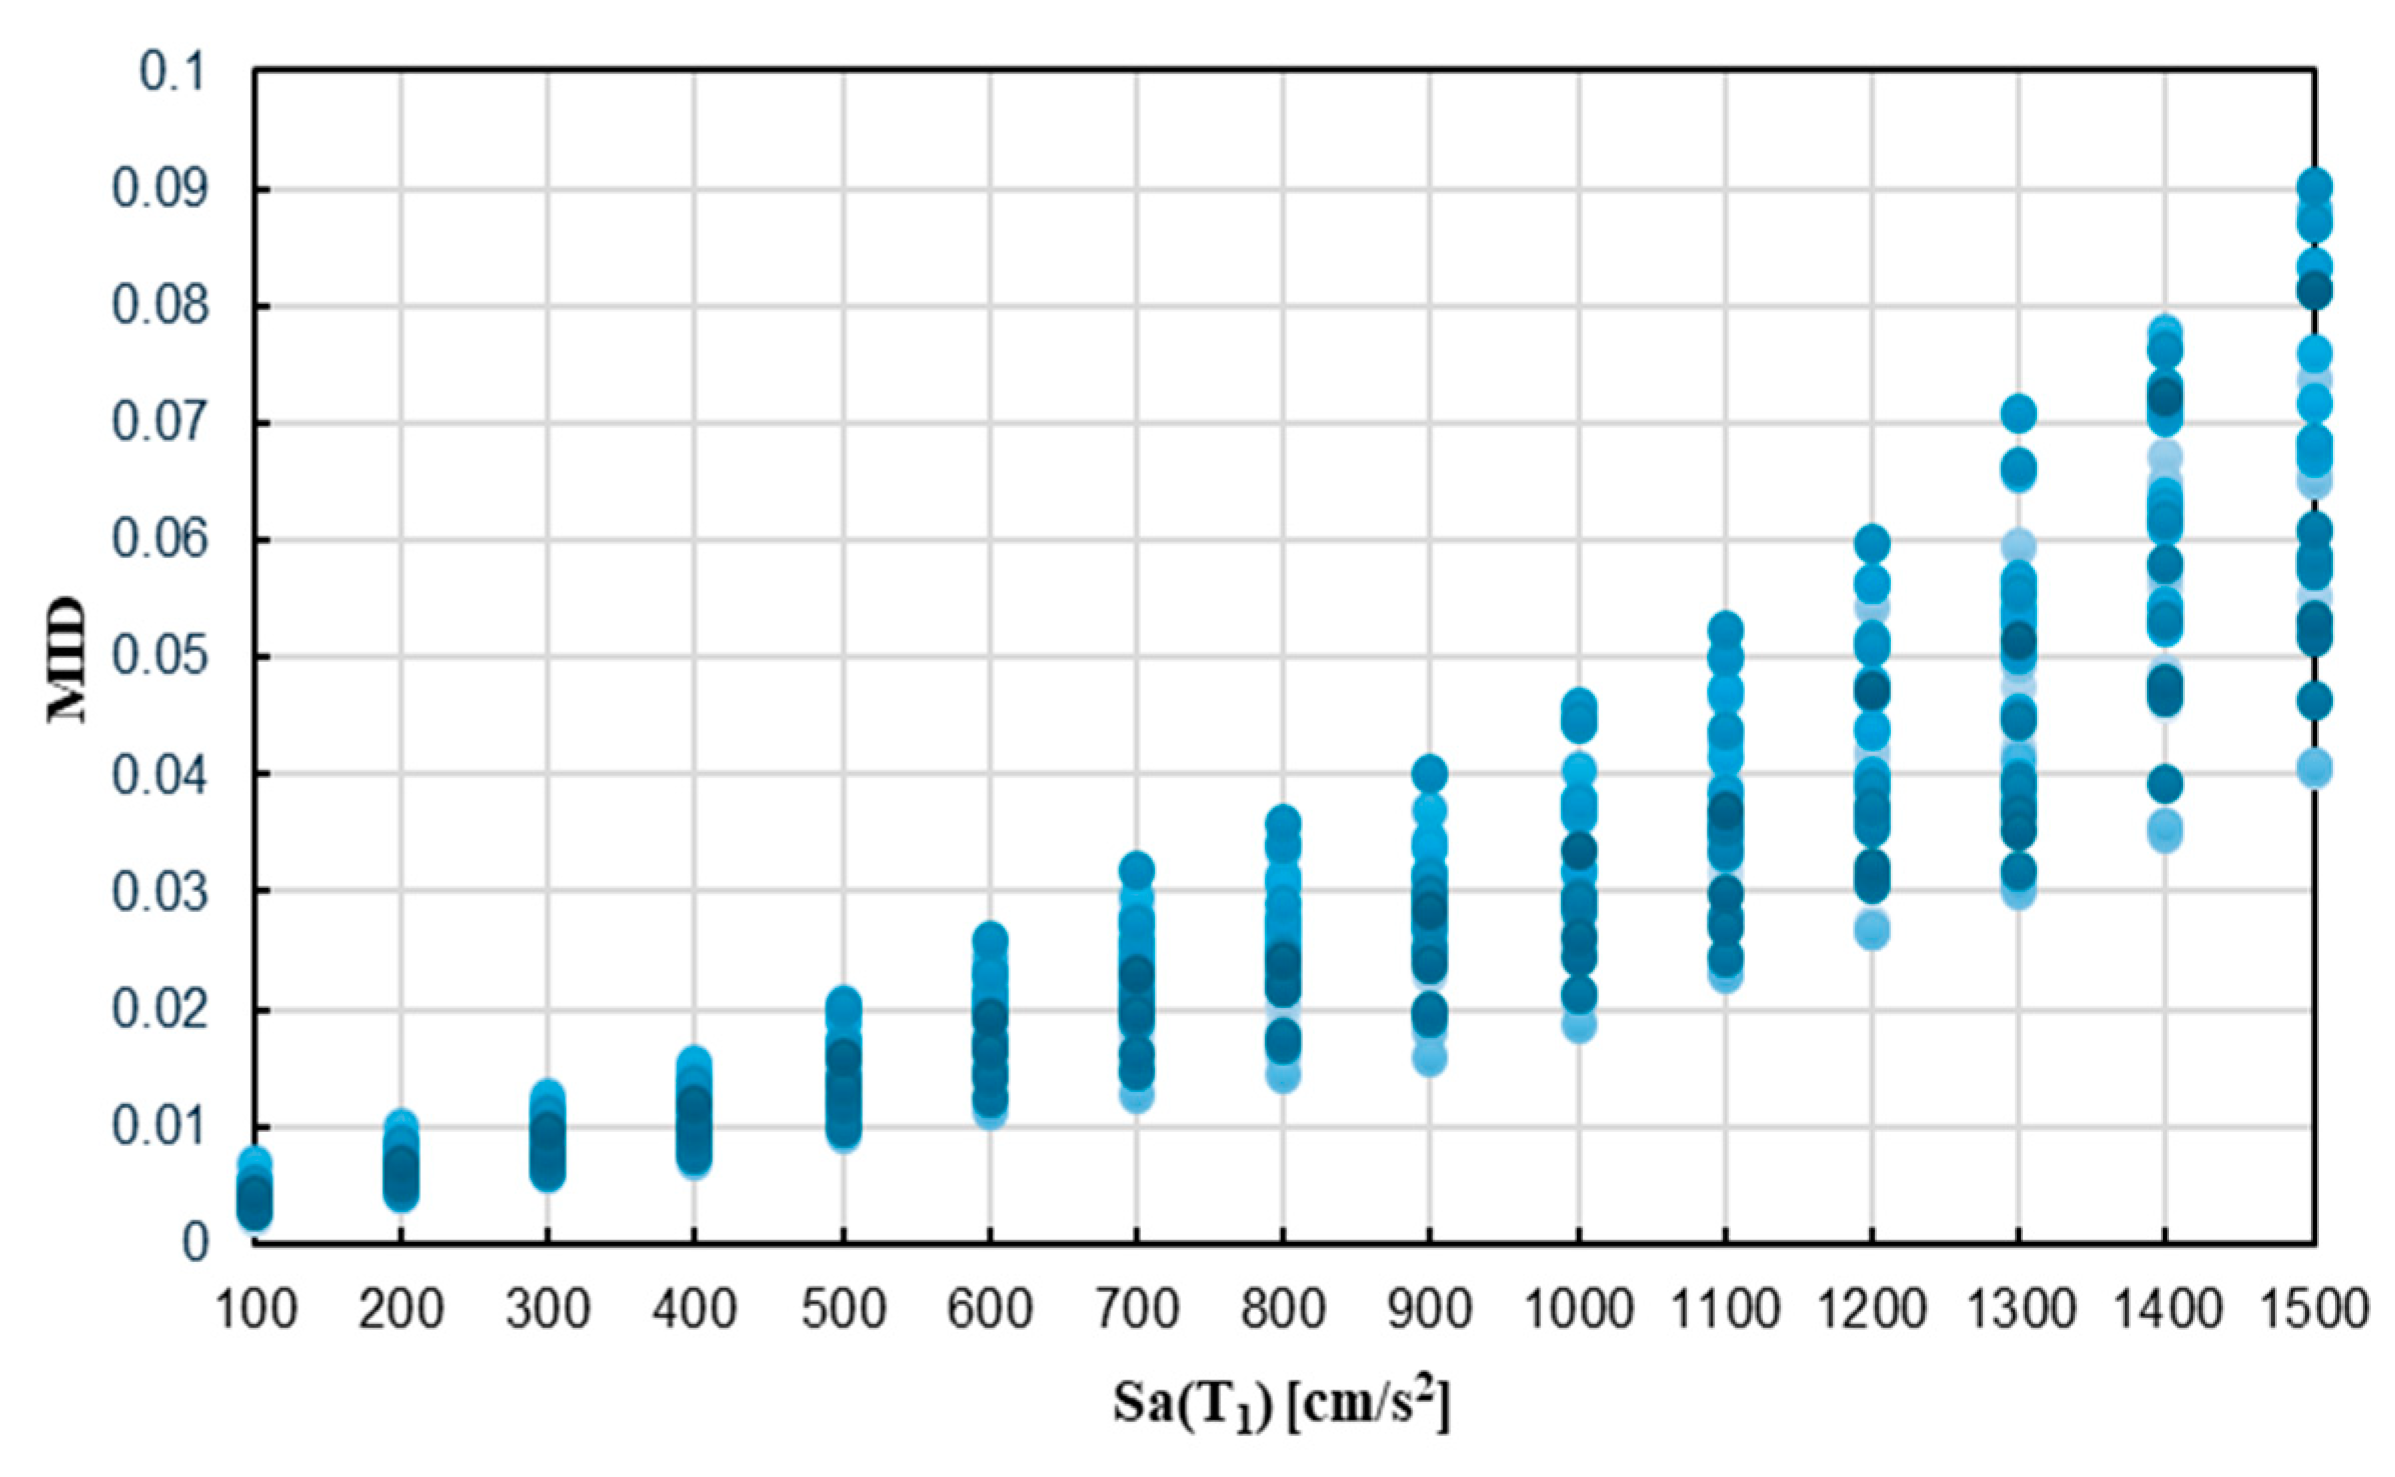
Figure 10 and
Figure 11 illustrate the incremental dynamic analysis and fragility curves. Notice that the advantage of incremental dynamic analyses in comparison with the traditional push-over analysis (based on the structural response in terms of the first mode of vibration) is the inclusion of all the modes of vibration to obtain the seismic response of buildings. In
Figure 10, the IDA results for the RC8 show that as the intensity increases, the MID also rises, with the response remaining approximately linear up to 400 gals before becoming nonlinear. Fragility curves derived from IDA results are shown in
Figure 11; for the fragility analysis, a threshold interstory drift of 0.03, as specified by the Mexican Building Code, was used to evaluate the probability of exceeding this limit at various seismic intensities. The resulting fragility curve provides a probabilistic measure of the building’s vulnerability to significant damage during seismic events.
4.2. Structural Model RC12
Similar results, as in the case of the previous model, have been obtained for the RC frame with 12 stories.
Figure 12 compares the best solutions of three generations where the decrease of the FF with the advance of the algorithm is noted. In this case, the reduction of F
1 and F
2 is not as noticeable as in the previous model. Notice that in RC12, as a taller model, there is a greater number of possible solutions; therefore, a higher dispersion between the results and a Pareto Frontier made up of more individuals is expected. Said Pareto Frontier is constituted of seven individuals with wide F
1 and F
2 variations, with values between
$287,000 and
$348,386 USD and 0.042 and 0.472, respectively.
Table 3 presents the FF and cross-sections of the seven optical frames in terms of initial cost and seismic safety. It is noticeable that as the probability of failure decreases, the dimensions of the structural elements increase.
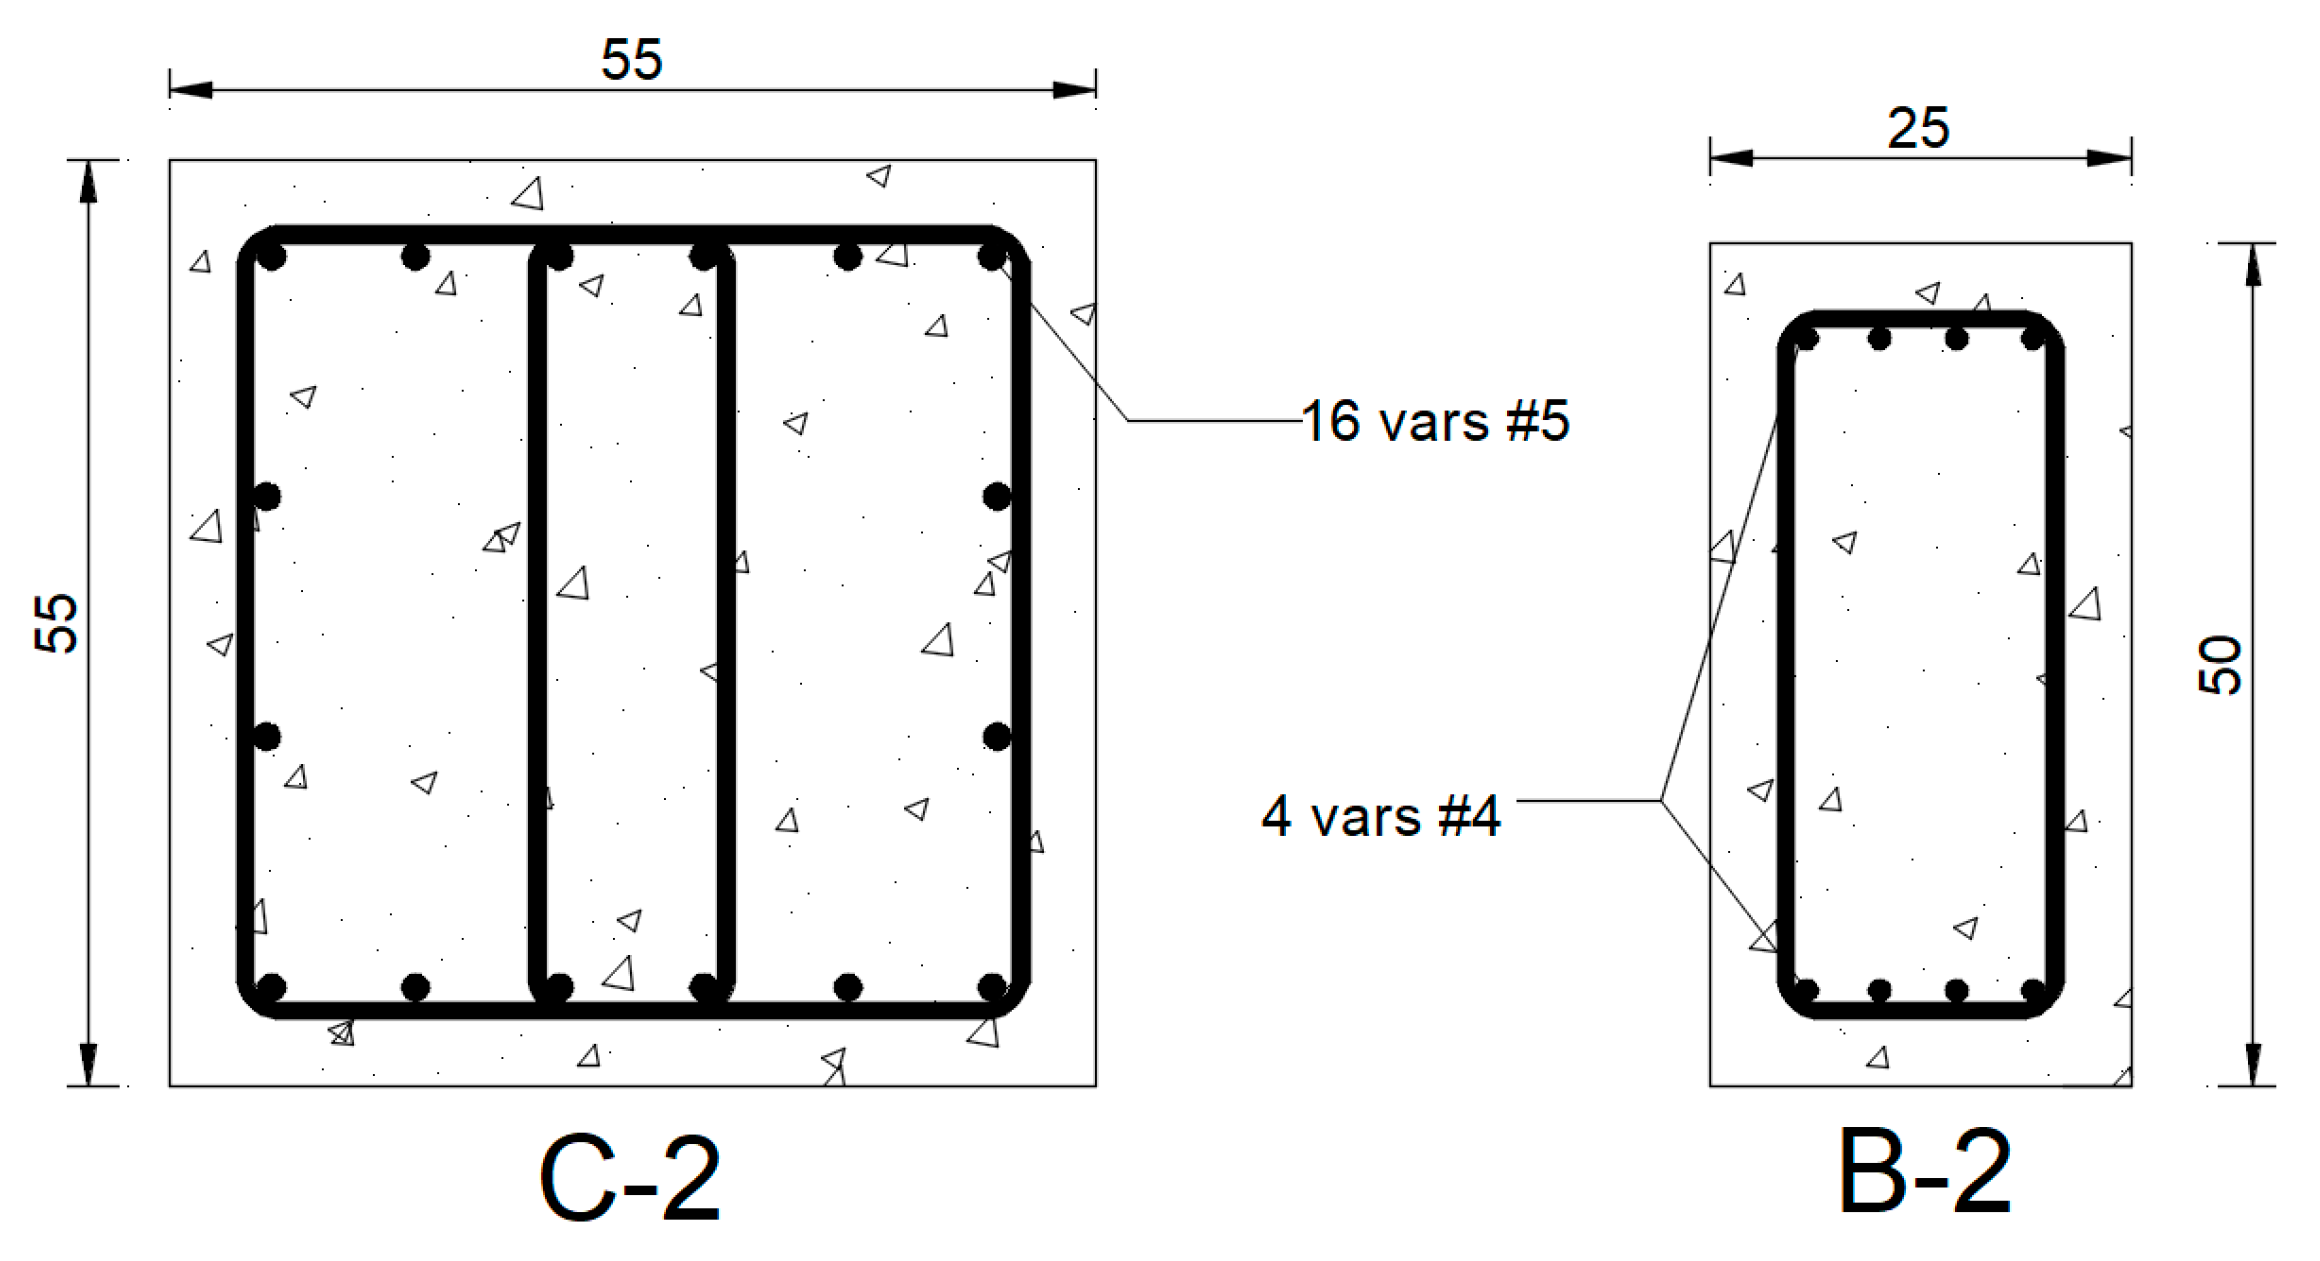
Figure 13,
Figure 14 and
Figure 15 show the reinforcing steel of the sections corresponding to the most economical frame. Finally, notice that in
Figure 7,
Figure 8,
Figure 9,
Figure 13,
Figure 14 and
Figure 15 the symbol # indicates that the diameter of the rod is a fraction of 1/8 inch; for example, rod #4 represents a 4/8 inch diameter rod (1/2 inch).
The IDA analysis and the fragility curves for the RC12 model are shown in
Figure 15 and
Figure 16, respectively. In
Figure 16, the IDA results show that, compared to the RC8 model, the RC12 model exhibits higher MID values and a larger uncertainty in the prediction of the structural response under the 30 ground motion records. This indicates a more pronounced nonlinear response at higher intensities. The fragility curves, presented in
Figure 17, reveal that the RC12 model is more susceptible to significant damage, likely due to its dynamic characteristics and resonance issues, especially in the soft soil zone of Mexico City.
In this case, the dimensions of all columns are equal; however, it is noted that the longitudinal steel ratio decreases in the sections of higher levels. This same result is observed for the two beam sections corresponding to levels 1 to 8.
5. Conclusions
The optimization of reinforced concrete buildings in Mexico City’s soft soil areas is crucial due to the heightened seismic risks associated with such environments. Focusing specifically on the seismic fragility of structures in this region, advanced multi-objective optimization techniques are employed, coupled with artificial intelligence methods like the NSGA-II genetic algorithm. In this study, these techniques have proven effective in the earthquake-resistant design of RC buildings capable of withstanding seismic events while minimizing total cost and the structural probability of failure in terms of maximum interstory drift. The results suggest that as the genetic algorithm evolves, there is a progressive improvement in solution quality, leading to a significant reduction in the probability of structural failure. This improvement translates into notable economic benefits, with potential cost reductions. Moreover, the importance of achieving a balance between cost and structural safety is underscored, where optimal solutions effectively mitigate seismic fragility without jeopardizing economic viability. A comprehensive nonlinear dynamic analysis of the structural models unveils notable trends regarding the relationship between the dimensions of structural elements and the probability of failure. Particularly noteworthy is the correlation between increasing element dimensions and decreasing failure probabilities, highlighting the critical role of optimization strategies in maximizing structural efficiency while minimizing costs.
In conclusion, valuable insights are provided for designing structures in seismic zones, offering real-life practical solutions for engineers and designers seeking economically viable and structurally efficient buildings. This study is very promising for addressing challenges toward optimization building in structural engineering. Future research could expand upon these findings by exploring various optimization techniques beyond genetic algorithms, addressing problems with more than two objectives, and investigating practical tools for professional use. Additionally, implementing these findings into design codes could further enhance their applicability. By leveraging multi-objective optimization techniques, the study paves the way for more resilient, sustainable and economically efficient buildings in high seismicity regions.


