Article

Impact Strength Properties and Failure Mode Classification of Concrete U-Shaped Specimen Retrofitted with Polyurethane Grout Using Machine Learning Algorithms

by
Sadi Ibrahim Haruna
1,*,
Yasser E. Ibrahim
1,*,
Omar Shabbir Ahmed
1 and
Abdulwarith Ibrahim Bibi Farouk
2
1
Engineering Management Department, College of Engineering, Prince Sultan University, Riyadh 11586, Saudi Arabia
2
School of Civil Engineering and Architecture, Guilin University of Technology, Guilin 541004, China
*
Authors to whom correspondence should be addressed.
Infrastructures 2024, 9(9), 150; https://doi.org/10.3390/infrastructures9090150
Submission received: 13 July 2024 / Revised: 17 August 2024 / Accepted: 30 August 2024 / Published: 3 September 2024
(This article belongs to the Section Infrastructures Materials and Constructions)

Abstract

The inherent brittle behavior of cementitious composite is considered one of its weaknesses in structural applications. This study evaluated the impact strength and failure modes of composite U-shaped normal concrete (NC) specimens strengthened with polyurethane grout material (NC-PUG) subjected to repeated drop-weight impact loads (USDWIT). The experimental dataset was used to train and test three machine learning (ML) algorithms, namely decision tree (DT), Naïve Ba yes (NB), and K-nearest neighbors (KNN), to predict the three failure modes exhibited by U-shaped specimens during testing. The uncertainty of the failure modes under different uncertainty degrees was analyzed using Monte Carlo simulation (MCS). The results indicate that the retrofitting effect of polyurethane grout significantly improved the impact strength of concrete. During testing, U-shaped specimens demonstrated three major failure patterns, which included mid-section crack (MC), crushing foot (CF), and bend section crack (BC). The prediction models predicted the three types of failure modes with an accuracy greater than 95%. Moreover, the KNN model predicted the failure modes with 3.1% higher accuracy than the DT and NB models, and the accuracy, precision, and recall of the KNN model have converged within 300 runs of Monte Carlo simulation under different uncertainties.

1. Introduction

Concrete is a widely utilized construction material [1], featuring the desired characteristics and good durability properties. However, its brittle characteristics and low tensile strength make it easily crack under flexural loading conditions [2]. Furthermore, conventional concrete has poor deformability and weak compression stiffness, which limit its ability to sustain impact stresses. This shortcoming restricts the use of concrete in some particular buildings that are subjected to impact loads, such as mechanical platforms and airport pavement, frequently under recurrent stresses over their lifespan. To address these inadequacies, efforts have been made to improve desirable concrete qualities [3,4,5,6]. Polyurethane appears to be a promising alternative material to improve the performance of concrete. Concrete structures deteriorate due to various circumstances, such as corrosion, de-icing chemicals, and inappropriate planning or construction. Cracking in concrete is frequently accompanied by steel corrosion, reducing the structure’s load-carrying capability [7,8]. Polymer composites commonly used to repair impaired concrete components, such as floor, pipes, and pavement, where good durability and fast setting are desired [9]. Polyurethane (PU)-based polymer materials have fascinated researchers in polymeric materials due to their exceptional characteristics [10,11,12]. Compared to traditional polymers, polyurethane demonstrates excellent chemical resistance, outstanding adhesion, rapid hardening, and good hardened behavior, resulting in improved cement-based material toughness with a low percentage [8]. It has extensive uses in the maintenance, restoration, and construction of engineering structures [13], such as in pavement construction [14], as grouting material [15,16,17], as polyurethane-cement-based material [18], added in concrete as recycled aggregate materials [19], and as PU foam [20]. Lei et al. [21] reported improved impact strength and dynamic stress compared to reference concrete. Parniani and Toutanj [22] studied the fatigue behavior of concrete specimen-strengthened polymer overlaid material. Lugsum et al. [18] investigated the static and impact strength of U-shaped concrete specimens containing polyurethane binder and ML algorithms to predict the failure strength of the U-shaped specimens. The result showed that PU binders significantly enhanced the impact strength of concrete. Al-shawafi et al. [23] coated the surface of ultra-high-performance concrete (UHPC) with polyurethane grouting The result indicated that the retrofitting effect effectively increased the dynamic properties of the UHPC.
ML algorithms have been effectively used to solved many engineering problems such as prediction, regressions, and classification [14,24,25,26,27]. Mangalathu and Jeon [28] explored the capability of ML algorithms to classify the failure modes in the reinforced concrete column using the DT, ANN, random forest, KNN, and NB models. Similarly, failure mode in an RC column was classified by [29], using the ANN and DT models. The residual-based damage of reinforced concrete columns was featured and optimized using ML algorithms [30]. Nguyen et al. [31] developed an XGB model to estimate the punching shear strength of RC inner slabs, and Nadepour and Mirrashid [32] analyzed the failure modes classification of the reinforced concrete joints using DT model. The dynamic fracture growth in brittle composite was analyzed using the ML model [33]. Fatma et al. [34] developed the deep learning Deep Neural Decision Forest (DNDF) to improve intrusion detection systems in network traffic evaluation. Najeeb et al. [35] evaluated the failure mode of plant fiber-reinforced composite using non-destructive testing technique.
Previous studies [36,37] have suggested that polyurethane is a sustainable coating material that can improve the dynamic resistance of concrete structure. The concrete’s detrimental effect and disintegration under impact loads can be minimized [38]. The use of stiffness and elastic materials effectively increased concrete’ energy absorption capacity [38,39]. As a result, polymer grout overlay on concrete component mitigates the detrimental effects of impact loads [23,40]. Similarly, utilization of elastomeric material to retrofitted concrete structures can improve the impact resistance of the structural component [23,40]. Therefore, attention has been paid in this study to classify the failure modes of concrete U-shaped specimens retrofitted with polyurethane grouting materials subjected to multiple drop-weight impact loads. Machine learning algorithms were employed, including the decision tree, Naïve Bayes, and K-nearest neighbor models. Moreover, the uncertainties of the failure modes under different uncertainties degree were analyzed using Monte Carlo simulation technique. The prediction skills can prevent the need for carrying out high-cost experimental work and save time.

2. Materials and Methods

2.1. Materials

Grade 42.5R ordinary Portland cement was used to produce the concrete mixture following Chinese national standard JTG55-2011 [41]. Natural river sand was utilized as fine aggregate; it had a fineness modulus of 2.63. Medium particle sizes (10 mm) obtained from crushed stone were employed as coarse aggregate. The polycarboxylate-based superplasticizer was incorporated into the concrete mixes at 0.15% by cement weight to obtain good workability.
The polyurethane binder was prepared by mixing castor oil and polyaryl polymethylene isocyanate (PAPI) using a 6: 1 mixing ratio, placed in a container, and vigorously mixed with a small mechanical mixer for about 2 min at room temperature until a homogenous solution was achieved [14,42].

2.2. Specimen Preparation

Table 1 displays the mixture design for preparing the normal concrete and PU grouting materials. The U-shaped specimens and beam were cast and compacted using a vibrating table. After casting, all specimens were kept at room temperature for 24 h before demolding. Then, the specimens were cured for 28 days.
The 28-day-cured specimens were allowed to air dry for 7 days to totally remove the moisture content on the specimens. The dried specimens were then put back into the clean molds to form composite specimens. The freshly PUG materials obtained by mixing quartz sand and PU binder at a 1:0.5 mixing ratio by weight were then cast on surfaces of the concrete U-shaped at 5 mm and 10 mm thicknesses according to the configuration, as shown in Table 2. The composite U-shaped specimen configurations are tested for repeated drop-weight impact at room temperature. The typical normal concrete and composite U-shaped specimens retrofitted with the PUG are shown in Figure 1.

2.3. Testing Methods

Multiple Drop-Weight Impact Tests of Composite U-Shaped Specimens

The experimental setup of multiple drop-weight impact test methods is depicted in Figure 2. The test was performed based on the modified testing principles of the ACI 544 2R testing procedure [43]. Multiple drop-weight impact tests have been widely adopted in many studies to investigate the impact resistance of concrete. The USDWIT was carried out following previous research by Haruna et al. [14,36], and a hammer weight of 1.25 kg was used to simulate the impact of composite U-shaped specimens, which was constantly falling from a 457 mm height. Therefore, the number of drops to induce the first crack (N1) and failure strength (N2) was recorded. As shown in Figure 2, a steel base with a mass of 45 kg was used to support the test specimen, which was constructed to meet the requirements of the U-shaped geometry, loading system, and elastic–plastic deformation in order to provide a more accurate impact resistance result.

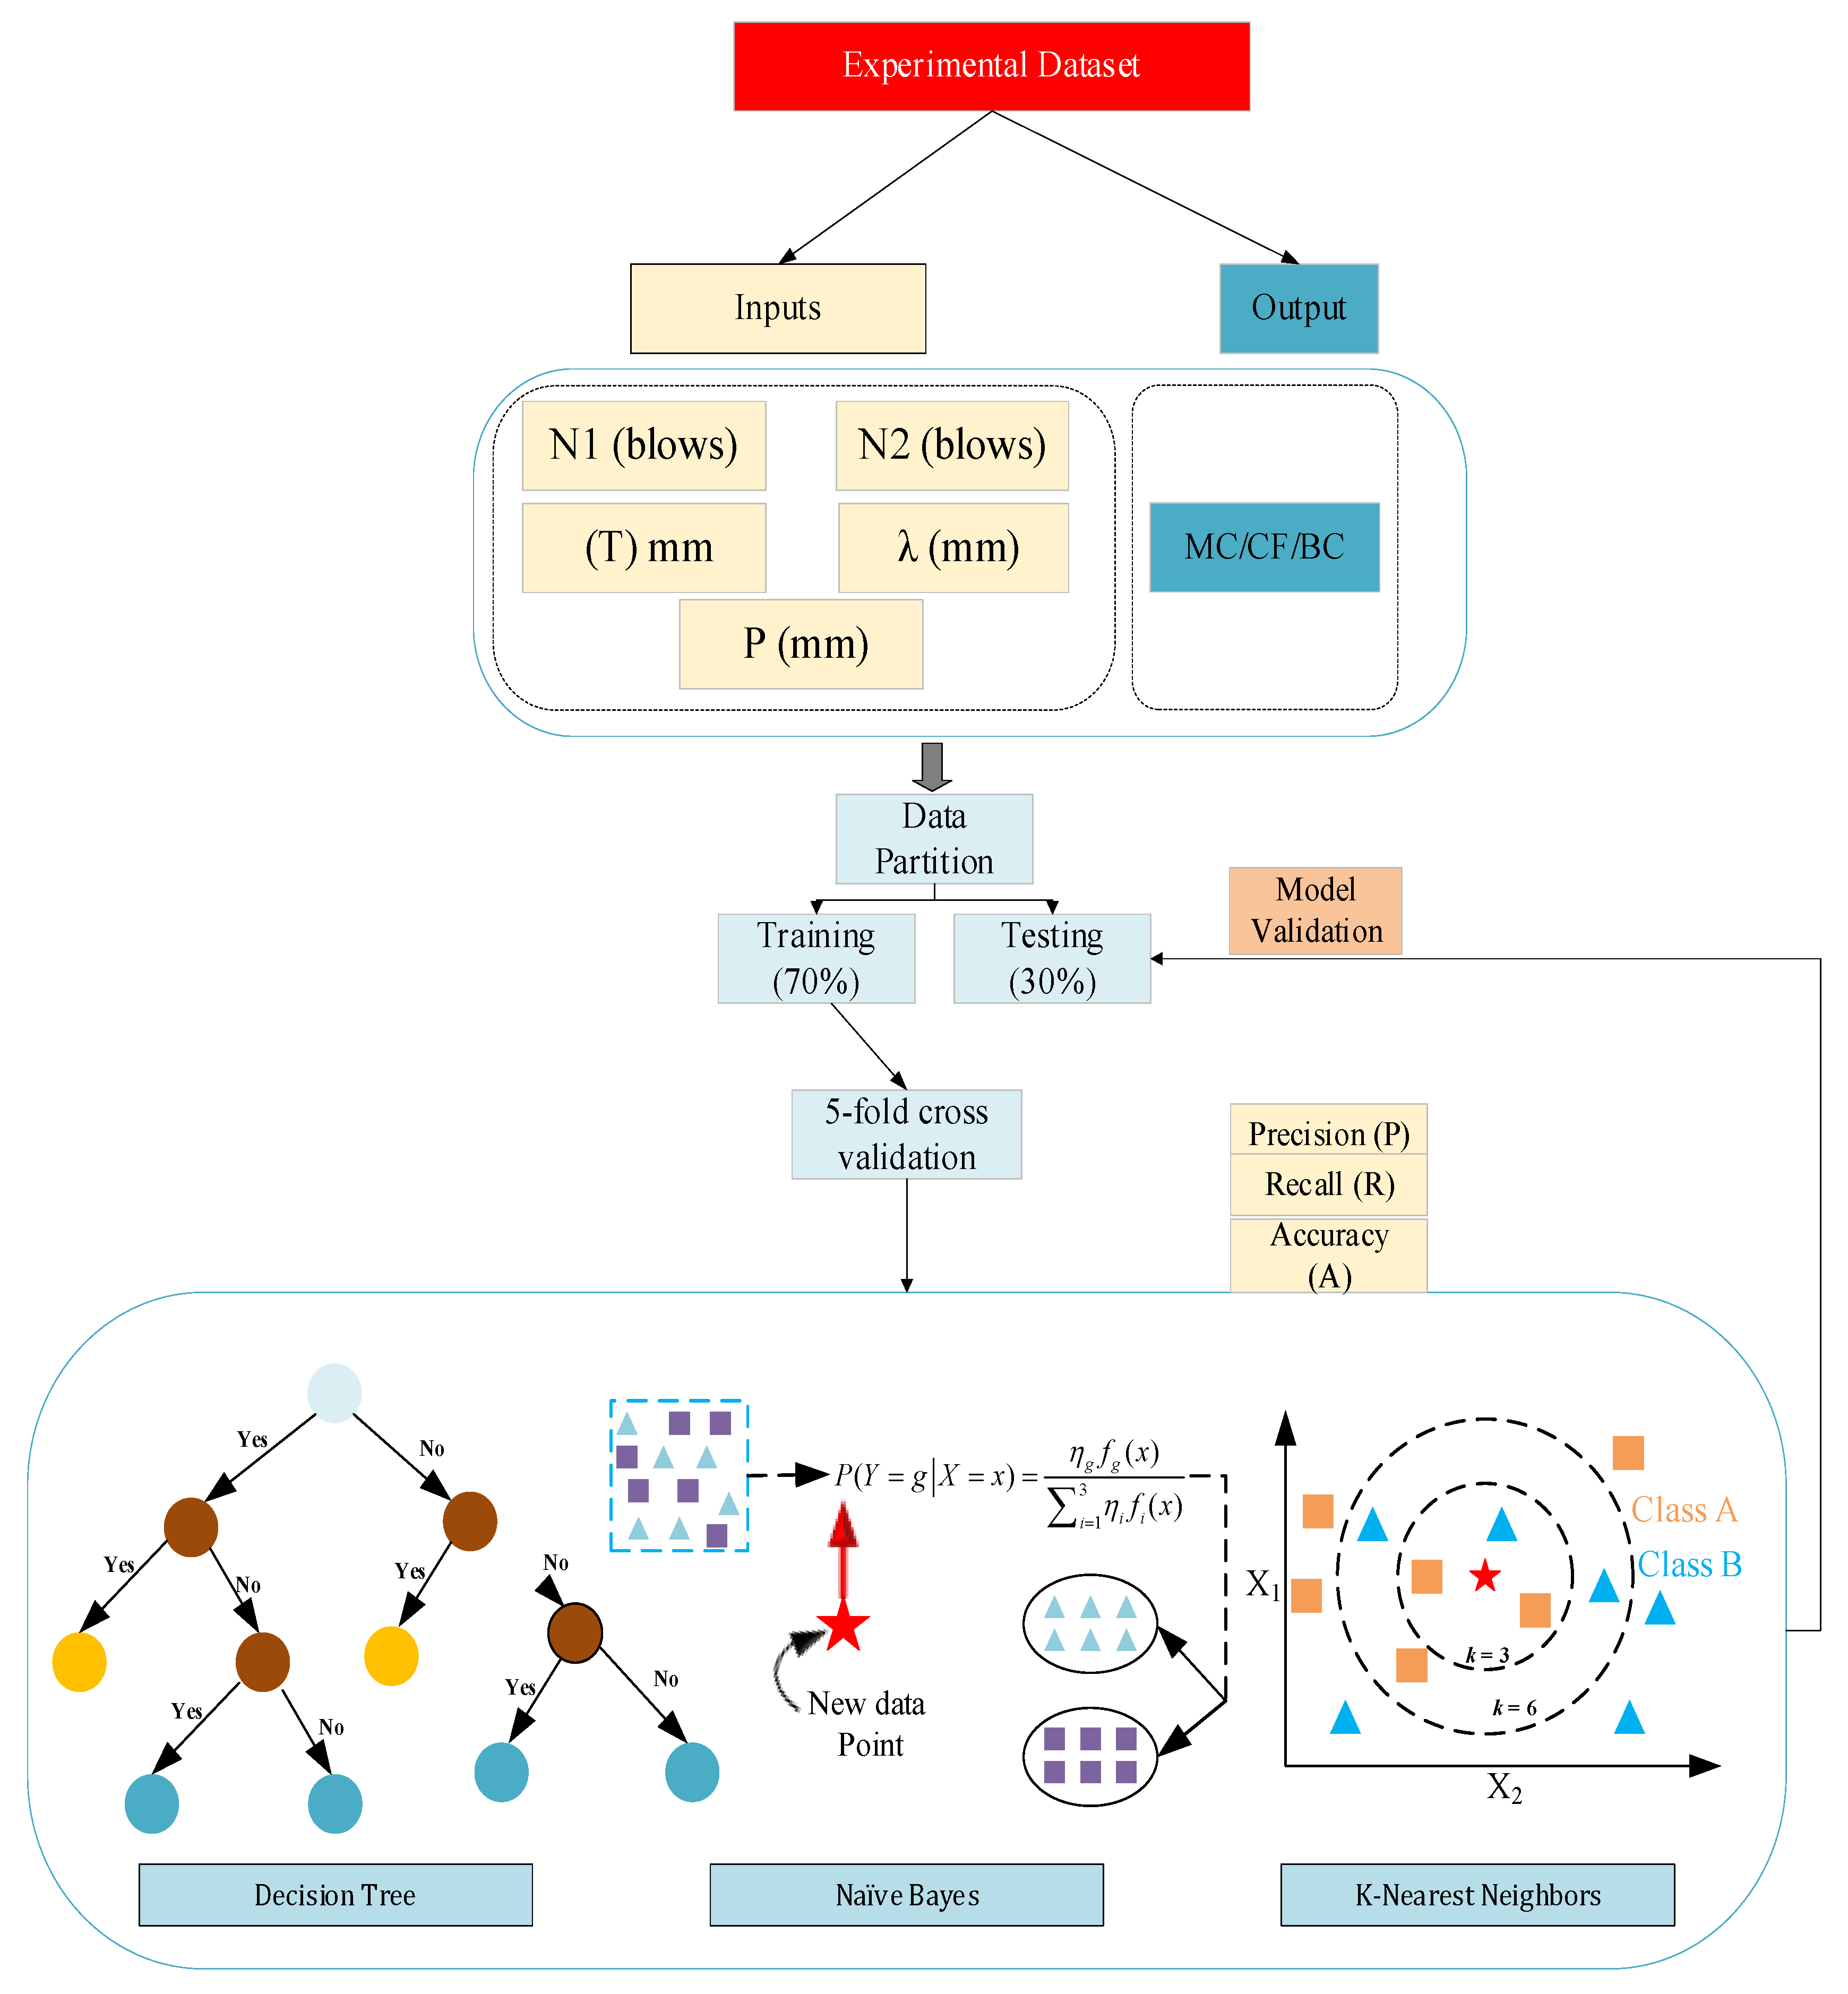
2.4. AI Modeling Procedure

2.4.1. Decision Tree

A supervised ML method called a decision tree is frequently employed for classification and regression problems. It creates a model with a structure similar to a tree using trained data [44]. The test on a feature is represented by a root node at the start of the tree-structured algorithm, which then expands to b branches that represent the test’s result. Compared to other models, the DT technique is more prone to overfitting the data since a single decision-tree model has a huge variance [45]. The creation of a decision tree involves two steps:
(1)
Split up the training dataset area t1, t2, t3, …tp into H separate and overlapping areas K1, K2, K3, …Kp. The Gini index (GI) is utilized for the region’s split binary operation [46], which specifies how the overall variance across all j classes was measured.
G I = J = 1 3 P ^ n j ( 1 P ^ n j )
where P ^ n j denotes the group of training sets in the nth area that are members of the jth class.
(2)
Cost-complexity pruning can be used to implement the preventative actions for overfitting or potentially complicated trees, taking into account a collection of trees groups of trees organized by nonnegative tuning index α. Given that the GI of the holdout data is decreased during the procedure, the max α-value might be obtained by the k-fold cross-validation method.

2.4.2. Naïve Bayes (NB)

Naïve Bayes (NB) algorithm is a stochastic classifier developed according to the Bayes theorem [47]. The classifier acknowledges and indicates a set to which the target variable belongs. The parameter fg (X) denotes the density function of X for a subset in a gth class, and η g is a randomly selected probability of the variable related to the gth class. Thus, the probability that X in a gth class is described as
P ( Y = g X = x ) = η g f g ( x ) i = 1 3 η i f i ( x )  

2.4.3. K-Nearest Neighbors

K-nearest neighbors (KNN) is a statistical approach for classifying data [48,49]. For a numeral K and observed data x, the KNN algorithm will determine the K points belonging to the train data nearest to the x that Nk first. Therefore, the KNN is regarded as allocating the K-nearest neighbors a weight of 1/k and all other zero weights. The contingent probability of x belonging to the class k is then calculated as
P k ( x ) = Pr ( Y = k X = x ) = 1 k i N k I ( y i = k )
KNN allocates x to the class k with the highest probability. The selection of K controls the selection border between the k-classes and the model’s accuracy, as shown in Equation (5), and a value of 5 was employed in this work. The low-bias–high-variance classifier corresponds to the lower K, and the low-variance–high-bias classifier to the higher K. Figure 3 presents the architecture of the developed models.

2.4.4. Performance Evaluation

Three evaluation indices, accuracy (A), recall (R), and precision (P), were utilized in this study to evaluate the effectiveness of the created models objectively. These indices are given in Equations (4)–(6).
Precision   ( P ) = T Q T Q + F Q
Recall   ( R ) = T Q T Q + F N
Accuracy   ( A ) = T Q + T N T Q + T N + F Q + F N
TQ is the number of “true positive” predictions made correctly at a particular level. FQ stands for the number of false positives or incorrect forecasts at a certain level. The correct number of predictions made at another stage relative to the genuine negative level is known as the TN. False negatives, or FNs, are the incorrect number of predictions made on another stage relative to TPs. Equations (4)–(6) were developed for two categorization issues. The macro-average method was used for multiclass classification issues like the one used in the study. Precision or recall has the three failure modes’ average value.

3. Discussion and Results

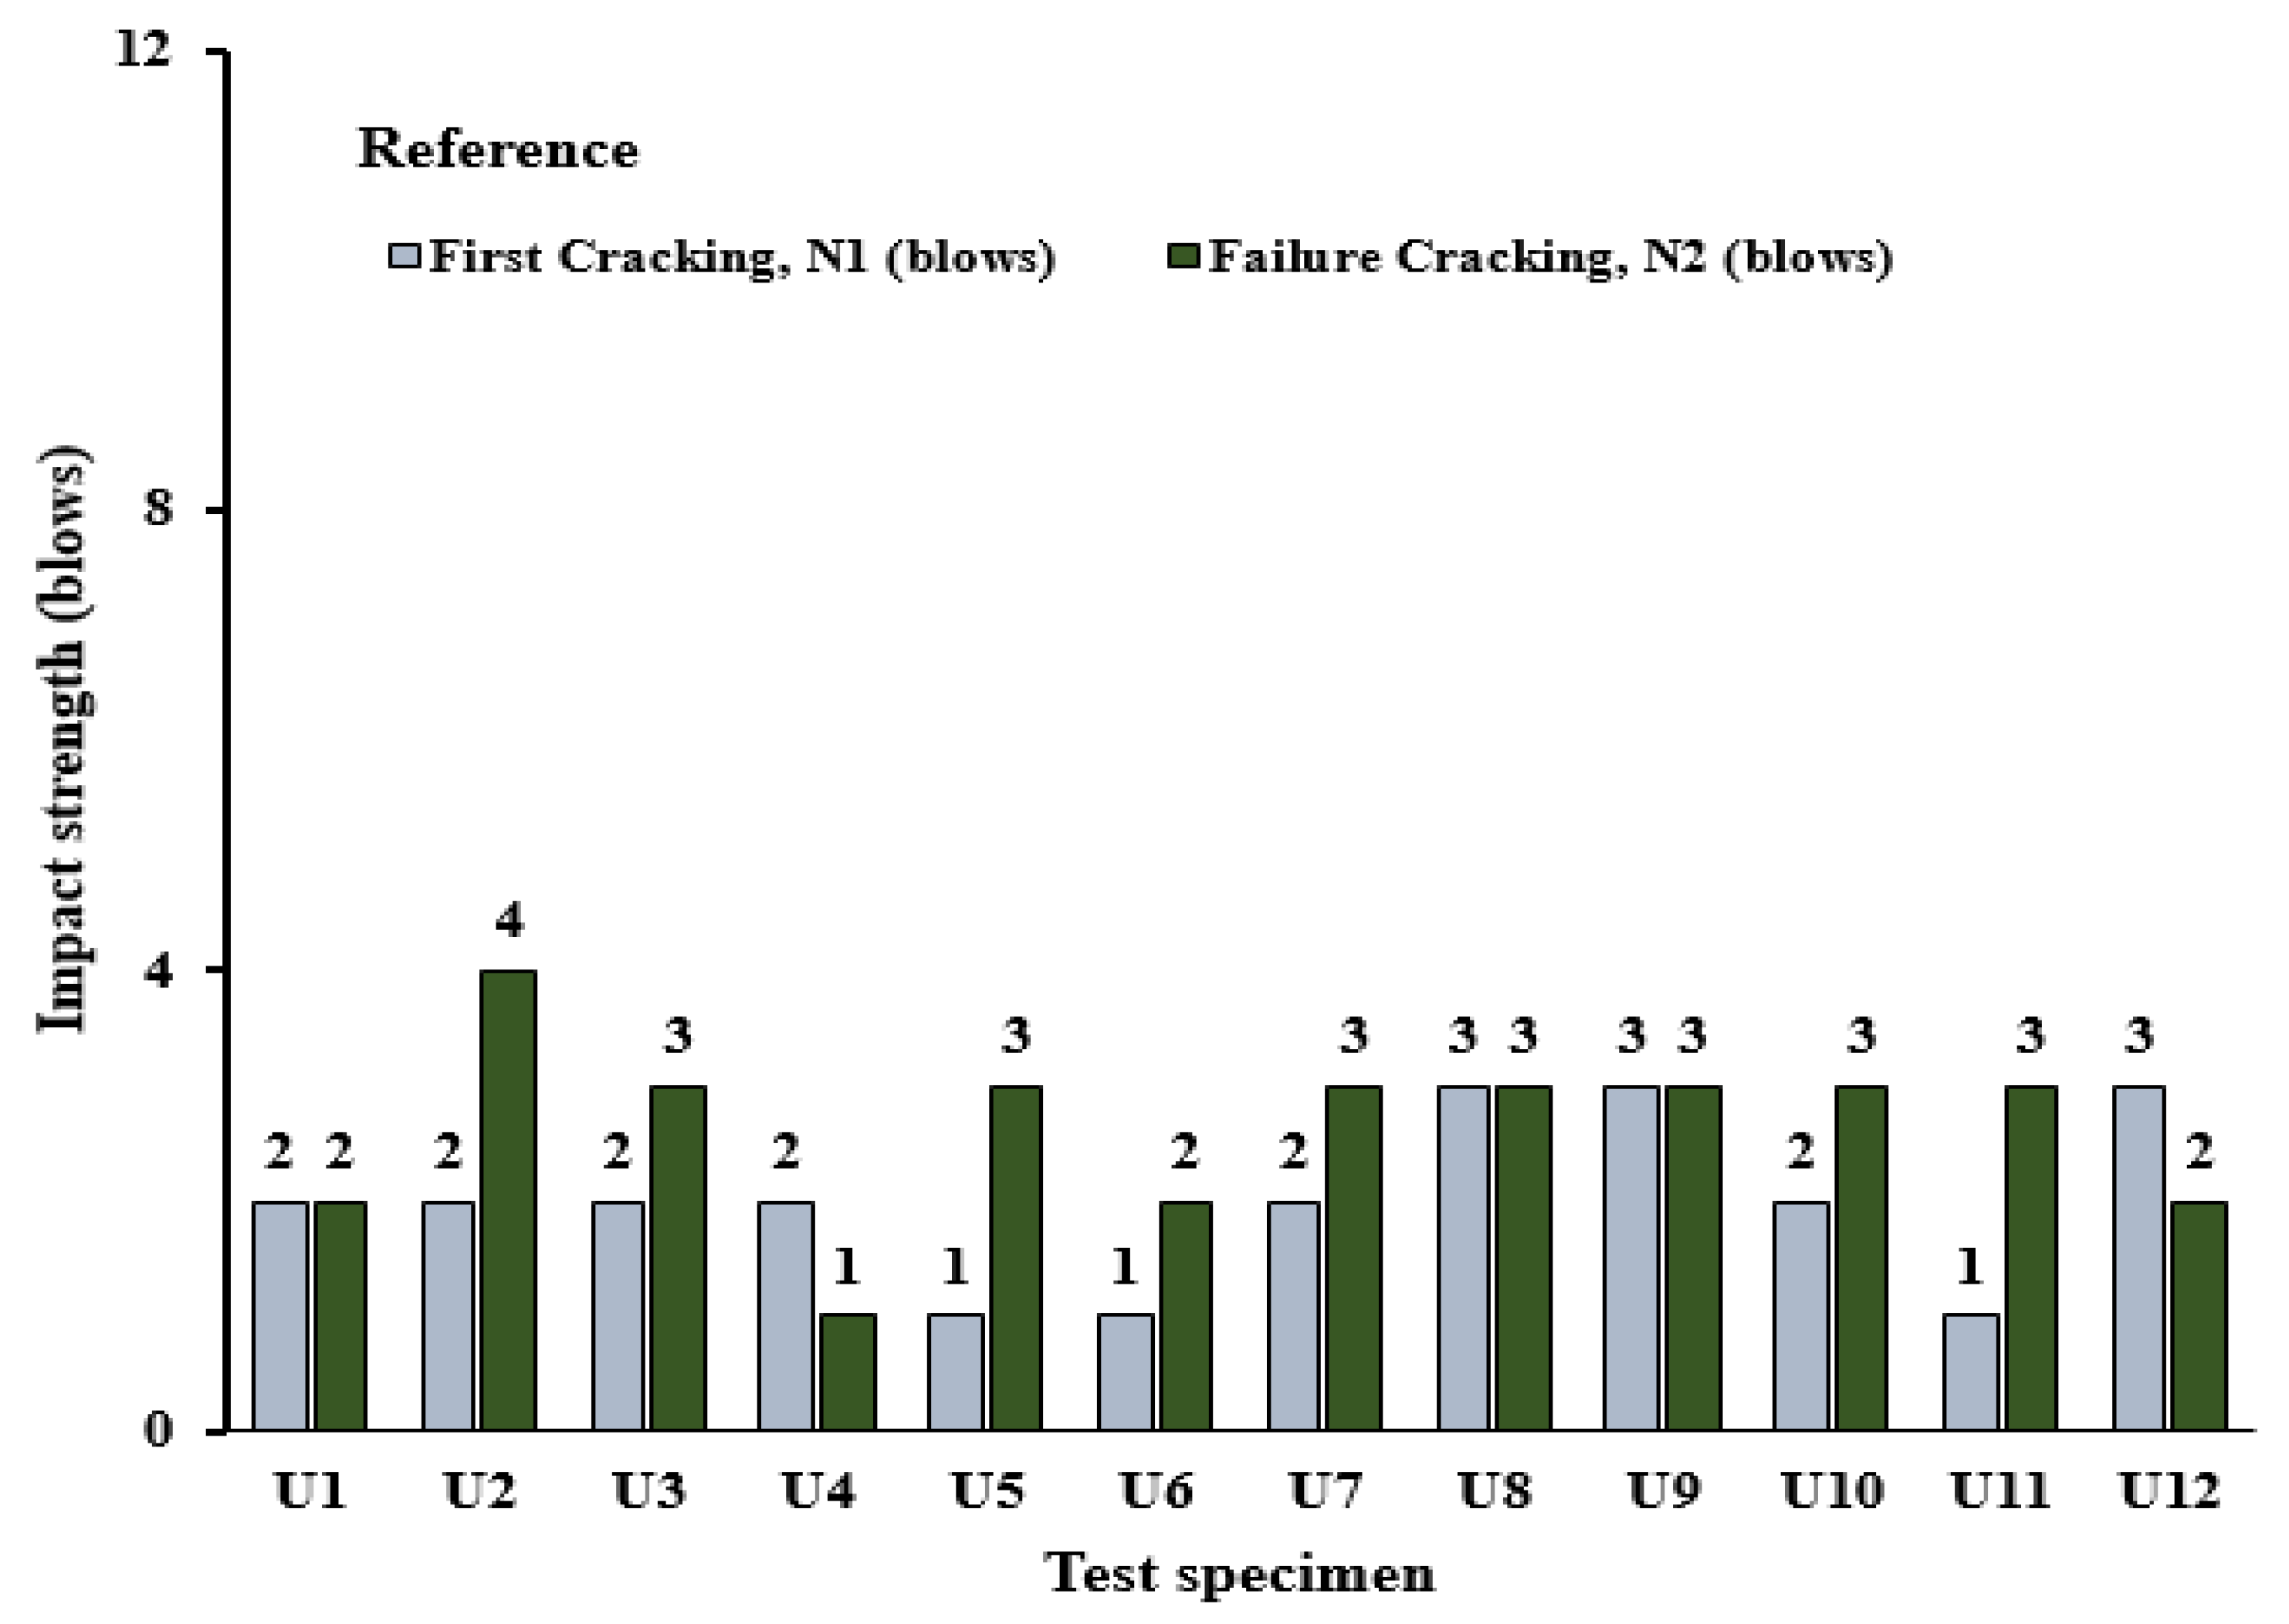
3.1. Failure Mode of Composite U-Shaped Specimens

This study adopted a U-shaped configuration to evaluate the impact resistance of composite concrete material under multiple drop-weight impact tests. This configuration aimed to control crack formation. It was anticipated to occur in a predetermine location on the specimen, conversely to the cylinder specimens used in the ACI 544-2R testing method [43], in which cracks were formed anyplace and any direction on the test specimen. In this study, three major failure patterns, including mid-section crack (MC), crushing foot (CF), and bend section crack (BC), were observed according to the specimen condition. All reference specimens exhibited the typical single crack originated at the bottom surface of the mid-section of the specimen that grew to the top surface, which eventually dissected the specimen into two parts, as shown in Figure 4a. Upon reviewing the previous literature [14,50,51], similar behavior was observed. However, U-shaped fiber-reinforced concrete exhibited minor cracks at the bend sections of the U-shaped specimen, as found in the literature [51], which is consistent with finding of this study, depicted in Figure 4c. Some U-shaped specimens retrofitted with polyurethane grouting material at the top surface also demonstrated major cracks at the bend section. Crushing of footing (CF) of the test specimen characterized by fragmentation was observed in many specimens retrofitted at the top surface or combined top–bottom surface. Due to the retrofitting effect of PU grout at the top or bottom surface, the specimen resisted the high-impact load before the forming major crack instead the occurrence of crushing of footing characterized by fragmentation of the ordinary concrete at the footing section prior to the occurrence of major single crack at the either mid-section or bend section of the U-shaped specimen.

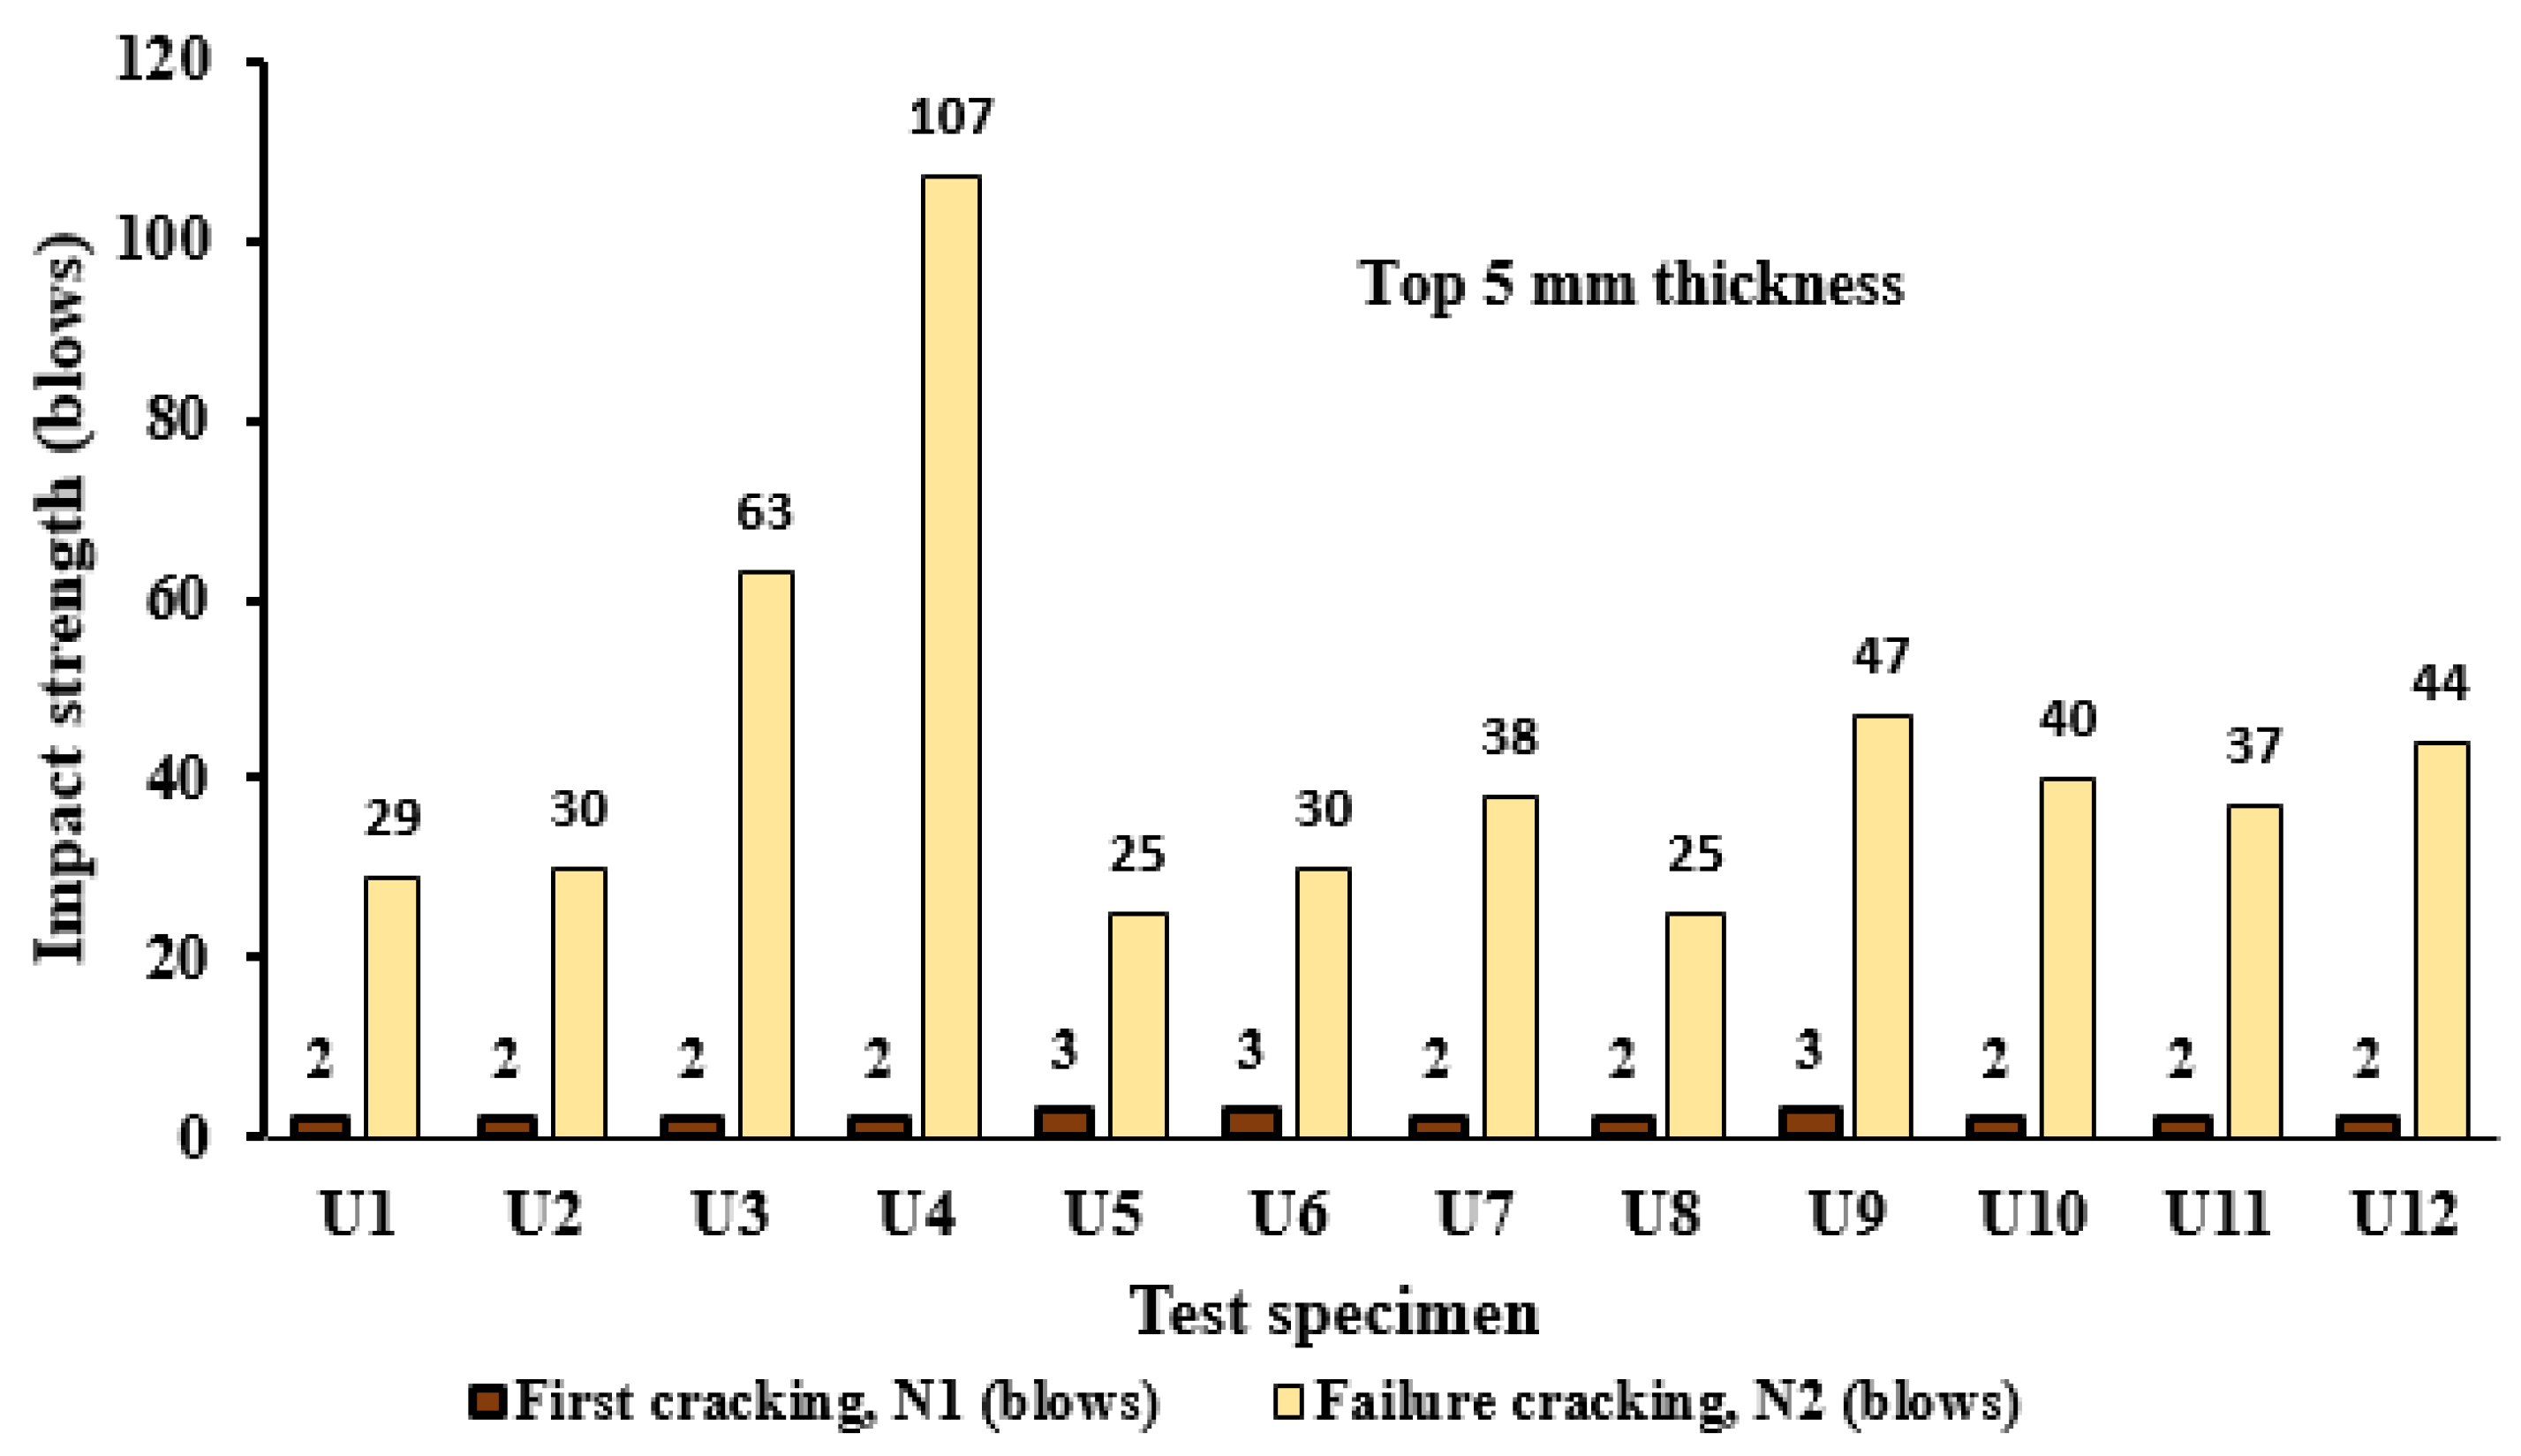
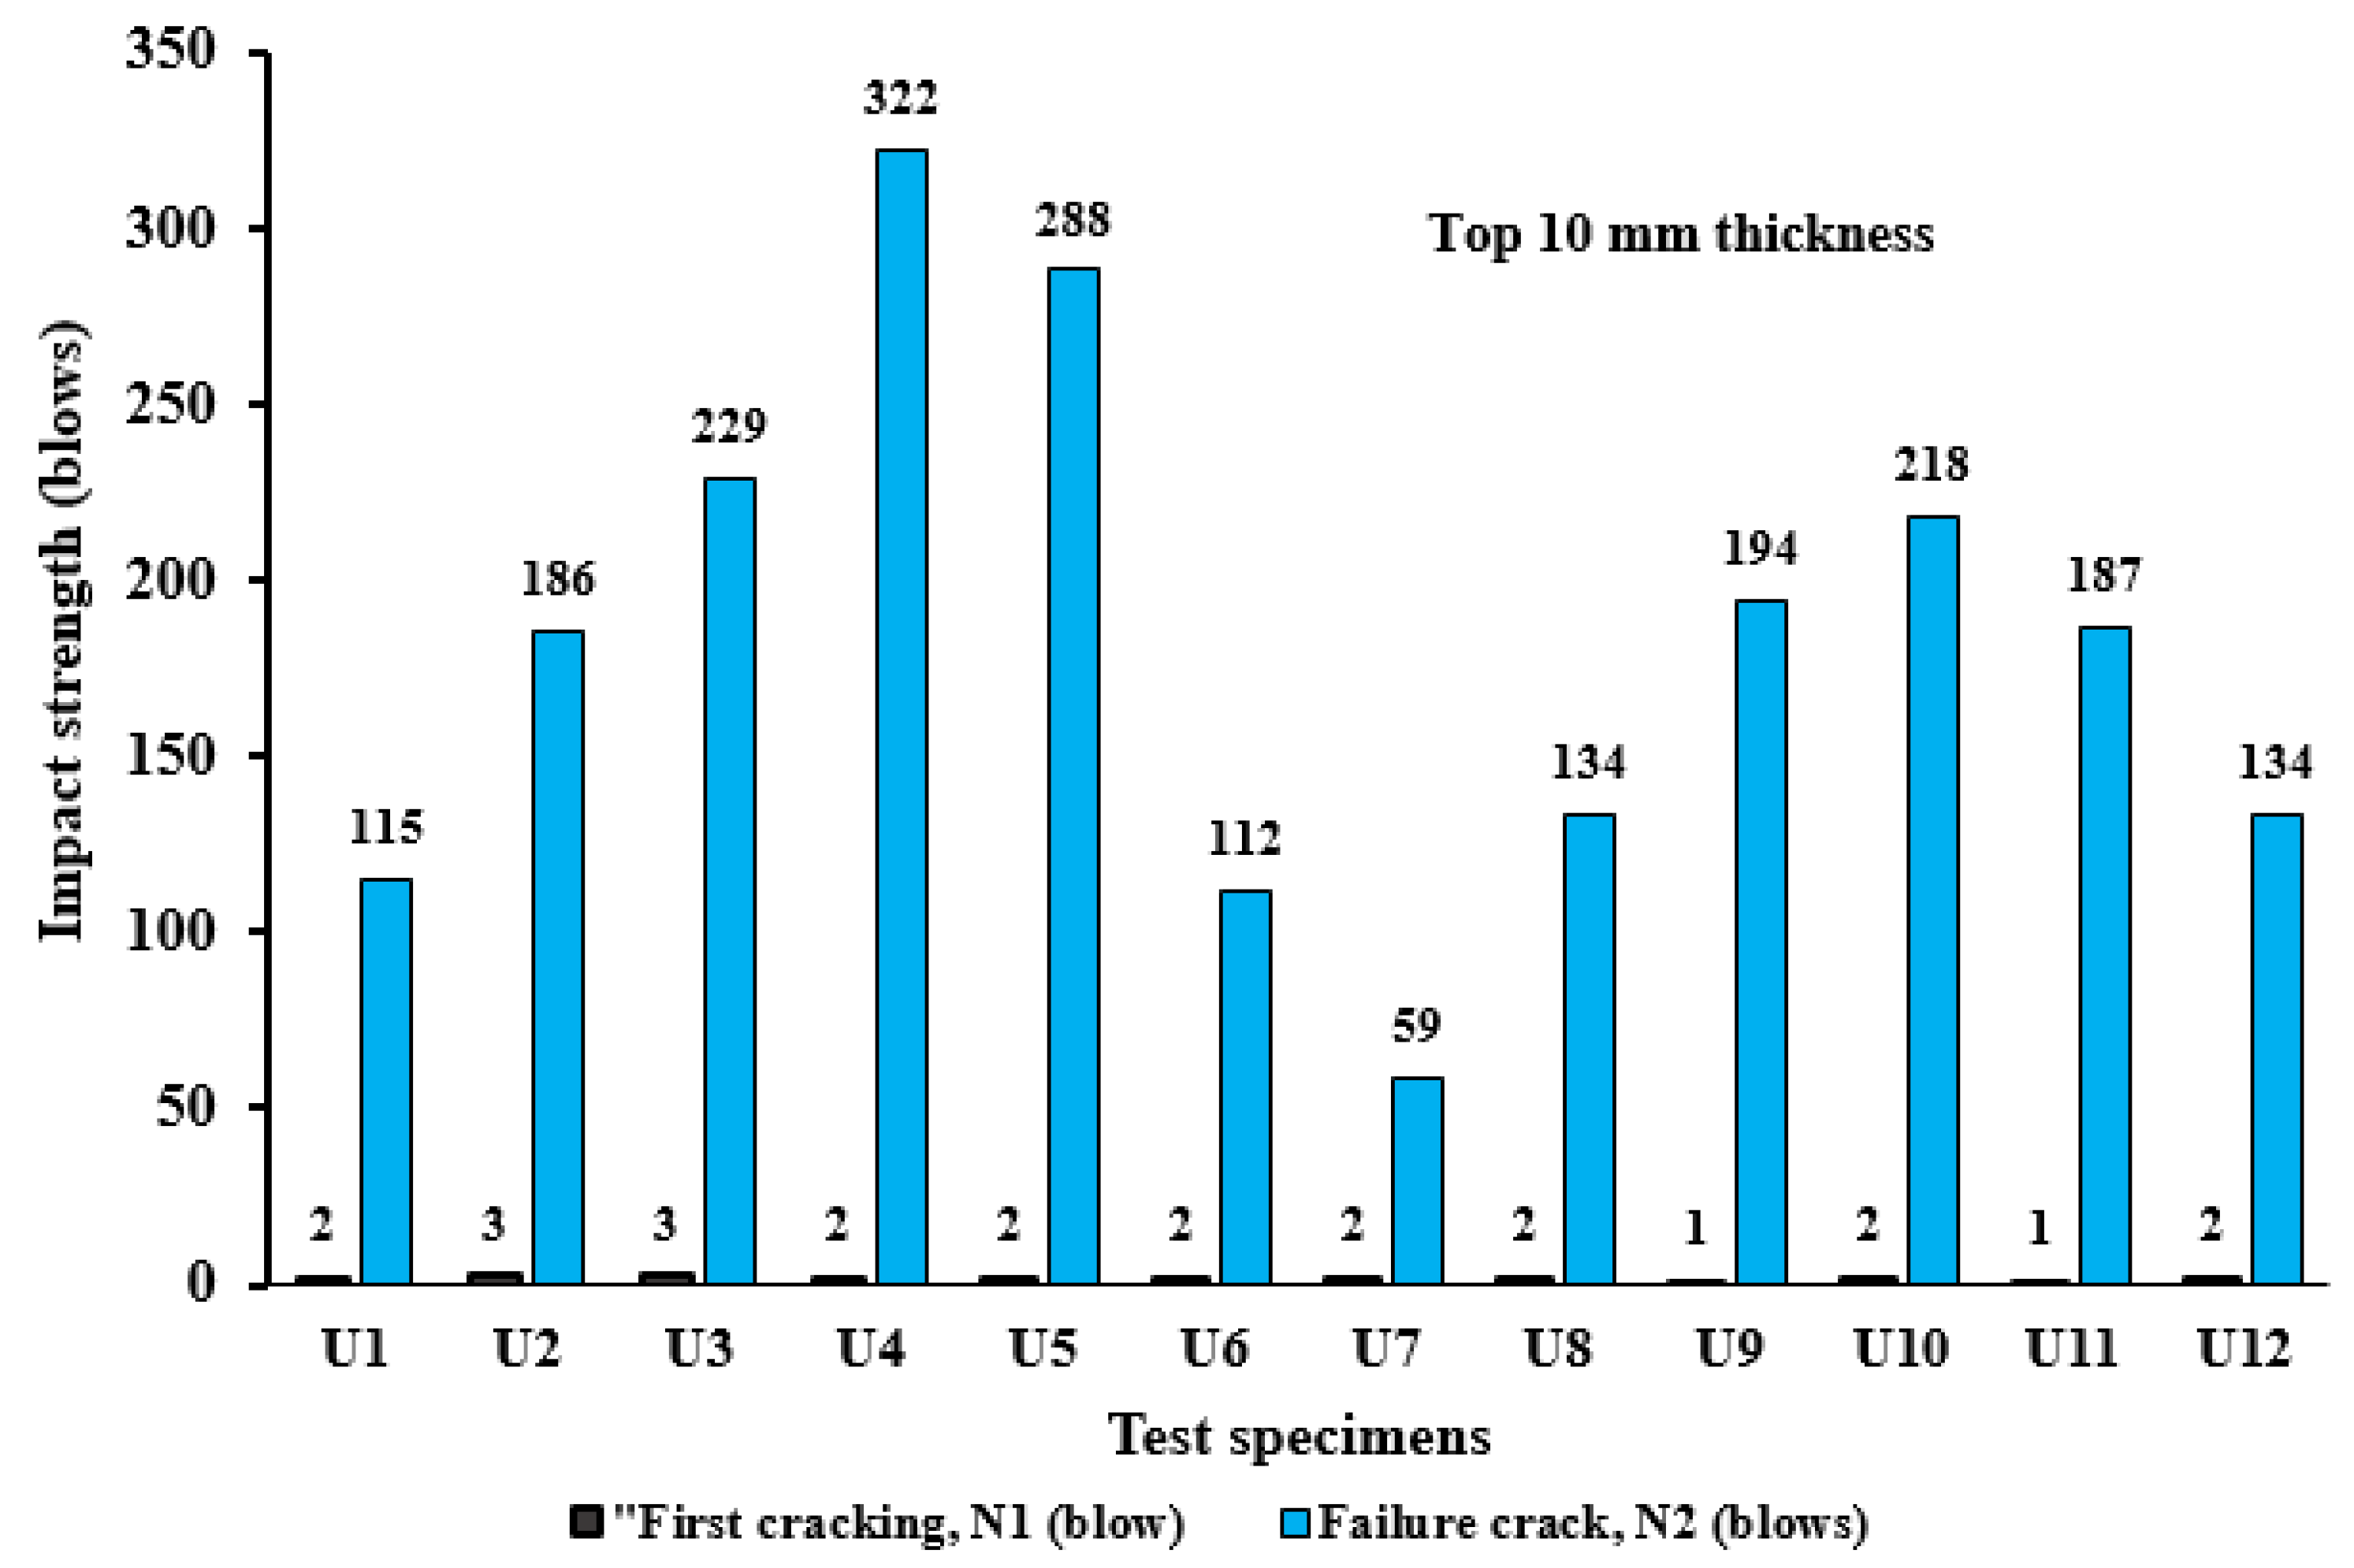
3.2. Impact Resistance of Composite U-Shaped Specimens

The impact resistance of concrete U-shape specimens retrofitted with PU grout material at the two cracking stages, namely the first crack (N1) and failure strength (N2), is depicted in Figure 5, Figure 6, Figure 7 and Figure 8 under four specimen conditions.
Figure 5 shows the impact strength of the reference specimens. In most specimens, initial cracks occurred within the range from one to three drops, and specimens underwent complete failure with an additional one to two drops. However, a significant improvement of impact strength at the post-crack stage was observed in the composite concrete U-shaped specimen due to the influence of PU grout overlaid cast on either the top or bottom surface, as depicted in Figure 5, Figure 6, Figure 7 and Figure 8. U-shaped NC-PUGT5 (specimen with 5 mm overlaid thickness) showed little or no effect on the first crack strength, but a significant increase in the failure strength was observed. The N2 value was in the range from 25 to 107 drops among the test specimens, as shown in Figure 8. Similar behaviors were also observed with specimens retrofitted with 10 mm overlaid thickness at the top surface (NC-PUGT10), with the number of drops to cause first crack not exceeding three drops among all specimens. The post-crack strength was drastically improved with a range from 59 to 322 drops exhibited by U7 and U4, respectively (see Figure 7). These results indicated that the retrofitting effect of PU grouting, regardless of the thickness, had little or no effect on the first crack stage, as the overlaid was cast on the compression surface of the specimen.
Conversely, U-shaped NC-PUGTB5 (specimens with 5 mm overlaid thickness at the top and bottom surface) showed great effects at both cracking stages (N1 and N2). The bottom overlaid had prevented an early occurrence of the initial crack. U10 and U11 revealed the lowest number of drops to cause the first crack, with recorded values of 8 and 7, respectively. U5 exhibit up to 28 drops before the initial crack occurred (see Figure 8). Moreover, these specimens also revealed improved impact strength at the failure stage, and specimens endured high repeated impact loads before complete failure, as noted in Figure 8 A minimum and maximum number of 88 drops and 213 drops were recorded for U7 and U12, respectively. This result showed that retrofitting effect at both top-to-bottom surfaces was more effective in improving the impact resistance of concrete. Under this configuration, both the tension and compression zone had been taken care of by the PU grout material, which had viscoelastic properties.

4. AI-Based Model Result

AI-based models were employed to predict the three types of failure modes of U-shaped NC-PUG specimens tested under multiple drop-weight impact programs using the DT, NB, and KNN algorithms. The input parameters included the first crack strength (N1 blows), failure strength (N2 blows), PU thickness (T mm), mid-span deflection (λ mm), and maximum load (P kN). The targets were the three types of failure modes: mid-section crack (MC), crushing of footing (CF), and bend-section crack (BC). Table 3 presents the statistical analysis of the experimental data. The Kurtosis and Skewness of the data were within the acceptable range. The correlation between the input and the target variables is displayed using the correlation matrix in Table 4. The result indicated that the PU thickness had highest correlation value with the output parameters. All the input variables had a reasonable correlation with the target failure modes. The experimental data were divided into training (70%) and testing (30%) data to test the developed model performance. The models were implemented in the MATLAB version: 9.13.0 (R2022b) simulation interface. A five-fold value was employed to prevent the overfitting problem.
The effectiveness of the generated models was examined through a confusion matrix. A square matrix represented the relation between the experimental and predicted failure modes. The off-diagonal portions were correctly predicted by the ML algorithm, and the diagonal elements of the confusion matrix defined the real classified failure mode. Additionally, performance metrics, including recall, accuracy, and precision, assessed the effectiveness of the confusion matrix. The proportion of correctly predicted failure modes for all three, as seen in the square matrix’s principal diagonal, was defined as the model’s accuracy. The confusion matrix’s fourth column described the precision as the percentage of each projected failure mode’s accuracy prediction. A recall was the percentage of an observed failure mode correctly predicted, as seen in the confusion matrix’s fourth row.
Figure 9 presents the performance of the trained models using a confusion matrix. All the trained models could predict the three types of failures with an accuracy greater than 95%. The KNN model predicted the failure modes with 3.1% higher accuracy than the DT and NB models. The performance of the developed DT, NB, and KNN models was tested using 30% testing data and presented in Figure 10. All the developed models could predict the failure modes with 100% accuracy. The excellent performance of the models was related to the performance of the developed models and the excellent correlation of the input variables with the target failure modes. However, more data are needed to validate further the developed models’ performance.

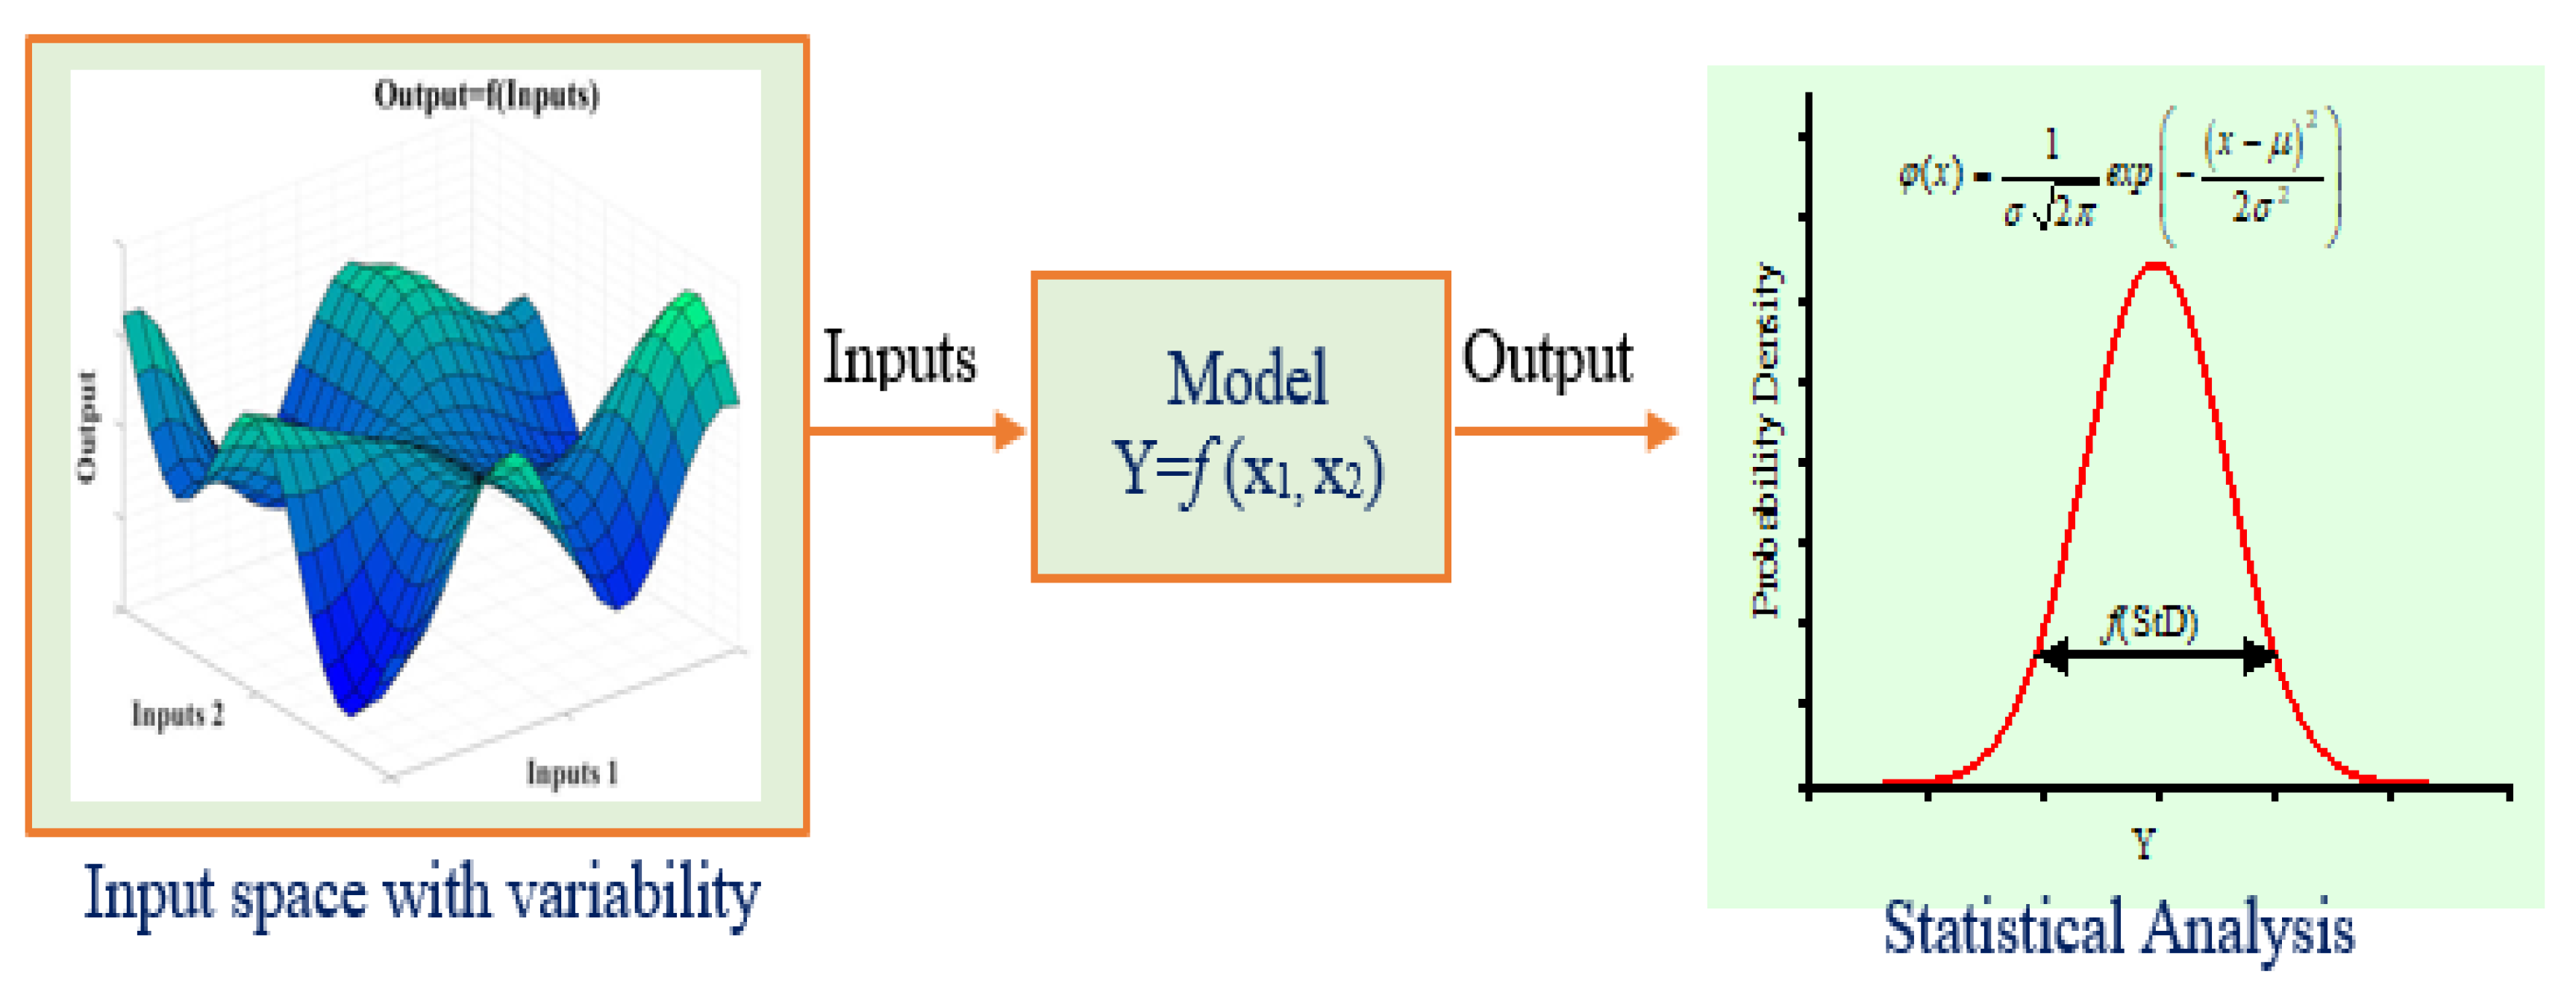
4.1. Monte Carlo Simulation (MCS)

MCS techniques are commonly used by researchers and construction industries to evaluate the divergence of the input space. The technique defines the divergence of the output result through statistical prediction model analysis. The MCS technique was successfully used in the probabilistic analysis of concrete members under shear stress [52], randomly estimating the pore effect and the size of the aggregate [53], material characteristics, and geometric size of reinforcement embedded in UHPC [54]. The Monte Carlo method is particularly dependable and efficient when using numerical AI models to determine how input variability affects output outcomes. [55,56]. The main idea behind the Monte Carlo approach is to simulate a condition in the input space repeatedly while determining the related output using a simulation model. [57,58]. Using a two-dimensional input space and a common probability distribution, Figure 11 demonstrates the fundamental concept of the Monte Carlo method. This section covered the statistical convergence and probability density function.
The performance of the developed AI models was evaluated using the MCS method. The random sampling process typically impacts how well the models perform in training and testing. In order to evaluate the three AI models strength, a Monte Carlo simulation was run. For the simulation to produce more representative results, acceptable instances were used. MSC was used in this study to evaluate the KNN algorithm under stochastic conditions. Five hundred (500) runs of MSC were conducted under five uncertainty conditions, namely So = 0.05, 0.0, 0.15, 0.20, and 0.25. The performance of the KNN in predicting the failure mode was evaluated in terms of accuracy, precision, and recall. The testing outcomes were used for model evolution because they directly reflected the algorithm’s performance.
Table 5 presents the performance of the KNN under different uncertainty conditions. The min, max, mean, and standard deviation of the accuracy, precision, and recall of each failure mode are presented, and it can be observed that the accuracy of the KNN algorithms was not affected by increasing the uncertainty. The maximum accuracy of the model under each uncertainty was 100%, and the average mean accuracy was 95.8%, which shows the robustness of the developed model. The average mean precision of the MC, CF, and BC failure modes was 99.8, 91.7, and 94.6%, respectively. The average mean of the failure mode recall was 99.9, 91.6, and 94.5%, respectively.

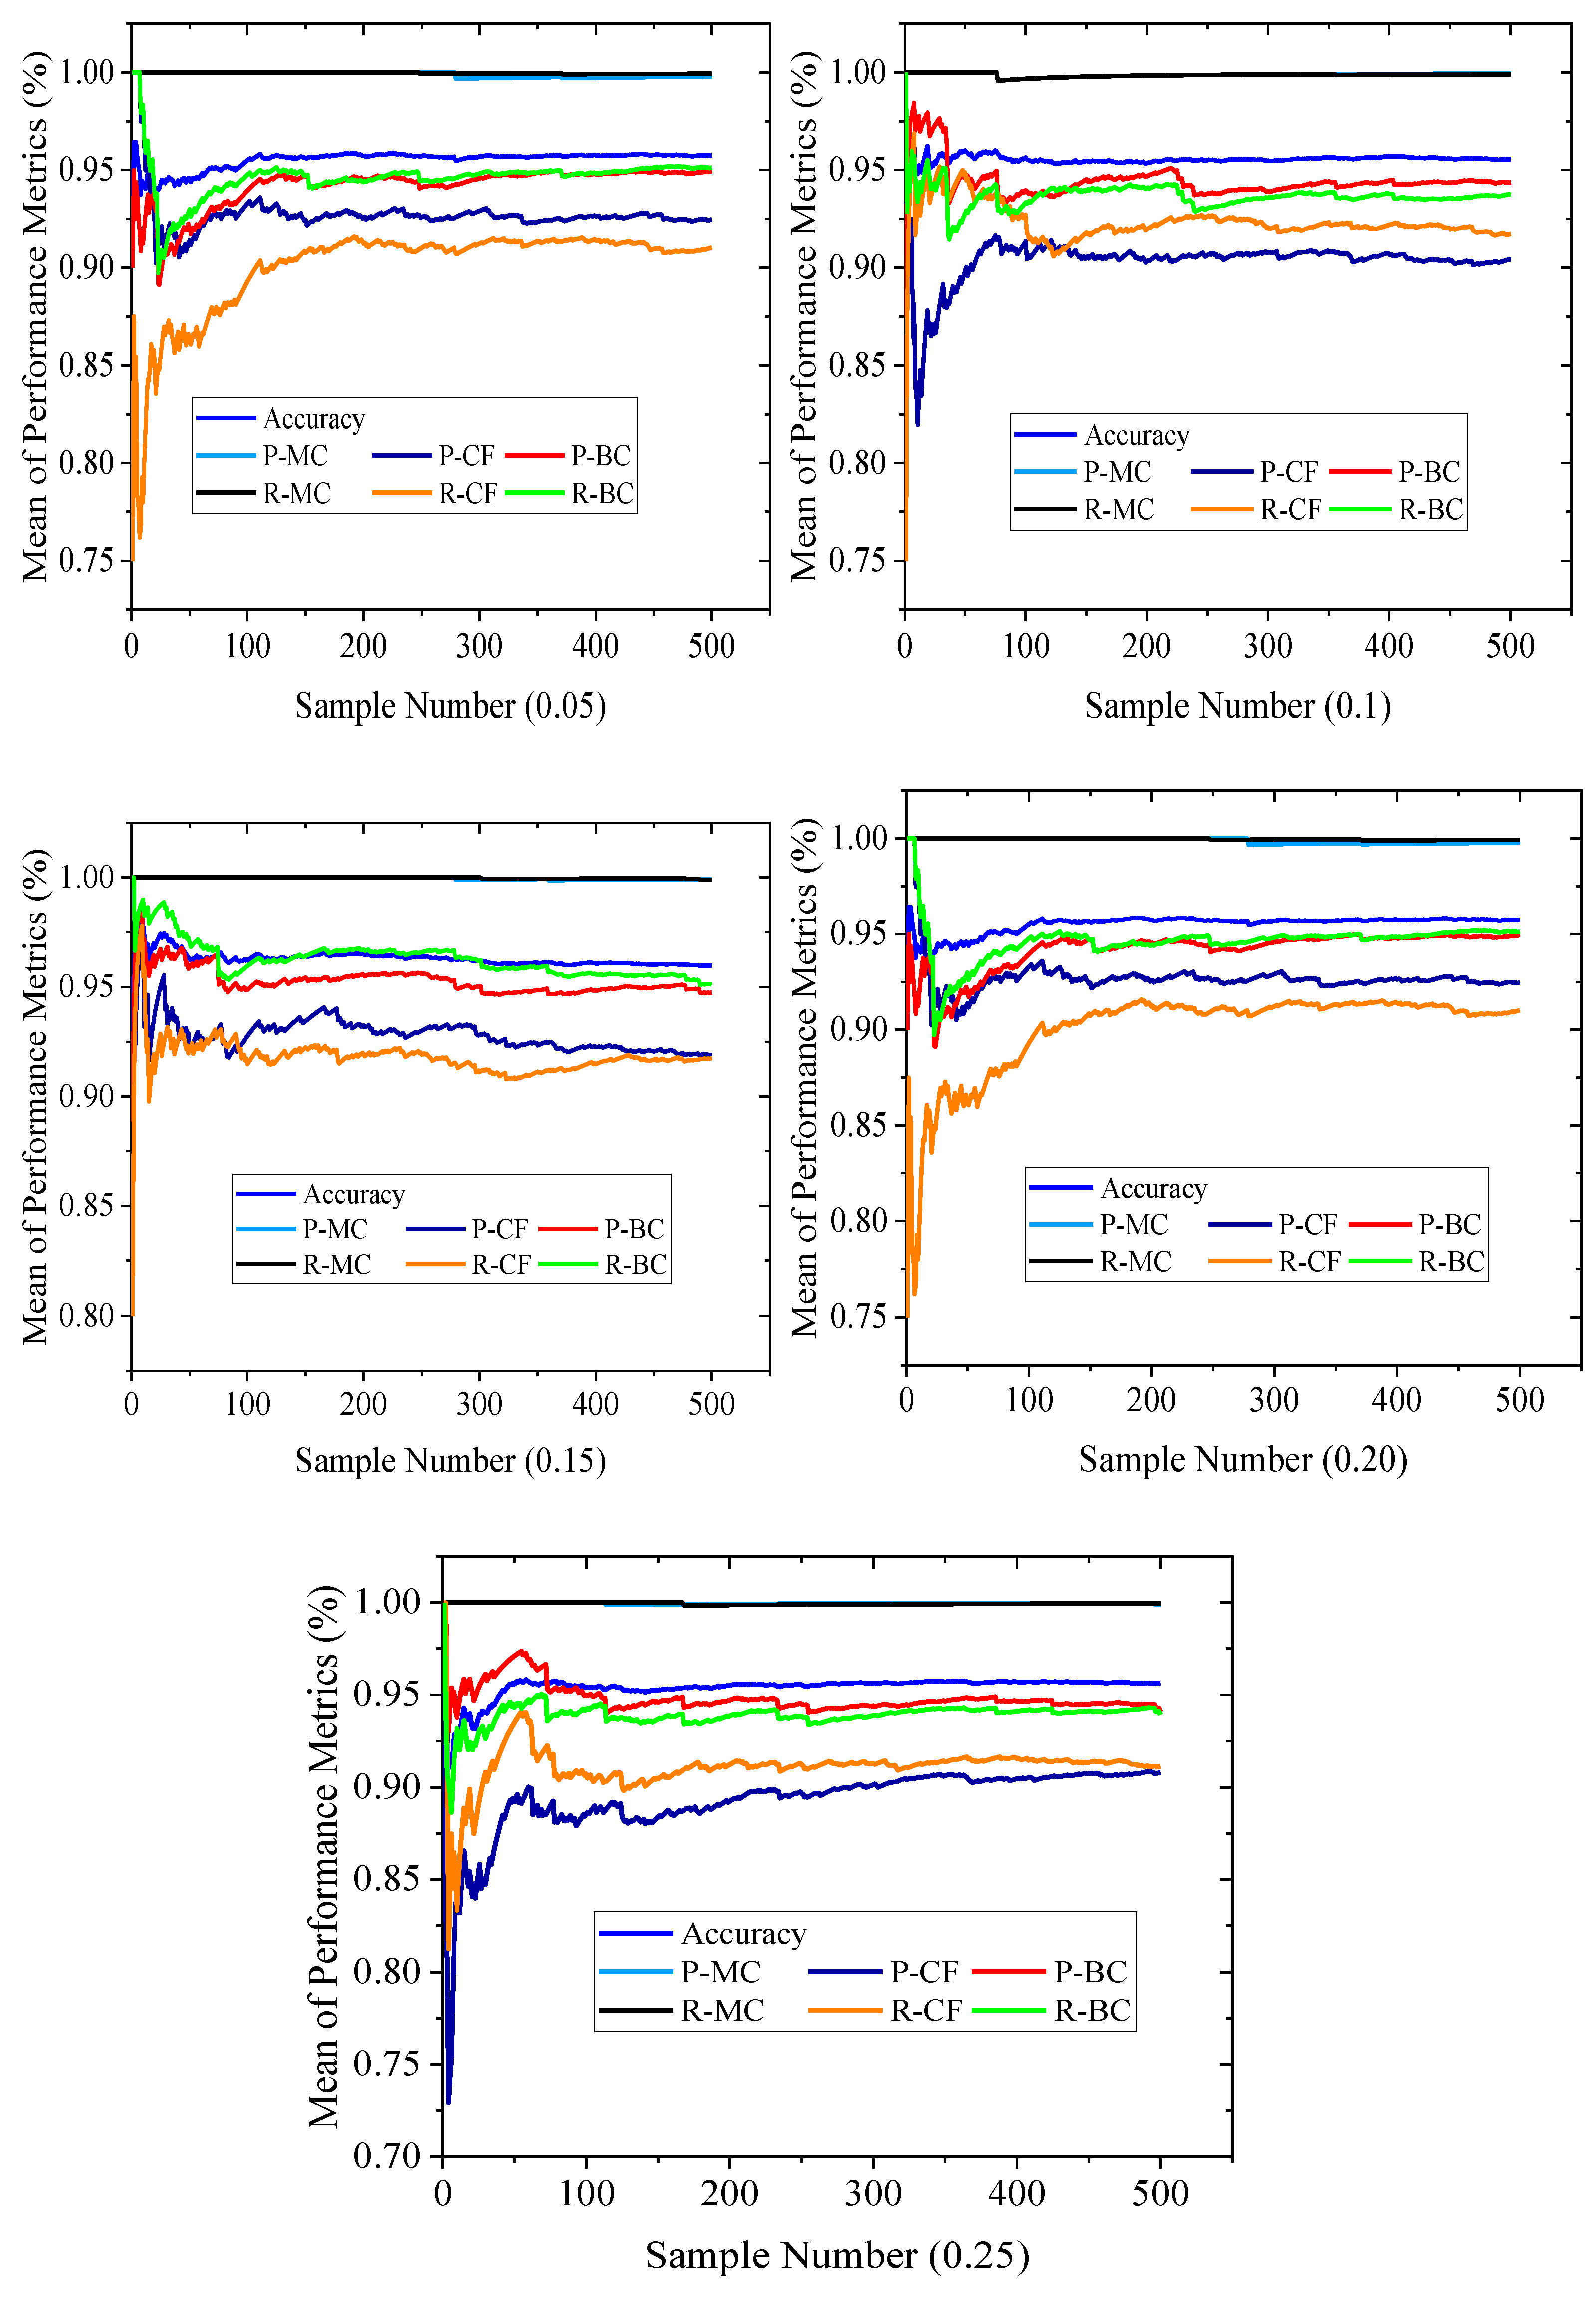
4.2. Convergence Plot

The convergence analysis of the model evaluation metrics, namely the accuracy, precision, and recall of the KNN on each failure mode, was conducted under five different uncertainties. The convergence criteria of the KNN were analyzed using Equation (7).
f ( n M C ) = 1 Y ¯ 1 n M C i = 1 n M C Y i
where, Y is the random variable, and Y ¯ is the average value of Y. The nMC represents the number of MCS runs.
The convergence of KNN under So = 0.05, 0.10, 0.15, 0.20, and 0.25 is presented in Figure 12. The precision and recall of mid-crack (MC) failure mode converged within the first 100 runs of MCS, while the precision and recall of the crushing foot (CF) and bend-crack (BC) failure modes converged within first 300 runs. The accuracy of the failure modes converged between 100 and 200 runs. Therefore, 300 runs were adequate to meet the convergence requirements.

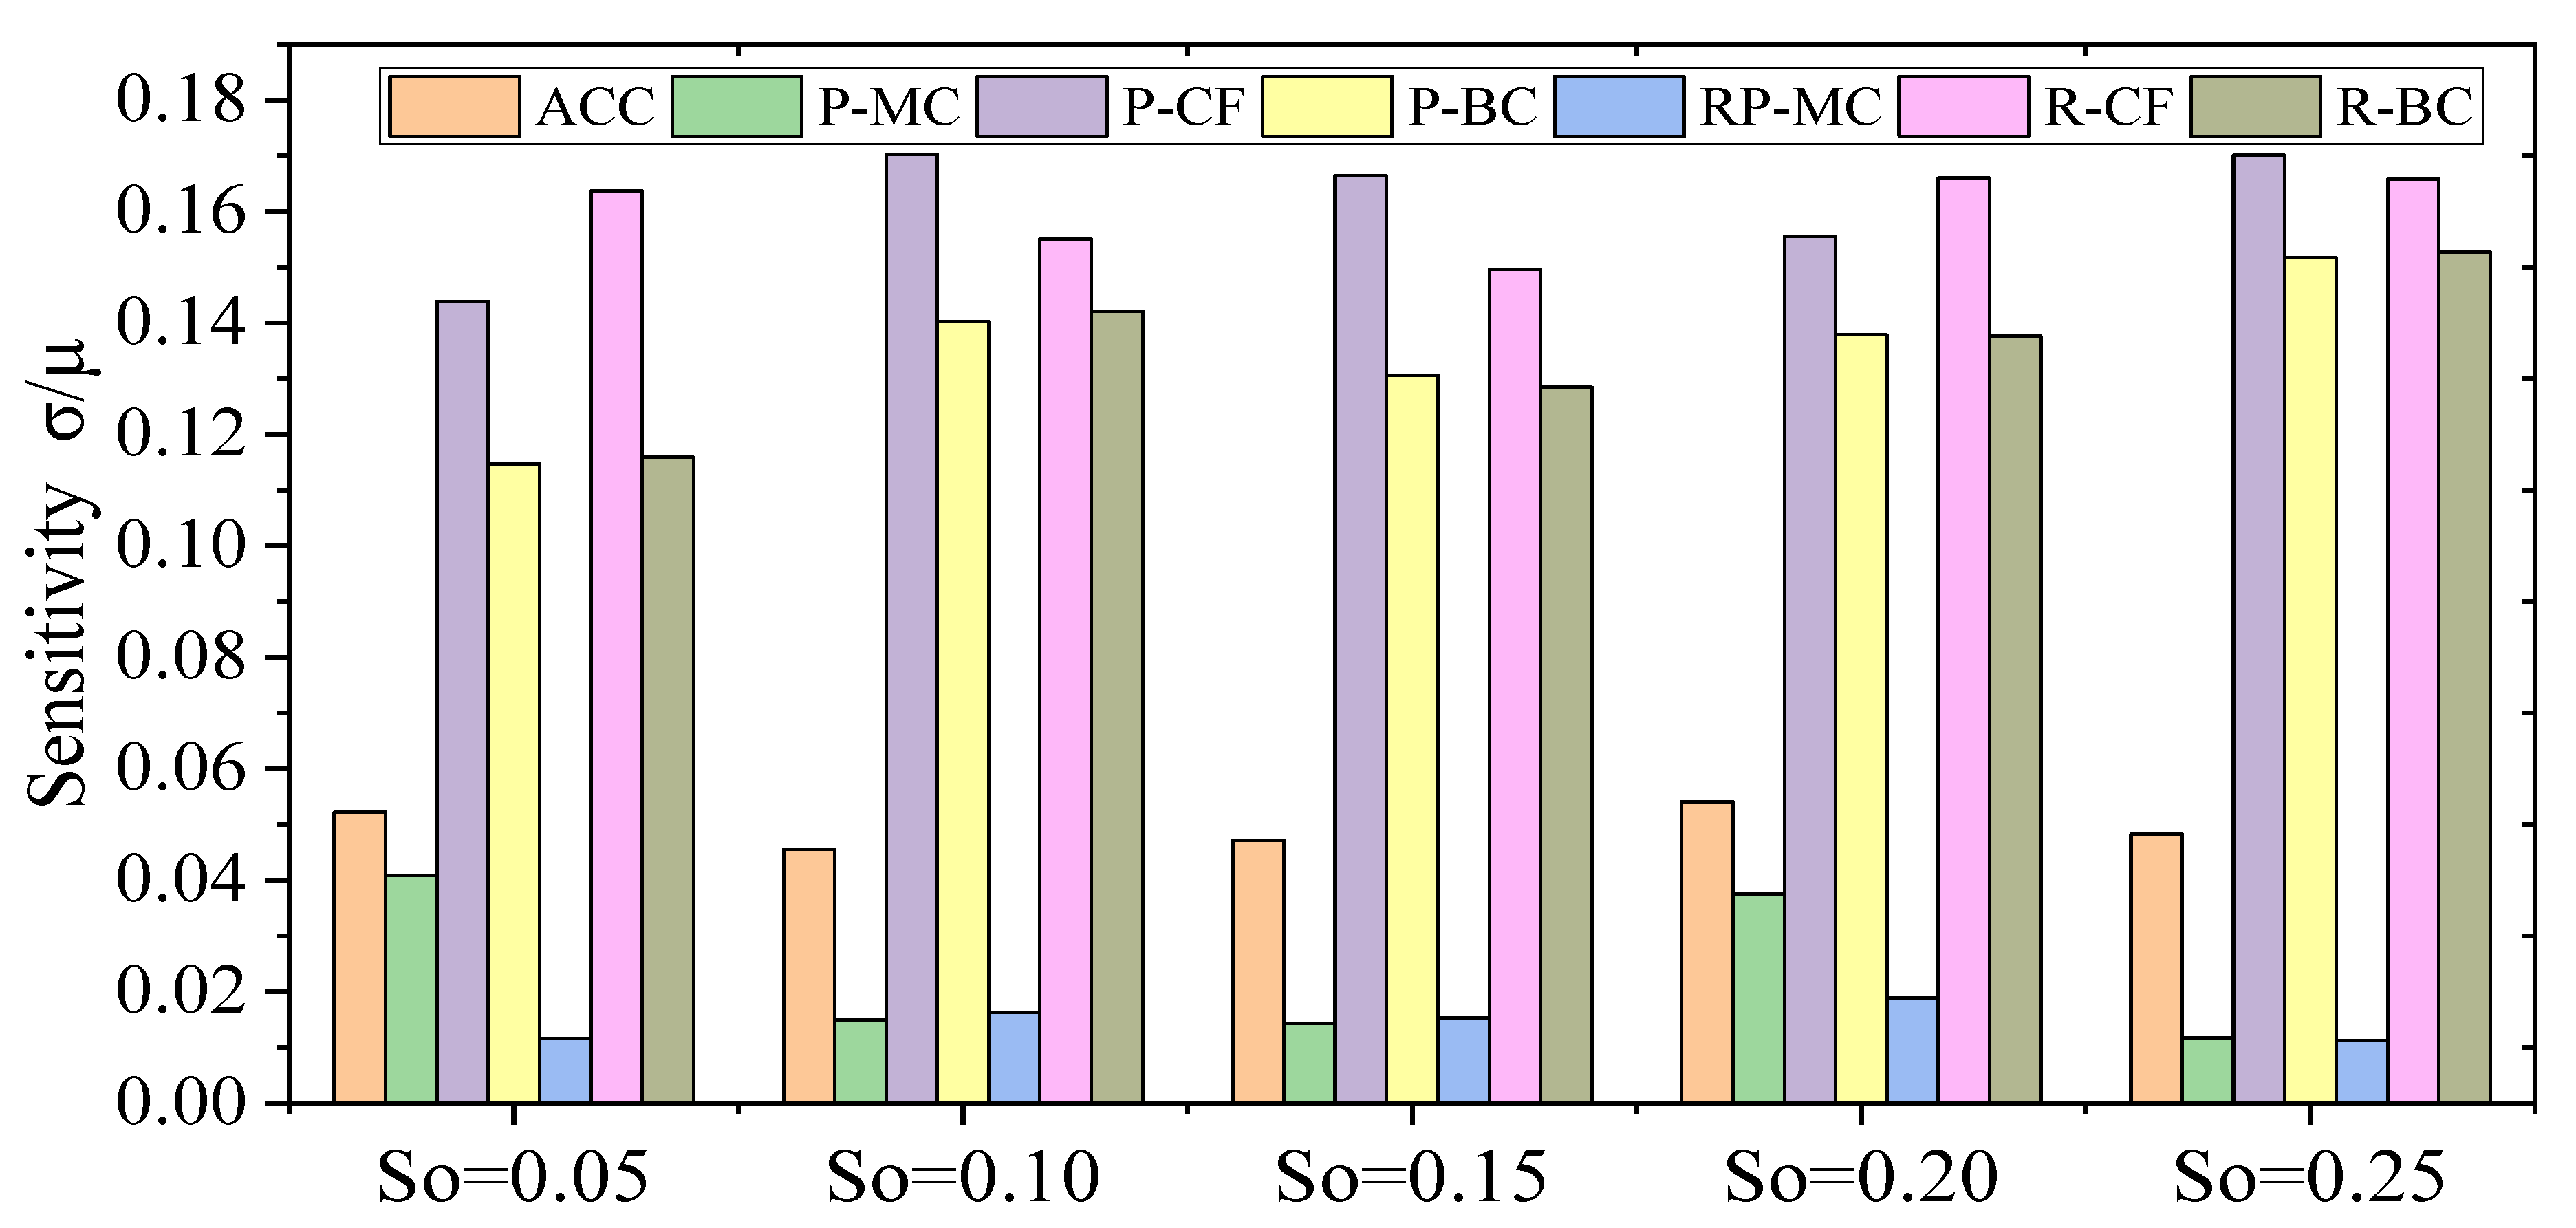
4.3. Sensitivity Analysis

The sensitivity of the KNN on the uncertainty conditions was investigated using the equation:
C V = σ μ
where σ and µ are the standard deviations and mean values of the accuracy, precision, and recall of the KNN model, and the effect of different degrees of uncertainty, s0 = 0.05, 0.10, 0.15, 0.20, and 0.25, were tested. Figure 13 presents the sensitivity of KNN on the different degrees of uncertainties in terms of accuracy, precision, and recall. The CV of the KNN accuracy when s0 = 0.05, 0.10, 0.15, 0.20, and 0.25 was 0.052, 0.046, 0.047, 0.054, and 0.048, respectively. The degree of uncertainties had less effect on the effect accuracy of the KNN model. Similar results were obtained in terms of precision and recall. Therefore, the results indicate the robustness of the KNN model.

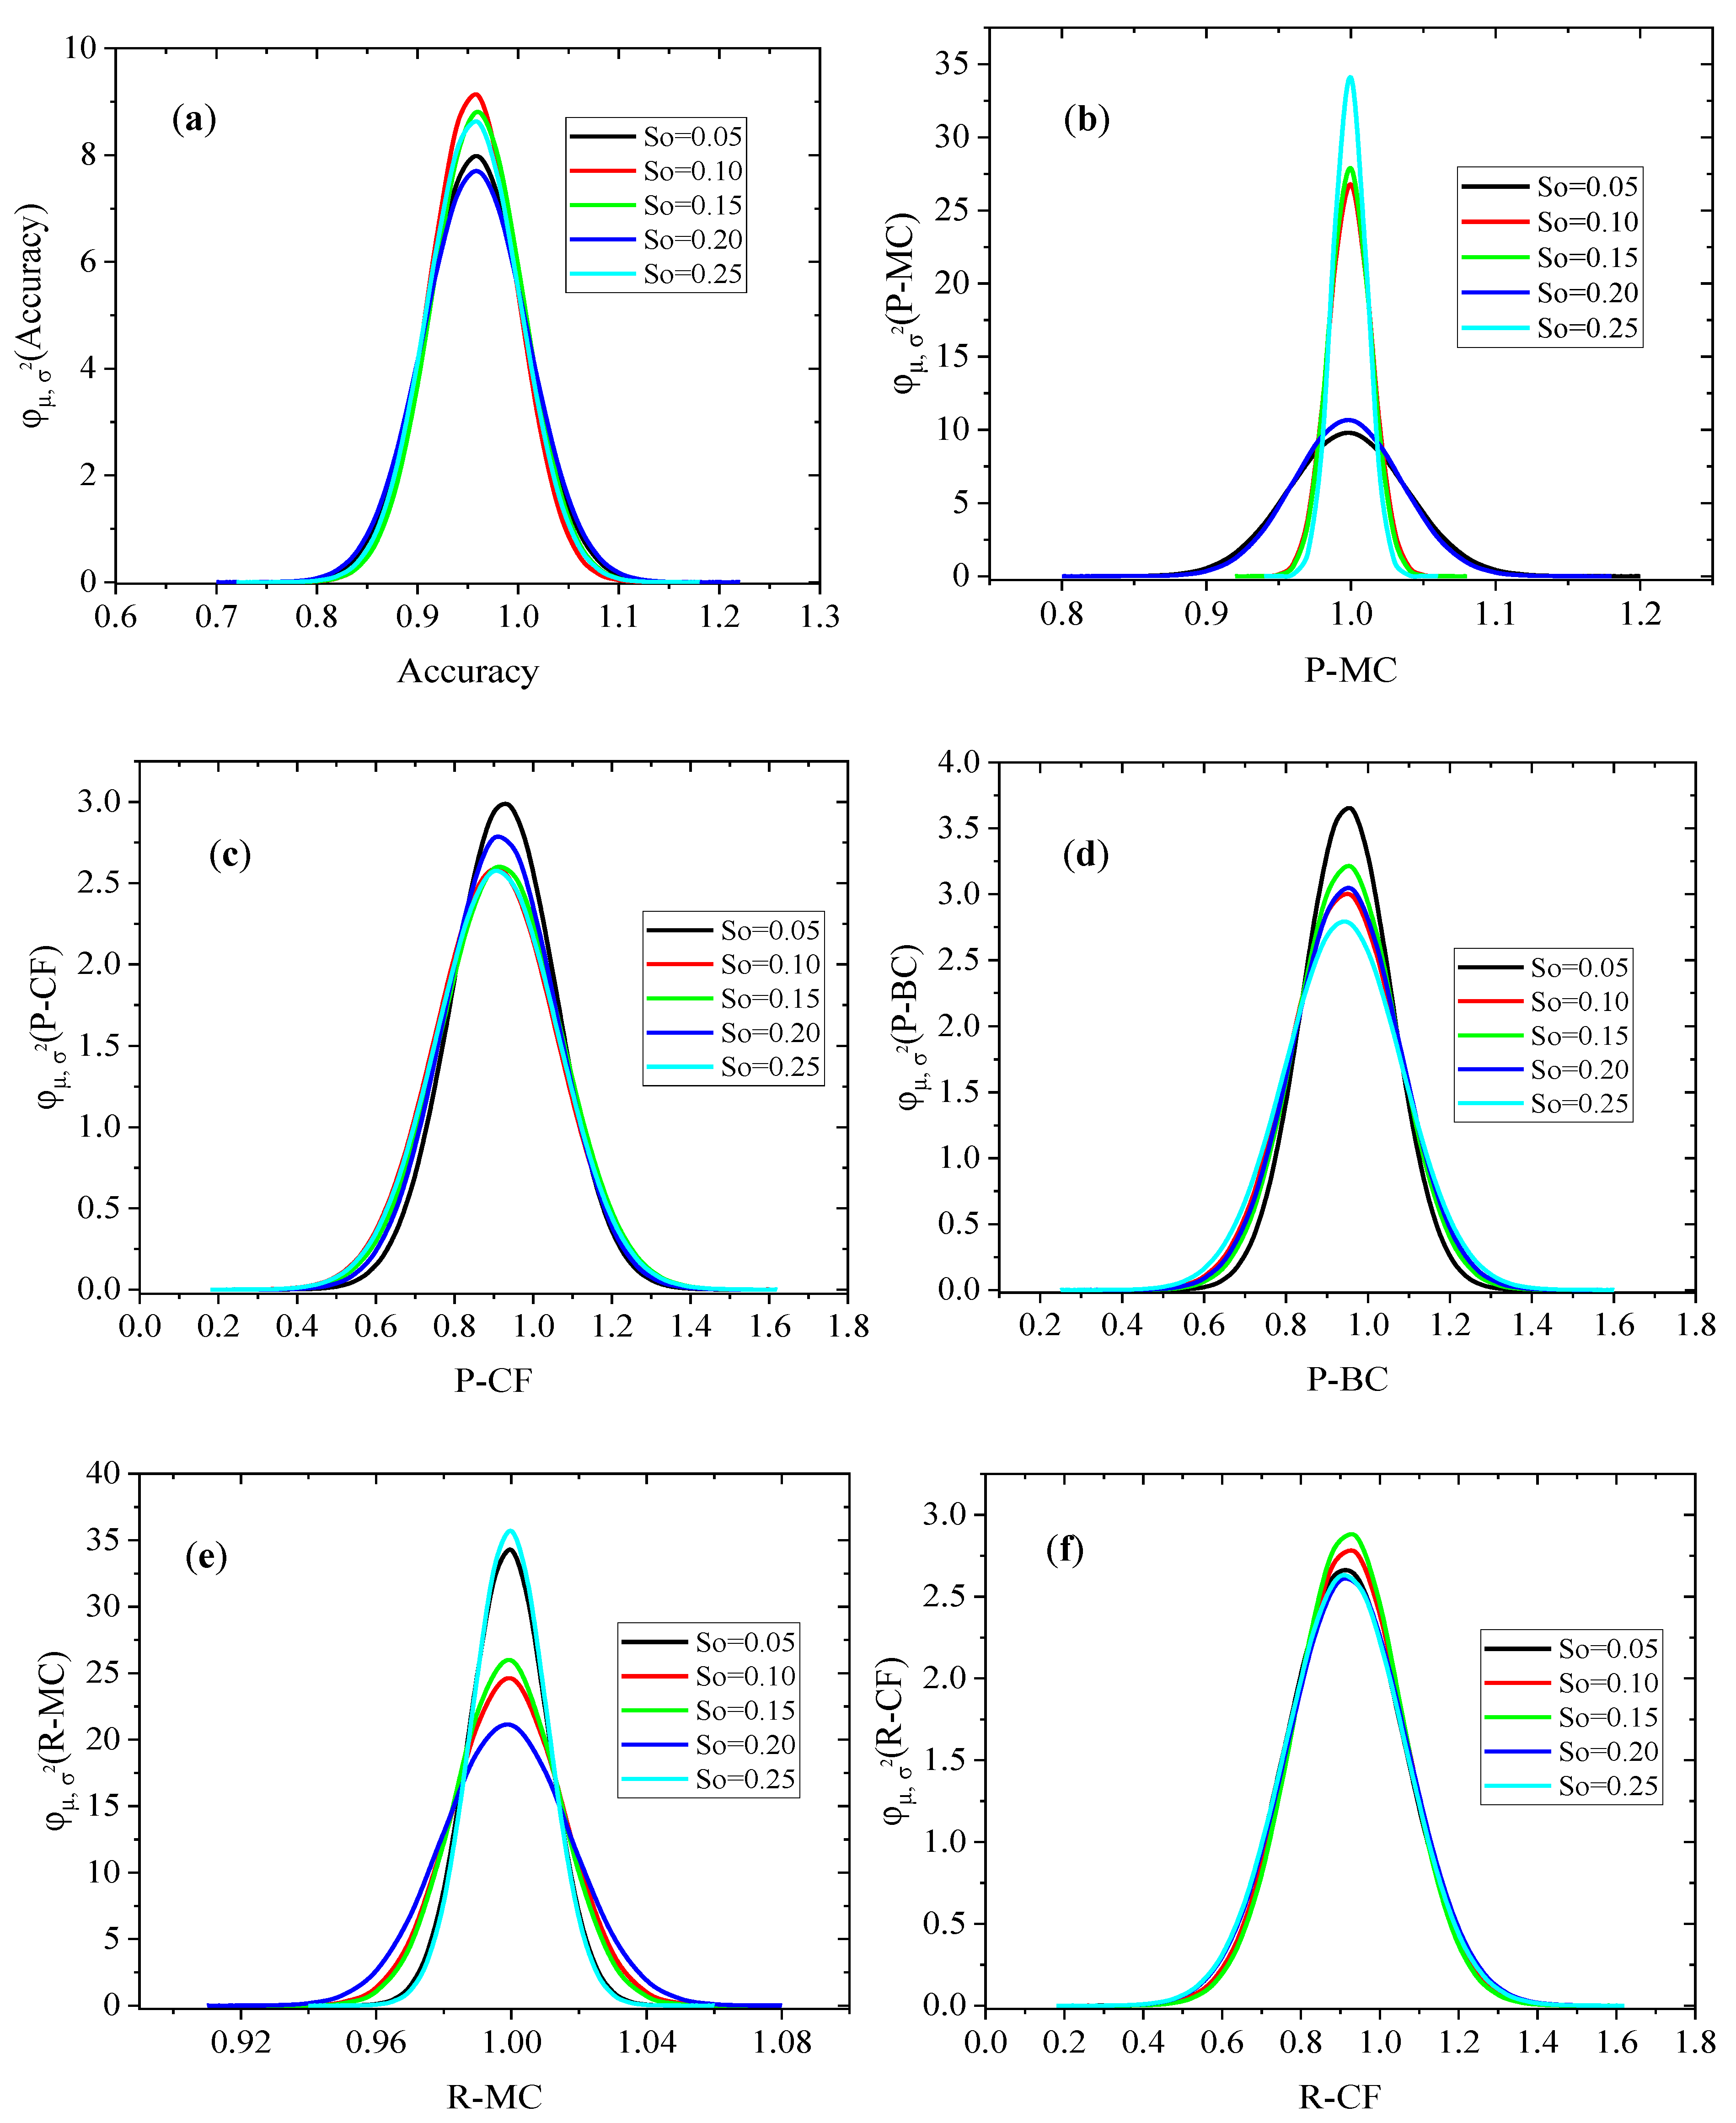
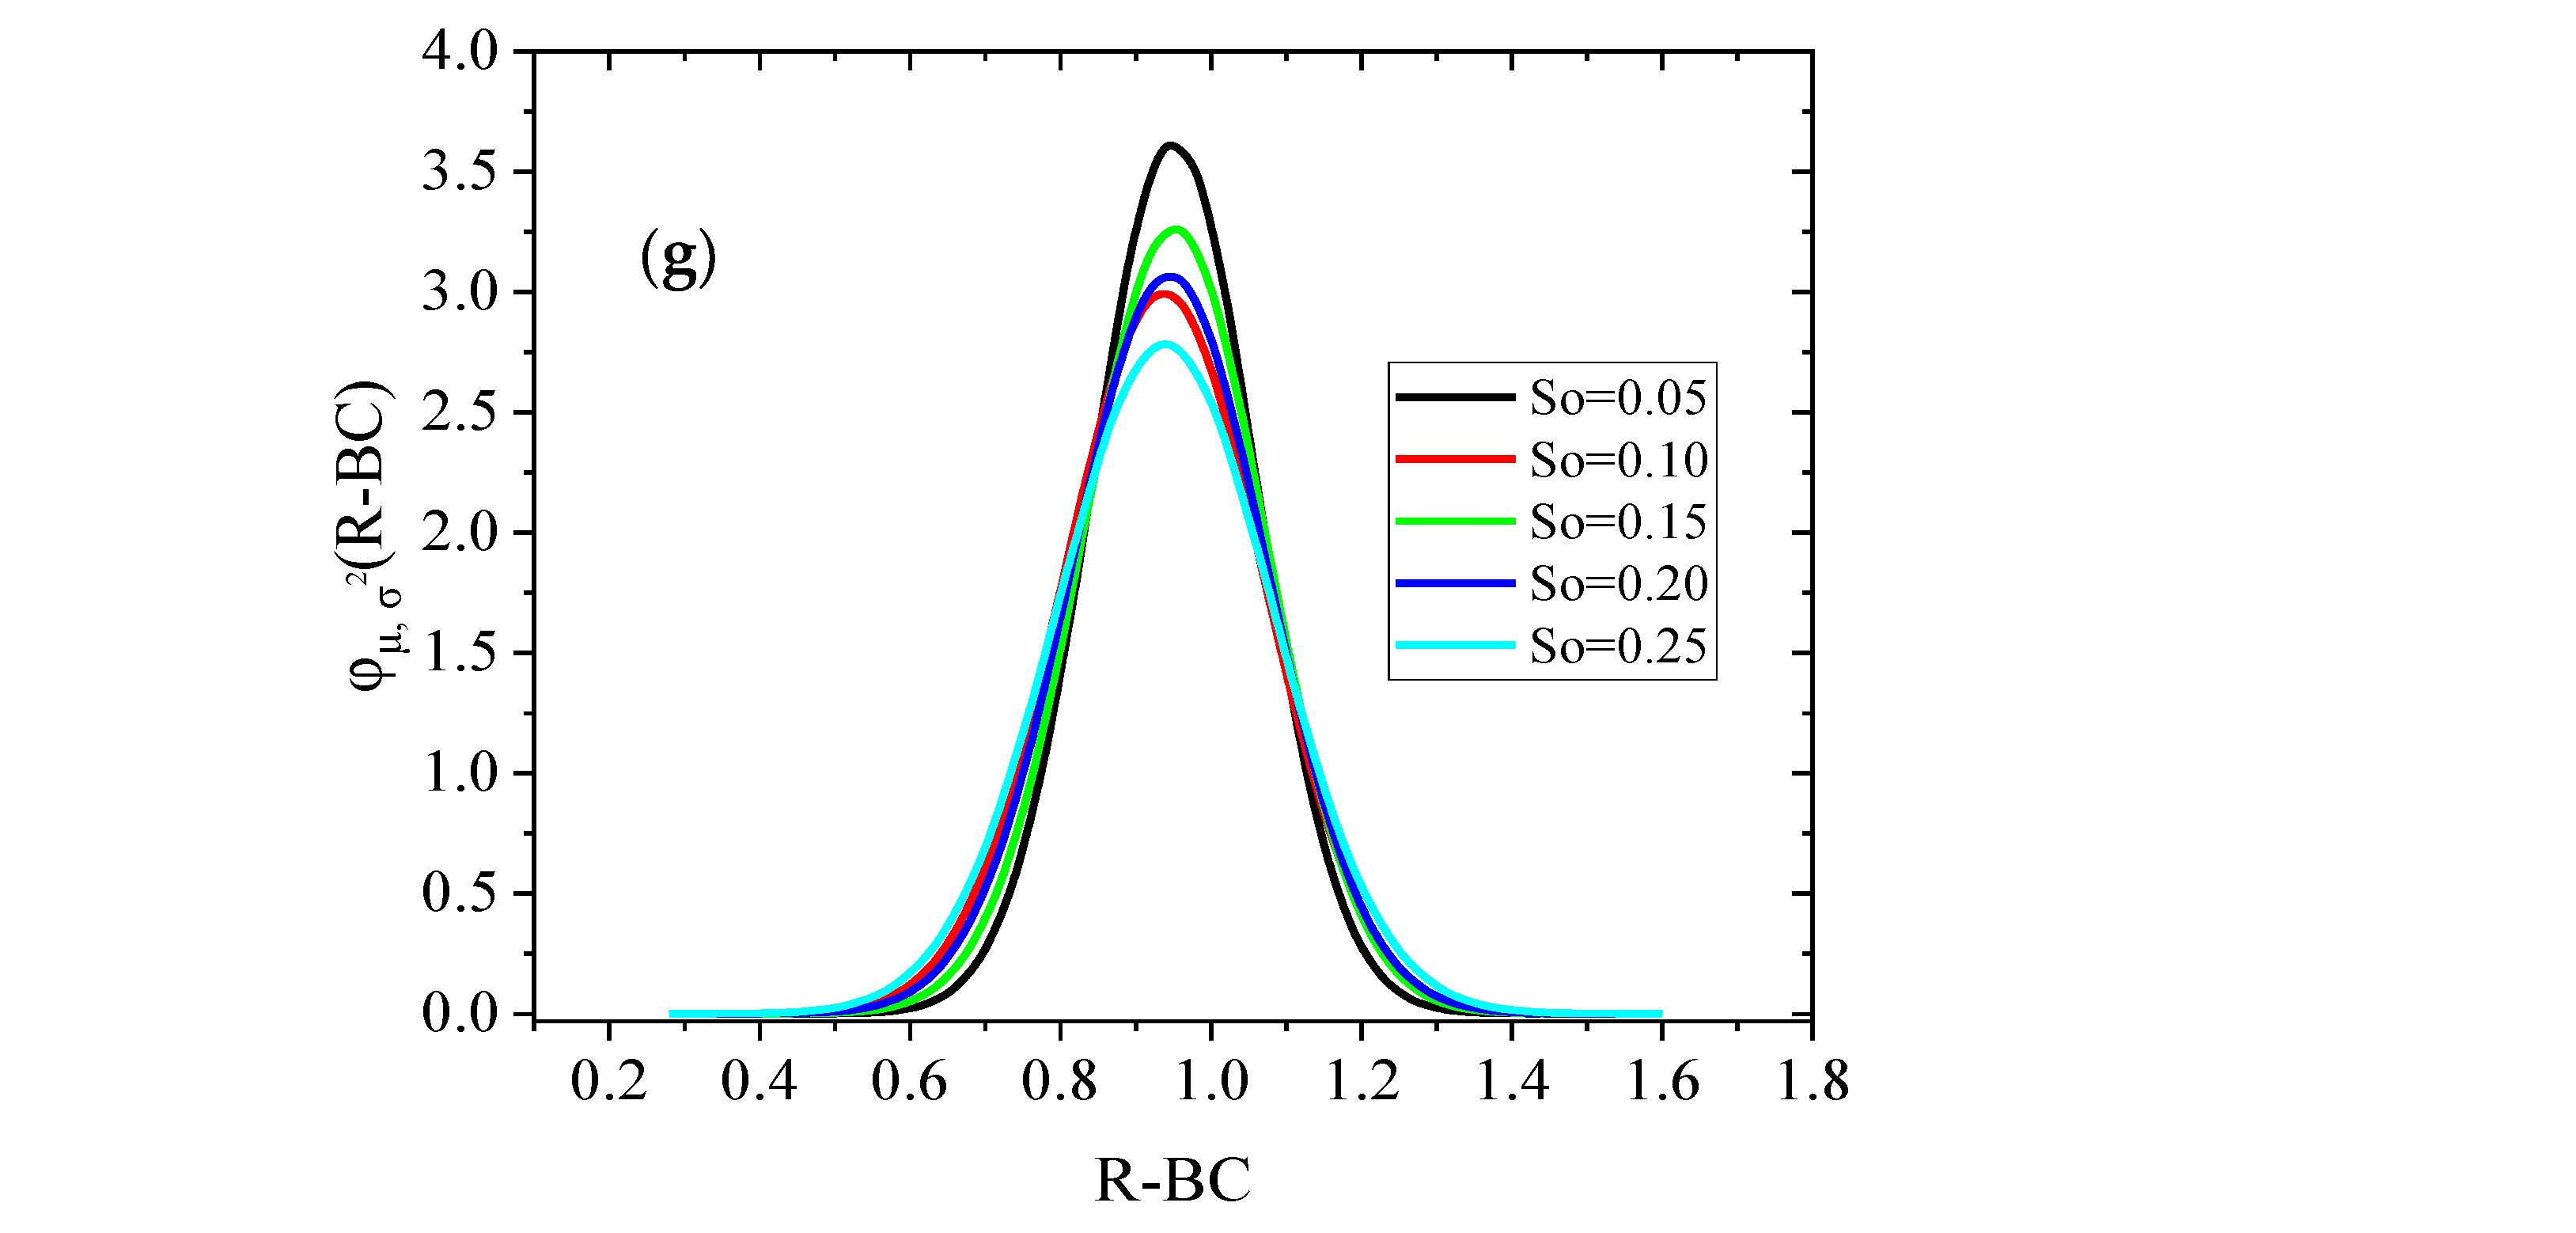
4.4. Probability Density Function

The performance of the KNN model was further investigated using another probabilistic technique, the probability density function (PDF). It is a ball-shaped curve of the normal distribution that is commonly accepted as it agrees with the central limit theorem (CLC). The PDF can be expressed as
φ ( x ) = 1 σ 2 π e x p x μ 2 2 σ 2
Figure 14 shows the PDF of the KNN model exposed to different degrees of uncertainties. It can be observed that by increasing the degree of uncertainties, the stochastic bound (σ) increased, and the confidence interval of the KNN accuracy slightly increased. Increasing the degree of uncertainty from 0.05 to 0.1 and to 0.15 increased the stochastic bound (σ) of the precision of the MC failure (Figure 14b) model and decreased the confidence interval. A similar effect was also observed for the recall of the MC failure mode (Figure 14e). The degree of uncertainties on the P-CF, P-BC, R-CF, and R-BC was less regarding the stochastic bounds (σ) and confidence interval, as presented in Figure 14a,c,d,f,g.

5. Conclusions

The study evaluated and classified the failure modes of U-shaped concrete specimens retrofitted with polyurethane grouting materials of various thicknesses and positions. The composite U-shaped specimens were tested under multiple drop-weight impact tests. The experimental dataset was used to train and test three machine learning algorithms, namely decision tree, Naïve Bayes and K-nearest neighbors, to predict the three failure modes exhibited by U-shaped specimens during testing. The uncertainty of the failure modes under different uncertainties degree were analyzed using Monte Carlo simulation. Therefore, the following conclusions were derived.
(1)
The retrofitting effect of polyurethane grout resulted in significant improvement in the impact strength of the U-shaped specimen. The U-shaped specimen strengthened at the top surface showed little or no effect on the number of drops to originated first crack. However, the specimen strengthened at the top-to-bottom surface revealed significant improvement at both the first crack and failure crack stages.
(2)
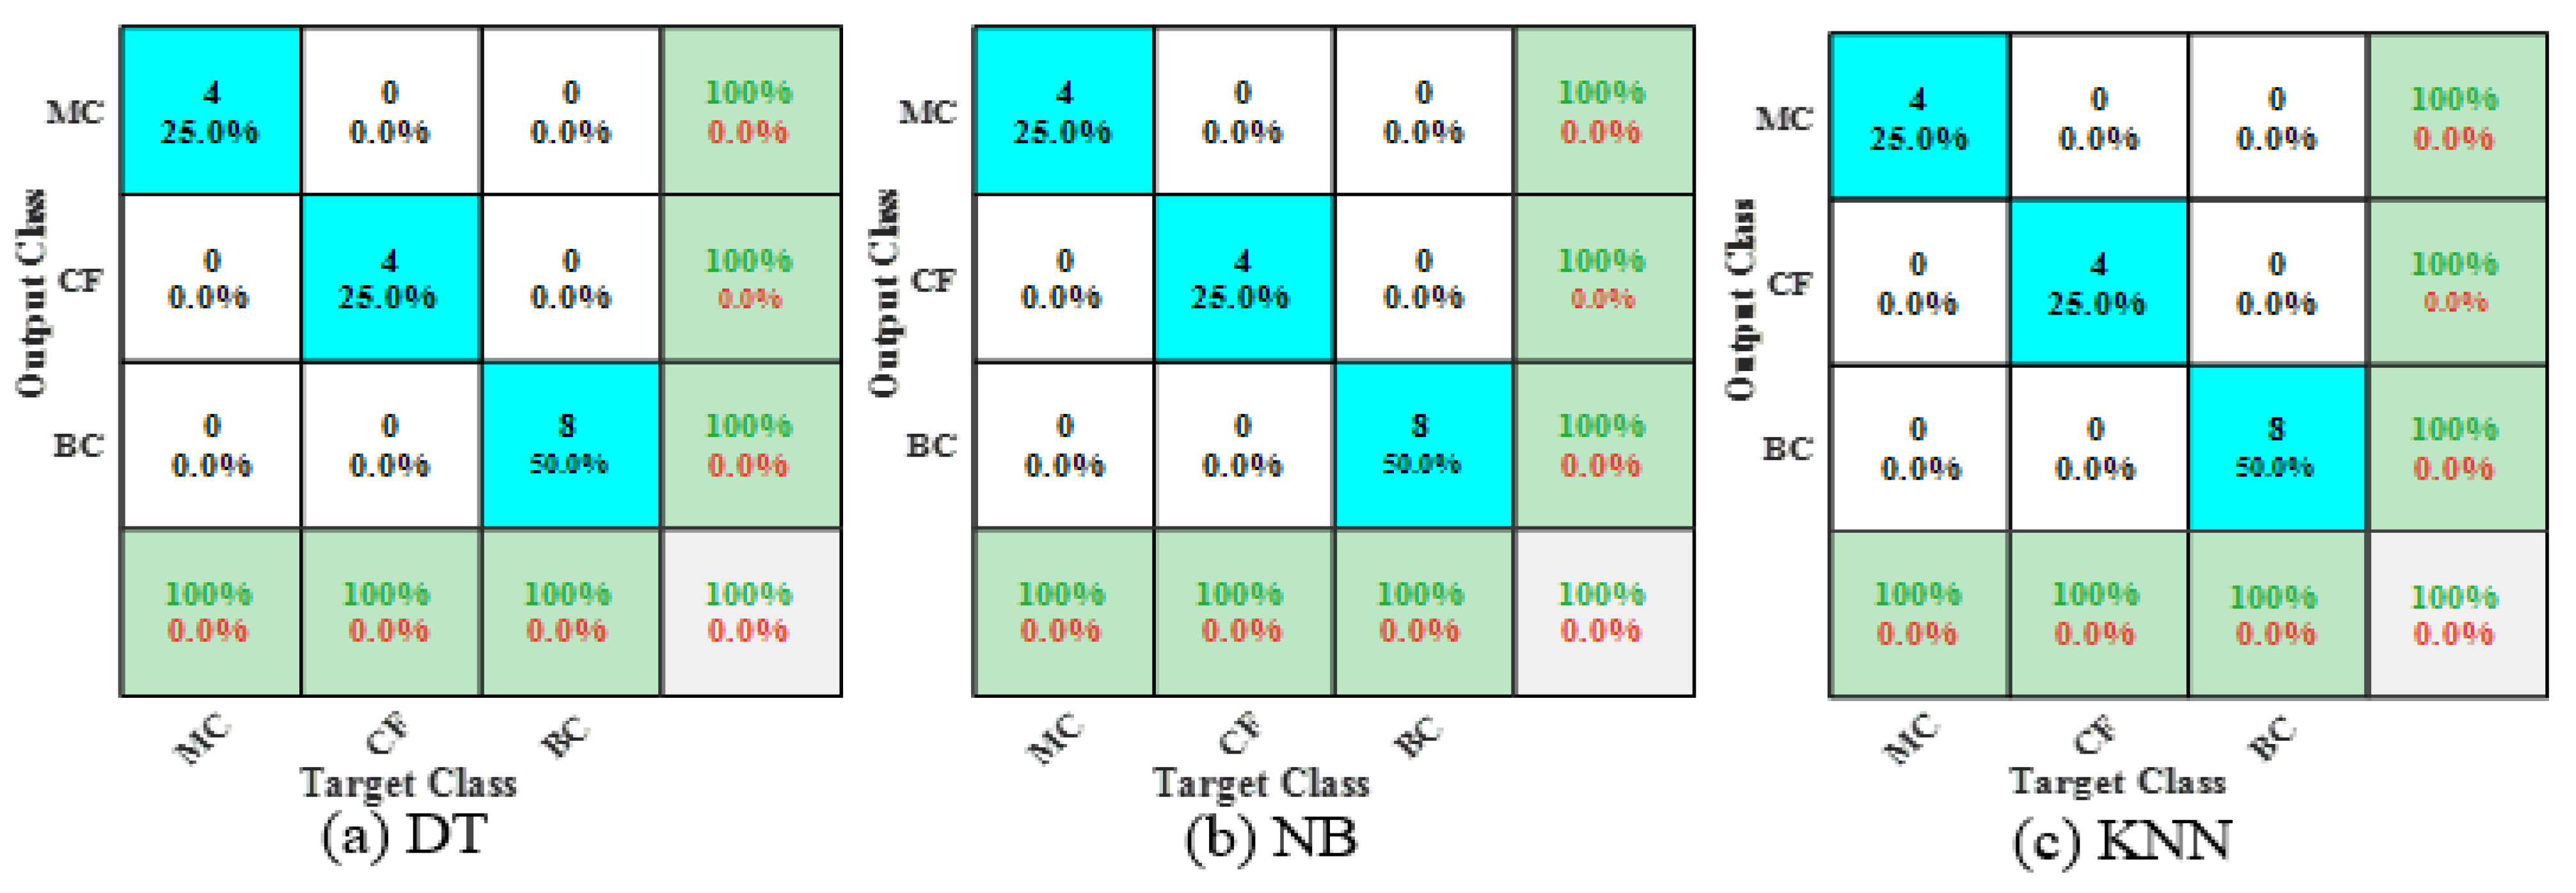
Three major failure patterns, including mid-section crack (MC), crushing foot (CF), and bend section crack (BC), were observed according to the specimen’s condition. Control specimens exhibited the typical single crack at the mid-section of the specimens. On the other hand, composite specimen demonstrated failure at the bend section and crushing of footing due to the retrofitting effect of PU grout overlaid, resulting the high endurance of the composite specimen to multiple drop-weight impact load.
(3)
All the trained models could predict the three types of failures with an accuracy greater than 95%. The KNN model predicted the failure modes with 3.1% higher accuracy than the DT and NB models. The excellent performance of the models was related to the performance of the developed models and the better correlation of the input variables with the target failure modes.
(4)
The accuracy, precision, and recall of the KNN model converged within 300 runs of Monte Carlo simulation. Similarly, the developed KNN model predicted the failure modes with 95% accuracy under different uncertainties. The maximum accuracy of the model under each uncertainty was 100%, and the average mean accuracy was 95.8%, which shows the robustness of the developed KNN model. The average mean precision of MC, CF, and BC failure modes was 99.8, 91.7, and 94.6%, respectively. The average mean of the failure mode recall was 99.9, 91.6, and 94.5%, respectively.

Author Contributions

S.I.H. and A.I.B.F.: conceptualization, methodology, investigation, writing—original draft, writing—review and editing; Y.E.I.: writing—original draft, writing—review and editing, and funding acquisition. O.S.A.: data curation, visualization, writing—original draft, writing—review and editing. All authors have read and agreed to the published version of the manuscript.

Funding

The authors greatly acknowledge the financial support of this research by the Structures and Materials Laboratory (S&M Lab) of the College of Engineering, Prince Sultan University, Riyadh, Saudi Arabia, for funding the article process fees.

Data Availability Statement

Data are contained within the article.

Conflicts of Interest

The authors declare no conflicts of interest.

References

  1. Zhou, X.; Xie, Y.; Long, G.; Zeng, X.; Li, J.; Yao, L.; Jiang, W.; Pan, Z. DEM analysis of the effect of interface transition zone on dynamic splitting tensile behavior of high-strength concrete based on multi-phase model. Cem. Concr. Res. 2021, 149, 106577. [Google Scholar] [CrossRef]
  2. Gao, Y.; Romero, P.; Zhang, H.; Huang, M.; Lai, F. Unsaturated polyester resin concrete: A review. Constr. Build. Mater. 2019, 228, 116709. [Google Scholar] [CrossRef]
  3. Mounanga, P.; Gbongbon, W.; Poullain, P.; Turcry, P. Proportioning and characterization of lightweight concrete mixtures made with rigid polyurethane foam wastes. Cem. Concr. Compos. 2008, 30, 806–814. [Google Scholar] [CrossRef]
  4. Verdolotti, L.; Lavorgna, M.; Di Maio, E.; Iannace, S. Hydration-induced reinforcement of rigid polyurethane-cement foams: The effect of the co-continuous morphology on the thermal-oxidative stability. Polym. Degrad. Stab. 2013, 98, 64–72. [Google Scholar] [CrossRef]
  5. Rabello, L.G.; da Conceição Ribeiro, R.C. A novel vermiculite/vegetable polyurethane resin-composite for thermal insulation eco-brick production. Compos. Part B Eng. 2021, 221, 109035. [Google Scholar] [CrossRef]
  6. Sanches, A.O.; Teixeira, G.F.; Zaghete, M.A.; Longo, E.; Malmonge, J.A.; Silva, M.J.; Sakamoto, W.K. Influence of polymer insertion on the dielectric, piezoelectric and acoustic properties of 1-0-3 polyurethane/cement-based piezo composite. Mater. Res. Bull. 2019, 119, 110541. [Google Scholar] [CrossRef]
  7. Karbhari, V.M.; Eckel, D.A.; Tunis, G.C., II. Strengthening of concrete column stubs through resin infused composite wraps. J. Thermoplast. Compos. Mater. 1993, 6, 92–107. [Google Scholar] [CrossRef]
  8. Hussain, H.K.; Liu, G.W.; Yong, Y.W. Experimental study to investigate mechanical properties of new material polyurethane–cement composite (PUC). Constr. Build. Mater. 2014, 50, 200–208. [Google Scholar] [CrossRef]
  9. Reis, J.M.L.; Ferreira, A.J.M. Assessment of fracture properties of epoxy polymer concrete reinforced with short carbon and glass fibers. Constr. Build. Mater. 2004, 18, 523–528. [Google Scholar] [CrossRef]
  10. Li, T.-T.; Liu, P.; Wang, H.; Dai, W.; Wang, J.; Wang, Z.; Shiu, B.-C.; Lou, C.-W.; Lin, J.-H. Preparation and characteristics of flexible polyurethane foam filled with expanded vermiculite powder and concave-convex structural panel. J. Mater. Res. Technol. 2021, 12, 1288–1302. [Google Scholar] [CrossRef]
  11. Lopes, M.D.M.; de Souza Pádua, M.; de Carvalho, J.P.R.G.; Simonassi, N.T.; Lopez, F.P.D.; Colorado, H.A.; Vieira, C.M.F. Natural based polyurethane matrix composites reinforced with bamboo fiber waste for use as oriented strand board. J. Mater. Res. Technol. 2021, 12, 2317–2324. [Google Scholar] [CrossRef]
  12. Boulaouche, T.; Kherroub, D.E.; Benzerafa, A.; Khimeche, K.; Belbachir, M. New synthesis of polyurethane nanocomposites based on Maghnite used both as a catalyst and as an inorganic improver of thermal, mechanical and textural properties. J. Mater. Res. Technol. 2020, 9, 15222–15232. [Google Scholar] [CrossRef]
  13. Harith, I.K. Study on polyurethane foamed concrete for use in structural applications. Case Stud. Constr. Mater. 2018, 8, 79–86. [Google Scholar] [CrossRef]
  14. Haruna, S.I.; Zhu, H.; Jiang, W.; Shao, J. Evaluation of impact resistance properties of polyurethane-based polymer concrete for the repair of runway subjected to repeated drop-weight impact test. Constr. Build. Mater. 2021, 309, 125152. [Google Scholar] [CrossRef]
  15. Li, M.; Du, M.; Wang, F.; Xue, B.; Zhang, C.; Fang, H. Study on the mechanical properties of polyurethane (PU) grouting material of different geometric sizes under uniaxial compression. Constr. Build. Mater. 2020, 259, 119797. [Google Scholar] [CrossRef]
  16. Al-kahtani, M.S.M.; Zhu, H.; Haruna, S.I.; Shao, J. Evaluation of Mechanical Properties of Polyurethane-Based Polymer Rubber Concrete Modified Ground Glass Fiber Using Response Surface Methodology. Arab. J. Sci. Eng. 2022, 48, 4695–4710. [Google Scholar] [CrossRef]
  17. Liu, K.; Tong, J.; Huang, M.; Wang, F.; Pang, H. Model and experimental studies on the effects of load characteristics and polyurethane densities on fatigue damage of rigid polyurethane grouting materials. Constr. Build. Mater. 2022, 347, 128595. [Google Scholar] [CrossRef]
  18. Laqsum, S.A.; Zhu, H.; Bo, Z.; Haruna, S.I.; Al-shawafi, A.; Borito, S.M. Static properties and impact resistance performance of U-shaped PU-modified concrete under repeated drop-weight impact load. Arch. Civ. Mech. Eng. 2023, 23, 227. [Google Scholar] [CrossRef]
  19. Cuenca-Romero, L.A.; Arroyo, R.; Alonso, Á.; Gutiérrez-González, S.; Calderón, V. Characterization properties and fire behaviour of cement blocks with recycled polyurethane roof wastes. J. Build. Eng. 2022, 50, 104075. [Google Scholar] [CrossRef]
  20. Kalamees, T.; Põldaru, M.; Ilomets, S.; Klõšeiko, P.; Kallavus, U.; Rosenberg, M.; Õiger, K. Failure analysis of a spray polyurethane foam roofing system. J. Build. Eng. 2020, 32, 101752. [Google Scholar] [CrossRef]
  21. Zhang, L.; Zhang, W.; Yuan, C.; Zou, W.; Zhang, Y. Research on the dynamic impact performance of polyurethane cement-based composite. Constr. Build. Mater. 2022, 336, 127574. [Google Scholar] [CrossRef]
  22. Parniani, S.; Toutanji, H. Monotonic and fatigue performance of RC beams strengthened with a polyurea coating system. Constr. Build. Mater. 2015, 101, 22–29. [Google Scholar] [CrossRef]
  23. Al-shawafi, A.; Zhu, H.; Haruna, S.I.; Bo, Z.; Laqsum, S.A.; Borito, S.M. Impact resistance of ultra-high-performance concrete retrofitted with polyurethane grout material: Experimental investigation and statistical analysis. Structures 2023, 55, 185–200. [Google Scholar] [CrossRef]
  24. Adamu, M.; Haruna, S.I.; Malami, S.I.; Ibrahim, M.N.; Abba, S.I.; Ibrahim, Y.E. Prediction of compressive strength of concrete incorporated with jujube seed as partial replacement of coarse aggregate: A feasibility of Hammerstein–Wiener model versus support vector machine. Model. Earth Syst. Environ. 2021, 8, 3435–3445. [Google Scholar] [CrossRef]
  25. Farouk, A.I.B.; Zhu, J. Prediction of Interface Bond Strength Between Ultra-High-Performance Concrete (UHPC) and Normal Strength Concrete (NSC) Using a Machine Learning Approach. Arab. J. Sci. Eng. 2022, 47, 5337–5363. [Google Scholar] [CrossRef]
  26. Johnson, K.L.; Maestas, D.; Emery, J.M.; Grigoriu, M.D.; Smith, M.D.; Martinez, C. Failure classification of porous additively manufactured parts using Deep Learning. Comput. Mater. Sci. 2022, 204, 111098. [Google Scholar] [CrossRef]
  27. Almasoud, A.S. Enhanced Metaheuristics with Machine Learning Enabled Cyberattack Detection Model. Intell. Autom. Soft Comput. 2023, 37, 2849–2863. [Google Scholar] [CrossRef]
  28. Mangalathu, S.; Jeon, J.-S. Machine learning–based failure mode recognition of circular reinforced concrete bridge columns: Comparative study. J. Struct. Eng. 2019, 145, 4019104. [Google Scholar] [CrossRef]
  29. Naderpour, H.; Mirrashid, M.; Parsa, P. Failure mode prediction of reinforced concrete columns using machine learning methods. Eng. Struct. 2021, 248, 113263. [Google Scholar] [CrossRef]
  30. Shan, J.; Liu, J.; Ouyang, Y. Residual-based damage evaluation of RC columns using feature classification and model optimization. Struct. Des. Tall Spec. Build. 2021, 30, e1887. [Google Scholar] [CrossRef]
  31. Nguyen, H.D.; Truong, G.T.; Shin, M. Development of extreme gradient boosting model for prediction of punching shear resistance of r/c interior slabs. Eng. Struct. 2021, 235, 112067. [Google Scholar] [CrossRef]
  32. Naderpour, H.; Mirrashid, M. Classification of failure modes in ductile and non-ductile concrete joints. Eng. Fail. Anal. 2019, 103, 361–375. [Google Scholar] [CrossRef]
  33. Moore, B.A.; Rougier, E.; O’Malley, D.; Srinivasan, G.; Hunter, A.; Viswanathan, H. Predictive modeling of dynamic fracture growth in brittle materials with machine learning. Comput. Mater. Sci. 2018, 148, 46–53. [Google Scholar] [CrossRef]
  34. Alrayes, F.S.; Zakariah, M.; Driss, M.; Boulila, W. Deep Neural Decision Forest (DNDF): A Novel Approach for Enhancing Intrusion Detection Systems in Network Traffic Analysis. Sensors 2023, 23, 8362. [Google Scholar] [CrossRef]
  35. Najeeb, M.I.; Syamsir, A.; Amir, S.M.M.; Khan, T.; Sebaey, T.A. Failure Analysis of Plant Fibre-Reinforced Composite in Civil Building Materials Using Non-Destructive Testing Methods: Current and Future Trend. J. Nat. Fibers. 2023, 20, 2246654. [Google Scholar] [CrossRef]
  36. Haruna, S.I.; Zhu, H.; Ibrahim, Y.E.; Shao, J.; Adamu, M.; Farouk, A.I.B. Experimental and Statistical Analysis of U-Shaped Polyurethane-Based Polymer Concrete under Static and Impact Loads as a Repair Material. Buildings 2022, 12, 1986. [Google Scholar] [CrossRef]
  37. Somarathna, H.; Raman, S.N.; Mohotti, D.; Mutalib, A.A.; Badri, K.H. Hyper-viscoelastic constitutive models for predicting the material behavior of polyurethane under varying strain rates and uniaxial tensile loading. Constr. Build. Mater. 2020, 236, 117417. [Google Scholar] [CrossRef]
  38. Somarathna, H.M.C.C.; Raman, S.N.; Mohotti, D.; Mutalib, A.A.; Badri, K.H. Rate dependent tensile behavior of polyurethane under varying strain rates. Constr. Build. Mater. 2020, 254, 119203. [Google Scholar] [CrossRef]
  39. Fan, J.; Chen, A. Studying a flexible polyurethane elastomer with improved impact-resistant performance. Polymers 2019, 11, 467. [Google Scholar] [CrossRef]
  40. Yuan, Y.; Wang, S.; Tan, P.; Zhu, H. Mechanical performance and shear constitutive model study of a new high-capacity polyurethane elastomeric bearing. Constr. Build. Mater. 2020, 232, 117227. [Google Scholar] [CrossRef]
  41. JTG55-2011; Specification for Mix Proportion Design of Ordinary Concrete. Chinese National Standard: Beijing, China, 2011.
  42. Jiang, W.; Zhu, H.; Haruna, S.I.; Zhao, B.; Shao, J.; Yu, Y. Effect of crumb rubber powder on mechanical properties and pore structure of polyurethane-based polymer mortar for repair. Constr. Build. Mater. 2021, 309, 125169. [Google Scholar] [CrossRef]
  43. ACI 544-2R; Measurement of Properties of Fiber Reinforced Concrete. ACI: Dhaka, Bangladesh, 1989; pp. 433–439.
  44. Dietterich, T.G. Ensemble Methods in Machine Learning; Springer: Berlin/Heidelberg, Germany, 2000; pp. 1–15. [Google Scholar]
  45. Vandewiele, G.; Janssens, O.; Ongenae, F.; De Turck, F.; Van Hoecke, S. Genesim: Genetic extraction of a single, interpretable model. arXiv 2016, arXiv:1611.05722. [Google Scholar]
  46. Breiman, L.; Ihaka, R. Nonlinear Discriminant Analysis via Scaling and ACE; Department of Statistics, University of California Davis One Shields Avenue: Davis, CA, USA, 1984. [Google Scholar]
  47. Rasjid, Z.E.; Setiawan, R. Performance Comparison and Optimization of Text Document Classification using k-NN and Naïve Bayes Classification Techniques. Procedia Comput. Sci. 2017, 116, 107–112. [Google Scholar] [CrossRef]
  48. Beyer, K.; Goldstein, J.; Ramakrishnan, R.; Shaft, U. When Is “Nearest Neighbor” Meaningful? BT-Database Theory—ICDT’99’; Beeri, C., Buneman, P., Eds.; Springer: Berlin/Heidelberg, Germany, 1999; pp. 217–235. [Google Scholar]
  49. Cover, T.; Hart, P. Nearest neighbor pattern classification. IEEE Trans. Inf. Theory. 1967, 13, 21–27. [Google Scholar] [CrossRef]
  50. Zhu, X.C.; Zhu, H.; Li, H.R. Drop-weight impact test on U-shape concrete specimens with statistical and regression analyses. Materials 2015, 80, 5877–5890. [Google Scholar] [CrossRef]
  51. Haruna, S.I.; Zhu, H.; Shao, J. Experimental study; modeling, and reliability analysis of impact resistance of micro steel fiber-reinforced concrete modified with nano silica. Struct. Concr. 2022, 23, 1659–1674. [Google Scholar] [CrossRef]
  52. Jaskulski, R.; Wiliński, P. Probabilistic Analysis of Shear Resistance Assured by Concrete Compression. Procedia Eng. 2017, 172, 449–456. [Google Scholar] [CrossRef]
  53. Wang, X.; Yang, Z.; Jivkov, A.P. Monte Carlo simulations of mesoscale fracture of concrete with random aggregates and pores: A size effect study. Constr. Build. Mater. 2015, 80, 262–272. [Google Scholar] [CrossRef]
  54. Farouk, A.I.B.; Zhu, J.; Ding, J.; Haruna, S.I. Prediction and uncertainty quantification of ultimate bond strength between UHPC and reinforcing steel bar using a hybrid machine learning approach. Constr. Build. Mater. 2022, 345, 128360. [Google Scholar] [CrossRef]
  55. Pham, B.T.; Nguyen, M.D.; Van Dao, D.; Prakash, I.; Ly, H.-B.; Le, T.-T.; Ho, L.S.; Nguyen, K.T.; Ngo, T.Q.; Hoang, V.; et al. Development of artificial intelligence models for the prediction of Compression Coefficient of soil: An application of Monte Carlo sensitivity analysis. Sci. Total Environ. 2019, 679, 172–184. [Google Scholar] [CrossRef]
  56. Ly, H.-B.; Monteiro, E.; Le, T.-T.; Le, V.M.; Dal, M.; Regnier, G.; Pham, B.T. Prediction and Sensitivity Analysis of Bubble Dissolution Time in 3D Selective Laser Sintering Using Ensemble Decision Trees. Materials 2019, 12, 1544. [Google Scholar] [CrossRef]
  57. Thanh, T.T.M.; Ly, H.-B.; Pham, B.T. A possibility of AI application on mode-choice prediction of transport users in Hanoi. In CIGOS 2019, Innovation for Sustainable Infrastructure; Lecture Notes in Civil Engineering; Springer: Berlin/Heidelberg, Germany, 2019; pp. 1179–1184. [Google Scholar]
  58. Mordechai, S. Applications of Monte Carlo Method in Science and Engineering; InTech: Houston TX, USA, 2011. [Google Scholar]
Figure 1. The typical composite U-shaped specimens retrofitted with PUG.
Infrastructures 09 00150 g001aInfrastructures 09 00150 g001b
Figure 2. Experimental setup of USDWIT.
Infrastructures 09 00150 g002
Figure 3. The flowchart of the developed AI models.
Infrastructures 09 00150 g003
Figure 4. Major failure patterns of U-shape specimens: (a) mid-section cracks (b) bend section crack, (c) crushing of footing.
Infrastructures 09 00150 g004
Figure 5. Impact strength of control specimen for the two cracking stages.
Infrastructures 09 00150 g005
Figure 6. Impact strength of U-shaped NC-PUGT5 at the two cracking stages.
Infrastructures 09 00150 g006
Figure 7. Impact strength of U-shaped NC-PUGT10 at the two cracking stages.
Infrastructures 09 00150 g007
Figure 8. Impact strength of U-shaped NC-PUGTB5 at the two cracking stages.
Infrastructures 09 00150 g008
Figure 9. Model performance of the trained (a) DT, (b) NB, and (c) KNN models.
Infrastructures 09 00150 g009
Figure 10. Model performance of the tested (a) DT, (b) NB, and (c) KNN models.
Infrastructures 09 00150 g010
Figure 11. Monte Carlo simulation method.
Infrastructures 09 00150 g011
Figure 12. The convergence of KNN.
Infrastructures 09 00150 g012
Figure 13. Sensitivity analysis of KNN on different degrees of uncertainties.
Infrastructures 09 00150 g013
Figure 14. PDF of the KNN model.
Infrastructures 09 00150 g014aInfrastructures 09 00150 g014b
Table 1. Mix proportion for normal concrete (NC)/kg/m3 and PUG material.
Specimen IDCement Fine Aggregate Median Aggregate Water
NC425718966170
Polyurethane grouting materials
PU: SandPU matrix/200 g
Castor oil (g)PAPI (g)diluent (g)
PU grout1:0.5167.0033.008.40
Table 2. Configuration of NC-PUG specimens.
PUG Overlaid (mm)
Specimen IDConfigurationTop SurfaceBottom Surface
NC-PU0---
NC-PUT5T5-
NC-PUTB5T&B55
NC-PUT10T10-
Table 3. Statistical parameters of the experimental data.
ParametersFirst Crack StrengthFailure StrengthThicknessMidspan DeflectionMax. Load
N1 (Blows)N2 (Blows)(T) mmλ (mm)P (kN)
Max2832212.52.618.26
Min1100.2310.58
Mean5.0491.676.881.4813.14
St.D5.9582.804.800.812.37
Kurtosis4.56−0.06−1.45−1.32−0.49
Skewness2.100.74−0.28−0.260.77
Table 4. Pearson correlation matrix of the experimental data.
N1 (Blows)N2 (Blows)(T) mmλ (mm)P (kN)MC/CF/BC
N1 (blows)1
N2 (blows)0.27861
T (mm)0.58250.78841
λ (mm)−0.11990.46060.46341
P (kN)0.0907−0.4625−0.5595−0.73781
MC/CF/BC0.44970.82570.98130.5882−0.65601
Table 5. MSC results.
Uncertainties AccuracyPrecision Recall
MCCFBCMCCFBC
0.05Max1.0001.0001.0001.0001.0001.0001.000
Min 0.4290.1110.0000.0000.8000.0000.000
Mean0.9580.9980.9270.9490.9990.9120.951
StD0.0500.0410.1330.1090.0120.1490.110
0.1Max1.0001.0001.0001.0001.0001.0001.000
Min 0.8570.6670.0000.0000.6670.0000.000
Mean0.9560.9990.9060.9440.9990.9200.938
StD0.0440.0150.1540.1320.0160.1430.133
0.15Max1.0001.0001.0001.0001.0001.0001.000
Min 0.8570.7500.0000.0000.7500.0000.000
Mean0.9600.9990.9190.9470.9990.9210.951
StD0.0450.0140.1530.1240.0150.1380.122
0.2Max1.0001.0001.0001.0001.0001.0001.000
Min 0.4290.2000.0000.0000.6670.0000.000
Mean0.9580.9980.9170.9480.9990.9180.945
StD0.0520.0370.1430.1310.0190.1520.130
0.25Max1.0001.0001.0001.0001.0001.0001.000
Min 0.8570.8330.0000.0000.7500.0000.000
Mean0.9560.9990.9100.9411.0000.9130.939
StD0.0460.0120.1550.1430.0110.1510.143
Disclaimer/Publisher’s Note: The statements, opinions and data contained in all publications are solely those of the individual author(s) and contributor(s) and not of MDPI and/or the editor(s). MDPI and/or the editor(s) disclaim responsibility for any injury to people or property resulting from any ideas, methods, instructions or products referred to in the content.

