Article

Numerical Investigation of the Axial Load Capacity of Cold-Formed Steel Channel Sections: Effects of Eccentricity, Section Thickness, and Column Length

by
Diyari B. Hussein
1 and
Ardalan B. Hussein
2,*
1
Department of Architectural Engineering, Cihan University Sulaimaniya, Sulaimaniya 46001, Iraq
2
Department of Structural Engineering and Geotechnics, Széchenyi István University, Egyetem Tér 1, 9026 Győr, Hungary
*
Author to whom correspondence should be addressed.
Infrastructures 2024, 9(9), 142; https://doi.org/10.3390/infrastructures9090142
Submission received: 26 July 2024 / Revised: 22 August 2024 / Accepted: 23 August 2024 / Published: 26 August 2024

Abstract

Cold-formed steel channel (CFSC) sections have gained widespread adoption in building construction due to their advantageous properties, including superior energy efficiency, expedited construction timelines, environmental sustainability, material efficiency, and ease of transportation. This study presents a numerical investigation into the axial compressive behavior of CFSC section columns. A rigorously developed finite element model for CFSC sections was validated against existing experimental data from the literature. Upon validation, the model was employed for an extensive parametric analysis encompassing a dataset of 208 CFSC members. Furthermore, the efficacy of the design methodologies outlined in the AISI Specification and AS/NZS Standard were evaluated by comparing the axial load capacities obtained from the numerically generated data with the results of four previously conducted experimental tests. The findings reveal that the codified design equations, based on nominal compressive resistances determined using the current direct strength method, exhibit a conservative bias. On average, these equations underestimate the actual load capacities of CFSC section columns by approximately 11.5%. Additionally, this investigation explores the influence of eccentricity, cross-sectional dimensions, and the point-of-load application on the axial load capacity of CFSC columns. The results demonstrate that a decrease in section thickness, an increase in column length, and a higher degree of eccentricity significantly reduce the axial capacity of CFSC columns.

1. Introduction

Cold-formed steel sections have found widespread application in various fields, including solar photovoltaic brackets, lightweight portal frames, building structures, and storage shelves, due to their recyclability, quick construction speed, high degree of industrialization, high strength and stiffness, ease of industrial production, and light weight [1]. Thin-walled steel components are susceptible to three distinct buckling modes. Global Buckling (GB) refers to the overall instability of a structural member, characterized by deformation along its entire length. Local Buckling (LB) occurs when individual plate elements within the member buckle due to flexure, without any transverse deformation along the lines where adjacent plates connect. In contrast, Distortional Buckling (DB) involves not only local buckling but also a change in the cross-sectional shape of the member, leading to a more complex buckling behavior.
Many factors influence the buckling behavior of these members. These factors include the initial geometric defect mode, the slenderness ratio for local-distortion (LD) buckling, the nominal yield strength of the stainless-steel components, and the improvement in material strength in the corner area. Notably, the increased material strength in the corner area of the lipped C-section column enhances the bearing capacity of LD interaction buckling [2].
Thin-walled components have the potential to suffer local buckling before experiencing complete failure [3]. The cross-section design and element length also affect the buckling modes of CFS built-up sections, with multiple buckling modes possible [4]. As the member’s length increases, the single-channel section’s buckling type transitions from local (L) to distortional (D) [5]. Furthermore, the cross section’s and stiffeners’ forms, sizes, and material composition significantly impact the section’s final strength [6]. Stiffeners can help reduce local buckling in the web [7]. Increasing the web height and flange width of the lipped C-section stainless steel columns enhances their LD interaction buckling capability. Under the two boundary conditions, there is little variation in LD interaction buckling capability of sections with the same element [8]. On the other hand, LB is considerably simpler than DB [9].
Additionally, the load-bearing capacity [10,11,12,13,14,15], as well as the built-up columns’ initial elastic stiffness [14], will be decreased as the eccentricity increases. The specimen’s ultimate bearing capacity begins to drop when the eccentricity rises. Specimens subjected to positive eccentric compression have a higher ultimate bearing capacity than those exposed to negative eccentric compression when the eccentricity is lower (See Figure 8). Conversely, specimens exposed to negative eccentric compression have a higher final bearing capacity than those exposed to positive eccentric compression whenever the eccentricity is greater [16]. This investigation aims to quantify the individual and interactive effects of load eccentricity, section thickness, and section length on the axial load-carrying capability of CFSC columns.

2. The Design Criteria Are Based on the Direct Strength Method (DSM)

The design considerations for CFS sections without holes in compression are specified in the North American Specification for the Design of CFS Structural Elements (AISI S100) [17,18] and the Australian and New Zealand Standard (AS/NZS 4600) [19]. These guidelines provide the optimal method for calculating the maximum axial load that columns can withstand. Three different types of buckling may occur in CFS sections: distortional (D), global (G), and local (L) buckling (B) [5,17,18,20,21]. Global buckling is further divided into flexural-torsional (FT), torsional (T), and flexural (F) buckling [17,18], as illustrated in Figure 1. In terms of notation, the symbols Nol, Nod, Noc, Ncl, Ncd, Nce, Nc, and Ny in AS/NZS 4600:2018 correspond to Pcrl, Pcrd, Pcre, Pnl, Pnd, Pne, Pn, and Py in AISI S100–16.
The Effective Width Method (EWM) is a design approach that simplifies the analysis of local buckling in cold-formed steel members. By reducing the gross cross-sectional area to an effective cross-sectional area, the method approximates the nonlinear stress distribution with a linear one. In contrast, the Direct Strength Method (DSM) directly predicts member strength without employing effective width concepts, offering a more comprehensive analysis of the cross-section. The DSM in AISI [17,18,22] and the guideline [23] offer a more accurate method for determining strength than the effective width method (EWM) in the Eurocode 3, AISI, and AS/NZS [24].
A comparative analysis of the design strengths of EC9 and DSM revealed that DSM offers more precise predictions [25]. The adjusted slenderness ratio regulated the rise in slenderness, indicating a cautious DSM forecast [26]. The EWM offers cautious and dispersed approximations of the buckling capacity of C-section columns that have high strength and moderate to medium slenderness ratios. However, it produces very precise outcomes for columns with large slenderness ratios. On the other hand, the DSM provides quite precise forecasts for the resilience of high-strength C-section columns [27]. Furthermore, findings indicate that the average cross-section yield stress design parameter is suitable for use with the DSM to estimate the axial strengths of CFS elements experiencing GB or LB [28]. For most CFSC members with web holes and pinned–pinned boundary conditions, the DSM’s anticipated findings are not conservative. Current design standards for channel CFS elements with web holes are overly cautious and potentially dangerous, according to a comparison of test and finite element (FE) findings with AISI & AS/NZS data [29].

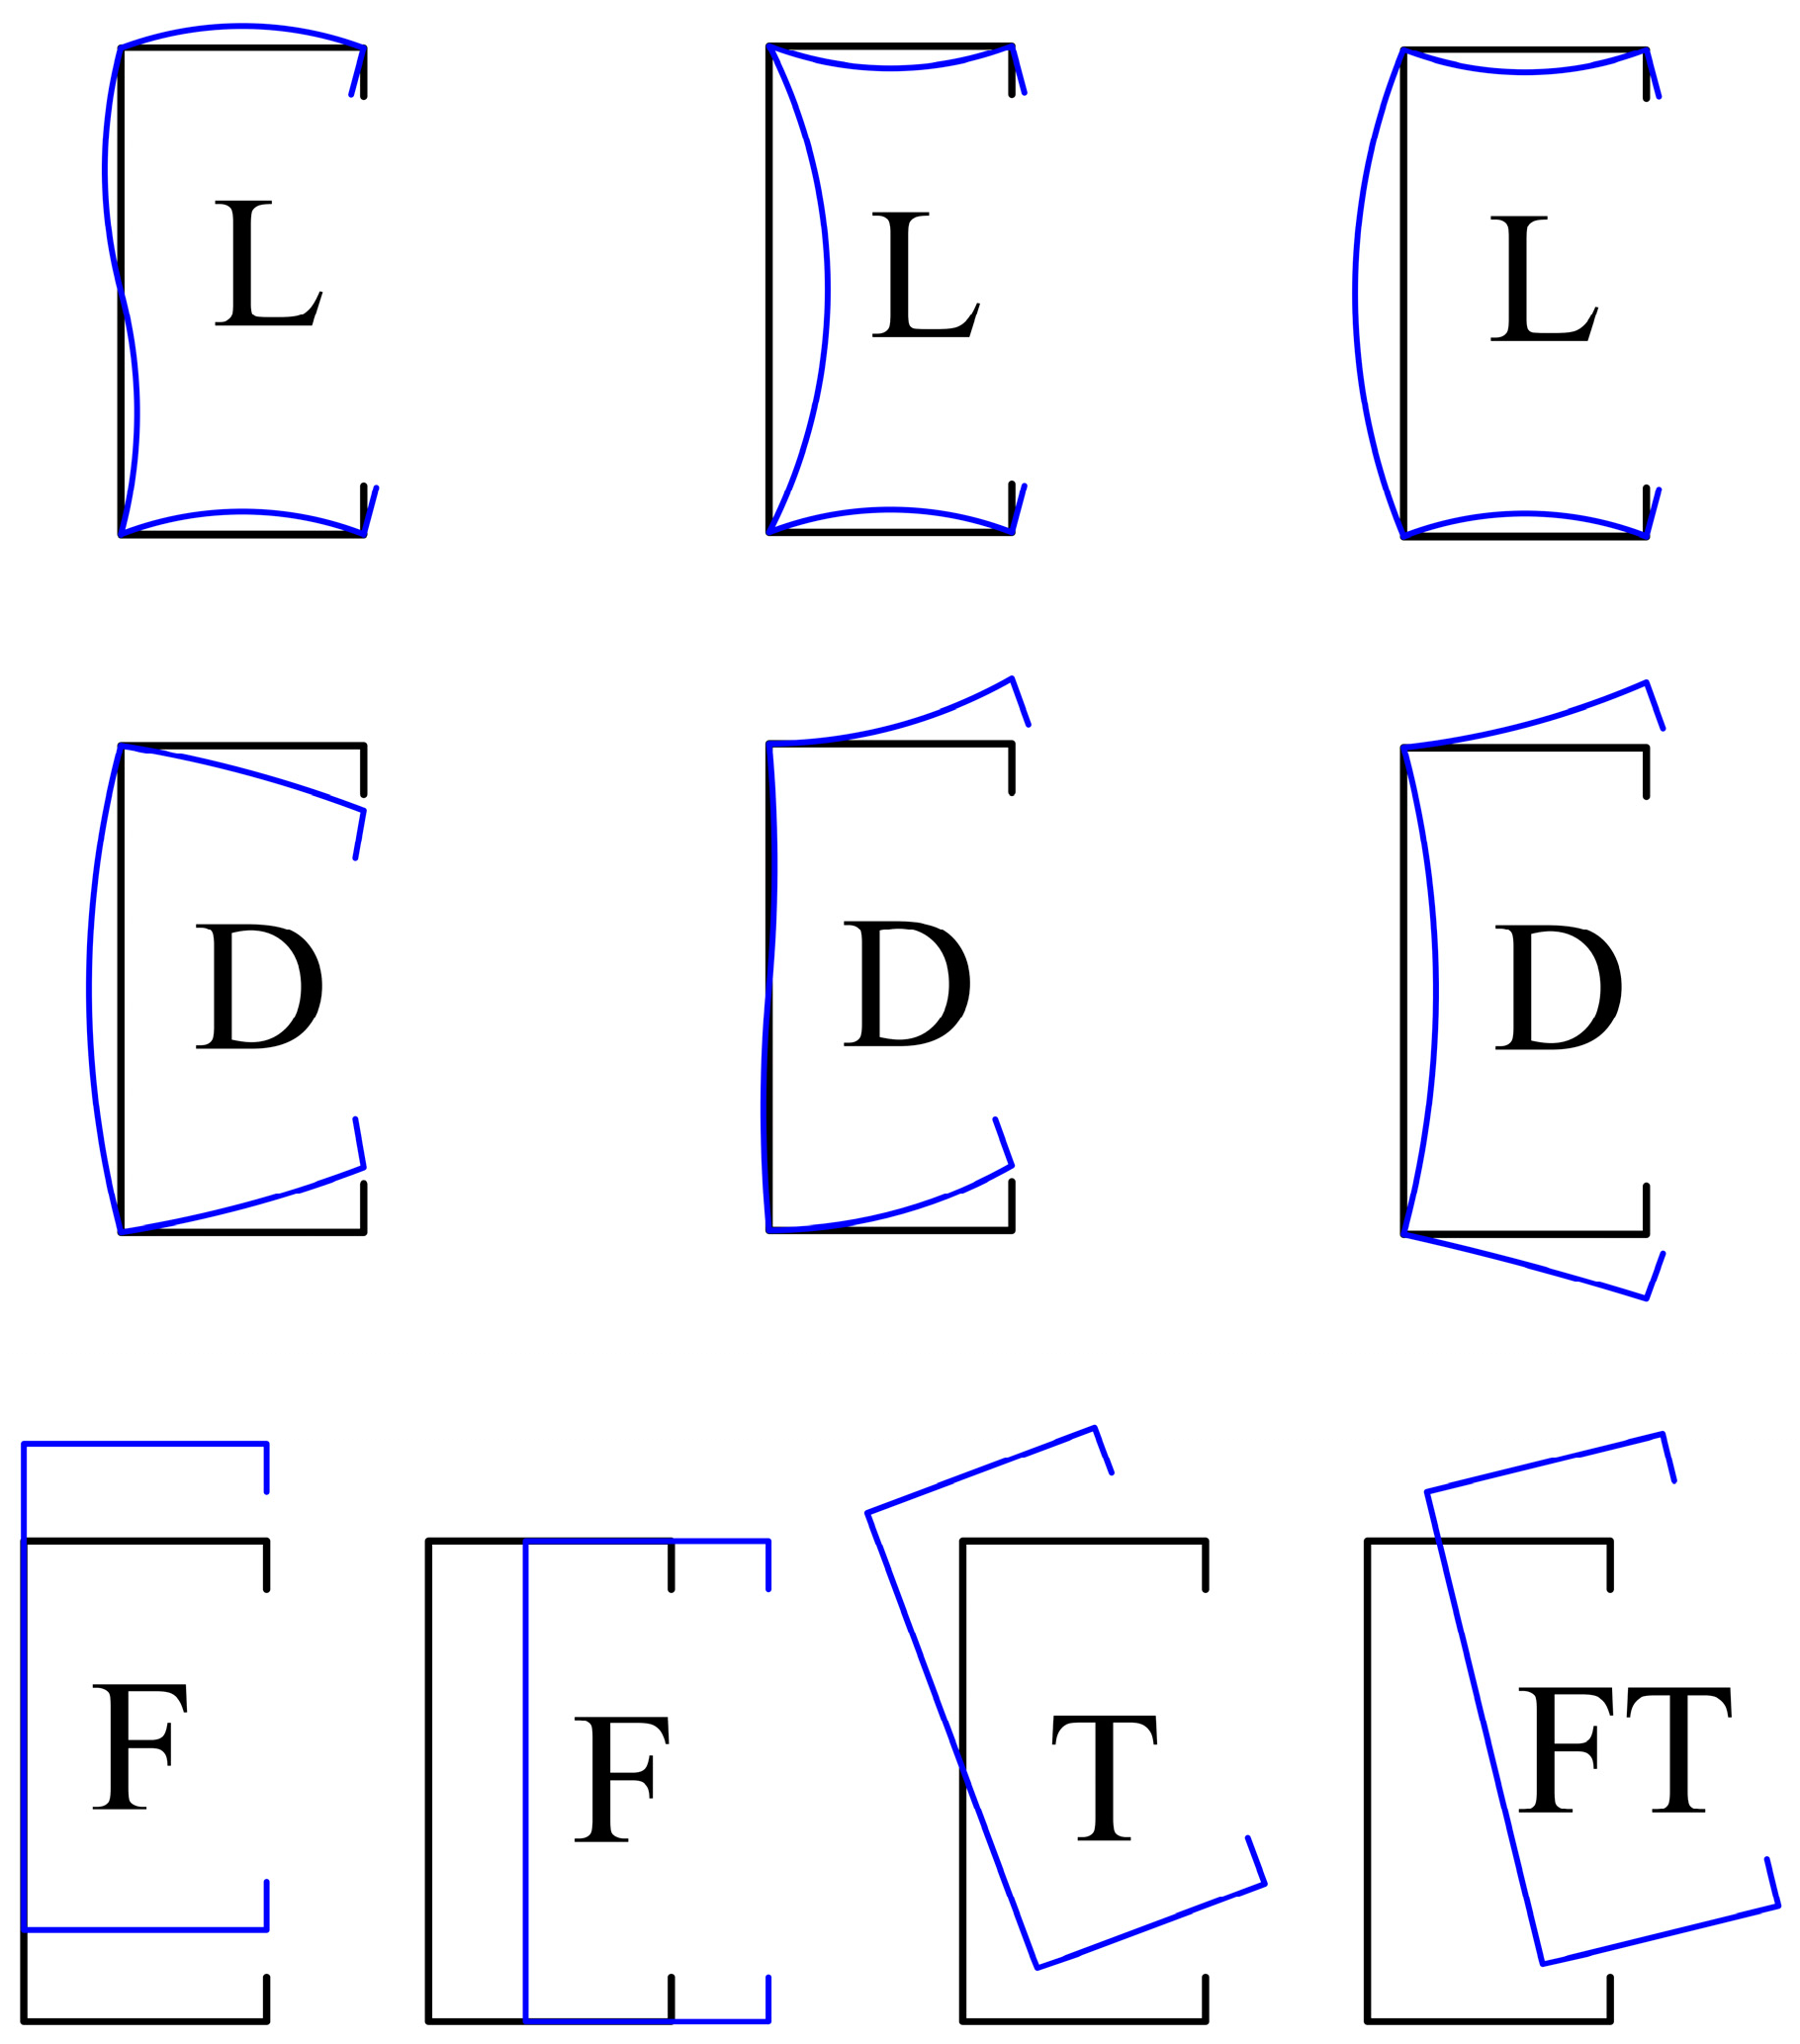
2.1. Global Buckling

The nominal yield capacity of the member is denoted by Ny. In terms of the buckling behavior, the minimum elastic element buckling stresses in F, T, and FT buckling modes are represented by Noc. Additionally, the nominal section capacity for GB is indicated by Nce. Furthermore, foc exhibits elastic behavior under flexural, torsional, and flexural-torsional buckling stresses (refer to Figure 1).
Noc = Ag × foc
Ny = Ag × fy
λ c = N y / N oc  
When   λ c > 1.5    ;    N c e = 0.877 × N y × λ c 2
When   λ c 1.5    ;    N c e = N y × 0.658 λ c 2

2.2. Local Buckling

The nominal capacity of an element with respect to local buckling is represented by Ncl. Additionally, the elastic LB load is denoted Nol, and the LB stress of the members is symbolized by fol (refer to Figure 1).
λ l = N c e / N o l
For   λ l > 0.776     ;     N c l = 1 0.15 N o l N c e 0.4 N o l N c e 0.4 N c e
For   λ l 0.776    ;    N c l = N c e

2.3. Distortional Buckling

The nominal capability of a section for DB is represented by Ncd. Similarly, the elastic stress associated with DB in channels is indicated by Fod, while Nod represents the elastic compressive buckling load resulting from D effects. In addition, N* denotes the design’s concentrated loads or reactions, and Nc stands for a member’s nominal capacity. For a visual representation of these terms and their relationships, refer to Figure 1.
λ d = N y / N o d
For   λ d > 0.561     ;    N c d = 1 0.25 N o d N y 0.6 N o d N y 0.6 N y
For   λ d 0.561     ;    N c d = N y
Nc represents the smallest value among Ncd, Ncl, and Nce
N * = ϕ C × N c = 0.85 × N c

3. Finite Element Modelling (FEM)

3.1. General

To create the FEMs of the tested specimens and forecast the behavior and compression capabilities of CFSC sections, the FE application Abaqus/CAE 2024 [30] was utilized. The FE models incorporated the exact section geometry (Figure 2), material characteristics, end boundary conditions, and initial geometric imperfections of the tested specimens. To ensure accuracy, the FE analyses included geometric and material nonlinear (second-order) inelastic analysis with imperfections (GMNIA). In the final step of the analysis, a dynamic-implicit step was employed, where a quasi-static approach [31] was chosen. Specifically, the initial, minimum, and maximum increment sizes were set to 1 × 10⁵, 1 × 10⁵⁵, and 1 × 10⁻³, respectively, with a maximum number of increments set at 1 × 10⁶. This methodology was applied consistently across all FE models.

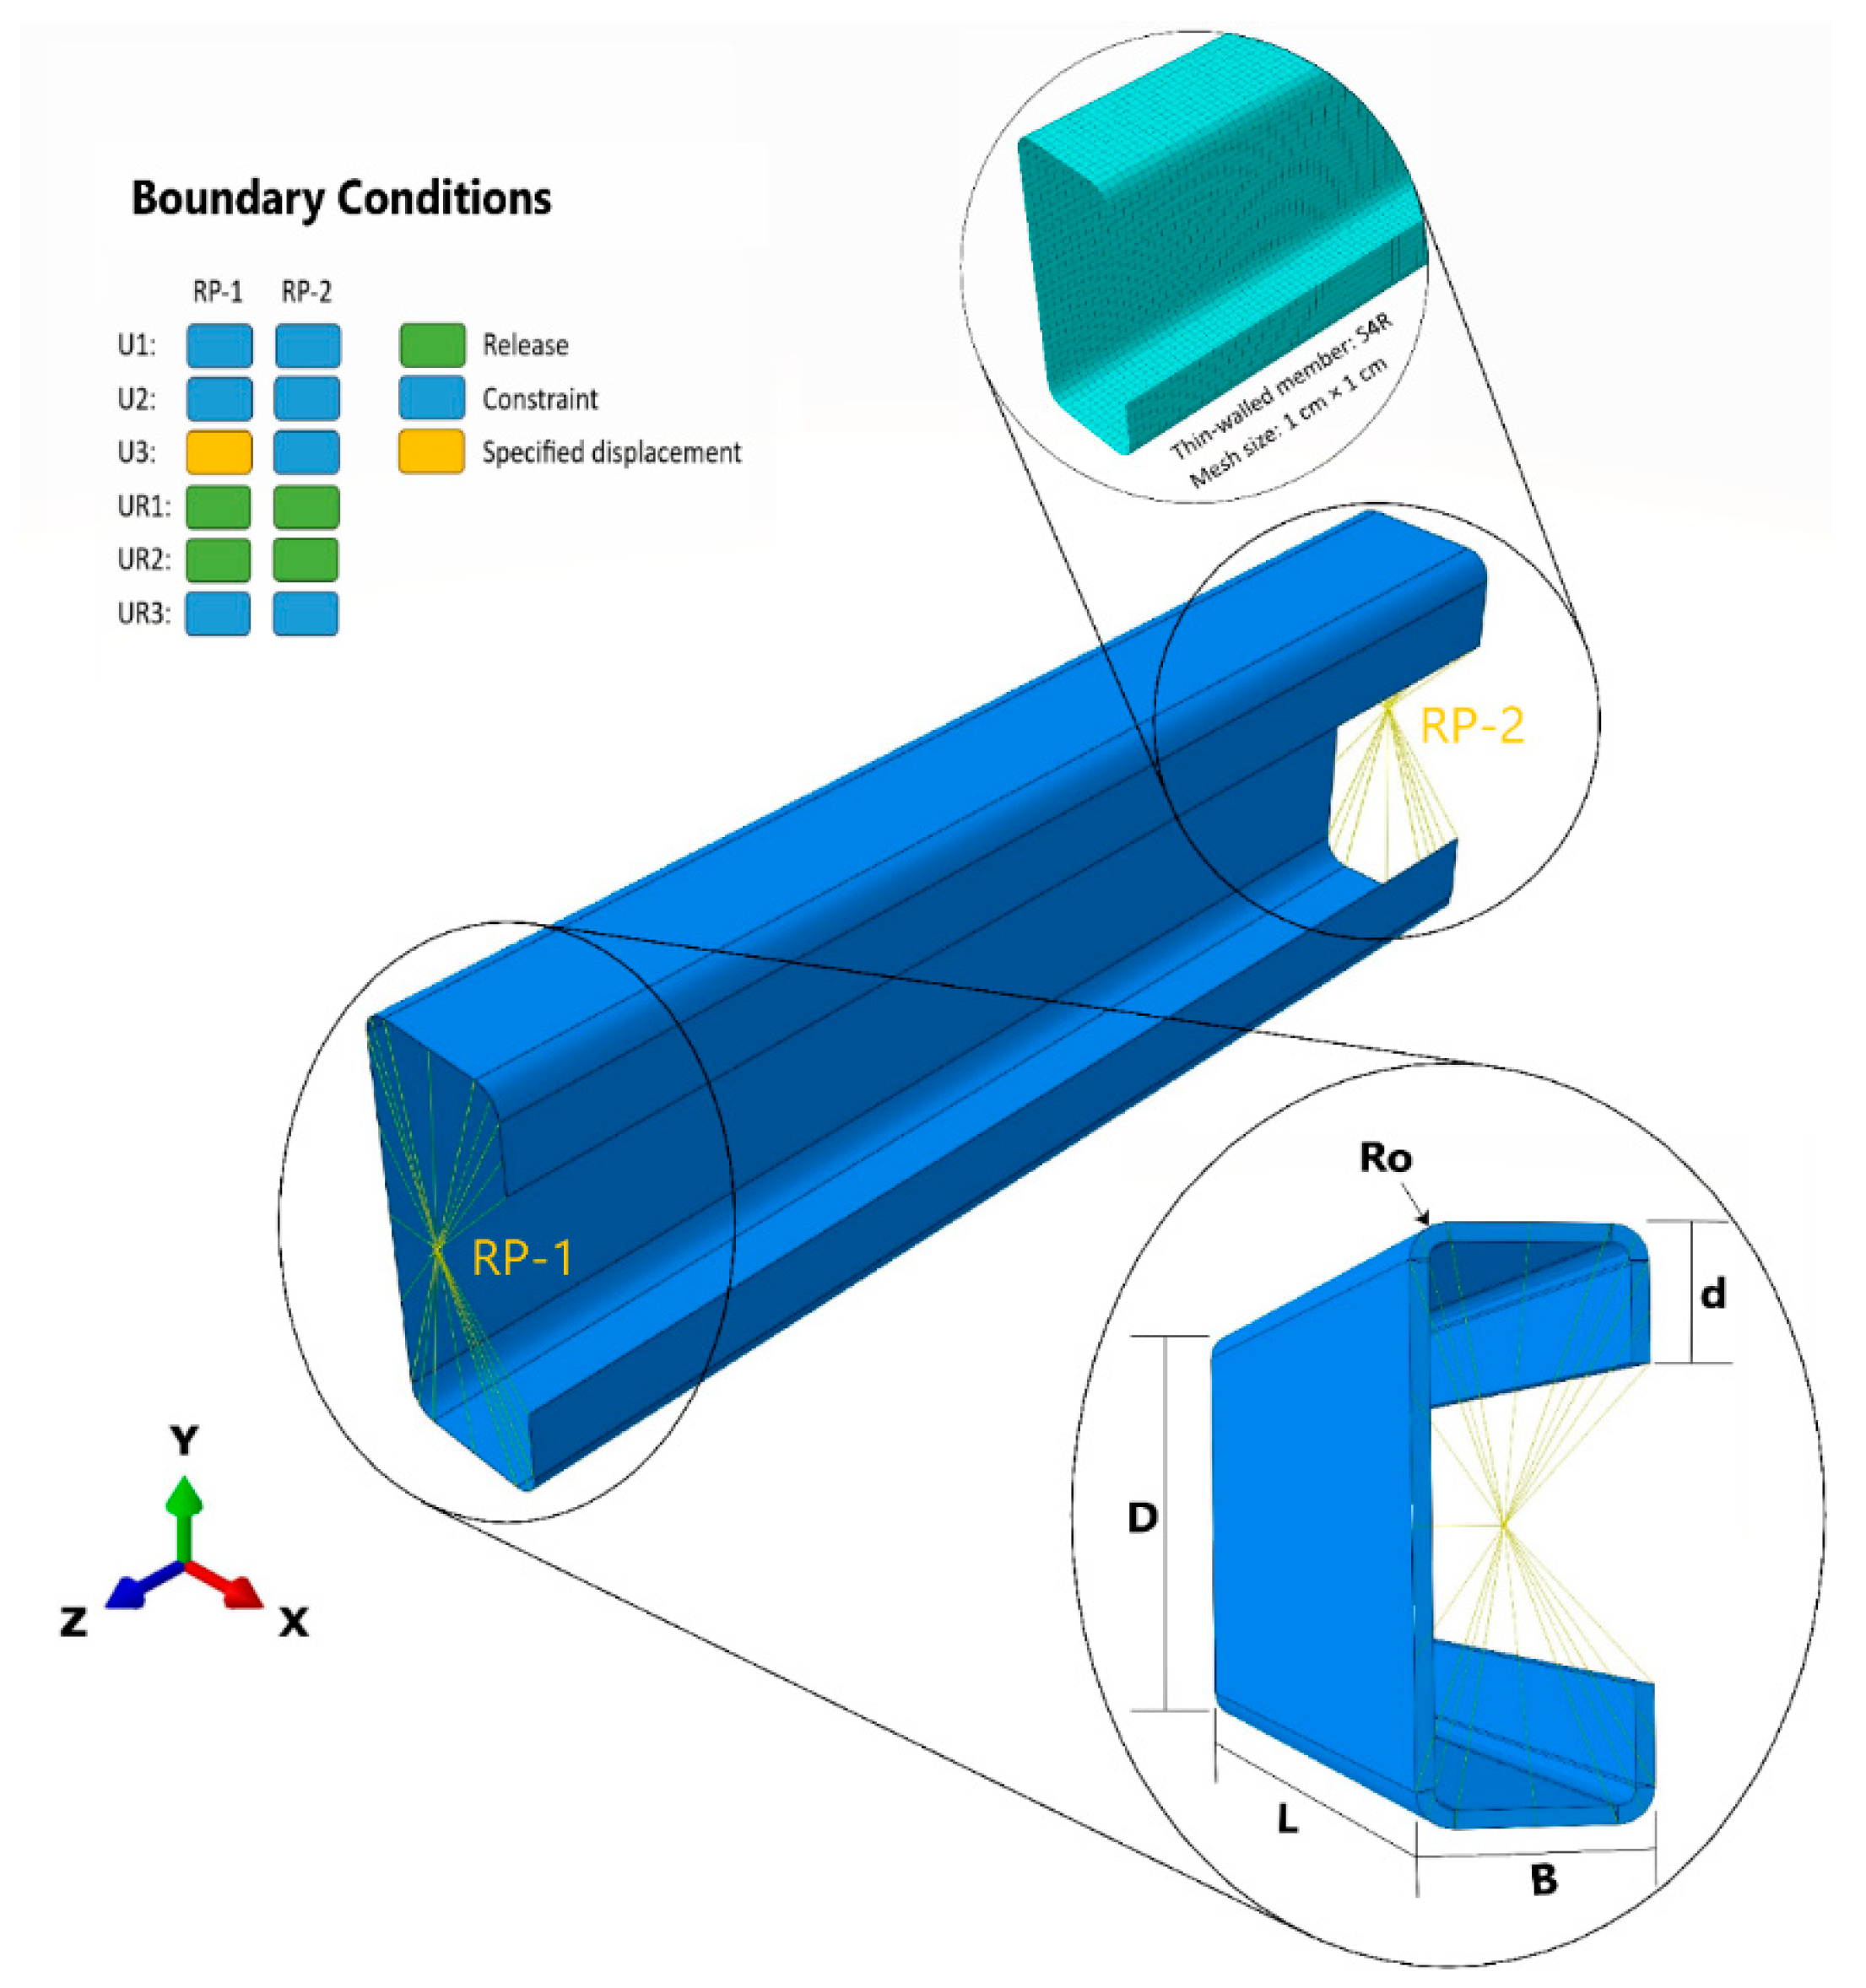
3.2. Mesh Size and Element Type

The components of each member were simulated using the S4R [32,33] element, a quadrilateral stress/displacement shell element featuring reduced integration and a large-strain formulation. With four nodes, each possessing six degrees of freedom, the S4R element is particularly adept for modeling thin-walled constructions and is highly efficient in terms of computational resources. To ensure accuracy, convergence studies were conducted, and a mesh size of 1 cm × 1 cm was determined as optimal, as illustrated in Figure 2.

3.3. Loading Method and Boundary Conditions

The FE method setup for this study involved implementing simply supported boundary conditions across all FEMs of the single channel members, as depicted in Figure 2. Initially, a coupling constraint was applied to each end cross-section, connecting it to a reference point (RP-1 or RP-2) positioned at its centroid. Subsequently, all movements (U1, U2, and U3) and rotations (UR3) of the lower reference point (RP-2) were constrained. Similarly, the initial reference point (RP-1) was fixed, except axial displacement (U3) was not restricted. Axial compression loading was applied through RP-1 using displacement control.

4. Validation of the Developed Finite Element Models

Based on the load-displacement curves, failure types, and ultimate loads, the derived FEMs were verified. As illustrated in Figure 5, the distorted forms of the test specimens closely match those predicted by the FE analyses. According to the linear buckling analysis conducted in accordance with AISI S100, the axial load capacity of the columns is governed by both local and global buckling. Moreover, the final loads predicted by FE analysis are consistent with those obtained from the tests, as depicted in Figure 4 and detailed in Table 2. The axial load versus axial displacement curve patterns from both the tests and FE studies are identical, further confirming the accuracy of the FEMs (Figure 4). Overall, the constructed FEMs are deemed reliable in predicting mode of failure and the compression capability of individual channel sections.

4.1. Specimen Design

To substantiate this research, four types of CFS with lipped channel members were selected, taking into account the width–thickness ratio (D/t) and the steel strength grade. Prior to conducting the tensile test, the initial geometric dimensions of each sample, including gauge length, thickness, and breadth, were measured. A comprehensive explanation of these dimensions is provided in Table 1, while Figure 2 illustrates the symbols representing the sizes of each section.

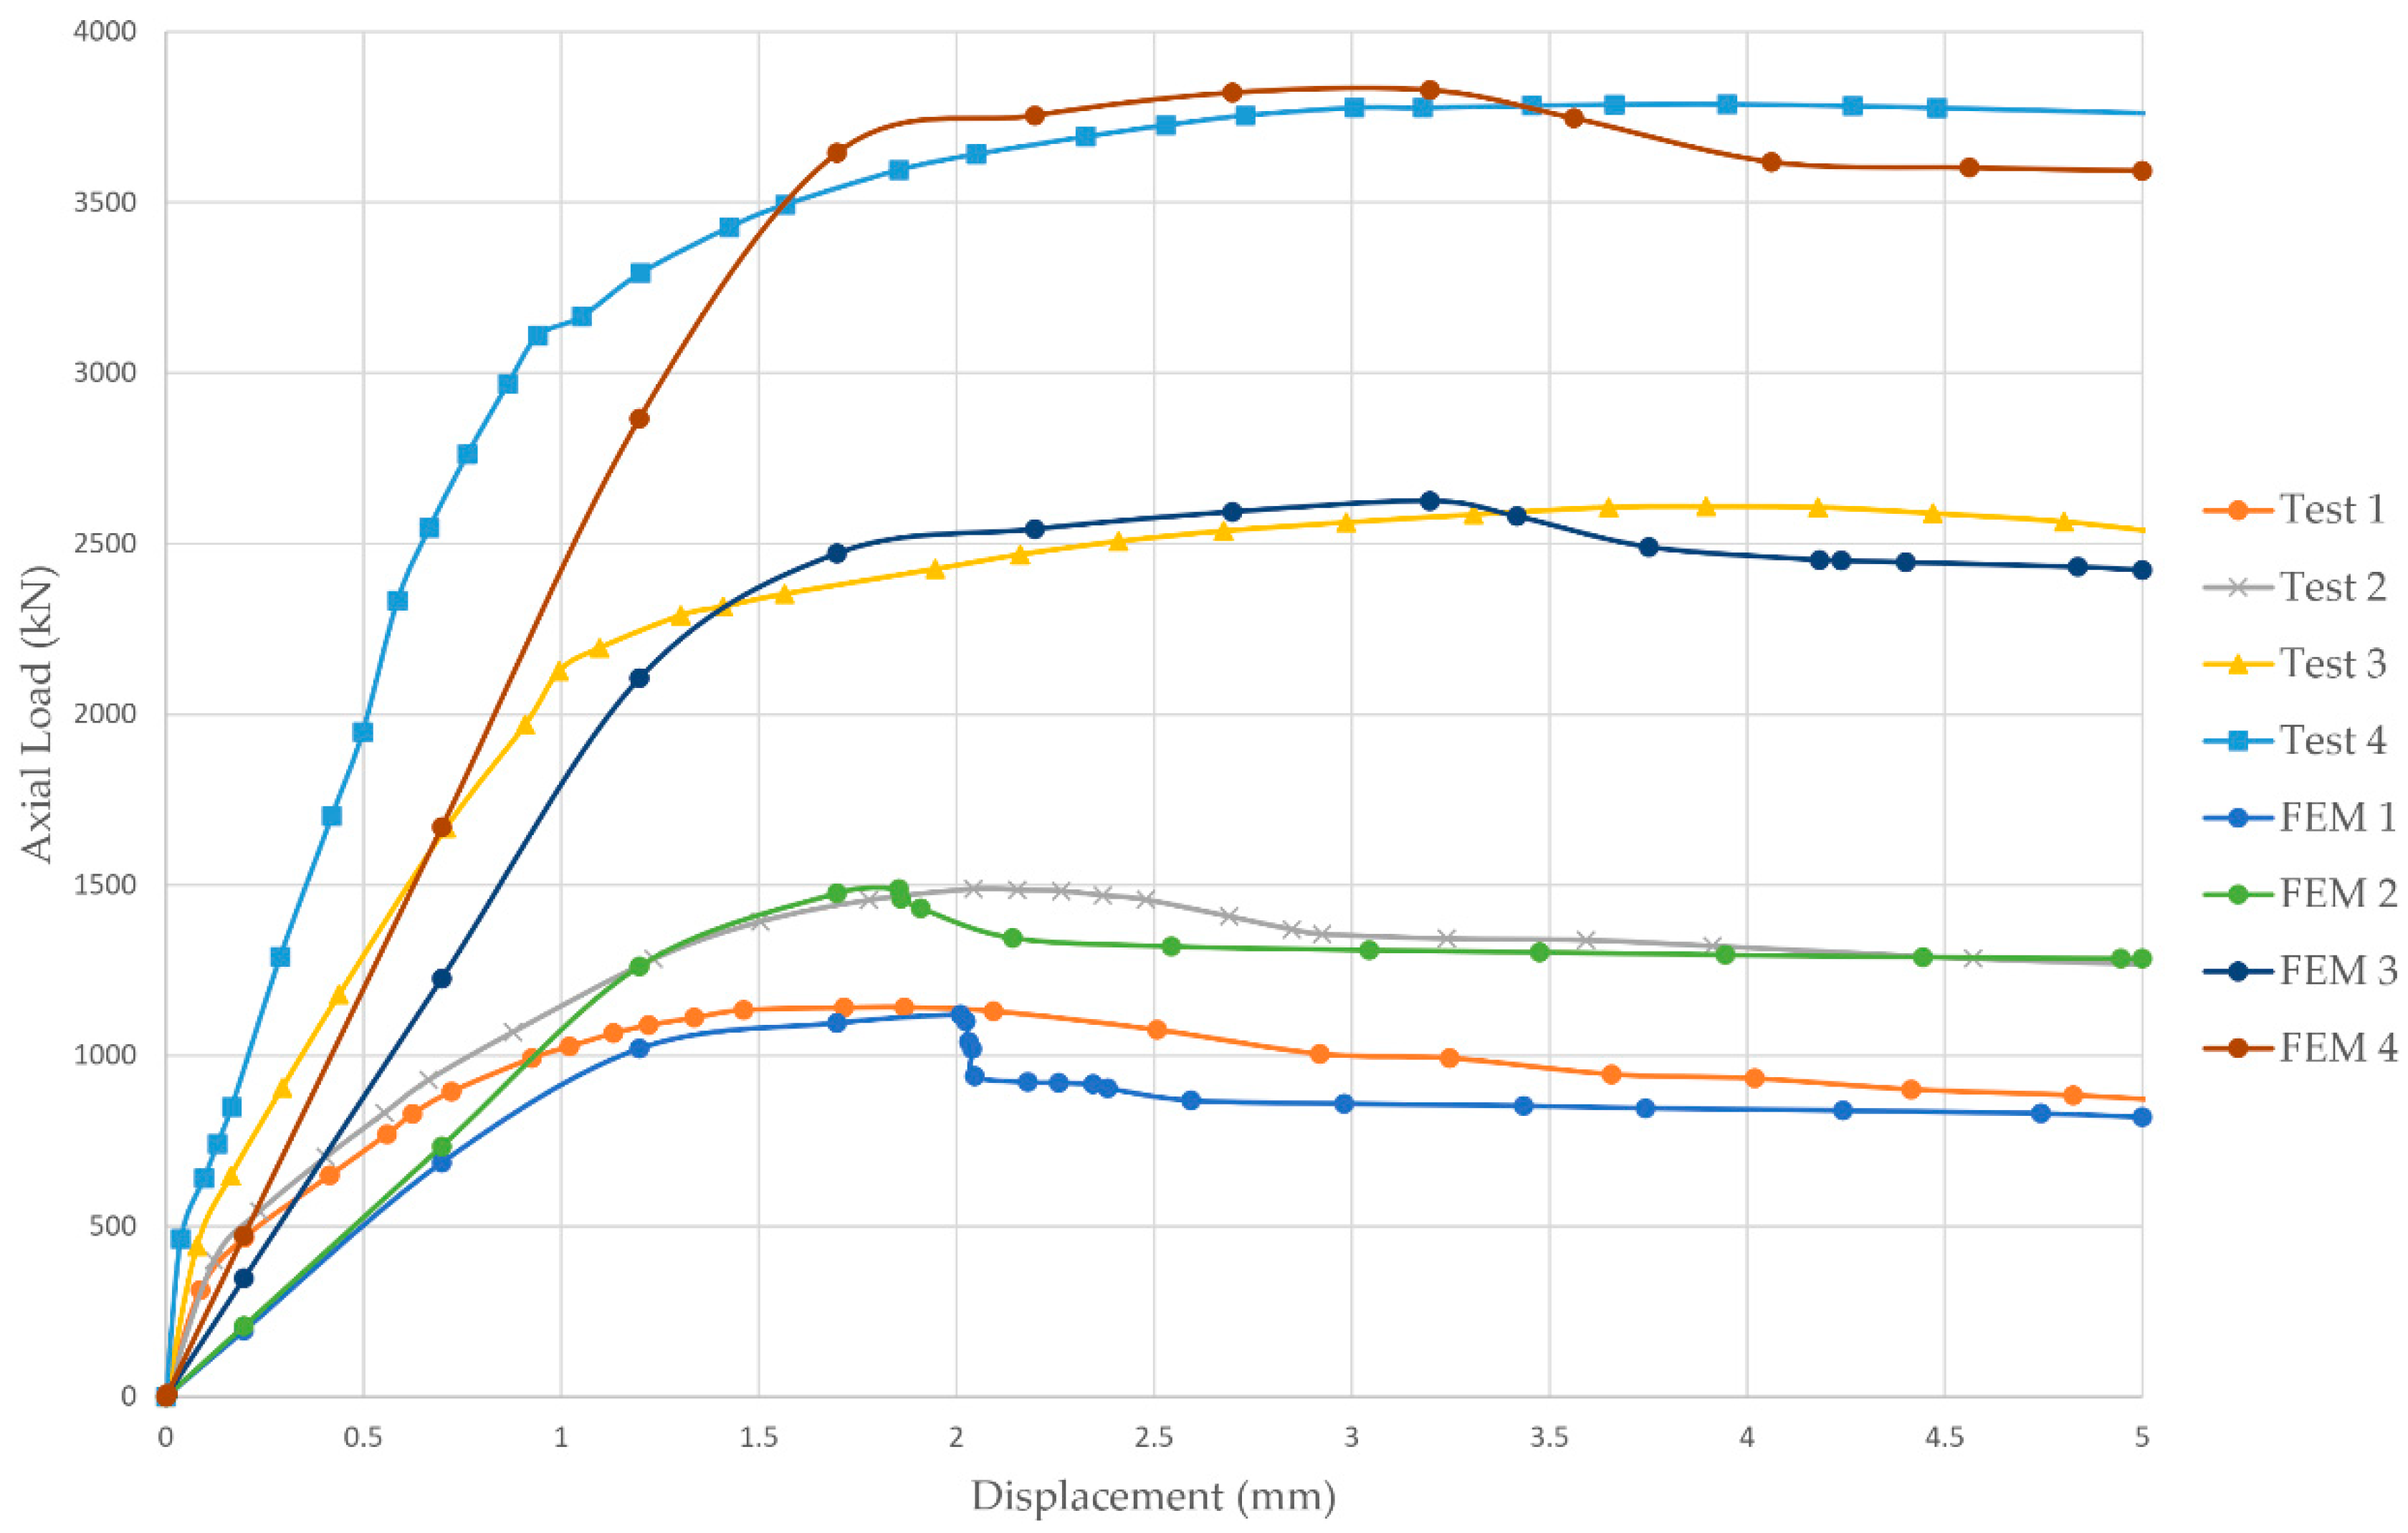
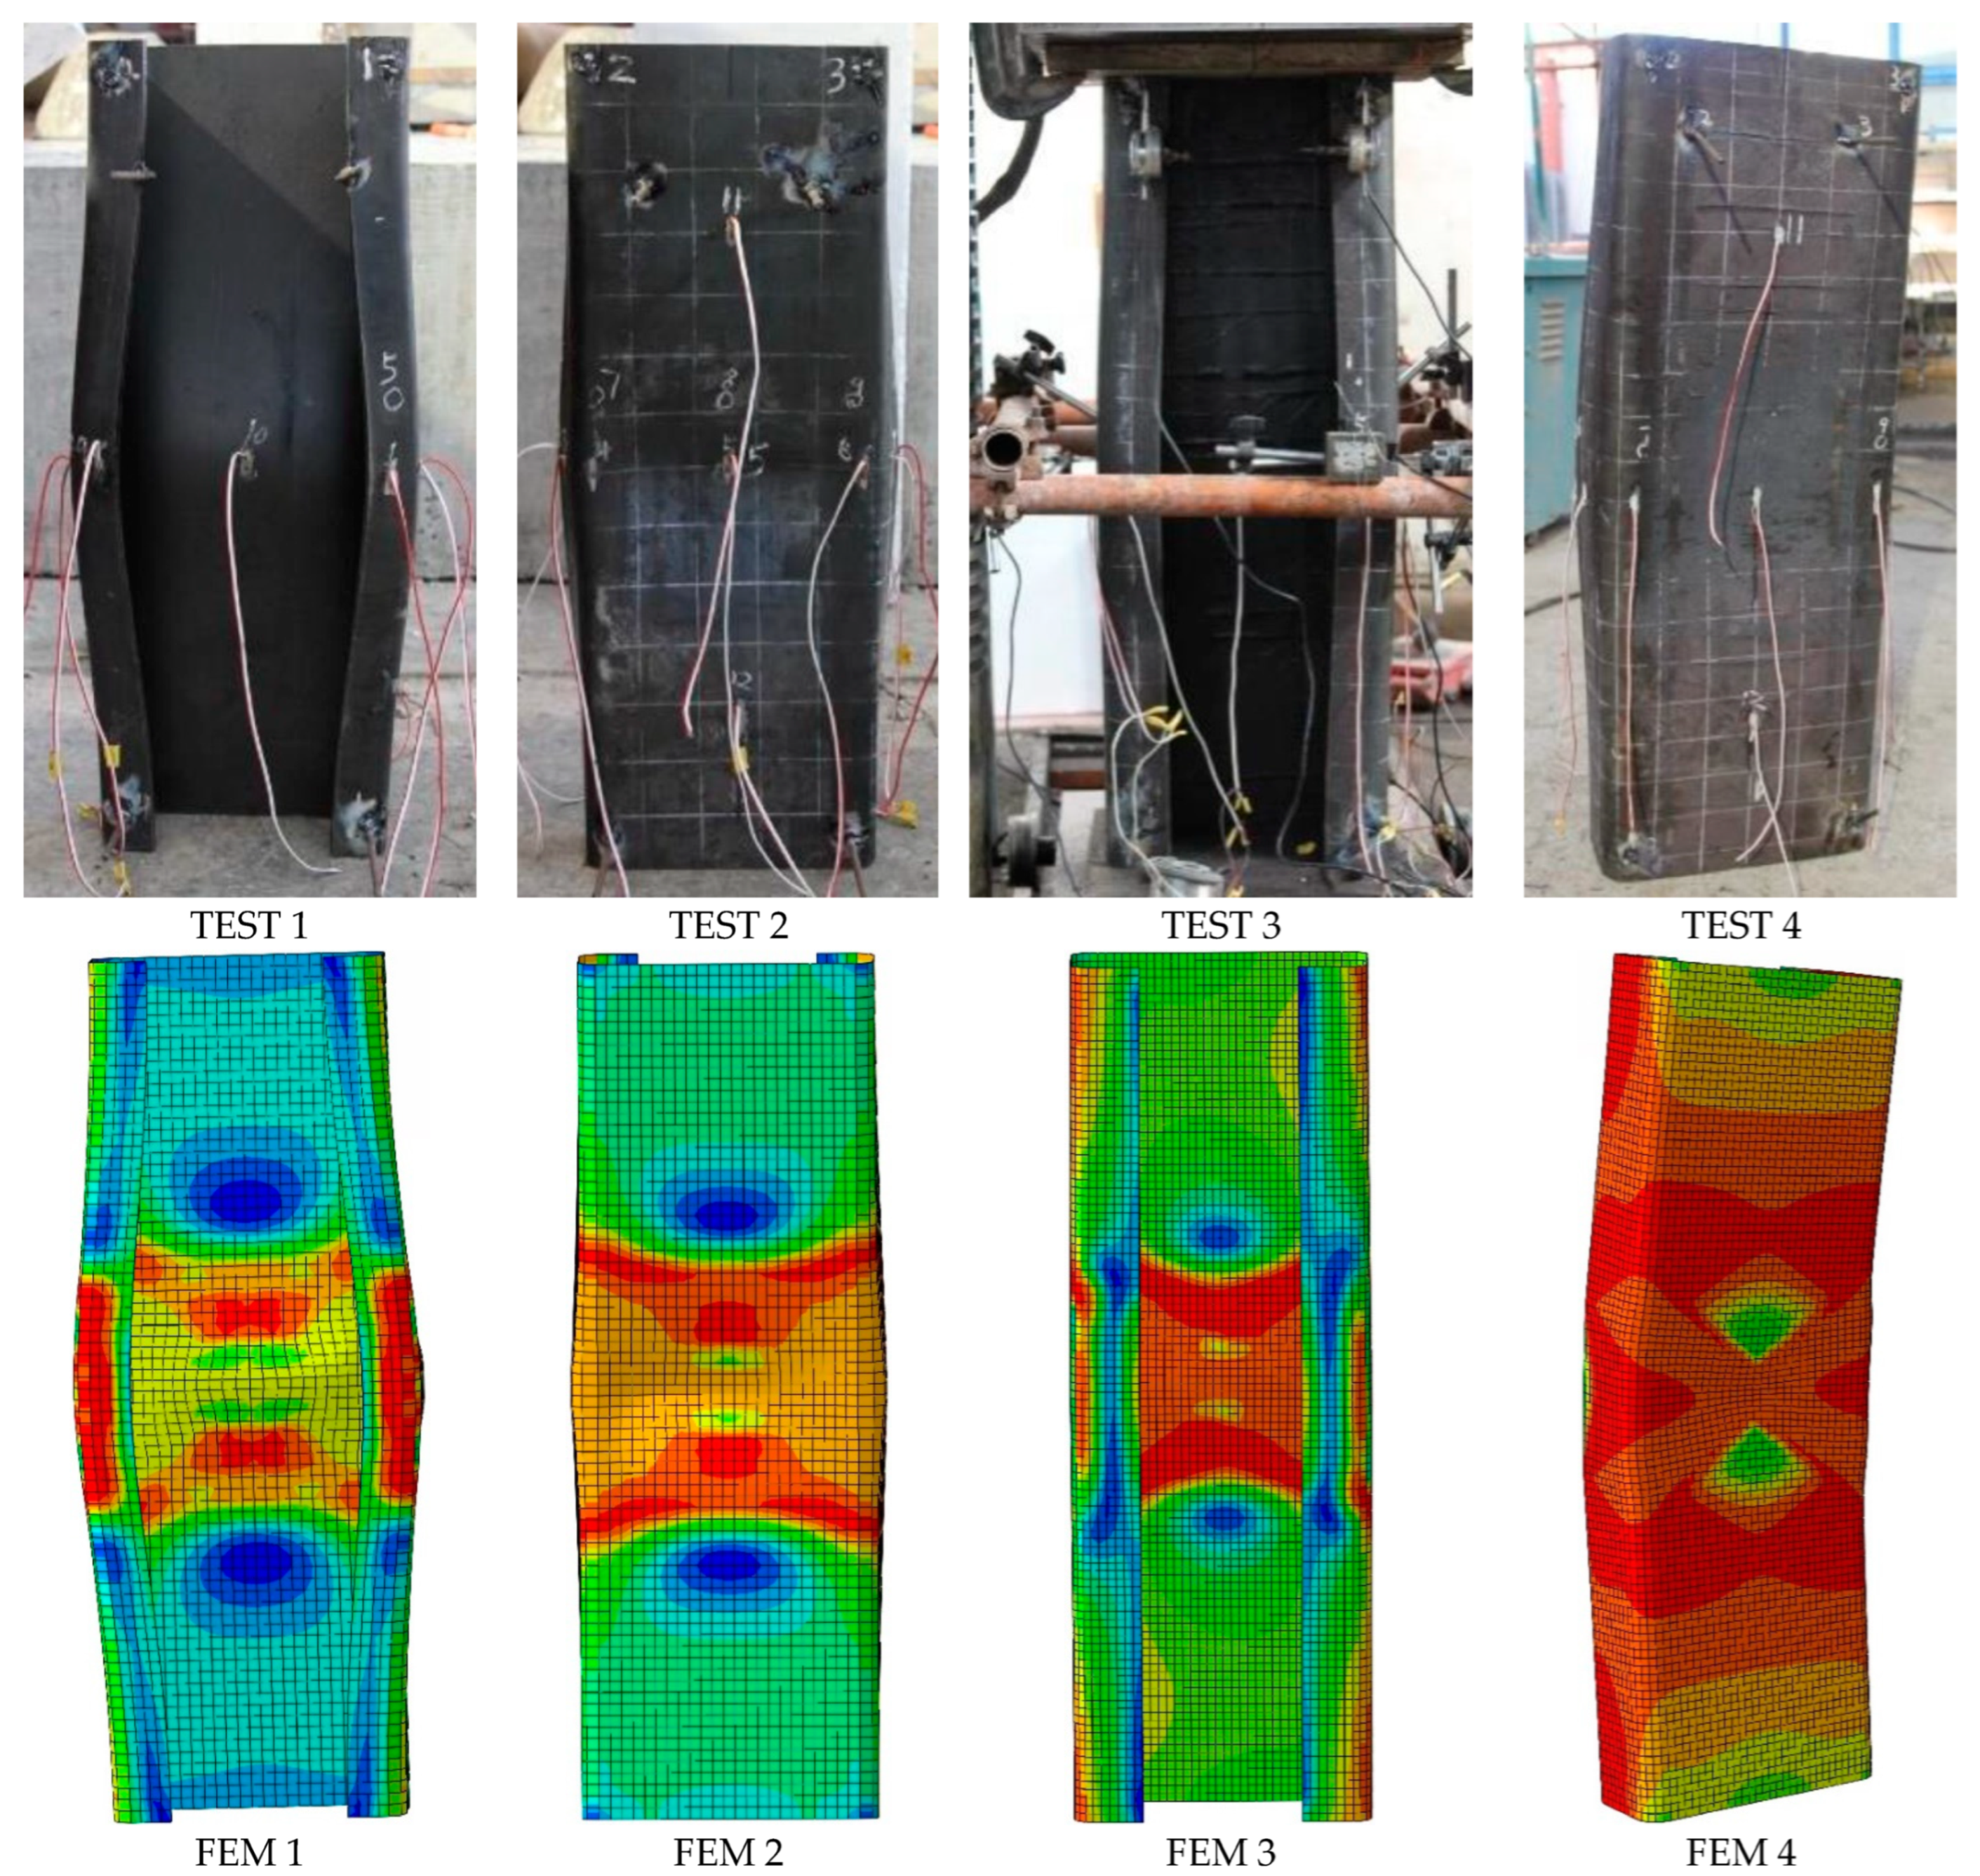
4.2. Test Results Analysis

The yield strength of the material was determined by different methods depending on the presence of a yield platform. For the specimen with a yield platform, the yield strength was determined by the yield point, as described by Fu X et al. [34]. Conversely, for the specimen without a yield platform, the yield strength was determined by the stress indicative of a 0.2% plastic strain. The dimensions, elastic modulus (E), yield strength (Fy), and center of gravity of all specimens are presented in Table 1.

4.3. Material Properties and Geometry

For the parametric study and test specimens, the entire geometry was meticulously modeled. To enhance accuracy, the FEM was modified to include material nonlinearity by specifying the “true” values of stresses and strains. All analyses and model validations were conducted using the ABAQUS classical metal plasticity model. In this model, the von Mises yield surface is implemented to define isotropic hardening behavior, associated plastic flow theory, and isotropic yielding. Furthermore, a simplified stress–strain curve for elastic-plastic that adheres to the von Mises yield criterion was employed for the parametric investigation. This approach ensured a robust representation of material behavior under various loading conditions.
бt = бE × (εE + 1)
εt = ln(εE + 1)
εt (Plastic) = ln(εE + 1) − бt/E
The variables E, σE, and εE represent the Young’s modulus, engineering stress, and strain, respectively. In contrast, σt and εt represent true stress and strain, respectively, in ABAQUS. The relationship between engineering and true curves is shown in Figure 3.

4.4. Comparison of Various Findings

In order to validate the precision of the FEM and the AISI & AS/NZS findings for the four chosen short columns, the calculated outcomes were compared to the results obtained from short column tests. The findings of the comparison are illustrated in Table 2.
Based on Table 2, the following conclusions can be inferred:
The mean value of the geometrically and materially nonlinear FEM results relative to TEST results is approximately 96.8%. This value, though slightly below 100%, indicates that the FEM results are conservative and deemed safe for assessing thin-walled steel short columns. Moreover, the proximity of the mean value to 100% suggests that the FEM results are accurate and reliable. In contrast, the sample standard deviation (S) of the FEM/TEST results is 0.0187, a small value indicating high precision in predicting the axial load capability of short columns using FEM.
However, the mean value of the elastic linear results obtained from AISI & AS/NZS relative to TEST results is about 88.5%. This value, below 100%, suggests that the AISI & AS/NZS results tend to be conservative and less economical for determining the axial load capacity of CFS short columns. Moreover, the sample standard deviation of the AISI & AS/NZS/TEST results is 0.0401, reflecting variability but still within acceptable limits for practical use. In summary, while the FEM approach proves accurate and reliable with minimal deviation, the AISI & AS/NZS method, while safe, may be overly conservative and less cost-effective for evaluating thin-walled steel short columns.

4.5. Verification of Finite Element Model

The load-axial shortening relationship, analyzed through both geometrically and materially nonlinear finite element method (FEM) simulations and physical testing (TEST) of all four columns, is presented in Figure 4. Initially, the relationship exhibited predominantly linear behavior, transitioning to nonlinear behavior until reaching the failure load. The validated finite element models were evaluated based on failure modes, load-displacement curves, and ultimate loads. Figure 4 illustrates a strong correlation between the deformed shapes observed in physical tests and those predicted by the finite element (FE) models.
Figure 5 presents a comparison between the experimental test results and the FE results of short columns from column 1 to 4. Additionally, Figure 5 illustrates the failure scenarios for the aforementioned four columns. It is evident that the FE findings closely align with the experimental test results. Therefore, the experimental and finite element findings demonstrate a high level of concordance in terms of both the ultimate strength and the failure mechanism. Figure 4 and Figure 5 provide evidence supporting the correctness of Table 2, which presents a comparison between the failure load obtained from experimental testing and the failure load predicted by finite element analysis.

5. Parametric Study and Result

5.1. General

This study gives a thorough examination of the influence of key geometrical parameters on the compressive response and axial load capacity of CFS columns. To achieve this, validated nonlinear elastic-plastic FE models were employed. These models enabled a systematic parametric analysis encompassing 208 different configurations. Specifically, the analysis focused on the effects of element thickness, column length, and eccentricity from the centroid. The FE models were meticulously constructed based on the experimentally determined external dimensions of four CFSC sections. These sections comprised single channels subjected to axial compressive loading. The subsequent sections will elaborate on the specific challenges encountered during the modeling process, providing detailed insights into the methodologies and considerations involved.

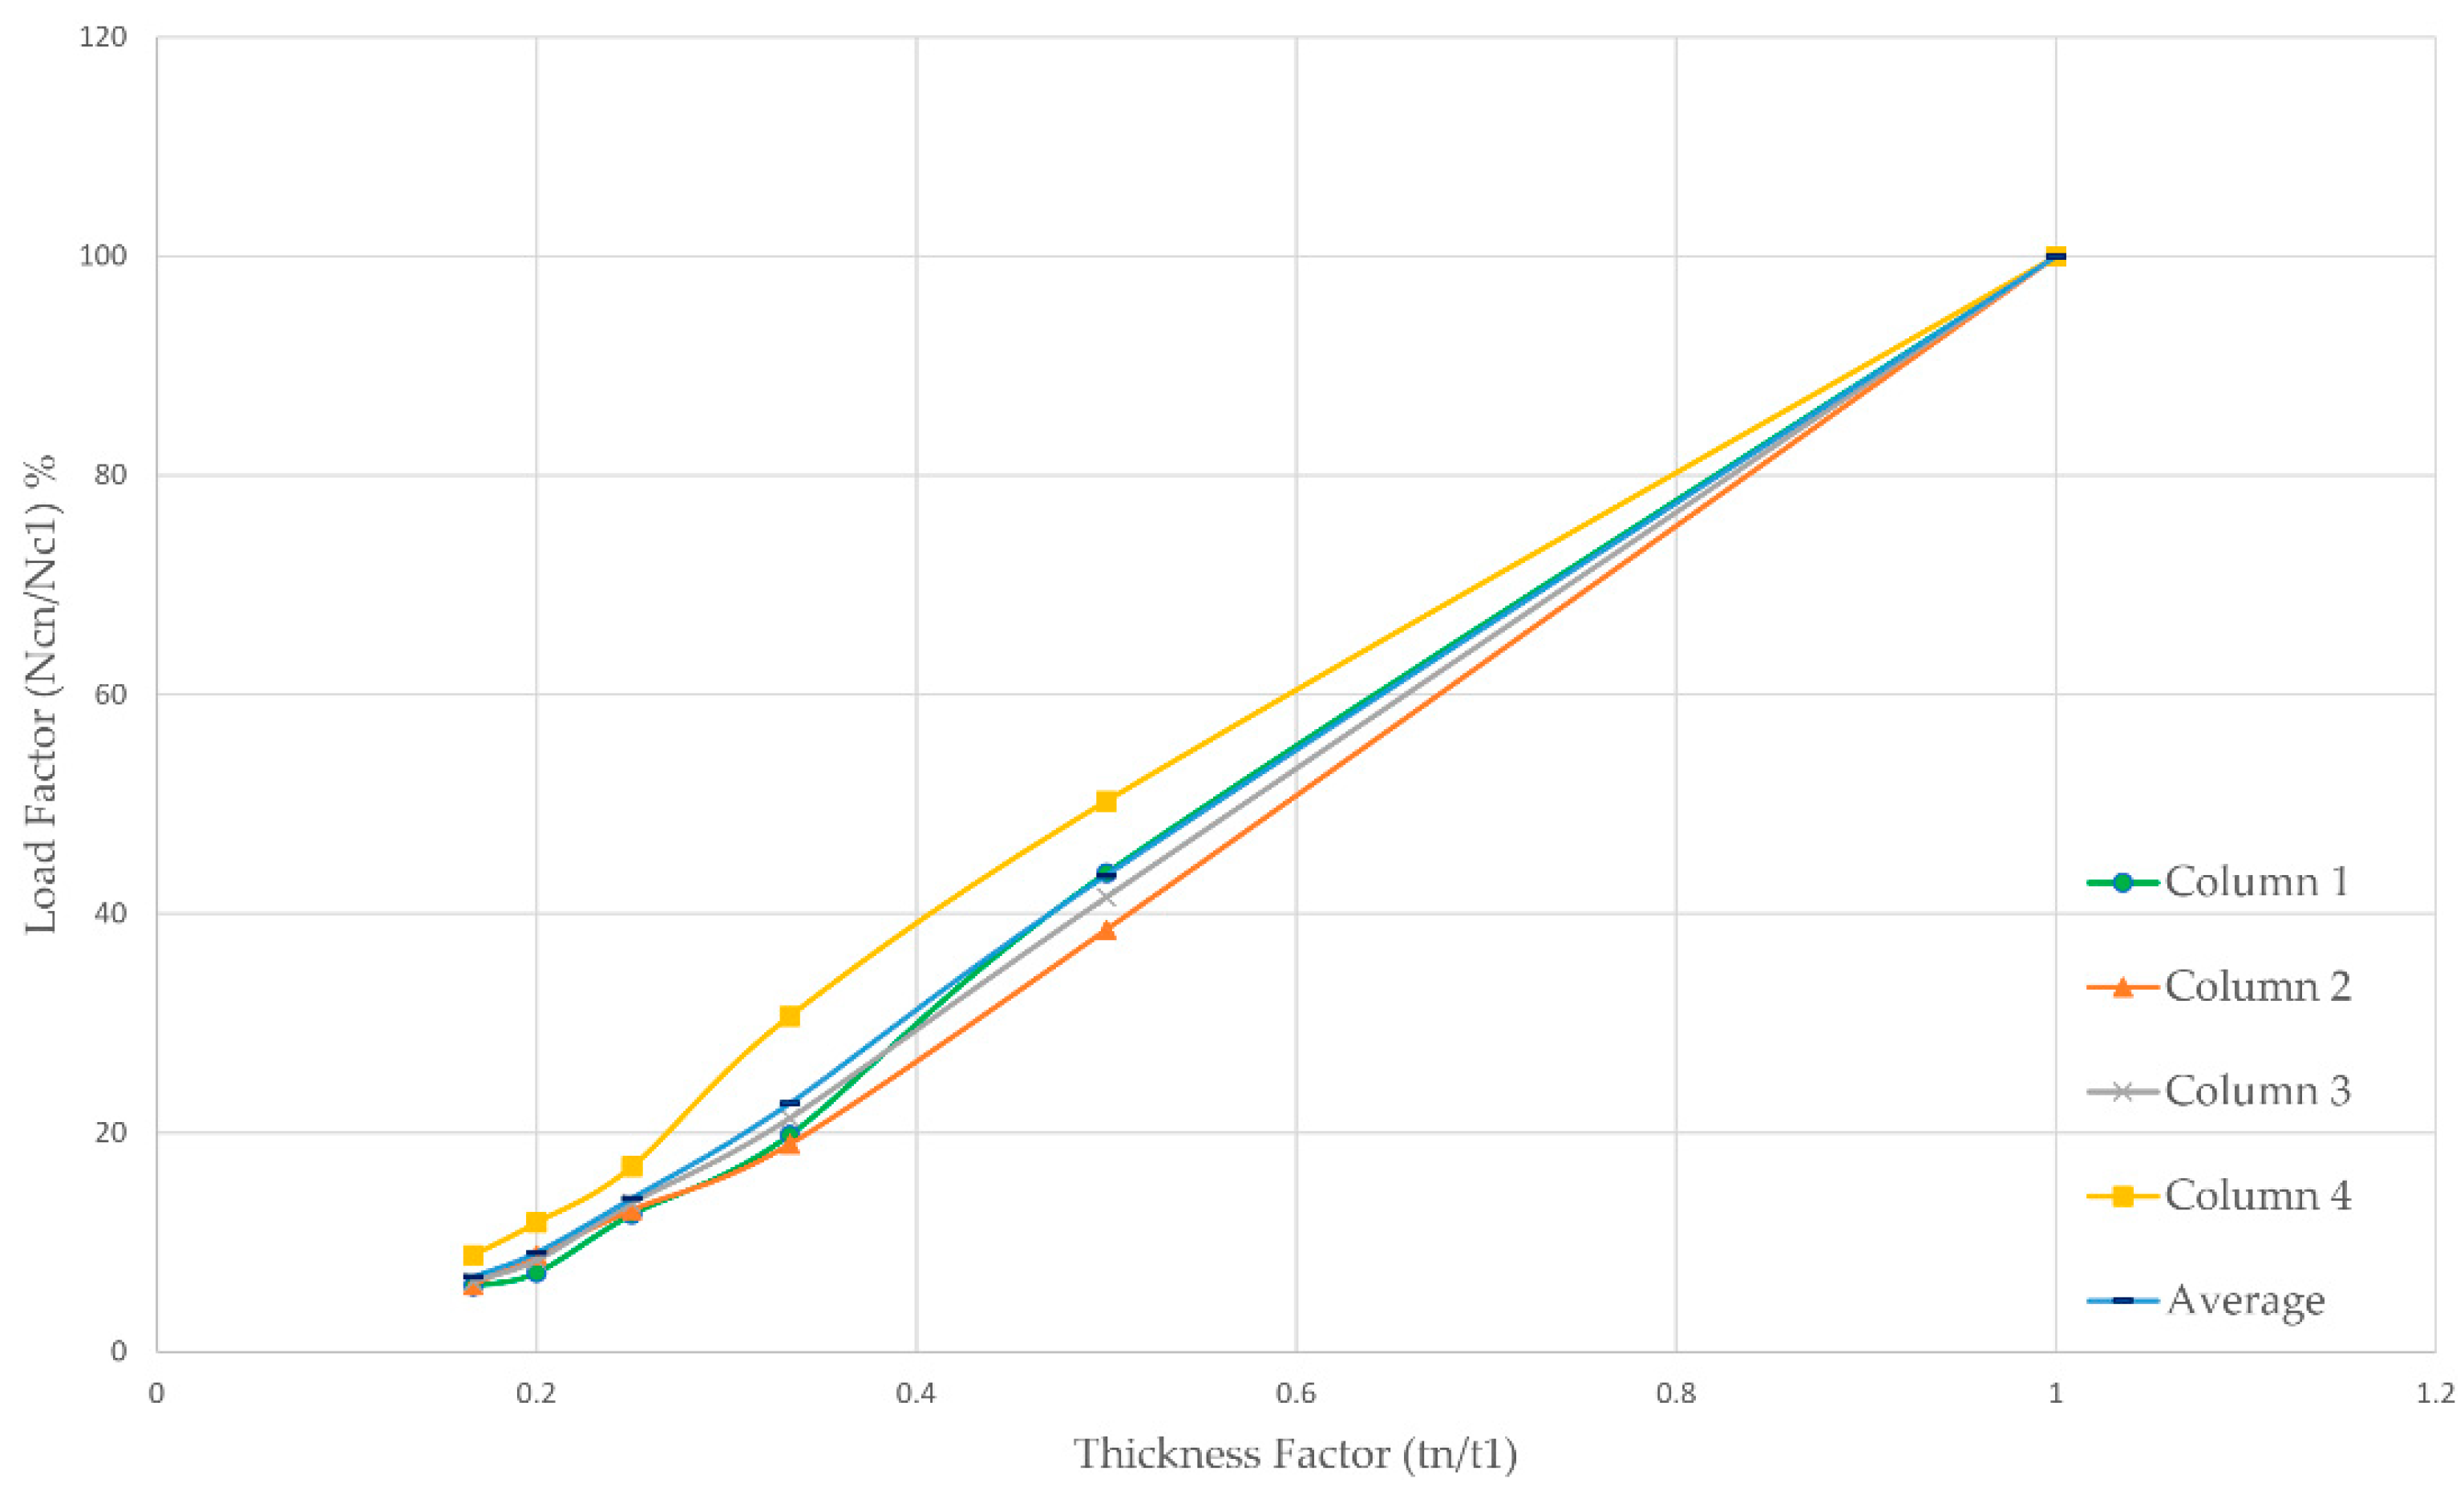
5.2. The Effect of Member Thickness

This section explores the relationship between section thickness and the axial load capacity of validated finite element model (FEM) columns. To investigate this relationship, a systematic reduction in thickness was applied to each of the four columns, with reduction factors ranging from 1.0 to 6.0. Subsequently, the axial load capacities of the reduced-thickness columns were determined and documented. In order to facilitate comparison, the axial load capacity of each reduced-thickness column was normalized by dividing it by the capacity of the corresponding unreduced-thickness column. This normalization procedure was employed for all four validated FEM columns. By doing so, it allows for a clearer understanding of how section thickness impacts the axial load capacity, providing valuable insights for the design and analysis of FEM columns.
The present investigation reveals a substantial correlation between the thickness of CFS sections and the axial load capacity of columns. As evidenced in Table 3 and Figure 6, a direct linear relationship exists between these parameters. Specifically, a reduction in section thickness demonstrably translates to a proportional decrease in their capacity to resist axial loads. Notably, when the average thickness is reduced to one-half, one-third, one-quarter, one-fifth, and one-sixth of its original value, the corresponding reductions in average axial load capacity are approximately 56%, 77%, 86%, 91%, and 93%, respectively. This indicates that even slight decreases in section thickness can lead to significant reductions in the CFS columns’ axial load capability. Consequently, careful consideration must be given to section thickness in the design and application of these structural elements.

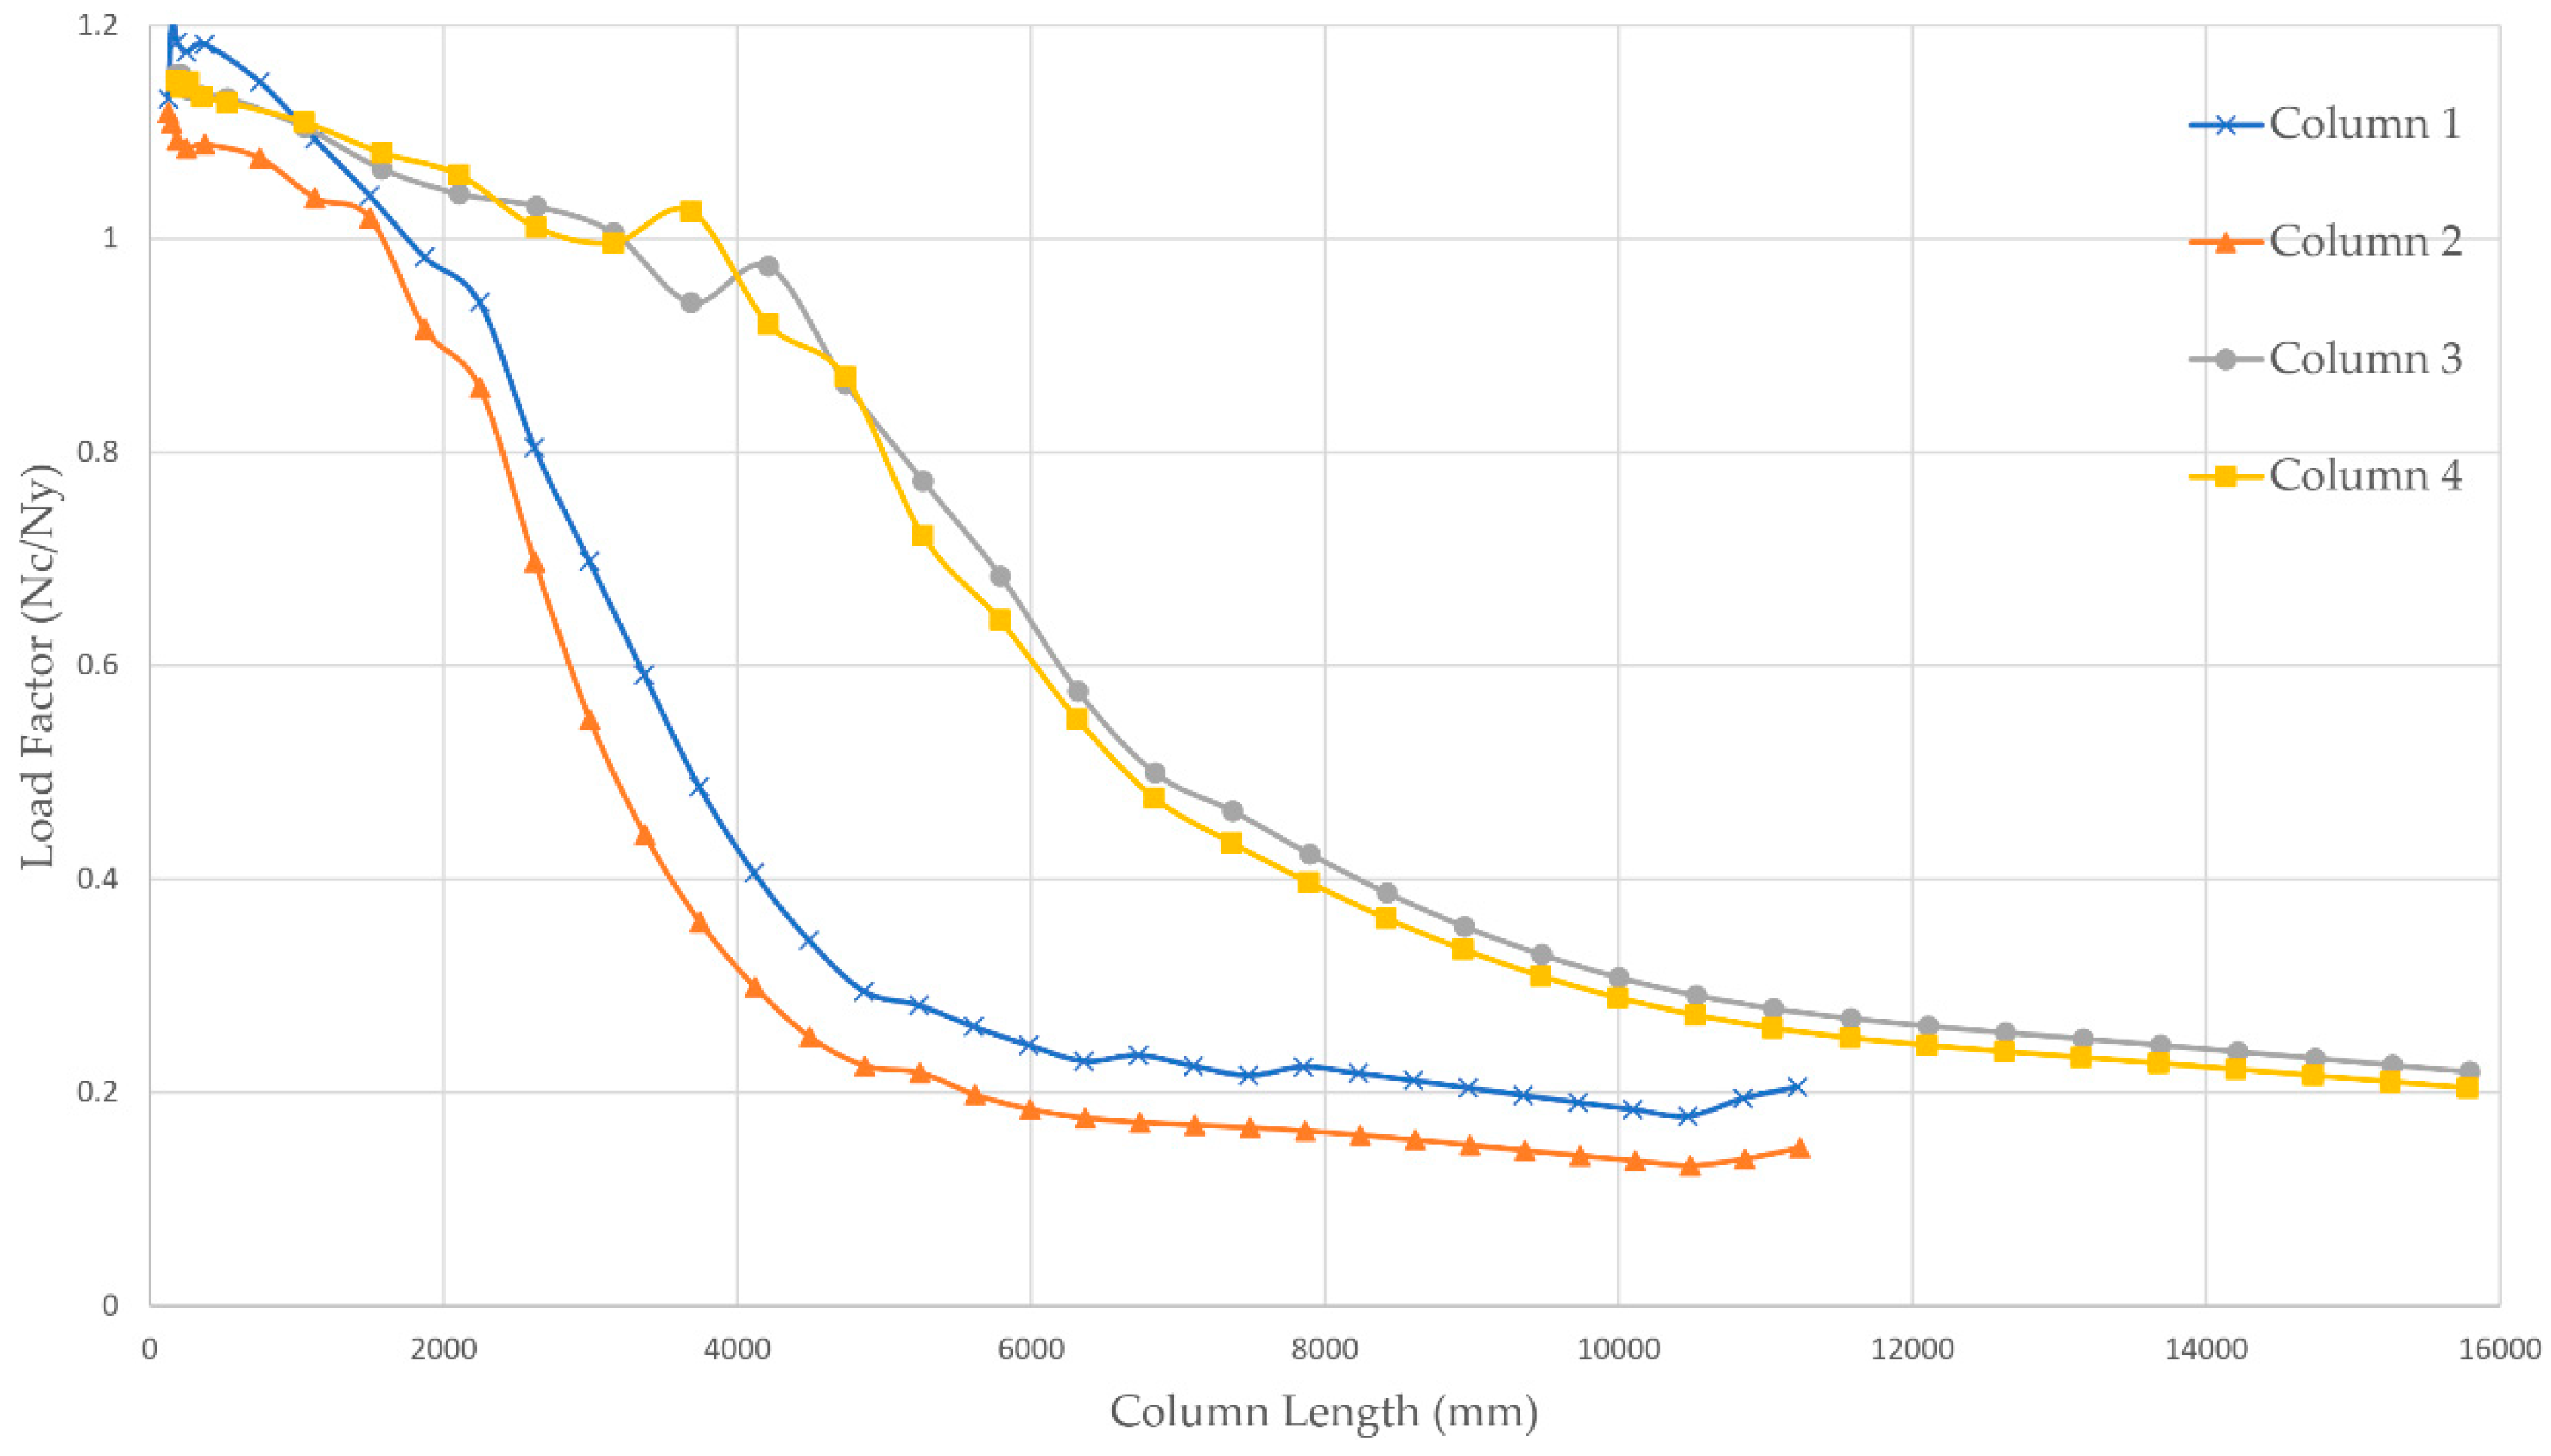
5.3. The Effect of Member Length

This section investigates the influence of member length on the axial load capability of short and long columns. To achieve this, a systematic parametric analysis is conducted, utilizing four validated FEMs representative of both short- and long-column configurations. Initially, the length of these FEMs will be linearly varied to quantify the impact on their axial buckling behavior. This methodical approach will facilitate a comprehensive understanding of the interplay between section length and load-carrying capacity in compression members. By examining both short and long columns, the analysis aims to uncover the nuanced effects that section length has on the structural performance of these elements under axial loads.
This study examines the effect of column length on the CFS sections’ axial load capability. As evidenced by Table 4 and Figure 7, minimal reductions in length have a negligible impact on the axial capacity of short CFS columns. However, for longer members, a nonlinear inverse relationship between column length and axial capacity becomes evident. In particular, Columns 1 and 2 exhibit a significant decrease in axial load capacity with increasing length, with a critical point observed at approximately 5 m. Beyond this point, the influence of further length increments becomes less pronounced. Similarly, Columns 3 and 4 show a substantial reduction in capacity up to 11 m, followed by a more gradual decline for even longer columns.
On average, a modest increase in axial load capacity, ranging from only 2% to 4%, was observed when the column length was reduced by factors of one-half, one-third, one-fourth, one-fifth, and one-sixth. Conversely, increasing the column length by factors of two, three, four, five, and six resulted in significant reductions in capacity, reaching approximately 6%, 14%, 29%, 47%, and 61%, respectively. These findings highlight the critical role of column length in CFS member design. Shorter columns demonstrably possess a superior capacity to bear axial loads compared to their longer counterparts. This knowledge can be strategically employed to optimize member selection and promote enhanced structural efficiency in CFS projects.

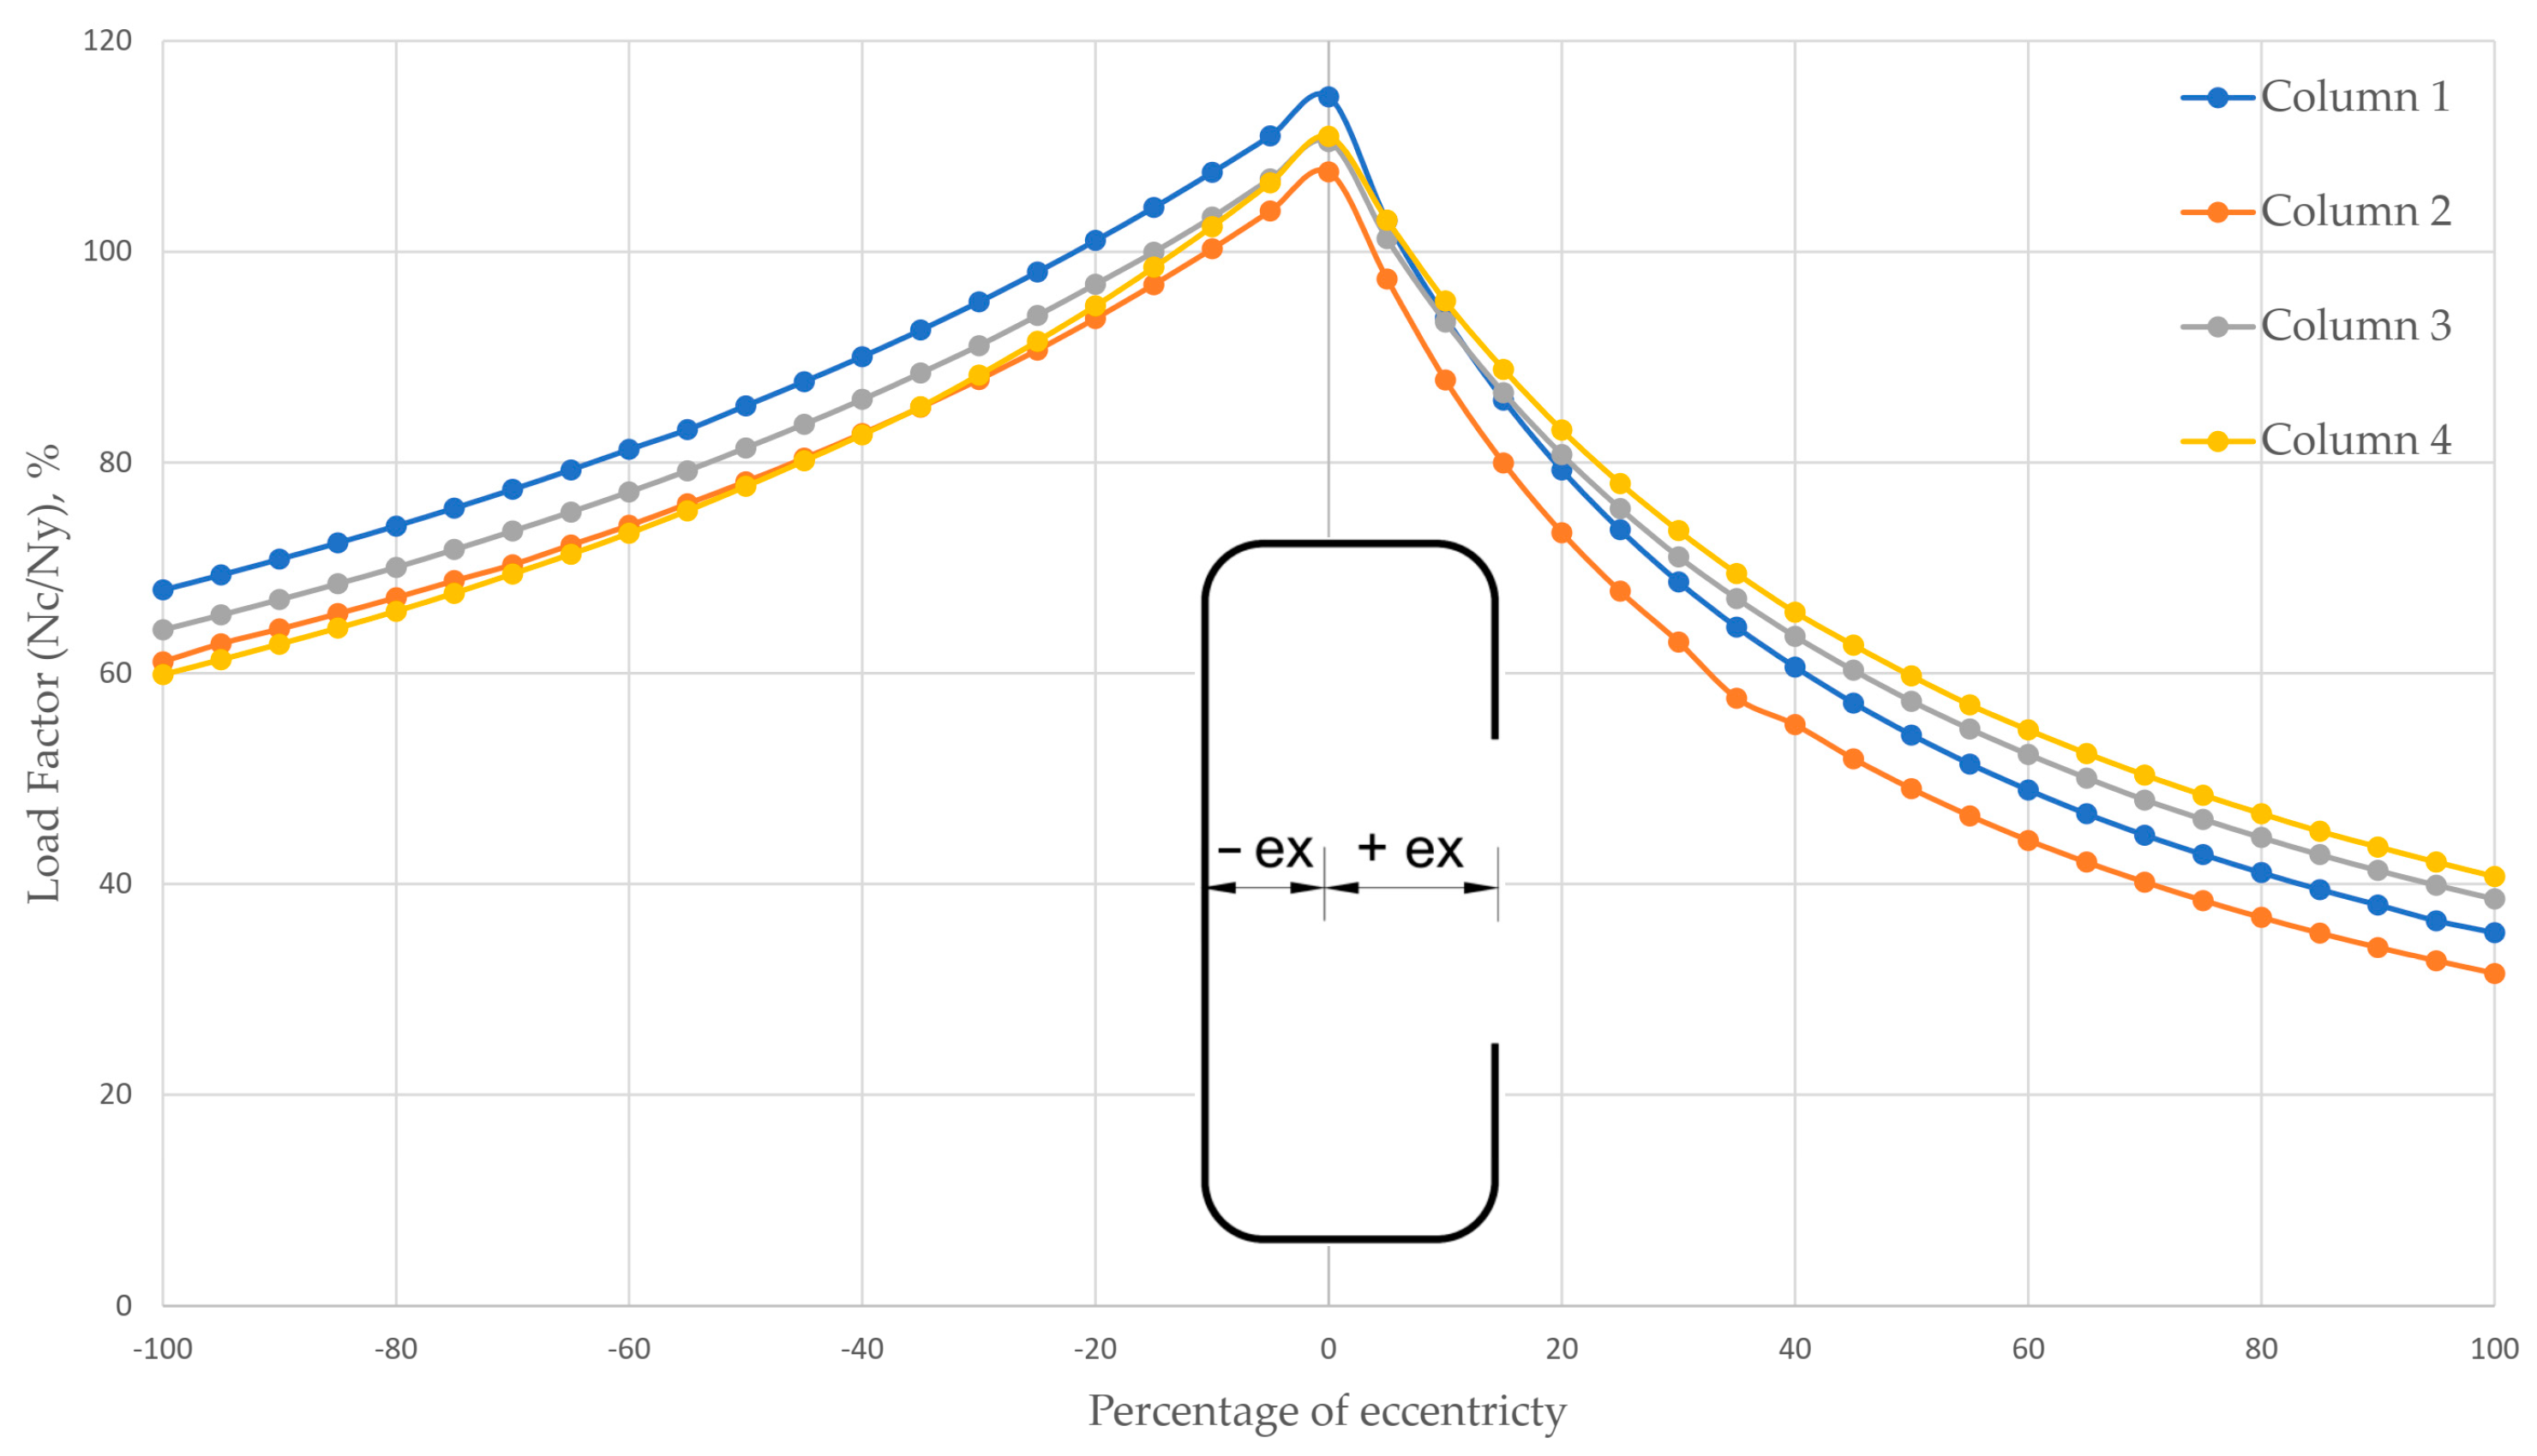
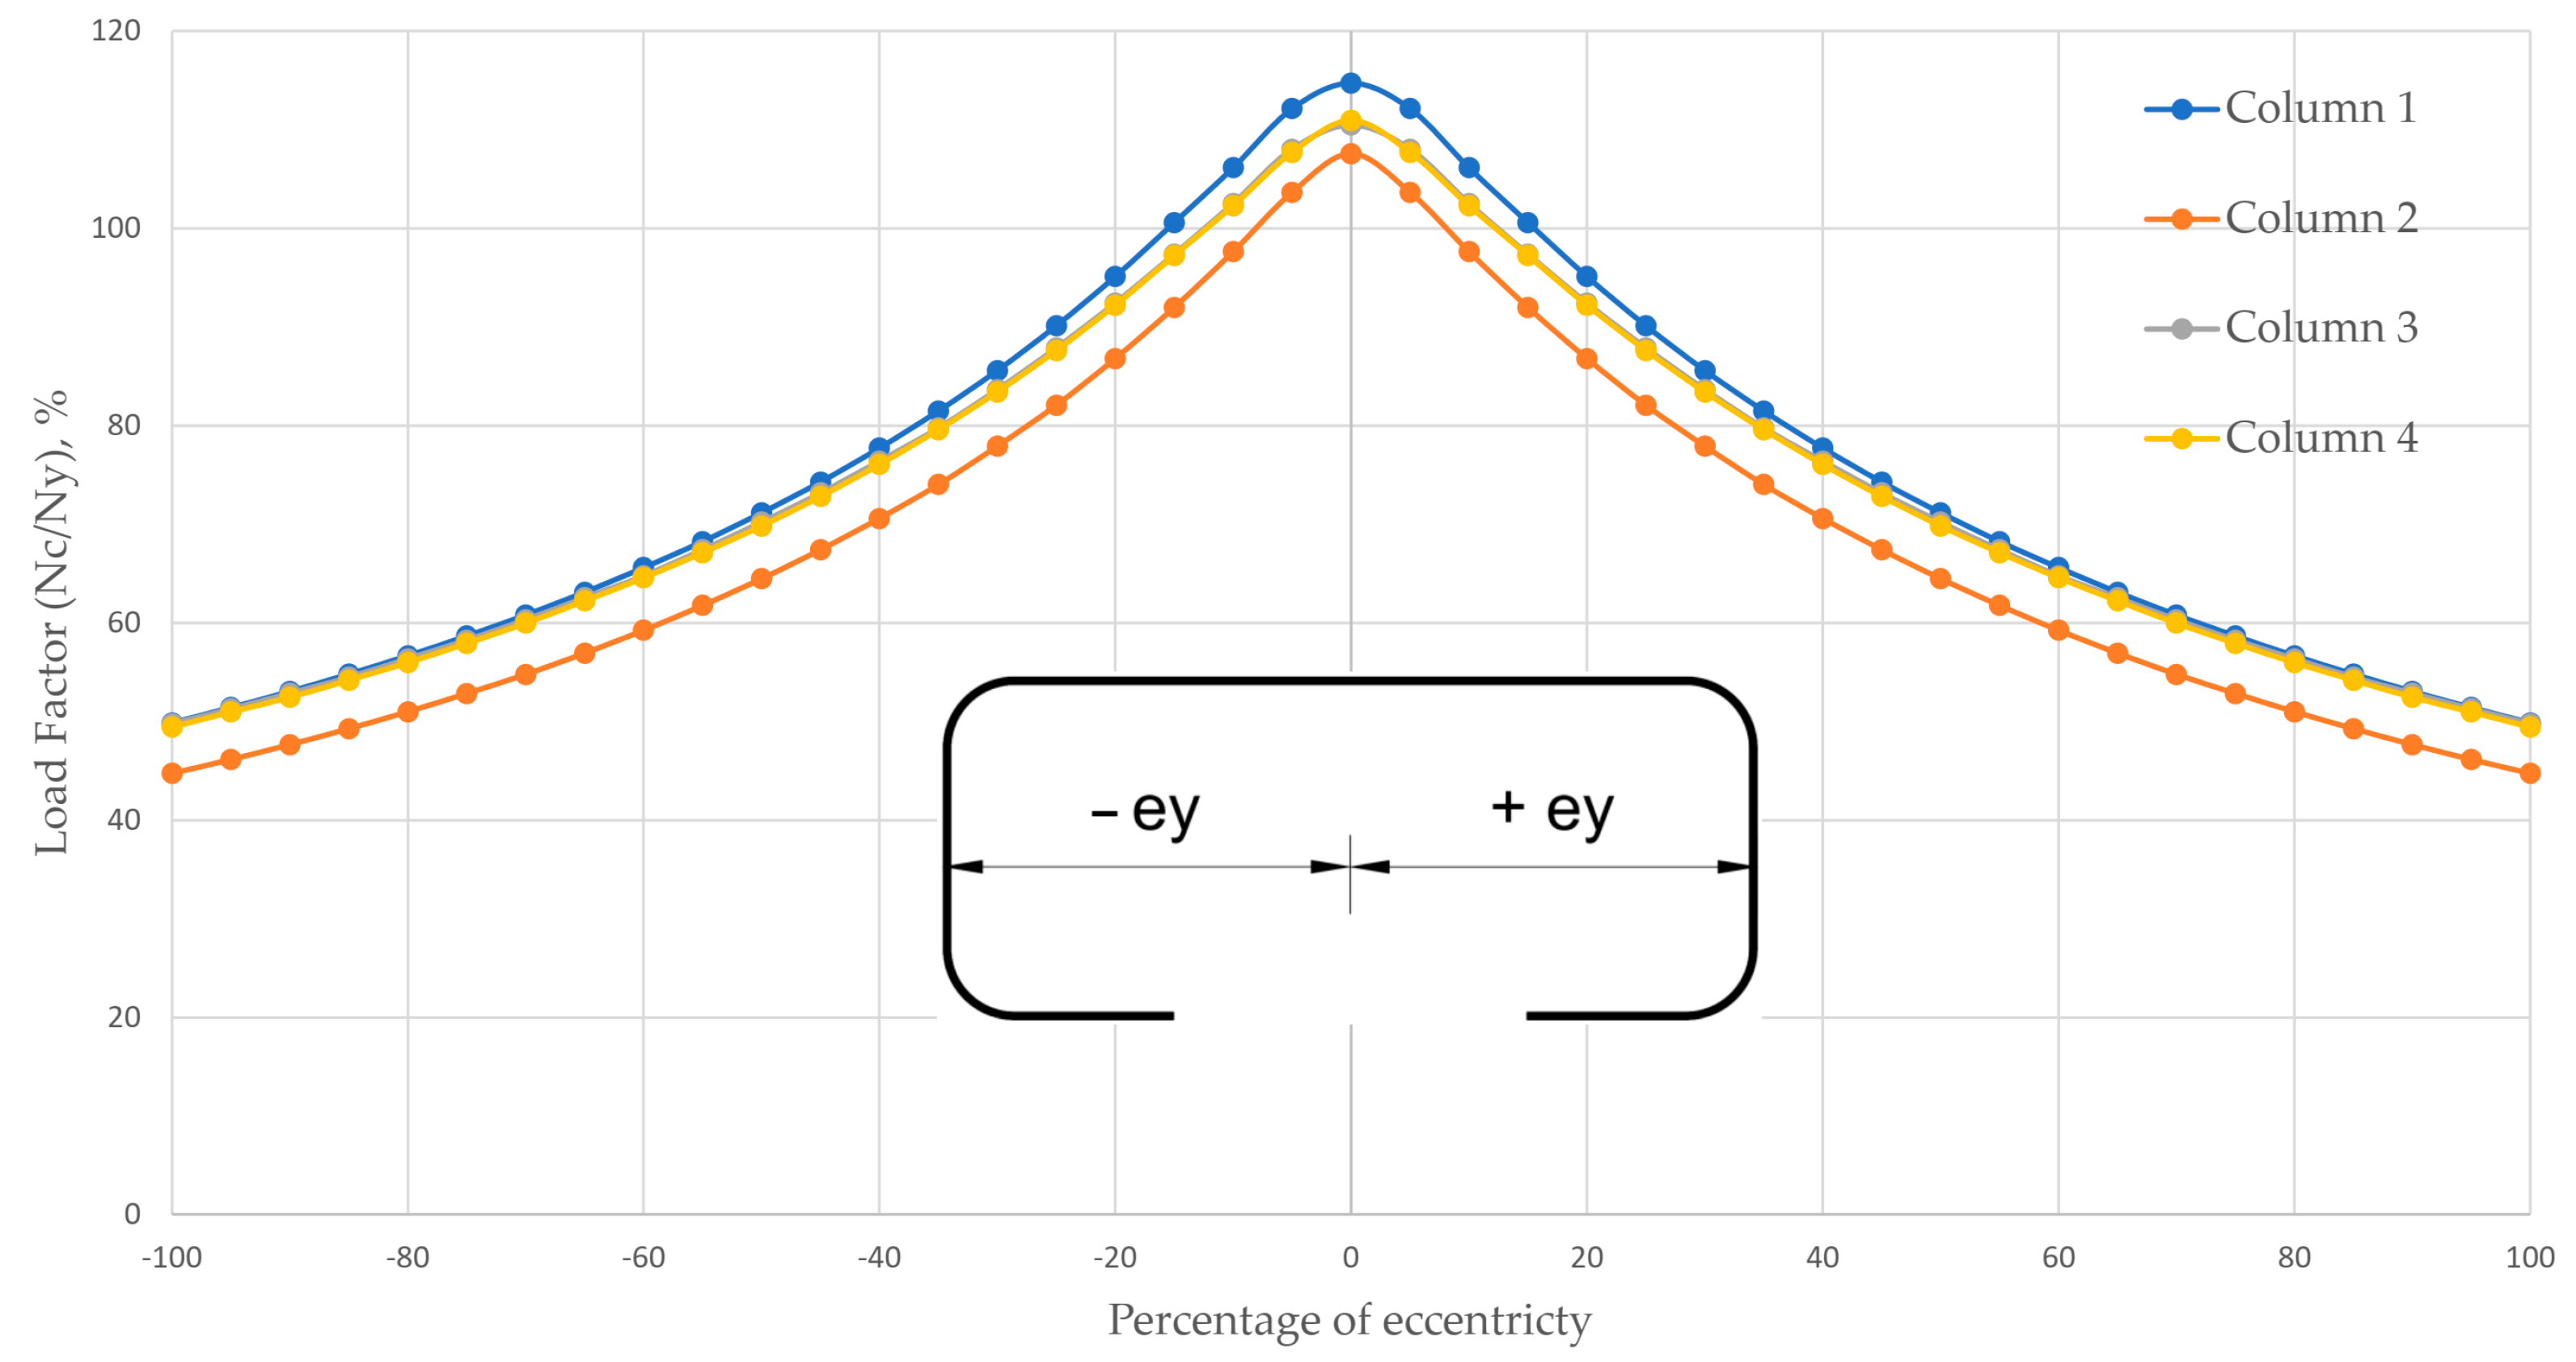
5.4. The Effect of Eccentricity from the Centroid

In prior studies and practical applications, boundary conditions, typically fixed or pinned supports, are conventionally applied at the centroid of member ends. This investigation specifically examines how the location of RP-1 and RP-2 relative to the centroid influences the axial load capacity of four validated columns. The findings uncover an intriguing “e-shaped” relationship, indicating that as RP-1 and RP-2 move away from the centroid, the axial load capacity of the columns demonstrates a significant variation. The performance of CFS beam-column elements is mainly affected by parameters such as the ratios of element and web slenderness, as well as the degree and direction of eccentricity [35]. When eccentricity is focused on the web or lipped side, the failure modes of the structural member are mainly determined by interactions between local–global or distortional–global buckling [36]. Specimens typically exhibit distortional or combined local–distortional buckling, contingent upon the eccentricity levels and cross-sectional thickness [35].
Analysis of the load-displacement curves reveals significant impacts based on the direction of eccentricities on beam-column member behavior. Members with low eccentricity values often experience a quick decrease in strength after reaching the maximum load, whereas higher eccentricity values lead to a more flexible behavior after buckling [37]. In summary, the interaction of element slenderness, eccentricity direction, and cross-sectional thickness play a critical role in determining the buckling behavior and post-buckling response of CFS beam-column elements.
The columns’ axial load capability is significantly influenced by the location of end reference points (RPs), as highlighted in Table 5 and Figure 8 and Figure 9. These figures vividly illustrate how relocating RPs (RP-1 and RP-2) from the centroidal position to various points such as the top flange, bottom flange, web, or lip of the cross-section results in contrasting effects. Notably, shifting both RPs from the centroid to the web of CFS sections leads to a 43% reduction in the average axial load capability. In contrast, a more substantial decrease of 67% in the average axial load capacity is observed when both RPs are moved towards the lip.
Conversely, when the reference points for axial load are shifted from the column’s centroid to either the top or bottom flange, there is a significant impact on their load-bearing capacity. Figure 9 illustrates this effect, showing a substantial decrease of 56% in the columns’ average axial load capability. This observation underscores the critical importance of carefully considering the placement of reference points when assessing a column’s ability to withstand axial loads.

6. Discussion

Eccentric loading in columns occurs when the load is not applied precisely along the centroidal axis of the cross-section, resulting in a significant reduction in the axial load-carrying capacity of the column. The effect of eccentricity on column strength is complex and difficult to quantify precisely. To investigate this, a series of 48 tests on long columns were conducted to assess the impact of loading eccentricity on the axial strength of cold-formed steel lipped channels. The findings reveal that even small eccentricities can markedly reduce axial strength. The AISI methodologies provide conservative estimates of strength, accounting for the effects of loading eccentricity. For instance, an eccentricity of 25 mm along the weak axis can reduce the failure loads by up to 30% compared to those expected under concentric loading [38].
The structural performance of beam-columns is influenced by several factors, including cross-sectional shape and size, the position of the eccentric load, column length, and the presence of bracing [17,23]. As eccentricity increases, the ultimate bearing capacity of the specimens consistently decreases. Notably, specimens under positive eccentric compression exhibit higher ultimate bearing capacities at lower eccentricities compared to those under negative eccentric compression. However, as eccentricity increases, this trend reverses, with positive eccentric compression resulting in lower bearing capacities than negative eccentric compression [16].
This research further shows that the mean value of geometrically and materially nonlinear FEM results is approximately 3% more conservative than experimental data. In contrast, the AISI and AS/NZS equations underestimate the actual concentric load capacities of CFSC section columns by an average of 11.5% relative to experimental data. The axial load-bearing capacity of CFSC section columns is significantly influenced by the location of reference points (RPs) for axial load application. Shifting RPs from the centroid to the web (negative eccentricity (−ex)) reduces axial load capacity by 43%, while moving them towards the lip (positive eccentricity (+ex)) results in a more substantial 67% reduction. Additionally, relocating RPs to the top or bottom flange (+/−ey) leads to an average decrease in load-bearing capacity of 56%. For slotted perforated specimens under eccentric compression, eccentricity significantly impacts ultimate bearing capacities. Specimens subjected to positive eccentric compression exhibit an approximate 22% reduction in ultimate bearing capacity compared to those under pure axial compression, while those under negative eccentric compression show an approximate 16% reduction. The Steel Stud Manufacturers Association (SSMA) has identified that the ultimate bearing capacities for perforated CFS channels under eccentric compression, as specified in the AISI S100–16, present significant computational challenges [16].

7. Conclusions

This study presents a comprehensive investigation into the influence of key geometrical parameters on the compressive response and axial load capacity of CFS columns. Utilizing validated nonlinear elastic-plastic FEMs, a systematic parametric analysis was conducted encompassing 208 different configurations. The analysis specifically focused on the effects of section thickness, column length, and eccentricity from the centroid. The following conclusions can be drawn:
1. Validation of FE Models: The mean value of the geometrically and materially nonlinear FEM results divided by test results is approximately 96.8%. This value being less than 100% indicates that the FEM results are on the safe side. The mean value being close to 100% demonstrates the accuracy of the FEM, making it a reliable tool for testing thin-walled steel short columns. Additionally, the sample standard deviation (S) of the FEM/TEST results is 0.0187, further proving the FEM’s accuracy in determining the axial load capacity of short columns.
2. Evaluation of AISI & AS/NZS Design Methodologies: The mean value of the elastic linear results obtained by AISI & AS/NZS divided by test results is around 88.5%, with a sample standard deviation (S) of 0.0401. Although these results are on the safe side, the mean value being significantly less than 100% indicates that the AISI & AS/NZS methodologies are too conservative and not economical for determining the axial load capacity of thin-walled steel short columns.
3. Impact of Section Thickness on Axial Load Capacity: A direct linear relationship exists between the thickness of CFS sections and the axial load capacity of columns. A reduction in section thickness translates to a proportional decrease in their capacity to resist axial loads. Specifically, when the average thickness is reduced to one-half, one-third, one-quarter, one-fifth, and one-sixth of its original value, the corresponding reductions in average axial load capacity are approximately 56%, 77%, 86%, 91%, and 93%, respectively.
4. Effect of Column Length on Axial Load Capacity:
Short Columns: Reductions in length have a negligible impact on the axial capacity of short CFS columns. On average, a modest increase in axial load capacity, ranging from 2% to 4%, is observed when the column length is reduced by factors of one-half, one-third, one-fourth, one-fifth, and one-sixth.
Longer Members: For longer members, a nonlinear inverse relationship between column length and axial capacity becomes evident. Increasing the column length by factors of two, three, four, five, and six results in significant reductions in capacity, reaching approximately 6%, 14%, 29%, 47%, and 61%, respectively.
5. Influence of Eccentricity from Centroid on Axial Load Capacity:
Shifting Reference Points to Web or Lip: The axial load capacity of columns is significantly influenced by the location of end reference points (RPs). Shifting both RPs from the centroid to the web of CFS sections leads to a 43% reduction in average axial load capacity. A more substantial decrease of 67% is observed when both RPs are moved towards the lip.
Shifting Reference Points to Top or Bottom Flange: Shifting the reference points for axial load from the column’s centroid to either the top or bottom flange results in a substantial decrease of 56% in the average axial load capacity of the columns. It is recommended to place the reference points at the centroid of members to maximize load-carrying capacity.

Author Contributions

Conceptualization, A.B.H. and D.B.H.; methodology, A.B.H.; software, A.B.H.; validation, A.B.H. and D.B.H.; formal analysis, A.B.H.; investigation, D.B.H.; resources, A.B.H.; data curation, D.B.H.; writing—original draft preparation, A.B.H.; writing—review and editing, A.B.H.; visualization, D.B.H.; supervision, A.B.H.; project administration, A.B.H.; funding acquisition, A.B.H. All authors have read and agreed to the published version of the manuscript.

Funding

This research was funded by [Széchenyi István University]. The APC was funded by [Széchenyi István University].

Data Availability Statement

The data presented in this study are available from the corresponding author upon request. The data are not publicly available due to privacy.

Conflicts of Interest

The authors declare no conflict of interest.

Nomenclature

SymbolsMeaning
AS/NZSAustralian/New Zealand Standard
AISIAmerican Iron and Steel Institute
DSMDirect Strength Method
EWMEffective Width Method
FEMFinite Element Model
CFSCold-Formed Steel
CFSCCold-Formed Steel Channel
GMNIAGeometric and Material Nonlinear (Second-order) Inelastic Analysis with Imperfections
RPReference Point
SSample standard deviation
LBLocal Buckling
DBDistortional Buckling
GBGlobal Buckling
FFlexural
TTortional
FTFlexural-Tortional
LDLocal-Distortional
λc; λl; λdnon-dimensional slenderness
NceThe nominal member capacity of a member in compression for flexural, torsional or flexural-torsional buckling
NocLeast of the elastic compression member buckling load in flexural, torsional and flexural-torsional buckling
NyNominal yield capacity of the member in compression
NclThe nominal member capacity of a member in compression for local buckling
NolElastic local buckling load
NcdThe nominal member capacity of a member in compression for distortional buckling
NodElastic distortional compression member buckling load
fyCompressive yield stress
AgGross area of the cross-section

References

  1. Sang, L.; Zhou, T.; Zhang, L.; Zhang, T.; Wang, S. Local buckling in cold-formed steel built-up I-section columns: Experiments, numerical validations and design considerations. Structures 2023, 47, 134–152. [Google Scholar] [CrossRef]
  2. Zhao, J.; Lai, B.L.; Fan, S.; Liu, M.; Li, C. Numerical simulation of local-distortional buckling behavior of lipped C-section stainless steel columns. J. Constr. Steel Res. 2023, 211, 108148. [Google Scholar] [CrossRef]
  3. Rasmussen, K.J.R. Bifurcation of locally buckled members. Thin-Walled Struct. 1997, 28, 117–154. [Google Scholar] [CrossRef]
  4. Dai, Y.; Roy, K.; Fang, Z.; Raftery, G.M.; Ghosh, K.; Lim, J.B.P. A critical review of cold-formed built-up members: Developments, challenges, future directions. J. Build. Eng. 2023, 76, 107255. [Google Scholar] [CrossRef]
  5. Khezri, M.; Rasmussen, K.J.R. Buckling Mode Decomposition of Built-up Members by the Modal Finite Strip Method (mFSM). In Proceedings of the Annual Stability Conference Structural Stability Research Council, Charlotte, NC, USA, 11–14 April 2023; Available online: https://cloud.aisc.org/SSRC/2023/Khezri_et_al_SSRC_2023.pdf (accessed on 18 August 2024).
  6. Qadir, S.J.; Nguyen, V.B.; Hajirasouliha, I. Design optimisation for cold rolled steel beam sections with web and flange stiffeners. J. Constr. Steel Res. 2024, 213, 108375. [Google Scholar] [CrossRef]
  7. Selvam, J.; Vajravelu, A.; Nagapan, S.; Arumugham, B.K. Analyzing the Flexural Performance of Cold-Formed Steel Sigma Section Using ABAQUS Software. Sustainability 2023, 15, 4085. [Google Scholar] [CrossRef]
  8. Zhao, J.; Fan, S.; Li, C.; Peng, J.; Li, J. Research on the local-distortional interaction buckling capacity of stainless steel lipped C-section columns. Structures 2023, 48, 2003–2023. [Google Scholar] [CrossRef]
  9. Martins, A.D.; Peres, N.; Jacinto, P. Gonçalves An Assessment of the Eurocode 3 Simplified Formulas for Distortional Buckling of Cold-Formed Steel Lipped Channels. Appl. Sci. 2024, 14, 4924. [Google Scholar] [CrossRef]
  10. Li, S.; Liang, Y.; Zhao, O. Cross-section behaviour and design of press-braked ferritic stainless steel channel sections under combined compression and major-axis bending moment. Thin-Walled Struct. 2023, 188, 110775. [Google Scholar] [CrossRef]
  11. Zhang, L.; Liang, Y.; Zhao, O. Cross-sectional behaviour of press-braked S690 high strength steel slender channel section stub columns under minor-axis combined loading. J. Constr. Steel Res. 2023, 210, 108050. [Google Scholar] [CrossRef]
  12. Ma, J.L.; Pandey, M.; Chan, T.M.; Young, B. Design of cold-formed high strength steel square and rectangular hollow section beam–columns. Thin-Walled Struct. 2023, 185, 110483. [Google Scholar] [CrossRef]
  13. Li, Q.Y.; Young, B. Design of cold-formed steel built-up open section members under combined compression and bending. Thin-Walled Struct. 2022, 172, 108890. [Google Scholar] [CrossRef]
  14. He, Z.; Peng, S.; Zhou, X.; Li, Z.; Yang, G. Zhang Design recommendation of cold-formed steel built-up sections under concentric and eccentric compression. J. Constr. Steel Res. 2024, 212, 108255. [Google Scholar] [CrossRef]
  15. He, Z.; Peng, S.; Zhou, X.; Yang, G.; Schafer, B.W. Failure characteristics of cold-formed steel built-up sections with web stiffeners under axial and eccentric compression. Thin-Walled Struct. 2023, 182, 110269. [Google Scholar] [CrossRef]
  16. Zhao, J.; He, J.; Chen, B.; Zhang, W.; Yu, S. Test and direct strength method on slotted perforated cold-formed steel channels subjected to eccentric compression. Eng. Struct. 2023, 285, 116082. [Google Scholar] [CrossRef]
  17. AISI S100-16 (R2020) w/S3-22; North American Specification for the Design of Cold-Formed Steel Structural Members 2016 Edition (Reaffirmed 2020) with Supplement 3, 2020 Edition. AISI: Washington, DC, USA, 2016. Available online: https://www.buildusingsteel.org/wp-content/uploads/2023/06/AISI-S100-16-2020-wS3-22.pdf (accessed on 22 August 2024).
  18. AISI S100-16 (2020) w/S2-20; North American Specification for the Design of Cold-Formed Steel Structural Members 2016 Edition (Reaffirmed 2020) with Supplement 2, 2020 Edition. AISI: Washington, DC, USA, 2016. Available online: https://www.buildusingsteel.org/wp-content/uploads/2023/06/AISI-S100-16-2020-wS2-20.pdf (accessed on 22 August 2024).
  19. AS/NZS 4600: 2018; Cold-Formed Steel Structures. AS: Sydney, Australia; NZS: Wellington, New Zealand, 2018. Available online: https://www.standards.govt.nz/shop/asnzs-46002018 (accessed on 22 August 2024).
  20. Bilheiro, E.; Filho, F.; Landesmann, A.; Camotim, D. DSM design of CFS lipped channel columns undergoing distortional-global interaction at elevated temperatures. In Proceedings of the Annual Stability Conference Structural Stability Research Council, Charlotte, NC, USA, 11–14 April 2023; Available online: https://www.researchgate.net/publication/370400597_DSM_Design_of_CFS_Lipped_Channel_Columns_undergoing_Distortional-Global_Interaction_at_Elevated_Temperatures (accessed on 22 August 2024).
  21. He, Z.; Jian, Y.; Zhou, X.; Jin, S. Local-distortional interactive behavior and design of cold-formed steel C-sections with & without slotted holes. J. Build. Eng. 2023, 79, 107812. [Google Scholar] [CrossRef]
  22. AISI D100-08; Cold-Formed Steel Design. American Iron and Steel Institute: Washington, DC, USA, 2008. Available online: https://scholarsmine.mst.edu/ccfss-aisi-spec/159/ (accessed on 22 August 2024).
  23. Yu, W.-W.; LaBoube, R.A.; Chen, H. Cold-Formed Steel Design, 5th ed.; John Wiley & Sons: Hoboken, NJ, USA, 2020; Available online: https://www.wiley.com/en-us/Cold-Formed+Steel+Design%2C+5th+Edition-p-9781119487395 (accessed on 22 August 2024).
  24. Dubina, D.; Ungureanu, V.; Landolfo, R. Eurocode 3: Part 1–3, 1st ed.; ECCS—European Convention for Constructional Steelwork: Brussels, Belgium, 2012. [Google Scholar]
  25. Georgantzia, E.; Gkantou, M.; Kamaris, G.S. Aluminium alloy channel columns: Testing, numerical modelling and design. Thin-Walled Struct. 2023, 182, 110242. [Google Scholar] [CrossRef]
  26. Ananthi, G.B.G.; Roy, K.; Ghosh, K.; Poologanathan, K.; Lim, J.B.P. An investigation on stiffened cold-formed steel unequal angle box section columns. J. Build. Eng. 2023, 76, 106989. [Google Scholar] [CrossRef]
  27. Mei, Y.; Cui, Y.; Ma, C.; Sun, Y.; Su, A. Tests, numerical simulations and design of G550 high strength cold-formed steel lipped channel section columns failing by interactive buckling. Thin-Walled Struct. 2023, 192, 111172. [Google Scholar] [CrossRef]
  28. Zhang, P.; Alam, M.S. Assessment of buckling strength curves in Direct Strength Method for estimating axial strengths of Cold-formed Steel members considering average yield stresses of cross-sections Thin-Walled Struct. 2023, 188, 110823. Thin-Walled Struct. 2023, 188, 110823. [Google Scholar] [CrossRef]
  29. Chen, B.; Wang, Y.; Lim, J.B.P. Behaviour And Design of Cold-Formed Steel Channel Sections with Strengthened Web Holes Under Different Loadings: A Review. In Proceedings of the Ninth International Conference on Thin-Walled Structures—ICTWS2023, Sydney, Australia, 29 November–1 December 2023; Available online: https://www.ictws2023.org.au/wp-content/uploads/2023/11/48308-Chen.pdf (accessed on 18 August 2024).
  30. Dassault Systèmes. ABAQUS. 2024. Available online: https://www.3ds.com/products/simulia/abaqus (accessed on 18 August 2024).
  31. Kechidi, S.; Fratamico, D.C.; Schafer, B.W.; Castro, J.M.; Bourahla, N. Simulation of screw connected built-up cold-formed steel back-to-back lipped channels under axial compression. Eng. Struct. 2020, 206, 110109. [Google Scholar] [CrossRef]
  32. Li, Q.Y.; Young, B. Numerical investigation and design of cold-formed steel built-up section beam-column members under moment gradients. Eng. Struct. 2023, 283, 115746. [Google Scholar] [CrossRef]
  33. Vy, S.T.; Mahendran, M.; Sivaprakasam, T. Built-up back-to-back cold-formed steel compression members failing by local and distortional buckling. Thin-Walled Struct. 2021, 159, 107224. [Google Scholar] [CrossRef]
  34. Fu, X.; Xu, W.; Yu, S.; Mei, X. Experimental Research on the Cold-Forming Effect of Cold-Formed Thick-Walled Steel. Buildings 2023, 13, 1201. [Google Scholar] [CrossRef]
  35. Hasanali, M.; Mojtabaei, S.M.; Hajirasouliha, I.; Clifton, G.C.; Lim, J.B.P. More accurate design equations for cold-formed steel members subjected to combined axial compressive load and bending. Thin-Walled Struct. 2023, 185, 110588. [Google Scholar] [CrossRef]
  36. He, Y.; Dai, L.; Ren, C. Buckling analyses of cold-formed steel lipped channel members under minor-axis eccentric load. J. Constr. Steel Res. 2023, 211, 108181. [Google Scholar] [CrossRef]
  37. Yılmaz, Y.; Öztürk, F.; Demir, S. Buckling behavior of cold-formed steel sigma and lipped channel section beam-columns: Experimental and numerical investigation. J. Constr. Steel Res. 2024, 214, 108456. [Google Scholar] [CrossRef]
  38. Miller, B.H.T.; Member, A.; Pekoz, T. Load-Eccentricity Effects on Cold-Formed Steel Lipped-Channel Columns. J. Struct. Eng. 1994, 120, 805–823. [Google Scholar] [CrossRef]
Figure 1. Types of Buckling in Thin-Walled Steel Columns.
Infrastructures 09 00142 g001
Figure 2. Finite element model parameters, boundary conditions, and cross-section geometry.
Infrastructures 09 00142 g002
Figure 3. Engineering and True Stress–Strain Curves.
Infrastructures 09 00142 g003
Figure 4. Comparison of load-displacement curves for fixed-ended columns between experimental tests [34] and FEM.
Infrastructures 09 00142 g004
Figure 5. Comparison of column buckling shapes: experimental testing [34] vs. finite element analysis.
Infrastructures 09 00142 g005
Figure 6. Correlation of axial load capacity with column thickness.
Infrastructures 09 00142 g006
Figure 7. The correlation between column length and axial load capacity.
Infrastructures 09 00142 g007
Figure 8. Effect of strong-axis eccentricity on column axial load capacity.
Infrastructures 09 00142 g008
Figure 9. Effect of weak-axis eccentricity on column axial load capacity.
Infrastructures 09 00142 g009
Table 1. Column specimen dimensions and material properties.
ColumnsDBdtRoLXYAFyENy
mmmm2MPaGPakN
Column 1253.580.550.17.4314.974828.2126.83461297.92021031
Column 2255.280.750.37.8115.174928.3127.63645381.62051391
Column 3361.1141.583.911.3322.4105353.7180.68360295.72102472
Column 4343.5144.897.115.5130.1105259.1171.811274316.32083566
Table 2. Comparison of Test Results [34] with the Finite Element Method, and AISI & AS/NZS Standards.
ColumnsNc[AISI & AS/NZS]Nc[TEST]Nc[FEM]Nc[FEM]/Nc[TEST]Nc[AISI & AS/NZS]/Nc[TEST]
kNkNkN%%
Column 1944114210739483
Column 21252148814559892
Column 32338260925369790
Column 43394378737139890
Average 96.888.5
S 0.01870.0401
Table 3. Impact of thickness variation on the axial load capability of columns.
Columnsn = 1:6tn = t1/nXNcnNcn/Nc1
mmmmkN%
Column 117.4328.231073100
23.7227.9246944
32.4827.8321220
41.8627.7813513
51.4927.75777
61.2427.73646
Column 217.8128.281455100
23.9127.9656139
32.6027.8527619
41.9527.8018813
51.5627.771299
61.3027.75896
Column 3111.3353.702536100
25.6753.38105241
33.7853.2754121
42.8353.2234414
52.2753.192128
61.8953.171636
Column 4115.5159.123713100
27.7658.78186750
35.1758.67113831
43.8858.6262717
53.1058.5943812
62.5958.573289
Average1 100%
244%
323%
414%
59%
67%
Table 4. The effect of column length variation on axial load capacity.
Short ColumnsLong Columns
Columnsn = 1:6Ln = L1/nNcnNcn/Nc1Ln = L1 × nNcnNcn/Nc1
mmN%mmN%
Column 1174810731007481073100
23741106103149697391
32491100102224488082
41871108103299265361
51501125105374045542
6125105899448832030
Column 2174914551007491455100
237514731011498138095
325014671012247116480
41871478102299674451
51501500103374548733
61251513104449434123
Column 311053253610010532536100
252725991022106239294
335126041033159230891
426326161034212226289
521126501045265177470
617626501046318132252
Column 411052371310010523713100
252637751022104354896
335137931023156333590
426338401034208308083
521038231035260241765
617538441046312184150
Average1 100% 100%
2102%94%
3102%86%
4103%71%
5104%53%
6103%39%
Table 5. The influence of eccentricity on the axial load capacity of columns with respect to their strong and weak axes.
Direction from Centroid to WebDirection from Centroid to LipDirection from Centroid to Top Flange
ColumnsN = 0:100%XNcnNcn/Nc0XNcnNcn/Nc0YNcnNcn/Nc0
mmkN%mmkN%mmkN%
Column 1028107310028107310001073100
102510069433877821399393
20239458839742692589083
30208918344642603880175
40178427949567535172768
50147997454507476366662
60117607160458437661457
7087246865418398956953
80669264703843610153049
90366262753563311449646
100063559813313112746643
Column 2028145510028145510001455100
10251357933411898213132191
2023126887399926826117581
3020118982448525938105472
401711207749746515195566
501410587354664466487260
601110026960597417780255
7089516565544378974151
80690962704983410269047
90386960754603211564544
100082757814272912860642
Column 3054253610054253610002536100
10482371936221438518235493
20432225887118547336212284
30382091828016316454192076
40321974788914585772175469
50271868749813165290161264
6021177270106120147108148759
7016168767115110243126138555
8011160863124101940144129451
90515386113394837162121448
100014725814288635181114345
Column 4059371310059371310003713100
10533427926831908617342492
20473176867627817534308783
30412956808524616652279275
40352766749322025969254669
503026027010220005486233763
6024245366111182949103216258
7018232463119168545120200754
8012220659128156342137187450
906210157136145739155175647
1000200454145136337172165545
Average0% 100% 100% 100%
10%93%83%92%
20%87%71%83%
30%82%62%74%
40%77%55%68%
50%73%50%62%
60%69%45%57%
70%65%41%53%
80%62%38%50%
90%60%35%46%
100%57%33%44%
Disclaimer/Publisher’s Note: The statements, opinions and data contained in all publications are solely those of the individual author(s) and contributor(s) and not of MDPI and/or the editor(s). MDPI and/or the editor(s) disclaim responsibility for any injury to people or property resulting from any ideas, methods, instructions or products referred to in the content.

