Abstract
Significant inelastic deformations induced in structural systems lead to structures possibly possessing some degree of permanent lateral deformation following major seismic events. These permanent deformations have led to considerable research being conducted over the past 20 years into developing structural systems that exhibit self-centring behaviour. For a structural system such as the concentrically braced frame (CBF), for which the dissipating mechanism is the tensile yielding and compressive buckling of the diagonal steel tubular members, these residual deformations present a problem when considering the structure’s overall resilience to the seismic loading both during and after an event. This paper describes the numerical modelling of a novel self-centring, concentrically braced frame (SC-CBF) system that combines a conventional CBF with a self-centring arrangement to produce a structure that possesses the desirable lateral load-resisting capacity of the CBF but which also re-centres when subjected to many cycles of large inelastic brace deformation. First, an experimental test programme for the SC-CBF is briefly described, followed by a numerical model to capture the SC-CBF’s characteristics during cyclic loading. This numerical model is validated using the experimental test data, showing that the experimental and numerical simulation data match rather well. This development presents a platform upon which further research through experimental testing and numerical simulation can be conducted. The proposed SC-CBF system can then be developed into a viable lateral load-resisting system that will provide a more resilient system than the current conventional CBF.
1. Introduction
Following a major seismic event, there is a significant possibility of residual deformations in a structure due to the many cycles of inelastic deformation induced in the structure’s dissipative mechanism. Typically, design codes such as Eurocode 8 (EC8) [1] aim to limit the amount of storey drift experienced by a structure during a seismic event and do not directly consider the post-earthquake state of the building. This means that a structure may have performed exactly as intended during an earthquake but still possess large permanent deformations afterwards. These can be extremely problematic given the difficulties of straightening a structure following a seismic event. McCormick et al. [2] reported that the residual drifts present in a 17-storey moment frame building after the 1995 Northridge earthquake in the US went unnoticed during the building assessment and were only discovered when the elevators failed to operate because of out-of-plumbness during the re-occupancy. In addition to this, McCormick et al. [2] reported that at a hearing of 100 residents after the 1995 Hyogoken–Nanbu earthquake, residents reported being conscious of inclinations between 0.005 and 0.006 radians, with inclinations of 0.008 radians causing serious consciousness of the inclination along with dizziness and headaches. Clearly, the occurrence of these residual deformations warrants serious consideration when examining the design and assessment of structures for seismic loading.
During the early 1990s, research institutes in the US and Japan undertook a multi-million dollar programme known as PRESSS (PREcast Seismic Structural Systems) to develop a low-cost precast concrete building technology that would comply with building codes and be able to withstand the forces of a major earthquake with minimum resulting damage [3]. The result was the development of a hybrid system capable of resisting seismic loading but also re-centring itself after loading using a post-tensioning system within the frame. This self-centring system was initially developed for concrete systems but has become the benchmark for many new innovative technologies for the seismic design of structures. This is evident in how this self-centring technology has gradually been applied to steel systems, such as braced frames [4,5,6], steel plate shear walls [7] and also moment-resisting frames [8,9,10]. The availability of experimentally validated numerical models is essential for further developing these self-centring systems. They serve as a benchmark by which the response can be evaluated and verified when subjected to seismic loading. This ranges from typical code prescriptions, where drift limits and member verifications are followed (e.g., EC8), in addition to more recent research [11,12,13] where limiting floor accelerations, monetary losses, and collapse risk are key parameters to consider as part of the next generation of performance-based earthquake engineering approaches [14].
This paper describes the development and validation of a numerical model for a self-centring, concentrically braced frame (SC-CBF) system previously proposed by the authors [15]. The modelling parameters used for concentrically braced frames and self-centring systems are employed and developed into a numerical model for the SC-CBF, with explicit consideration of the salient features of the structural system’s mechanical behaviour. This modelling approach is validated against several experimental test specimens to demonstrate its applicability to future analysis of the SC-CBF system.
2. Self-Centring Concentrically Braced Frame (SC-CBF)
Developing self-centring systems that function as seismic lateral load-resisting systems has been the focus of extensive research [5,6,7,8,9,10] over the past few years. The main aim is to develop a system that can sustain the lateral forces and deformations imposed on it during an earthquake and eliminate the residual lateral deformations remaining afterwards due to the inelastic structural behaviour. These self-centring systems typically comprise two components: a post-tensioning (PT) arrangement, or method of re-centring, and a method of energy dissipation. This energy dissipation typically consists of a method of construction fashioned to make it more easily replaceable once damaged, such as the seated angles discussed in Ricles et al. [8], or the coupling bars attached at the beam flanges in Christopoulos et al. [16], or the steel plate shear walls in Clayton et al. [7], among others.
O’Reilly and Goggins [15] proposed a self-centring, concentrically braced frame (SC-CBF) system, in which the PT arrangement consists of the gap opening, or rocking, connection between the beam and column interface employed by Christopoulos et al. [16] to provide the re-centring mechanism alongside diagonal tubular steel brace members placed as the replaceable energy dissipating mechanism. Figure 1 shows the basic configuration of the SC-CBF, where the lateral movement of the frame induces tensile and compressive forces in the two diagonal braces to induce tensile yielding and compressive buckling. The rocking connection behaviour depends on the beam–column connection opening and closing during lateral movement of the frame. The PT arrangement, as adopted in past studies examining self-centring behaviour, works by having a post-tensioned set of strands anchored at either end of the frame’s exterior. These are unbonded and are loaded with an initial tensioning force that reacts against the frame. When moving laterally, the rocking mechanism at the beam–column connection causes a gap to open and the PT strands to elongate, further increasing the tensile force. This tensile force promotes self-centring behaviour in the SC-CBF system. This is illustrated in Figure 1 via the green lines at each beam–column connection, which denote the locations where the gap opening, and therefore the self-centring mechanism, is expected to occur. Initially, the connection is held closed by the initial axial tensile force in the PT strand elements, meaning that the frame behaves essentially as a moment frame. This continues until a connection moment is generated through the lateral displacement of the frame, which causes the connection to open and is termed decompression. Then, the stiffness of the connection reduces due to the axial elongation of the PT strands caused by the beam–column connection gap opening.
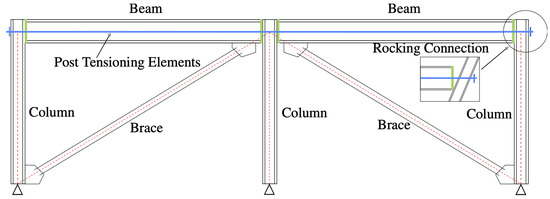
Figure 1.
Schematic of proposed self-centring concentrically braced frame (SC-CBF) (Adapted from O’Reilly and Goggins [15]).
For the system shown in Figure 2, where the gap opening of the rocking connection is assumed to occur during the pushover before the yielding of the tension brace, some equations that describe the fundamental behaviour of the system can be derived. The red path represents the response of the brace member operating in tension, whereas the green path represents the compressive response of the other brace. These initially have the same stiffness, but the compressive brace loses its force-carrying capacity due to lateral buckling. During a static push–pull cyclic pushover, the first event is the buckling of the compression brace at . Following this, the system is reduced to the combined stiffnesses of the PT connection, which essentially behaves as a rigid moment connection, and the axial stiffness of the tension brace. Following decompression of the rocking connection, which is when the beam–column connection begins to open at , the system’s stiffness is reduced to the post-decompression stiffness of the connection in addition to the axial stiffnesses of the tension brace. This stiffness is maintained up until when the brace yields in tension and begins to dissipate energy. The system then has a combined stiffness of the post-yield stiffness of the brace, denoted as a fraction, b, of the initial stiffness, , as well as the post-decompression stiffness of the connection, . This stiffness is maintained until , which is the maximum displacement experienced by the system. During unloading, the stiffness is the combined stiffness of the elastic tension brace’s stiffness and the post-decompression stiffness of the connection until , which is when the tension has been pushed into compression and buckles, allowing the frame to move in the opposite direction and begin the same cycle with the other brace in the opposite direction. The stiffness in the system after is attributed to the post-buckling compressive resistance of the compression member, which is a function of the normalised slenderness, , and ductility of the brace member. The post-buckling compressive strength degrades more quickly for more slender members, and the system’s stiffness is reduced compared to a stockier brace member. Following this sequence of events, the quantities to can be written as follows:
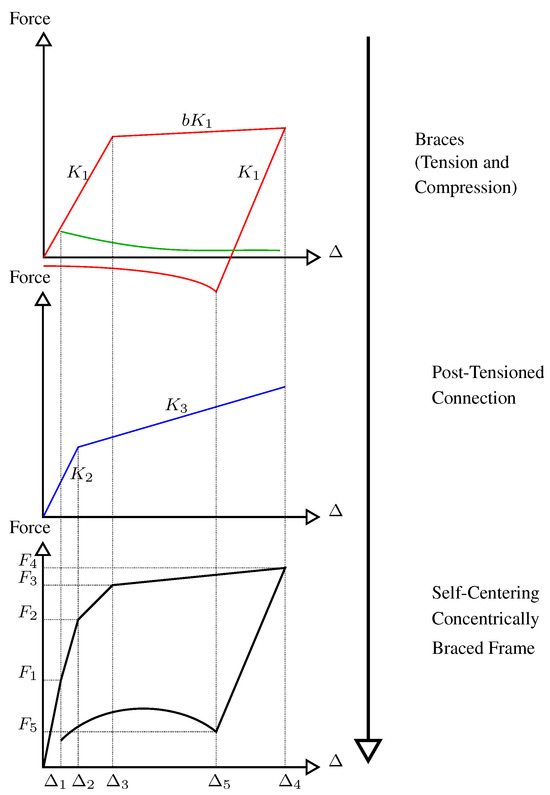
Figure 2.
Hysteresis of the proposed self-centring, concentrically braced frame (SC-CBF) (Adapted from O’Reilly and Goggins [15]).
Using these expressions to describe the behaviour of the SC-CBF, the self-centring of the system can now be defined. Similar to the mechanics of the self-centring PTED connection developed by Christopoulos et al. [16], the equations describing the behaviour can be substituted into each other in order to determine a condition which will present self-centring behaviour. For this system, this is such that the force at is greater than zero (i.e., ) in order to ensure that the brace is allowed to buckle at a positive global force and, hence, yield the desired flag-shaped behaviour. Substituting the above equations, the following is obtained:
where b is the strain hardening in the steel bracing members, and is the normalised compressive strength of the brace, which is used to eliminate the term from the expression. Now, the condition for self-centring is established to be the formation of the flag-shaped loop. The factors that determine whether this condition is met are the design parameters of the PT and bracing systems, and by choosing a suitable combination, a system that exhibits the intended behaviour of the SC-CBF can be achieved. Other bracing systems like buckling restrained braces may be used to provide more hysteretic energy dissipation during loading, but the level of post-tensioning that could be required in order to satisfy the conditions for self-centring would be so large that beam buckling would become an issue in design. Hence, this further supports the utilisation of more slender braces in braced frame systems and is an advantage of the SC-CBF system. Furthermore, given the interaction between and dependence on both the PT and bracing systems to ensure self-centring behaviour, other dissipative systems such as eccentrically braced frames would not be possible in this setup. This would require a complete revamp of the rocking connection and PT setup, which, in its current form, is relatively straightforward and practical to implement for construction workers.
3. Experimental Testing of an SC-CBF
3.1. Test Setup
O’Reilly and Goggins [15] performed several pseudo-static cyclic tests on an SC-CBF test setup with replaceable brace specimens. This was a single-storey, two-bay setup representing an arbitrary storey in a multi-storey SC-CBF (see Figure 3 and Figure 4). The base connection consisted of a pinned connection at the base of the centre column and roller connections at the two exterior columns. This accommodated the frame expansion caused by the beam–column gap opening—a feature of all rocking connection structures. It was therefore decided to test an arrangement that was more representative of an arbitrary storey as opposed to a base connection that would not allow for demonstration of the characteristics of the SC-CBF. As is typical with conventional concentrically braced frames, two diagonal brace members were employed to provide lateral resistance together with the PT arrangement within the frame.
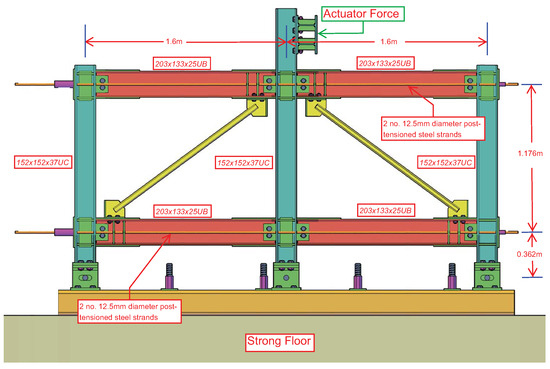
Figure 3.
Front elevation of the test frame (Adapted from O’Reilly and Goggins [15]).
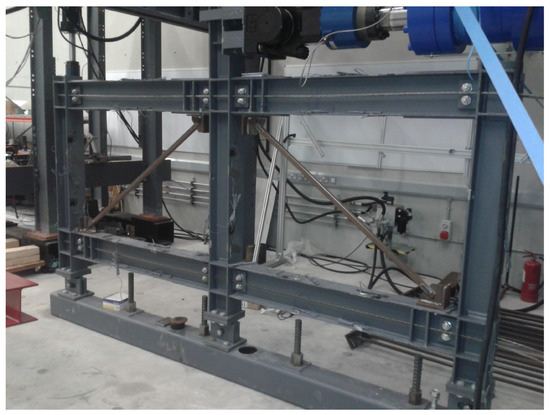
Figure 4.
Illustration of the SC-CBF frame prior to testing.
The final test setup is shown in Figure 3. The frame consisted of two 1.6 m bays and a 1.176 m storey height, which was determined by the geometric constraints of the testing facility. In addition to geometric constraints, there were also constraints of the testing equipment. The largest capacity actuator available at the structures testing laboratory at the University of Galway was a 750 kN, 250 mm stroke actuator. It was necessary to ensure that adequate displacement could be achieved during the experiment in order to examine the SC-CBF behaviour at large storey drift levels. With these two design issues in mind, a single storey SC-CBF substructure was the most logical option, and this was selected as the layout for testing. Figure 4 shows the final setup of the test frame before testing. Further details on the design and sizing of the test frame can be found in O’Reilly and Goggins [15] and O’Reilly [4].
3.2. Specimen Details
As previously mentioned, the energy-dissipating mechanism in the SC-CBF comprises two diagonal tubular steel brace members which serve as replaceable fuses. To perform multiple tests on brace sections with various normalised slenderness ratios, as specified in Eurocode 3 [17], these brace specimens were bolted into the test frame shown in Figure 4 as opposed to being welded. This meant that the brace specimens could be easily replaced after testing in order to provide multiple sets of data for different brace sizes to demonstrate the performance of the SC-CBF subject to lateral loading. Four grade S235 hot-rolled steel square hollow section (SHS) sizes manufactured in accordance with EN 10025:2004 [18] were selected for this experiment, with some details of each of these cross-section sizes being shown in Table 1, where A is the cross-sectional area of the brace, b is the section width, t is the wall thickness, L is the brace’s length, is the normalised slenderness as per Eurocode 3 [17], and and refer to the nominal capacity in tension and compressive buckling, respectively, of each brace member. The section class is per Section 5.5 of Eurocode 3 [17], and the Class 1 designation of each section indicates that the sections are compact. The of the test specimens ranges between 1.03 and 2.21, which covers the range permitted in EC8. The loading protocol used for testing is given in ECCS [19], which consists of gradually increasing symmetrical cyclic loading until failure of the test specimens has occurred. The amplitude of these cycles is determined from the yield displacement of the test specimens, , and each cycle is a multiple of this yield displacement determined from coupon testing on each of the brace specimens.

Table 1.
Nominal details of the brace specimens selected for testing in the SC-CBF.
4. Numerical Modelling
4.1. Brace Member Modelling
One of the main difficulties in modelling steel bracing elements is the ability to accurately capture the effect of brace buckling on the system. Uriz [20] proposed a modelling approach in OpenSees [21] capable of capturing this global buckling behaviour. In this approach, an initial camber was introduced to the diagonal brace elements to trigger a buckling mechanism when compressed. Salawdeh [22] then developed this model using numerous test results from the experiments conducted by Goggins [23] in order to verify this model’s accuracy, along with some further recommendations. The model uses the Steel02 steel material model in OpenSees. This material model accounts for kinematic and isotropic hardening within the steel and the Baushinger effect during repeated loading. The force-based beam–column element is used to model the bracing elements. This element considers the spread of plasticity along the element during loading as opposed to user-defined locations of plastic behaviour as in the lumped plasticity approach.
When using this beam–column element for the modelling of steel braces, the cross-section is modelled using a series of fibres along the width and thickness of the section. Two modelling parameters that significantly impact the brace model behaviour are the number of elements used and the initial imperfection, or camber, of the brace midpoint, as proposed by Uriz [20]. A minimum number of two elements are necessary to cause brace buckling because a single element will load to compressive yield repeatedly without buckling, which is not the case for conventional tubular braces. This is why the use of the initial imperfection of the brace was proposed by Uriz [20]: by specifying a small initial imperfection at the centre node of the brace elements, the brace will buckle during the analysis. A complete breakdown of the composition of the brace elements is shown in Figure 5.
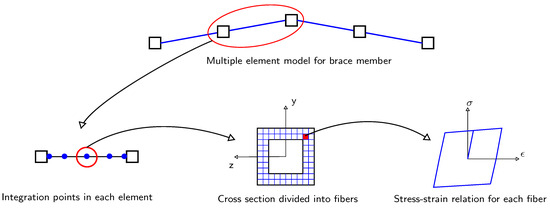
Figure 5.
Illustration of the composition of the brace member model. The entire brace shows the discretisation into numerous elements along with the initial imperfection at the brace midpoint.
Using the above numerical modelling methods, several parameters needed to be specified when modelling the braces, such as the number of elements to use and the number of integration points and cross-section fibres. Uriz et al. [24] noted that using a small number of fibres in the cross-section increases sensitivity in the bending moment and axial forces’ interaction in the element. The behaviour is more sensitive to the number of fibres around the perimeter of the cross-section; hence, a minimum of 10 to 15 fibres was recommended along the depth of the brace.
The initial deformation required to cause brace buckling is another critical parameter. Uriz et al. [24] recommended using an imperfection between 0.05 and 0.1% of the brace length. On the other hand, in a study by Nascimbene et al. [25], the recommended value was 0.5% of the brace length. Salawdeh and Goggins [26] noted how these values did not accurately represent the buckling load of some of the brace specimens used in that study. Using further test data from Goggins et al. [27] and Nip et al. [28], Salawdeh and Goggins [26] showed that an initial imperfection of between 0.1 and 1.0% provided the best comparison with the test data in terms of the initial buckling load of the member, with a lower magnitude of imperfection being used for members with lower slenderness, and a higher magnitude of imperfection being used for more slender braces. This would explain the lower value initially suggested by Uriz et al. [24], as the test specimens were stockier sections typically adopted in the US.
The number of integration points per element is also an important parameter, with Uriz et al. [24] reporting that the use of just two integration points results in a significant loss of compressive strength in the post-buckling range. This was reported to be due to an under-integration of the element; hence, a minimum of three integration points was recommended. Similarly, Salawdeh and Goggins [26] also suggested that a minimum of three integration points could be employed but noted that fewer elements could be used by using more integration points per element. As mentioned previously, a minimum of two elements is required to include the initial imperfection in the buckling brace. This is to be increased if asymmetric buckling of the brace is expected [24], as may be the case with X-braced CBFs. Salawdeh and Goggins [26] conducted a study on the effect of the number of brace elements on the element’s response by comparing 2, 4, 8, and 16 elements and performing a cyclic load on the brace. A similar study was conducted by Santagati et al. [29] in which the number of elements investigated was 2, 4, 6, 8 and 28. Both of these studies showed that increasing the number of elements did not significantly affect the braces’ response and that a minimum of two elements should be used when modelling brace members.
While the modelling parameters listed above have been shown to give relatively accurate predictions of the brace response, Uriz et al. [24] reported some limitations to using this fibre-based modelling. These limitations include the fact that one of the main assumptions for this element type is that plane sections remain plane and do not distort locally. This is known to be untrue for hollow steel brace members, as there can be significant local buckling and deformation in tubular members during buckling, especially in stocky bracing members. Uriz [20] compared the results of a numerical model to those of an actual test in which non-compact sections were used. The comparison showed that the results of the numerical prediction with OpenSees diverged quickly from those that were observed during the experiment. Uriz [20] concluded that the modelling parameters described above are not valid for sections that are prone to local buckling, although the effect they have on strength degradation and fracture life may be compensated for differently. Also, EC8 stipulates that only compact, or Class 1, sections may be used for tubular brace members, which somewhat reduces the significance of this limitation of the brace model.
4.2. Gusset Plate Modelling
Another parameter which has been a shortcoming of many numerical models for CBFs is the modelling of the connection of the braces to the beam and column via a gusset plate. Traditionally, this connection was modelled as a pinned connection due to the gusset plates permitting out-of-plane buckling of the braces quite easily and because numerical models were more focused on accurately capturing brace behaviour without giving significant consideration to the rotational stiffness of the connection. Nascimbene et al. [25] utilised a model consisting of rigid links meant to represent the beam, column and gusset plate rigid zone connection, followed by a non-linear element of length equal to two times the thickness of the gusset plate, which corresponds to the linear clearance method, to represent the yielding behaviour of the gusset plate, as shown in Figure 6.
A similar approach was proposed by Hsiao et al. [30], shown in Figure 8, in which the gusset plate was represented by a rotational spring stiffness that can be determined from the dimensions and properties of the gusset plate. This study by Hsiao et al. [30] compared the results of a pinned connection, rigid connection and the proposed connection with rotational stiffness to experimental test data. The results showed that the pinned connection underestimated the response, while the rigid connection overestimated it. The best match was obtained by inserting three rigid links to represent the rigid zone provided by the beam, column and gusset plate. The connection between the braces and this rigid zone was a zero-length element with a rotational stiffness determined from the properties of the gusset plate, such as the Whitmore width, , plate thickness, t, and Thornton buckling length, , shown in Figure 8.
Another feature worth describing is the connection of the braces via the gusset plates to the surrounding frame. Typically, gusset plates are connected via welds to both the column and beam members, as shown in Figure 6. However, since the beam–column connection needs to open and close via rocking in order to provide the self-centring mechanism, this traditional type of gusset plate connection will inhibit that. To resolve this, a previous proposal by Berman and Bruneau [31] was adopted in which a brace is bolted, as opposed to welded, to the beam only, and this is shown in Figure 7. In this connection type, the gap opening of the beam–column connection is not restrained by the gusset plate welded in place to the surrounding frame and allows for specimens to be easily inserted and replaced. The connection operates as a standard gusset plate connection with a relatively low out-of-plane flexibility, but it does not interfere with the ability of the beam–column connection to rock and provides self-centring capability. In order to ensure satisfactory behaviour and mitigate unwanted out-of-plane buckling of the gusset plates, a vertical stiffener was provided to replicate conventional gusset plates.
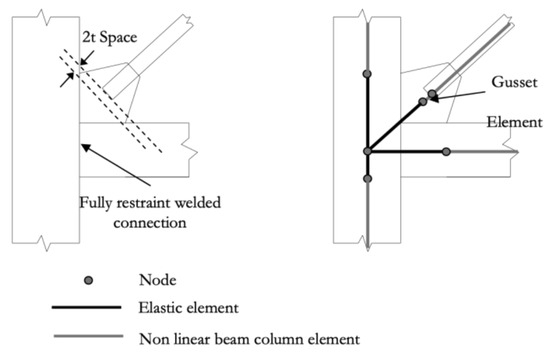
Figure 6.
Illustration of the modelling approach adopted by Nascimbene et al. [25] to account for the gusset plate flexibility in the out-of-plane direction.
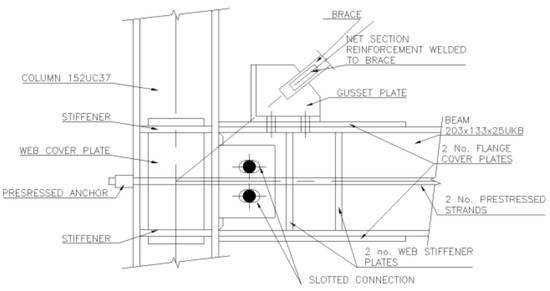
Figure 7.
Illustration of the gusset plate connection details in the SC-CBF test frame.
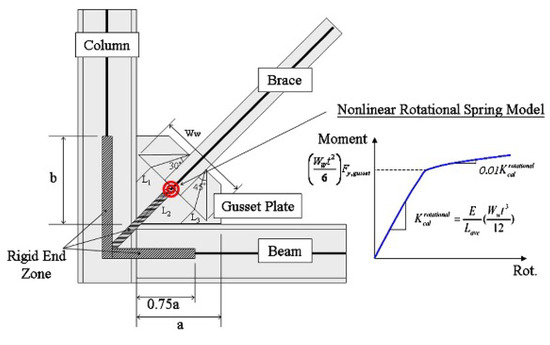
Figure 8.
Gusset plate connection model proposed by Hsiao et al. [30].
4.3. Rocking Connection Modelling
When modelling self-centring systems, one of the features that have to be modelled is the behaviour of the rocking beam–column connection in the frame. Since the development of precast rocking concrete systems throughout the 1990s, several models have been developed to capture the behaviour of the connection. For example, Freddi et al. [32] introduced a rocking steel column connection that differs since it places the connection at the column base rather than the beam–column connection utilised here. Further research on this structural concept [33,34,35,36] has seen extensive experimental testing, assessment and optimisation studies to consolidate this work, which is also encouraging for the SC-CBF system presented here. Christopoulos and Filiatrault [37] summarise the modelling of these post-tensioned connections and discuss three possible modelling techniques. The first technique involves idealising the bilinear elastic behaviour of the rocking connection with a rotational spring and doing similarly with the energy dissipating mechanism as with the self-centring moment-resisting frame developed in Christopoulos [10]. The second technique involves extending the rotational spring model to account for the gap opening restraint provided by the columns in the system. Christopoulos and Filiatrault [37] noted that while both of these models provide a good representation of the self-centring behaviour when compared to experimental test results, a simple model incorporating the beam’s depth to more realistically represent the forces induced in the surrounding frame was proposed. It uses a series of nodes at each connection to capture the behaviour via numerous rigid link offsets and contact springs. The contact springs are placed at the flanges of the beams and are modelled as compression-only springs in order to simulate the rocking of the beam flanges against the column face. The PT elements are modelled as truss elements with an initial strain and are connected to the exterior columns in order to clamp the beams and columns together, as in the physical assembly.
Clayton [38] developed a similar model to this for a steel plate, shear wall system and verified these numerical results with the experimental results observed by Kim and Christopoulos [39] and Garlock et al. [9]. Kim and Christopoulos [39] conducted a study into the accuracy of these methods of modelling PT connections in self-centring systems, citing that such models are necessary to enable accurate global response prediction for researchers using PT connections and practitioners. Kim and Christopoulos [39] concluded that these methods of connection modelling developed by Christopoulos [10] capture the behaviour of the PT connections reasonably well within the design drift range. Still, finite element models should be employed to investigate the behaviour beyond the design drift limits in order to investigate failure mechanisms that are not possible in simpler models. Recommendations were also made for the number and axial stiffnesses of springs that achieve satisfactory results without causing numerical difficulty for general systems that use the PT connection. The successful application of this rocking connection, which accounts for beam depth in numerous different systems, by different researchers demonstrates its applicability to rocking connections in self-centring frames.
Figure 9 shows a diagram of the connection model used here, which is based on the third model discussed by Christopoulos and Filiatrault [37]. In this model, rigid link offsets to each of the beam flanges are used along with the contact springs and post-tensioned elements. It is noted that in the numerical model, the values of stiffness assumed for the shear tab connection at the rocking connection was 1 × 10¹⁰ kN/m, and the rotational and other transnational stiffnesses not expected to offer any notable resistance were modelled as 1 × 10⁻⁵ kNm/rad and 1 × 10⁻⁵ kN/m, respectively. The response of a hypothetical two-bay frame with no braces was examined when subjected to a static cyclic load. The aim was to illustrate the behaviour of a frame with reasonable dimensions. The example frame had a bay width of 6 m and a storey height of 3.2 m. The beams were European Size IPE600, and the columns were HE320B. The PT arrangement consisted of two no. 30 mm-diameter cables. The beams and columns were modelled using the aforementioned force-based element, whereas the PT elements were modelled using the truss element with a 500 kN initial force applied. The frame was cycled through a single-storey drift cycle of 4%.
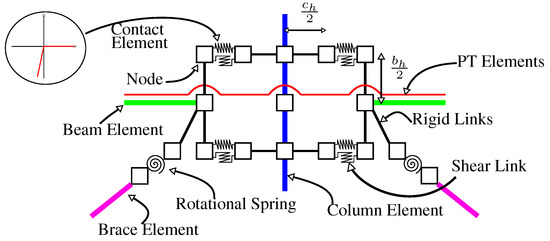
Figure 9.
Layout of the spring model connection outlined by Christopoulos and Filiatrault [37], where the connection geometry is directly accounted for through rigid offsets and links. Note: and denote the distances between the flange centrelines of the beam and column, respectively.
Figure 10 shows the base shear versus storey drift for the frame when modelled in OpenSees. This demonstrates the bilinear elastic behaviour of the PT frame without any bracing elements. Figure 10 also shows the comparison between the OpenSees analysis and the analytical prediction using the equations derived in O’Reilly and Goggins [15] for the SC-CBF system and is seen to predict the response very well. On the other hand, the developed analytical expression slightly unpredicted the initial stiffness of the PT frame. This is due to the assumption made in the derivation of this expression that all four rocking connections decompress simultaneously. In contrast, the OpenSees model demonstrates that while they are close together, they are not exactly at the same moment in time. This is not critical to the behaviour of the frame, as the final decompression point is accurately captured, and the post-decompression stiffness is excellently matched, which is a more critical aspect of the behaviour of the frame.
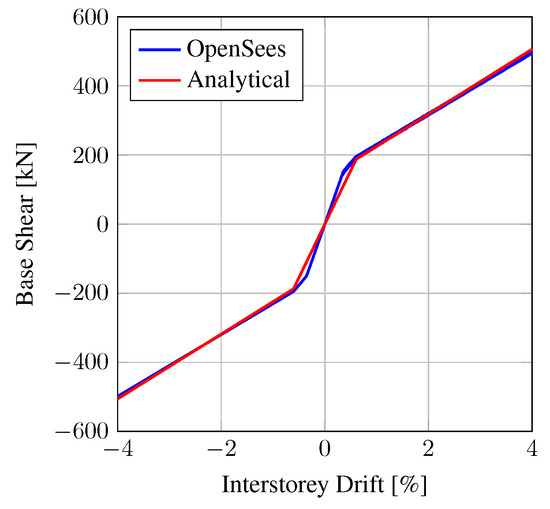
Figure 10.
Base shear versus storey drift for the SC-CBF with PT elements only.
4.4. Proposed SC-CBF Model
The modelling of both braced frames and PT connections using OpenSees has been discussed individually in the previous subsections. Since the proposed SC-CBF combines a CBF and PT frame, these modelling parameters are combined to yield a proposed numerical model for the SC-CBF.
Figure 11 shows a full schematic of the nodes and springs used to connect an interior column to the corresponding beams, columns and braces. For the brace members, four non-linear force-based elements with five integration points per element were used to model the braces, and these elements had a 0.5% initial camber in order to induce global lateral buckling of the braces. The corotational transformation was used to model the braces due to the large displacements experienced during buckling. The braces were modelled with a series of fibres across the cross-section, with 20 fibres along the width and depth of the brace and 5 fibres through the thickness of the brace section. Each of these fibres consists of the Steel02 material model in OpenSees.
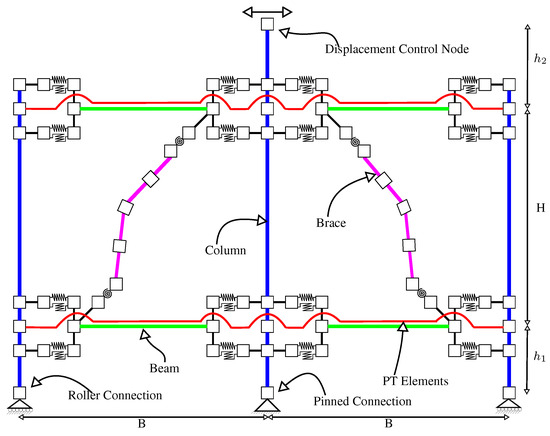
Figure 11.
Test frame model used for SC-CBF model validation.
The low-cycle fatigue model proposed by Uriz [20] was used to model the fatigue of the brace elements, and the fatigue parameters and m proposed by Santagati et al. [29] were employed. The parameters for the fatigue model proposed by Salawdeh and Goggins [26] were also considered valid for the modelling of the braces, but since four elements were used for these braces, and two elements were used by Salawdeh and Goggins [26], it was not possible to use these parameters. This is because the parameters developed by both Salawdeh and Goggins [26] and Santagati et al. [29] utilized for different numbers of elements (i.e., two versus four), meaning that different strains were being tracked in the elements. Since this strain in these elements is not the real strain because of the assumption that plane sections remain plane during buckling, this represents a pseudo-strain in the element. Thus, when using the low-cycle fatigue parameters proposed by the authors listed, it is vital that the same number of elements and fibres be used such that the same pseudo-strain is being tracked for the fatigue model.
The rotational stiffness provided by the gusset plate connection has often been idealised as a pinned connection due to its simplicity. Hsiao et al. [30] proposed a new arrangement for the modelling of the gusset plate connection which was shown to be more accurate when compared to experimental data. This connection modelling provides a more accurate representation of the compression brace’s capacity and contribution to loading and is therefore adopted here.
The beam and column members were also modelled using force-based beam–column members with one element per member and five integration points along each element. Five fibres were employed along the flange width and web depth, and two fibres were used along flange and web thicknesses. The material model used was the Steel02 material model, as with the brace members. The P-Delta transformation was used for the columns in order to take into account the second-order geometry effects caused by gravity loads during lateral loading. The beam elements, however, used a linear geometric transformation.
The PT elements were modelled using truss elements and the bilinear steel material model labelled Steel01 in OpenSees. This material was then used to form the PT element material using the initStrain material, which essentially applied an initial strain to the steel material. The initial PT force, , in the tendons after elastic shortening of the beams was converted into a strain and, hence, applied to the material. As there was an initial strain in the PT elements but not the beams, there was a small loss in the PT force applied initially. This was because the force present in the PT elements was reduced due to the axial shortening of the beams. Therefore, it was necessary to implement an artificial increase in the initial strain applied to the PT elements material in OpenSees in order to account for this. The following expression gives , which is the force to be applied to the element in order to cause the intended force to be present:
where and are the axial stiffnesses of the PT elements and beams, respectively.
The contact springs placed at the beam flanges that make up the rocking connection were modelled using zero-length elements. These springs were assigned a material model called the elastic no-tension ENT material in OpenSees, which essentially means that it was a contact spring to which a large stiffness was applied in compression. Hence, the contact springs nodes were free to move apart but were met with substantial stiffness when put into compression. These contact springs had no resistance in rotation, but the shear resistance was set as very high in order to prevent the shear force from causing large displacements. The shear force in these springs can then be monitored to calculate the shear force transferred through the connection. This is modelled through the presence of a stiff zero-length element in the vertical direction, shown in Figure 9 as ‘shear link’, to transfer and allow the shear force to be monitored. The compressive stiffness of these contact springs was reported by Kim and Christopoulos [39] to be a sensitive modelling parameter, and these authors also suggested using a value between 10- and 20-times the axial stiffness of the beam elements in order to avoid any convergence issues.
Using the same frame setup seen in the previous section, two tubular steel braces were added to the hypothetical frame examined in Figure 10 to examine the response of a complete SC-CBF. Two 100 × 100 × 6.3 SHS brace members were inserted into the model. Figure 12 shows the response of the SC-CBF, and it can be seen that there is now an increase in base shear and energy dissipation due to the axial yielding of the braces under cyclic loading. Furthermore, the frame exhibits the self-centring behaviour that is expected from the SC-CBF. Figure 12 also compares the numerical results from OpenSees and the analytical results from the equations derived in O’Reilly and Goggins [15]. From this, it can be seen that the analytical expressions derived for the SC-CBF compare well with the results obtained from the OpenSees simulation. The initial stiffnesses of both the analytical and numerical predictions are seen to match each other closely, although the contribution of the compressive brace to the base shear is evident in the numerical model, as the peak base shear is higher than the analytical expression at around 0.5% drift. However, once the compression brace buckles and the frame is pushed towards the target drift of 4%, the two plots converge together.
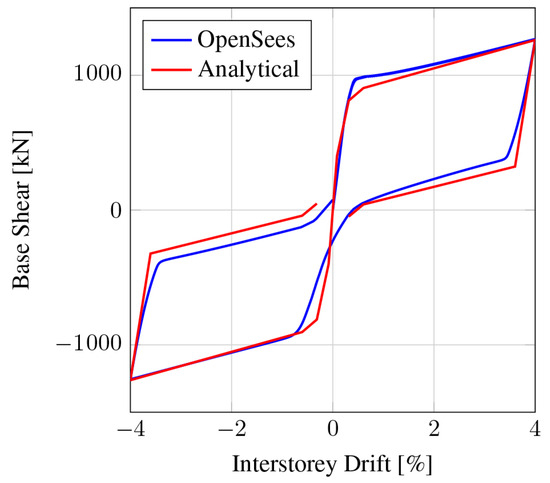
Figure 12.
Base shear versus storey drift for the SC-CBF.
Upon reversal from the positive peak, the analytical expression assumes the same initial stiffness in the negative direction as the positive, but since the brace that will be carrying the tensile load in the negative direction is in the process of straightening from the reversal of the positive load, there is a slight delay in its picking up of the tensile load. Hence, there is a slight difference in stiffness in the negative direction. If the frame is initially pushed in the negative direction, followed by the positive direction, the same behaviour is observed in reverse. Considering the above discussion, it can be concluded from Figure 12 that the previously described modelling parameters accurately capture the SC-CBF’s behaviour compared to its anticipated hysteretic behaviour.
5. Validation of the SC-CBF Numerical Model
5.1. Overview
This section discusses the numerical modelling of the SC-CBF developed using OpenSees by comparing the numerical response to the experimental results from O’Reilly and Goggins [15] outlined in Section 3. The numerical model developed for comparison with the experimental results is shown in Figure 11, which employs the parameters outlined in Section 4.4 to model the test frame setup shown in Figure 3.
The following sections discuss the comparisons between the results from the numerical model and experimental specimens detailed in Section 3.2. For each brace section size shown in Table 2, two of each specimen were tested. Hence, a total of nine tests were conducted, including the bare frame test in which no brace members were used. The final labelling system for each brace specimen is given in Table 2, where this labelling system will be used to refer to each test in the following sections.

Table 2.
Summary of test specimens.
A selection of results from the test programme carried out by O’Reilly and Goggins [15] is presented here to validate the numerical model developed for the SC-CBF. A full set of plots and comparisons between testing and modelling can be found in O’Reilly [4]. The ordinates that are to be presented in the following sections are
- Pushover force versus storey drift
- PT force versus storey drift
- Gap opening versus storey drift
- Connection moment versus storey drift
- Brace OOP displacement versus storey drift
where the plots of pushover force versus drift are to demonstrate the flag-shaped response of the self-centring frame, as outlined in Figure 2. This is the main comparison of the numerical and physical tests, and it demonstrates the model’s validity in predicting the frame’s pushover response. The other comparisons of the frame are secondary response parameters that also demonstrate the behaviour of the model versus the experimental results and will be discussed in each section.
5.2. Pushover Force versus Drift
Figure 13 shows the comparison of pushover force versus storey drift for the test specimens B0, which represents the bare frame test with no brace members inserted, and B1A, B2B, B3A, B3B and B4B, which represent the brace specimens outlined in Table 2.
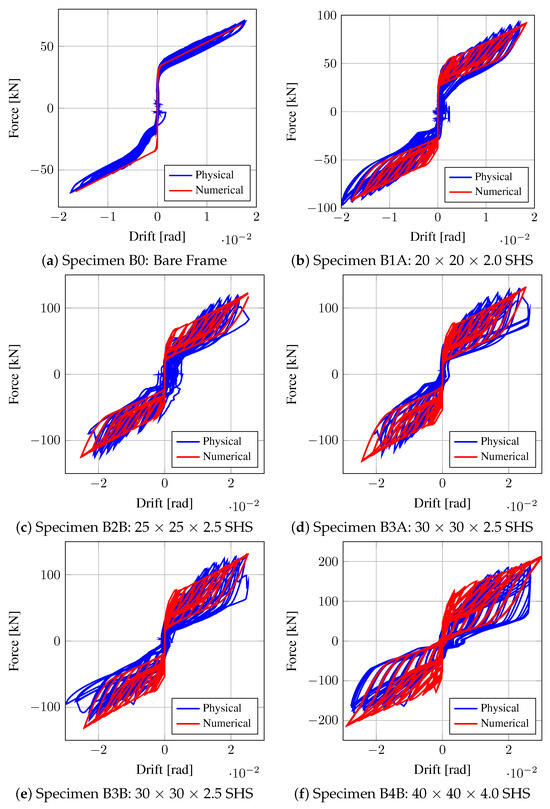
Figure 13.
Pushover force versus drift comparison.
It can be seen in Figure 13a that the response of the physical and numerical models of the self-centring frame without braces (i.e., specimen B0) are in good agreement with the same initial and post-yield stiffness, which demonstrates the bilinear elastic behaviour of the post-tensioned frame when subjected to cyclic loading. The slight kink observed in Figure 13a in the negative direction is due to the looseness of the physical test frame (that is, additional movement in the pin connection at the column bases due to manufacturing tolerances), and is not thought to be an actual characteristic of an idealised frame behaviour. Measures were taken to mitigate the occurrence of these movements in the test frame. However, this movement persisted throughout the test program for all specimens.
Figure 13b–f shows the response of a sample of SC-CBF specimens investigated, and it can be seen that there is an increase in the lateral capacity of the test with the brace specimens inserted. As previously noted, there was significant unintentional looseness and flexibility in the physical test frame. Hence, the input displacement cycles were not exactly what the test frame experienced, although attempts were made to minimise this effect on the system ductility. The outcome of this is that for the numerical model, where there is no additional flexibility or looseness, the input displacement imposed is exactly what is experienced by the frame. Hence, it will be observed in the test results of this specimen, and all specimens, that the displacement amplitude during cycles does not match between the experiment and model. This is not critical, as the general trend of the response parameters is of interest. This is demonstrated in Figure 13b, where the general shape and amplitudes of the force-drift hysteretic behaviour for the physical test and the OpenSees numerical model are similar despite having different cycle amplitudes. This shows that the model and the test frame are in good agreement.
In general, it can be seen that the pushover force versus drift for each of the tests is predicted very well by the numerical model, with the capacities and general characteristics of the flag-shaped behaviour expected from a self-centring frame represented very well.
5.3. PT Force versus Drift
Figure 14 shows plots of the forces present in the PT elements during testing. Since the self-centring frame consists of a series of gap openings at the rocking connection during lateral loading, there is an increase in the force in the PT elements due to the axial elongation of the PT elements from the initially installed post-tensioning force of 80 kN. The plots in Figure 14 show that the numerical model accurately captures the force present in the PT elements during testing, with the slope of the increase in force in the strands with increasing drift being matched very well during testing, except for the B0 test. This is due to a gradual loss of PT force from the original 80 kN that occurred during testing, as the anchorage system was settling in during the first large-amplitude test and, hence, lost a small amount of force during testing. This loss in force was also caused by the use of temporary anchorage systems for the testing, where more permanent anchors would be used in practice, minimising such a loss. Thus, as can be seen from Figure 14, the PT force in the frame before testing reduced to between 55 kN and 65 kN in subsequent tests after the initial test on the frame B0. Overall, the slopes of the PT force increase with drift show excellent agreement between test and model.
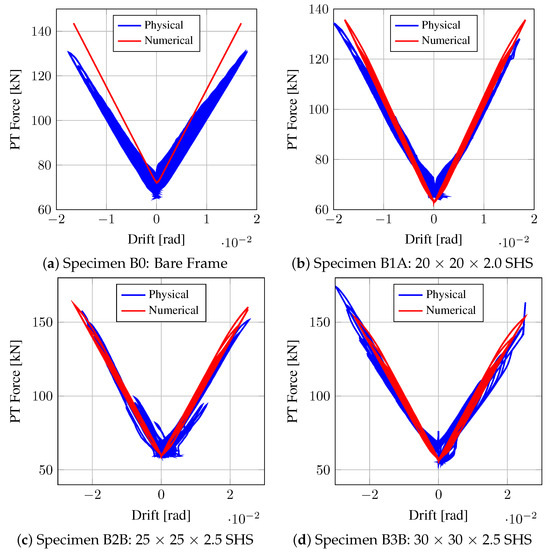
Figure 14.
PT force versus drift comparison.
5.4. Gap Opening versus Drift
Figure 15 compares the gap opening at the beam flanges at the beam–column connection for both physical and numerical models. The abbreviations in the legends of the plots of the gap opening refer to the position of the instrument on the frame and stand for the lower beam bottom flange (LBBF), lower beam top flange (LBTF), upper beam bottom flange (UBBF) and upper beam top flange (UBTF). ‘P’ and ‘N’ represent the results from the physical and numerical models, respectively.
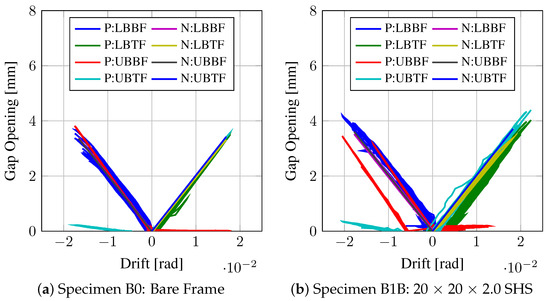
Figure 15.
Gap opening versus drift comparison.
This gap opening behaviour of the beam–column connection demonstrates that the rocking connection behaved as expected, with this gap opening being responsible for the increase in PT force and, hence, the self-centring behaviour of the system. Figure 15 demonstrates that the comparisons between the physical experimental results and the numerical model are in good agreement. There is a slight offset in the UBBF measurement for the B1B specimen, as the instrument was adjusted during the test and, hence, the zeroing left an offset on a portion of the data, although a similar rate of gap opening with increase in drift is demonstrated nonetheless.
5.5. Connection Moment versus Drift
Figure 16 shows a comparison of the moment induced in the beam–column connection by the PT strands which is plotted against drift for the physical and numerical models. This moment rotation behaviour of the connection corresponds to the simple rotational spring definition that was used by Christopoulos and Filiatrault [37] to model self-centring systems by using rotational springs as opposed to a more realistic representation of the connection components and geometry, as discussed in Section 4.3. Overall, the plots show that the moment at the connection versus drift is accurately captured by the numerical model with rigid link offsets to account for beam depth.
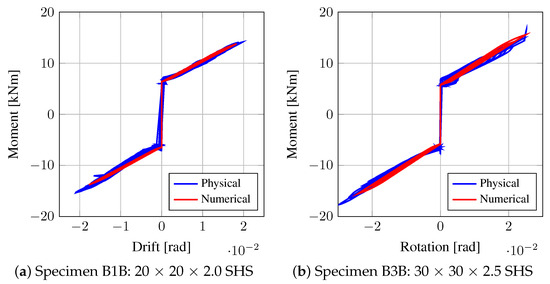
Figure 16.
Connection moment versus drift comparison.
5.6. Brace OOP Displacement versus Drift
Figure 17 shows a comparison between the out of plane (OOP) displacement of the braces for SC-CBFs containing 20 × 20 × 2.0 SHS and 25 × 25 × 2.5 SHS braces (i.e., specimens B1A and B2B, respectively). These figures show that the general trend of the OOP displacement is captured well, although the numerical model tends to underestimate the maximum OOP displacement with imposed frame drift cycles when the frame is pushed to the largest drift cycles. This behaviour was observed in O’Reilly [4] for most specimens, except for the frames containing the 30 × 30 × 2.5 SHS and 40 × 40 × 4.0 SHS braces (i.e., frames B3 and B4, respectively), where the OOP displacement was similar in the numerical and physical models or even overestimated by the numerical model. However, the general trends and comparison between the physical experimental test data and modelling results shown in Figure 17 seem satisfactory as the OOP displacement is not a critical parameter in the behaviour of the SC-CBF. These results also indicate that the braces do indeed buckle in the OOP direction as anticipated and provide further support for the anticipated structural behaviour described in Section 2 and modelled in Section 4. This is clear from the good matching between testing and modelling shown in Figure 17 and since this OOP behaviour has also been observed in past tests such as Goggins [23], among others.
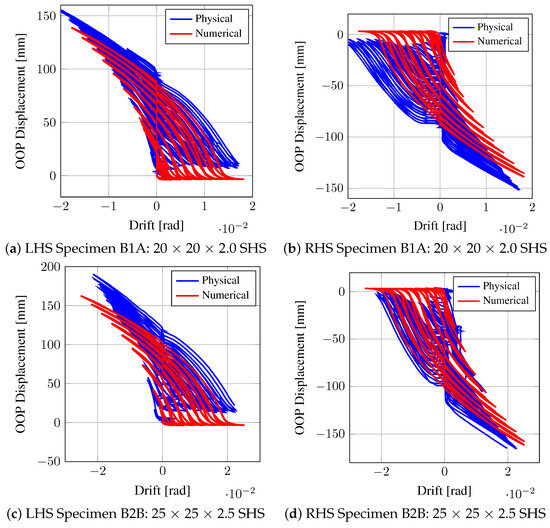
Figure 17.
OOP displacement versus drift comparison.
6. Summary and Conclusions
This paper introduced the concept of the self-centring, concentrically braced frame (SC-CBF), in which a post-tensioning arrangement was combined with conventional diagonal steel tubular members to yield a system that has both the same desirable lateral stiffness and capacity but also exhibits self-centring behaviour after many cycles of inelastic behaviour. The general arrangement of the SC-CBF was introduced along with the composition of its hysteretic behaviour when subjected to large inelastic cycles. An experimental programme to test the SC-CBF concept was briefly described in which several brace specimens of various normalised slenderness ratios were tested. More in-depth discussions of the physical testing of this novel SC-CBF system are available in O’Reilly and Goggins [15].
The numerical modelling of CBFs in OpenSees was discussed, and the various parameters to be incorporated in the model for the SC-CBF were outlined, such as brace elements and gusset plate connection stiffness modelling. The development of modelling procedures for self-centring systems that use the rocking connection detail was reviewed. The results of these modelling parameters for self-centring frames were combined with those proposed for CBFs to produce a model that was then validated against the experimental test data for the novel SC-CBF developed by the authors. Initial comparisons between the responses of the SC-CBF numerical models and the analytical expressions derived in O’Reilly and Goggins [15] to describe the behaviour of the SC-CBF were presented and shown to accurately capture the behaviour of the SC-CBF.
These modelling parameters proposed for the SC-CBF were then validated against the experimental test data presented in O’Reilly and Goggins [15]. The comparisons showed that the numerical model for the SC-CBF captured the salient behaviour very well when compared in terms of the pushover force versus drift as well as other ordinates, such as the PT axial force, gap opening at the beam–column connection and moments at the connection. The OOP displacements of the brace specimens were also examined, where it was seen that the relationship between the OOP displacements and drift was modelled well, although the amplitudes of the OOP displacement at maximum drift were not always totally accurate.
Overall, this paper has demonstrated that the numerical model developed in OpenSees for the SC-CBF captures the behaviour well when compared to experimental test data for a range of brace specimens. Therefore, this validated model for the SC-CBF can be used as part of future studies on the SC-CBF to aid in developing these frames into a more resilient design option for braced frames subjected to earthquake loading in moderate to highly seismically active regions.
Author Contributions
Conceptualization, G.J.O. and J.G.; methodology, G.J.O. and J.G.; software, G.J.O.; validation, G.J.O. and J.G.; formal analysis, G.J.O. and J.G.; investigation, G.J.O. and J.G.; resources, G.J.O. and J.G.; data curation, G.J.O.; writing—original draft preparation, G.J.O.; writing—review and editing, J.G.; visualization, G.J.O. and J.G.; supervision, J.G.; project administration, G.J.O. and J.G.; funding acquisition, G.J.O. and J.G. All authors have read and agreed to the published version of the manuscript.
Funding
This work was supported with funding from the Irish Research Council.
Data Availability Statement
Data are contained within the article.
Conflicts of Interest
The authors declare no conflicts of interest.
References
- EN 1998-1:2004; Eurocode 8: Design of Structures for Earthquake Resistance—Part 1: General Rules, Seismic Actions and Rules for Buildings. European Standard; Comité Européen de Normalisation (CEN): Brussels, Belgium, 2004.
- McCormick, J.; Aburano, H.; Ikenaga, M.; Nakashima, M. Permissible residual deformation levels for building structures considering both safety and human elements. In Proceedings of the 14th World Conference on Earthquake Engineering, Beijing, China, 12–17 October 2008. [Google Scholar]
- Stanton, J.; Stone, W.C.; Cheok, G.S. A Hybrid Reinforced Precast Frame for Seismic Regions. PCI J. 1997, 42, 20–32. [Google Scholar] [CrossRef]
- O’Reilly, G.J. Development of a Novel Self-Centering Concentrically Braced Steel Frame System. Master’s Thesis, National University of Ireland, Galway, Ireland, 2013. [Google Scholar]
- Zhu, S.; Zhang, Y. Seismic behaviour of self-centring braced frame buildings with reusable hysteretic damping brace. Earthq. Eng. Struct. Dyn. 2007, 36, 1329–1346. [Google Scholar] [CrossRef]
- Christopoulos, C.; Tremblay, R.; Kim, H.J.; Lacerte, M. Self-Centering Energy Dissipative Bracing System for the Seismic Resistance of Structures: Development and Validation. J. Struct. Eng. 2008, 134, 96–107. [Google Scholar] [CrossRef]
- Clayton, P.M.; Berman, J.W.; Lowes, L.N. Seismic Design and Performance of Self-Centering Steel Plate Shear Walls. J. Struct. Eng. 2012, 138, 22–30. [Google Scholar] [CrossRef]
- Ricles, J.M.; Sause, R.; Garlock, M.M.; Zhao, C. Posttensioned Seismic-Resistant Connections for Steel Frames. J. Struct. Eng. 2001, 127, 113–121. [Google Scholar] [CrossRef]
- Garlock, M.M.; Ricles, J.M.; Sause, R. Experimental Studies of Full-Scale Posttensioned Steel Connections. J. Struct. Eng. 2005, 131, 438–448. [Google Scholar] [CrossRef]
- Christopoulos, C. Self-Centering Post-Tensioned Energy Dissipating Steel Frames For Seismic Regions. Ph.D. Thesis, University of California, San Diego, CA, USA, 2002. [Google Scholar]
- O’Reilly, G.J.; Calvi, G.M. Conceptual seismic design in performance-based earthquake engineering. Earthq. Eng. Struct. Dyn. 2019, 48, 389–411. [Google Scholar] [CrossRef]
- O’Reilly, G.J.; Calvi, G.M. Quantifying seismic risk in structures via simplified demand–intensity models. Bull. Earthq. Eng. 2020, 18, 2003–2022. [Google Scholar] [CrossRef]
- Shahnazaryan, D.; O’Reilly, G.J. Integrating expected loss and collapse risk in performance-based seismic design of structures. Bull. Earthq. Eng. 2021, 19, 987–1025. [Google Scholar] [CrossRef]
- Vamvatsikos, D.; Kazantzi, A.K.; Aschheim, M.A. Performance-Based Seismic Design: Avant-Garde and Code-Compatible Approaches. ASCE-ASME J. Risk Uncertain. Eng. Syst. A Civ. Eng. 2016, 2, C4015008. [Google Scholar] [CrossRef]
- O’Reilly, G.J.; Goggins, J. Experimental testing of a self-centring concentrically braced steel frame. Eng. Struct. 2021, 238, 111521. [Google Scholar] [CrossRef]
- Christopoulos, C.; Filiatrault, A.; Uang, C.M.; Folz, B. Posttensioned Energy Dissipating Connections for Moment-Resisting Steel Frames. J. Struct. Eng. 2002, 128, 1111–1120. [Google Scholar] [CrossRef]
- EN 1993-1-1:2005; Eurocode 3: Design of Steel Structures—Part 1-1: General Rules and Rules for Buildings. European Standard; Comité Européen de Normalisation (CEN): Brussels, Belgium, 2005.
- EN 10025-2:2004; European Structural Steel Standard: Grade Designations, Properties and Nearest Equivalents. Comité Européen de Normalisation (CEN): Brussels, Belgium, 2004.
- ECCS. Recommended Testing Procedure for Assessing the Behaviour of Structural Steel Elements under Cyclic Loads; Technical report; European Standard Technical Working Group 1.3: Brussels, Belgium, 1986. [Google Scholar]
- Uriz, P. Towards Earthquake Resistant Design of Concentrically Braced Steel Structures. Ph.D. Thesis, University of California, Berkeley, CA, USA, 2005. [Google Scholar]
- McKenna, F.; Scott, M.H.; Fenves, G.L. Nonlinear Finite-Element Analysis Software Architecture Using Object Composition. J. Comput. Civ. Eng. 2010, 24, 95–107. [Google Scholar] [CrossRef]
- Salawdeh, S. Seismic Design of Concentrically Braced Steel Frames. Ph.D. Thesis, National University of Ireland, Galway, Ireland, 2012. [Google Scholar]
- Goggins, J. Earthquake Resistant Hollow and Filled Steel Braces. Ph.D. Thesis, Trinity College Dublin, Dublin, Ireland, 2004. [Google Scholar]
- Uriz, P.; Filippou, F.C.; Mahin, S.A. Model for Cyclic Inelastic Buckling of Steel Braces. J. Struct. Eng. 2008, 134, 619–628. [Google Scholar] [CrossRef]
- Nascimbene, R.; Rassati, G.A.; Wijesundara, K. Numerical Simulation of Gusset Plate Connections with Rectangular Hollow Section Shape Brace Under Quasi-Static Cyclic Loading. J. Constr. Steel Res. 2012, 70, 177–189. [Google Scholar] [CrossRef]
- Salawdeh, S.; Goggins, J. Numerical simulation for steel brace members incorporating a fatigue model. Eng. Struct. 2013, 46, 332–349. [Google Scholar] [CrossRef]
- Goggins, J.; Broderick, B.M.; Elghazouli, A.Y.; Lucas, A.S. Experimental cyclic response of cold-formed hollow steel bracing members. Eng. Struct. 2005, 27, 977–989. [Google Scholar] [CrossRef]
- Nip, K.; Gardner, L.; Elghazouli, A. Cyclic testing and numerical modelling of carbon steel and stainless steel tubular bracing members. Eng. Struct. 2010, 32, 424–441. [Google Scholar] [CrossRef]
- Santagati, S.; Bolognini, D.; Nascimbene, R. Strain Life Analysis at Low-Cycle Fatigue on Concentrically Braced Steel Structures with RHS Shape Braces. J. Earthq. Eng. 2012, 16, 107–137. [Google Scholar] [CrossRef]
- Hsiao, P.C.; Lehman, D.E.; Roeder, C.W. Improved analytical model for special concentrically braced frames. J. Constr. Steel Res. 2012, 73, 80–94. [Google Scholar] [CrossRef]
- Berman, J.W.; Bruneau, M. Cyclic Testing of a Buckling Restrained Braced Frame with Unconstrained Gusset Connections. J. Struct. Eng. 2009, 135, 1499–1510. [Google Scholar] [CrossRef]
- Freddi, F.; Dimopoulos, C.A.; Karavasilis, T.L. Rocking damage-free steel column base with friction devices: Design procedure and numerical evaluation. Earthq. Eng. Struct. Dyn. 2017, 46, 2281–2300. [Google Scholar] [CrossRef]
- Pieroni, L.; Di Benedetto, S.; Freddi, F.; Latour, M. Genetic Algorithm for the optimal placement of Self-Centering Damage-Free joints in steel MRFs. J. Constr. Steel Res. 2022, 197, 107489. [Google Scholar] [CrossRef]
- Pieroni, L.; Freddi, F.; Latour, M. Effective placement of self-centering damage-free connections for seismic-resilient steel moment resisting frames. Earthq. Eng. Struct. Dyn. 2022, 51, 1292–1316. [Google Scholar] [CrossRef]
- Elettore, E.; Lettieri, A.; Freddi, F.; Latour, M.; Rizzano, G. Performance-based assessment of seismic-resilient steel moment resisting frames equipped with innovative column base connections. Structures 2021, 32, 1646–1664. [Google Scholar] [CrossRef]
- Freddi, F.; Dimopoulos, C.A.; Karavasilis, T.L. Experimental Evaluation of a Rocking Damage-Free Steel Column Base with Friction Devices. J. Struct. Eng. 2020, 146. [Google Scholar] [CrossRef]
- Christopoulos, C.; Filiatrault, A. Principles of Passive Supplemental Damping and Seismic Isolation; IUSS Press: Pavia, Italy, 2006. [Google Scholar]
- Clayton, P.M. Self-Centering Steel Plate Shear Walls: Development of Design Procedure and Evaluation of Seismic Performance. Master’s Thesis, University of Washington, Seattle, WA, USA, 2010. [Google Scholar]
- Kim, H.J.; Christopoulos, C. Numerical models and ductile ultimate deformation response of post-tensioned self-centering moment connections. Earthq. Eng. Struct. Dyn. 2009, 38, 1–21. [Google Scholar] [CrossRef]
Disclaimer/Publisher’s Note: The statements, opinions and data contained in all publications are solely those of the individual author(s) and contributor(s) and not of MDPI and/or the editor(s). MDPI and/or the editor(s) disclaim responsibility for any injury to people or property resulting from any ideas, methods, instructions or products referred to in the content. |
© 2024 by the authors. Licensee MDPI, Basel, Switzerland. This article is an open access article distributed under the terms and conditions of the Creative Commons Attribution (CC BY) license (https://creativecommons.org/licenses/by/4.0/).