Article

The Role of Delay Time in the Preliminary Assessment of the Seismic Resilience (SR) of a Bridge: A Case Study

by
Federico Baciocchi
and
Davide Forcellini
*
Faculty of Civil and Environmental Engineering, University of San Marino, Via Consiglio dei 60, n. 99, 47890 Serravalle, San Marino
*
Author to whom correspondence should be addressed.
Infrastructures 2024, 9(7), 108; https://doi.org/10.3390/infrastructures9070108
Submission received: 29 May 2024 / Revised: 27 June 2024 / Accepted: 8 July 2024 / Published: 9 July 2024
(This article belongs to the Section Infrastructures and Structural Engineering)

Abstract

:
The seismic resilience of bridges has become an important concept in civil engineering since these systems need to remain operative during and after earthquakes. In this regard, the definition of recovery needs to consider the delay time (named as the time between an event and the beginning of the recovery process). The original concept of seismic resilience has been expanded herein in order to account for the delay time of bridge configurations. Its role in the quantification of seismic resilience has been investigated by performing a case study of a Californian highway bridge subjected to an ensemble of 100 input motions. The results demonstrate that the delay time may significantly reduce the seismic resilience of bridges.

1. Introduction

The functionality of infrastructures is fundamental for resilient societies in order to maintain an operational level of serviceability during earthquakes [1,2], as shown in Italy [3] and the Central Sulawesi earthquake (Indonesia) in 2018 [4]. In the literature, seismic resilience has been developed since the early 2000s (i.e., [5,6]). In particular, ref. [7] proposes a quantitative assessment of seismic resilience with some applications to bridges [8,9]. For this background, downtime was defined as the range of time between the seismic event and the re-occupancy of the building [10]. This time is defined as the sum of two components [11]:
(1) The delay time that is necessary to evaluate the state of the system, make decisions, mobilize economic and human resources;
(2) The repair time depends on the recovery process of returning to the original functionality.
Following [12], the concept of downtime was considered for the assessment of the structural losses. Later, ref. [13] assessed the actual mobilization and repair times together with different building limit states, proposing several limit states: the functionality limit state (FLS), detailed inspection limit state (DILS), and repairability limit state (RLS). In addition, the approach assumed by [14] consists of the quantification of the repair time without considering the recovery process. In particular, ref. [15] considered the range between the time of the earthquake and the time at which the repair process begins with the name of “mobilization time” by describing the time taken for inspections, relocations of occupants and activities, and decision-making procedures.
An alternative methodology proposed by [16] named the delay time as impeding time, considering the fact that indirect and external factors may produce a delay at the beginning of the recovery process, as assumed in several contributions [17,18,19]. In particular, ref. [20] proposed that the impeding times may range from 5 days for inspection to around 50 weeks for some contractor, design, and finance delays.
Other contributions investigated how the characteristics of human infrastructures and post-disaster decision-making considerably affect the recovery process (Marquis et al., 2017) and the unpredictable characteristics of the owners (e.g., income, ownership, time at current residence, earthquake insurance, etc.) [21]. In [22], 22 businesses affected by the 2011 Christchurch Earthquake were investigated to demonstrate whether strategies to recover business are fundamental in reducing the delay time. In addition, the role of several factors, such as the decision to evacuate the building, suspend ordinary activities, or preserve its functionality, was considered in many contributions (e.g., [23,24]). Moreover, several contributions focused on proposing novel strategies for the risk mitigation of several case studies. In particular, refs. [25,26] proposed a Railway Rapid Warning System (RRWS) for the railway viaduct of the Campania region of Italy connecting Quarto Centro and Quarto stations of the urban train line (Line 1) in the Northern metropolitan area of Naples. Pang et al. [27,28] proposed the assessment of the seismic resilience of long-span cable-stayed bridges and highway bridges with fiber-reinforced concrete piers exposed to structural corrosion. In addition, Yalin et al. [29,30] proposed a time-dependent combined index seismic resilience assessment to consider the case of shear-critical RC bridge piers with height-varying corrosion.
The novelties of this paper consist of investigating the role of the delay time by applying a methodology that quantifies the different values of seismic resilience. In this regard, this paper proposes a quantitative assessment of the reduction in seismic resilience due to the delay time and may be used for decision-making procedures and strategies. Therefore, the role of the delay time in reducing seismic resilience is assessed by considering a case study of a Californian highway bridge. The approach adopted in [9,31] has been herein applied by introducing different values of the delay time.
The paper is divided into several sections. In Section 2, the applied methodology is described, while the case study and its hypotheses are shown in Section 3. The results deriving from the PBEE methodology are discussed in Section 4. The role of the delay time on the seismic resilience of the bridge is discussed in Section 5.

2. Methodology

The present section aims to discuss the applied methodology to assess the seismic resilience of bridges by following the recent literature (i.e., [9,32,33]).
In particular, several steps were considered:
Step 1: Calculate the repair time (RT) and the total repair cost ratio (RCR) by applying the Pacific Earthquake Engineering Research (PEER) center methodology [34]. The calculation of the costs is based on the Caltrans comparative bridge costs database, and RT and RCR values are calculated with the local linearization repair cost and time methodology developed by [34].
Step 2: the loss model is calculated proportionally to the values of RCR and RT by assuming that the losses occur at the time of occurrence of the event, as commonly adopted in earthquake engineering.
Step 3: the recovery model is considered to begin after different values of the delay time in order to assess its role in the calculation of seismic resilience in the system, and the same model is applied to several cases.
It is worth noting that the delay time was considered herein as the range of time between the time of occurrence of the event and the start of the recovery process. In particular, the delay time consists of several events, such as the mobilization of time for the field investigations, the collection of data for the different repair strategies, and the financial management and the localization of materials and crews. The delay time may vary depending on the structural characteristics, the location, the availability of the workers, regional codes, and the development of the area.
In particular, the delay time is represented as a horizontal line in Figure 1, and it is marked as Td (delay time). The diagram functionality (Q) versus time represents the process of the system when an earthquake occurs. At the time of the event, T0E, the reduction in the functionality represented by the vertical line describes the losses (L) that occur in the system. In particular, the remaining functionality after the earthquake (Q0) is calculated as follows:
Q 0 = 1 L
Then, there are a range of times during which the functionality remains at Q0, and this is the delay time, as shown in red. At the time Td +T0E, the recovery process starts, and after the recovery time (RT), the functionality may reach the final value Q at Tf, which is the final time of the entire process.
The definition of the delay time may be deduced following the Redi methodology [20] or the ‘impeding factors’ for the cases of buildings, which may include the time to complete post-earthquake inspections, secure financing for repairs, mobilize engineering services, obtain permitting, mobilize a contractor and necessary equipment, and for the contractor to order and receive the required components including “long-lead time” items. Several operations may contribute to the delay time, such as the post-earthquake inspections that require qualified professionals and technicians to inspect the bridge immediately after an earthquake. In addition, the estimated damage requires skilled contractors and potential engineering services. Moreover, the time to access financing is unpredictable since financing from insurance or private funds may vary considerably (i.e., weeks, months, or more).

3. Case Study

A case study of a bridge is hereon considered by analyzing 81 cases consisting of different delay time values (R0 = 0, R1 = 15, and R2 = 90 days) and several functionality ratios (80%, 100%, and 110%). In total, 100 input motions were selected from the NGA database (http://peer.berkeley.edu/nga/), accessed on 1 May 2024, and the Peak Ground Acceleration (PGA) was considered as the relative Intensity Measure (Im). They consist of acceleration time histories along three perpendicular directions (longitudinal, transversal, and vertical) that represent the Californian seismicity. Different levels of intensities were considered in order to obtain a wide distribution of outputs [34]:
Inputs 1–20: moment magnitude Mw 6.5–7.2 and distance 15–30 km;
Inputs 21–40: Mw 6.5–7.2 and R 30–60 km;
Inputs 41–60: Mw 5.8–6.5 and R 15–30 km;
Inputs 61–80: Mw 5.8–6.5 and R 30–60 km;
Inputs 81–100: Mw 5.8–7.2 and R 0–15 km.
The losses are calculated with the local linearization repair cost and time methodology (LLRCAT), developed by [9,34], and based on the comparative bridge costs by Caltrans [35].
Several hypotheses were assumed herein:
(1)
Direct and indirect losses were calculated by assuming that the direct losses were 100% of the RCR. The indirect losses were assessed by considering the sum of the connectivity losses (C) due to the road network and the prolongation time (P) that represents the loss of functionality of the bridge.
(2)
The losses were considered to occur at the time of the event by neglecting the disruption time. This assumption is commonly considered acceptable for earthquakes because of the relatively short time in which the damage occurs.
(3)
The recovery model was assumed to be the same for all 81 cases in order to make a comparison between the various scenarios. Even if several recovery models were present in the literature, herein, linear recovery functions were implemented by considering two conditions. RT was quantified by applying the PBEE methodology, while several functionality ratios (β: 80%, 100%, and 110%) were considered.
(4)
In order to assess the role of the delay time on seismic resilience, several values were considered: 0, 15, and 90 days. They were chosen to represent different cases of delays with three realistic values: no delay, which might be considered a theoretical case; 15 days of delay time, which is reasonable for rapid decision-making procedures; and 90 days, which represents a slow process.
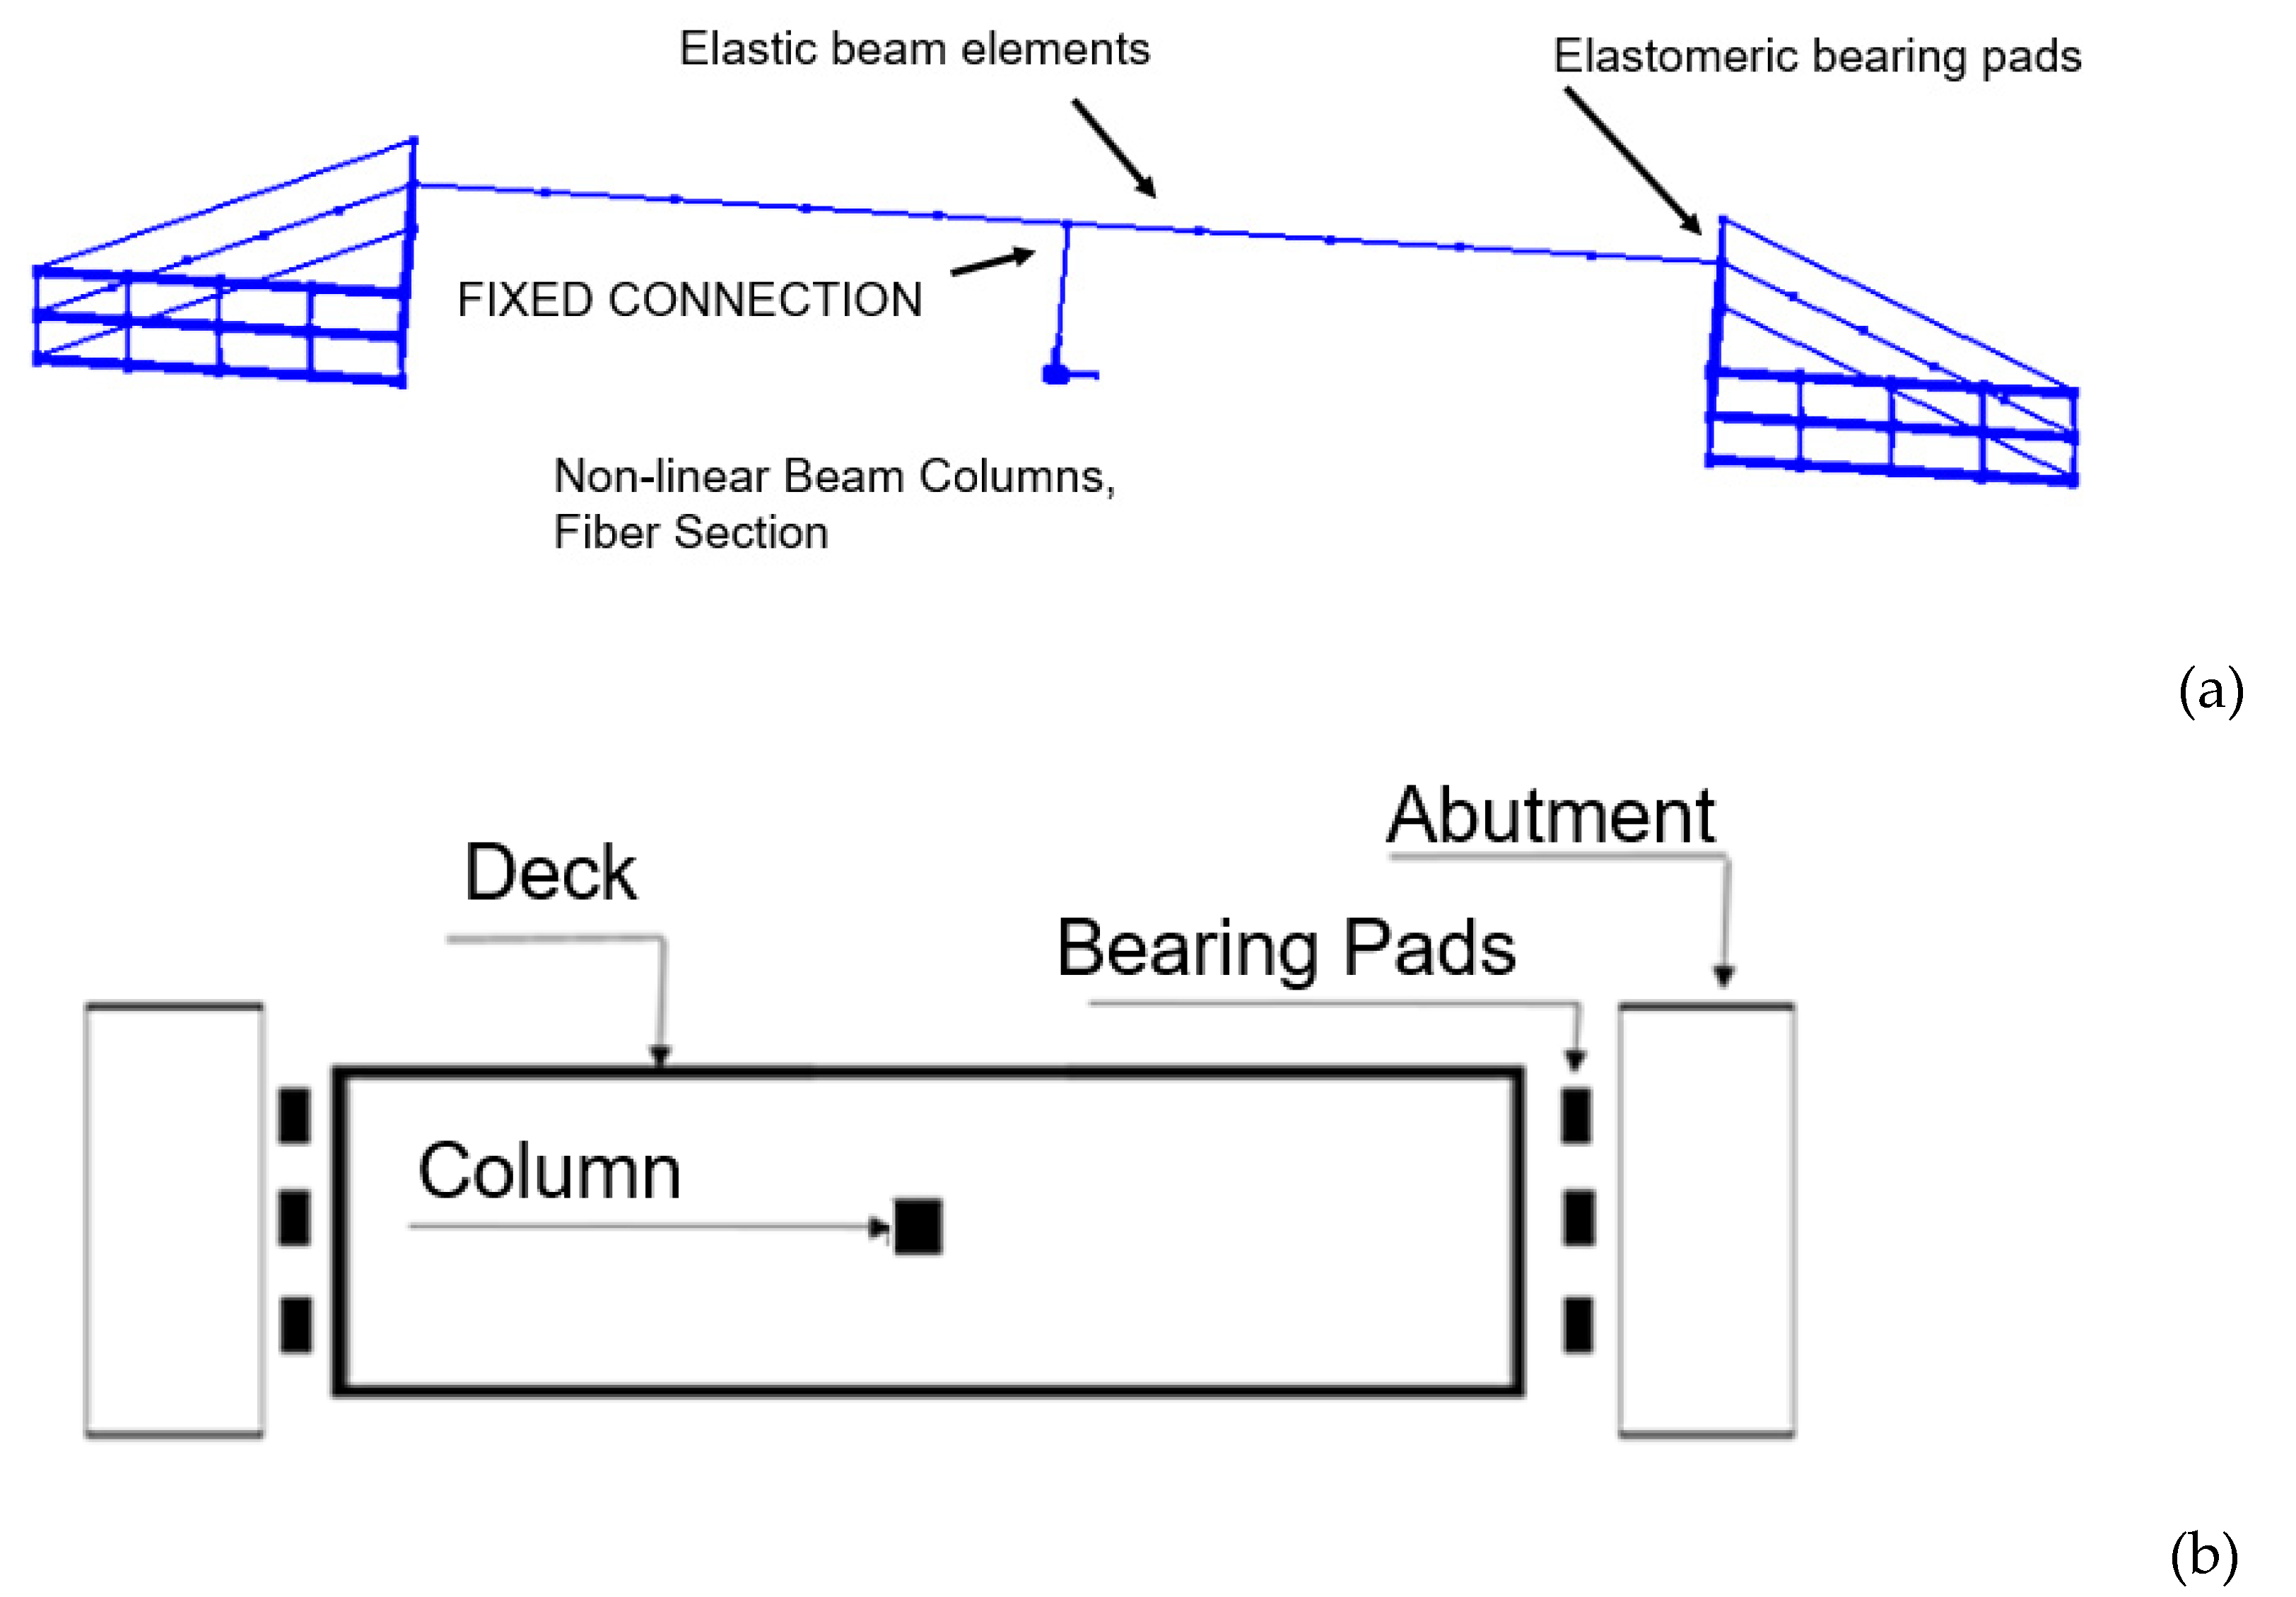
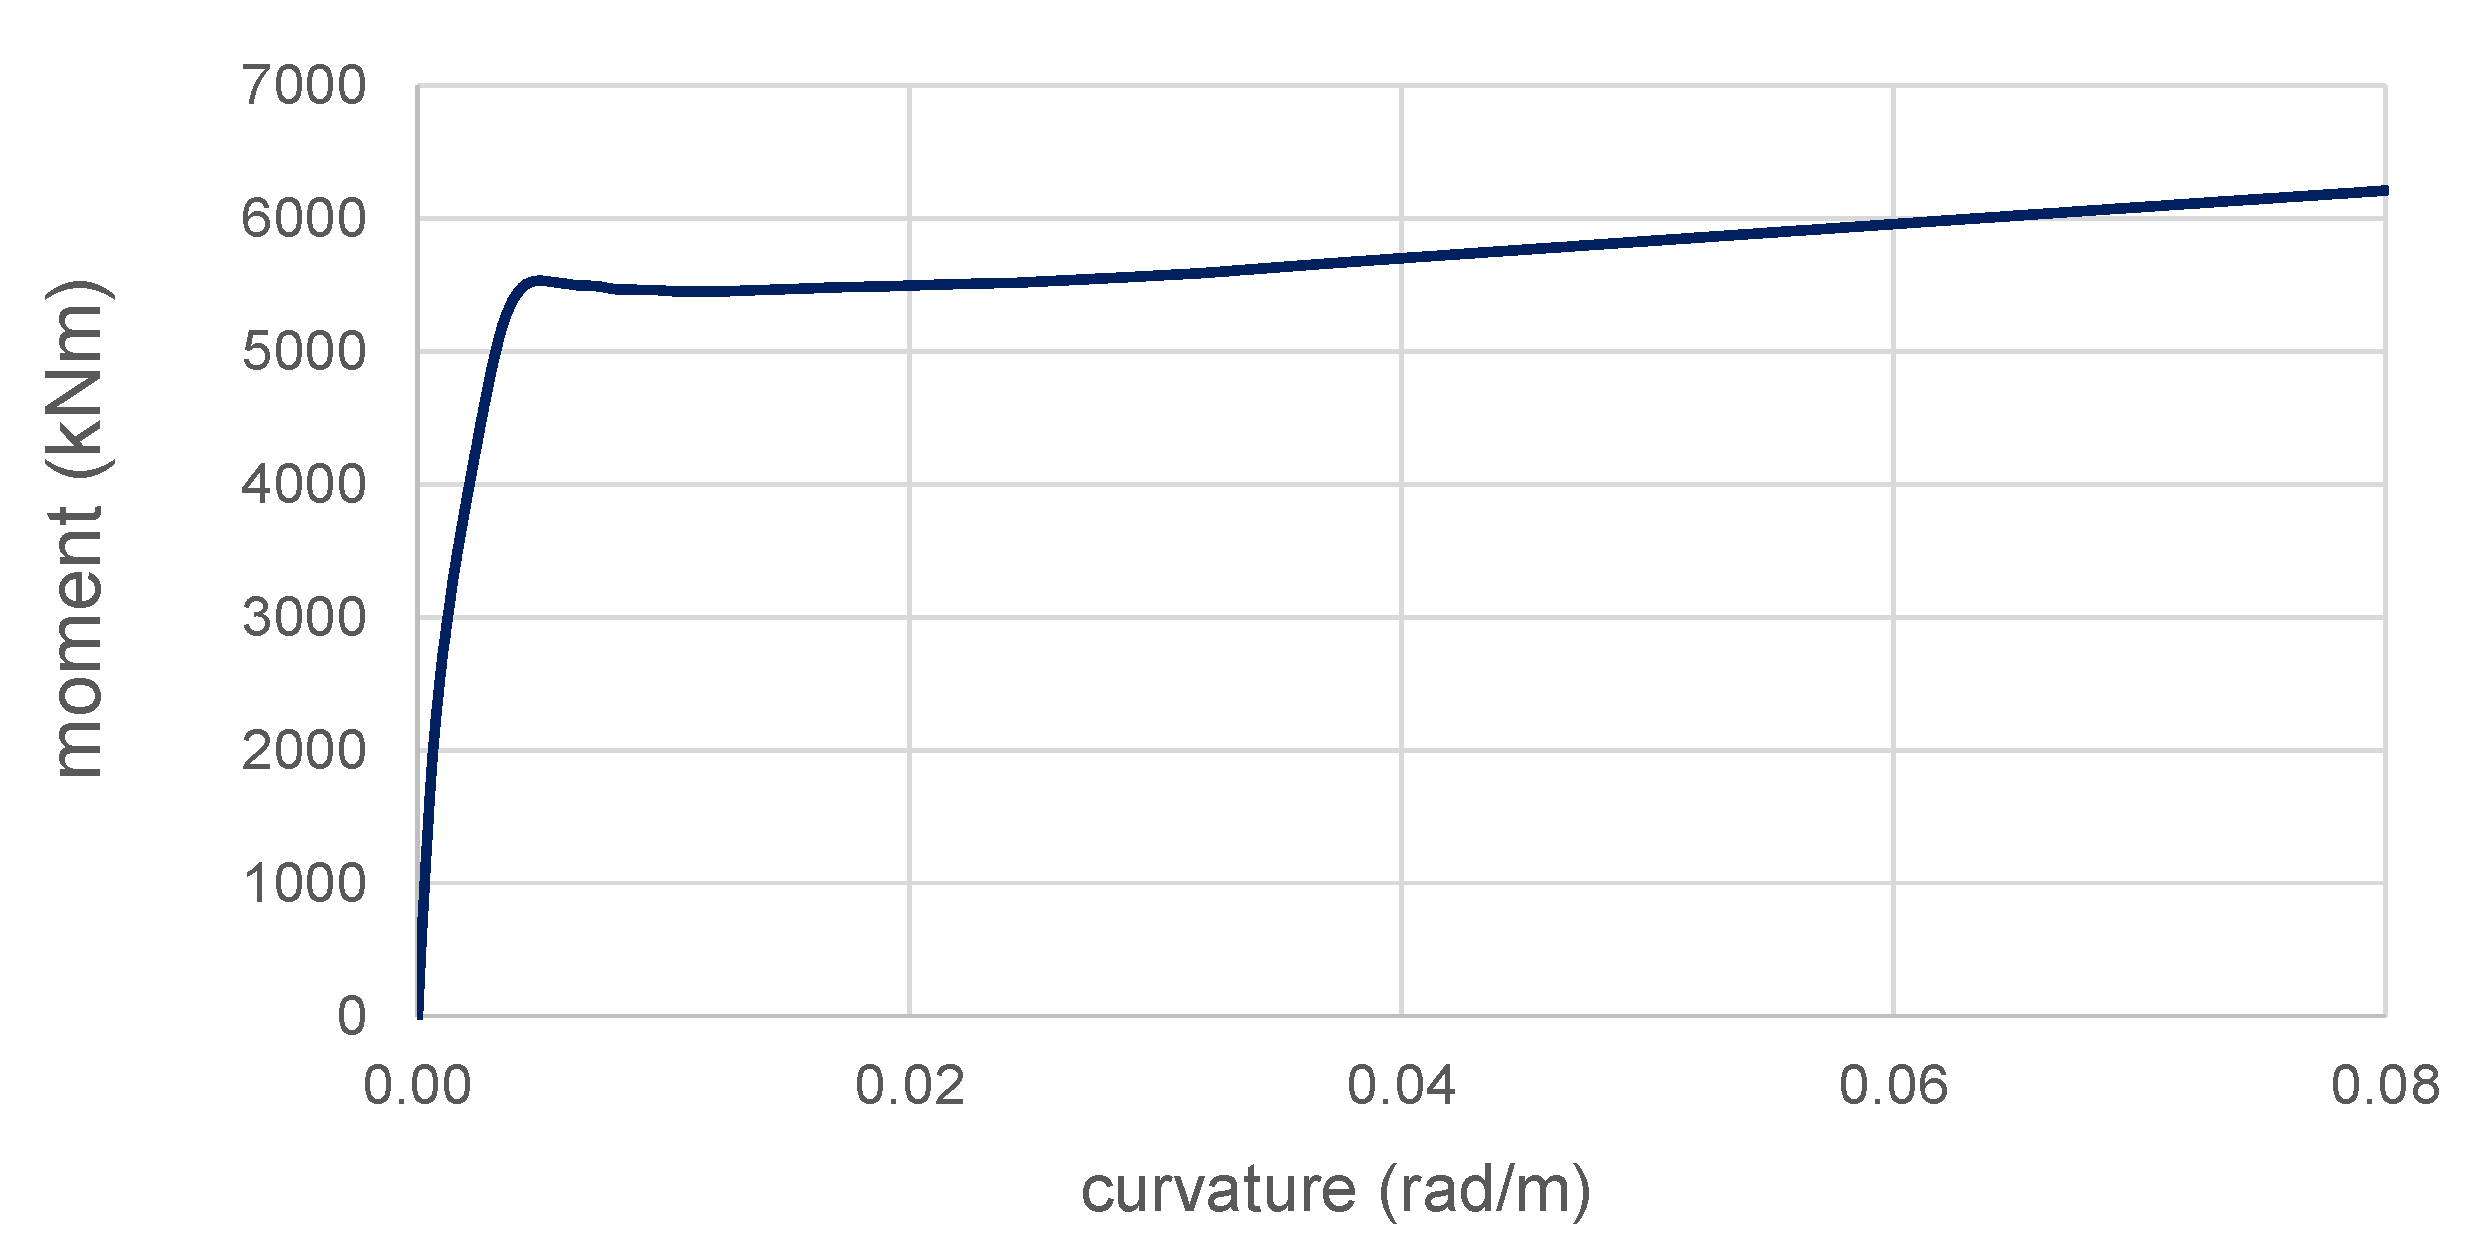
The structural scheme consisted of an Ordinary Standard Bridge (OSB) that is representative of the Californian highway bridges, and it was designed by following the Caltrans prescriptions [35] and studied in several publications [9,34,36]. Figure 2 shows the structural scheme of the bridge. The bridge was defined as a Type 1 class of bridge design, as already applied in [9]. The deck was 90 m long, 11.90 m wide and 1.80 m deep (weight: 130.30 kN/m). The two-spam structure was supported by the central column (circular, 1.22 m diameter) and was 6.70 m tall. The column was modeled with non-linear beam-column elements (fiber section), following the previous study [36]. The moment–curvature relationship is shown in Figure 3. The abutments are 25 m long (total weight: 30,000 kN). The bridge was designed to perform under capacity design conditions, and it was equipped (on both the abutments and the top of the column) with isolation devices that were modeled with advanced numerical models to represent non-linear behavior [37,38]. It was assumed that the deck remained elastic and, hence, uncracked in all the cases analyzed here, following EC8-2. The modulus of elasticity of the concrete E, Poisson’s ratio ν, and the unit weight w were taken E = 2.8 × 10 4 MPa, ν = 0.20, and w = 24 kN/m3, respectively). The connection between the column and the deck was reproduced as a fixed connection by applying EqualDOF (six components of deformations were restrained). The abutments were modeled with the so called “spring model” [34] to account for the inelastic behavior of the soil material under high shear deformation levels, which may dominate the response of the whole bridge. Transversally, connections were modeled with distributed zero-length elements along two rigid elements to represent the rotation of the vertical bridge axis. The longitudinal response of the bridge was controlled by the elastomeric bearing pads. The vertical response of the abutment was modeled with the vertical stiffness of the bearing pads and of the trapezoidal embankment. The longitudinal response was based on the response of the gap closure, as described in [34], while the transversal direction was modeled with a system of zero-length elements distributed along two rigid elements to represent the response of the elastomeric bearing pads. The vertical response of the abutments was represented by the vertical stiffness of the bearing pads in series with the vertical stiffness of the trapezoidal embankment. The mass of the abutment was assumed as a nominal mass proportional to the superstructure dead load.

4. PBEE Results

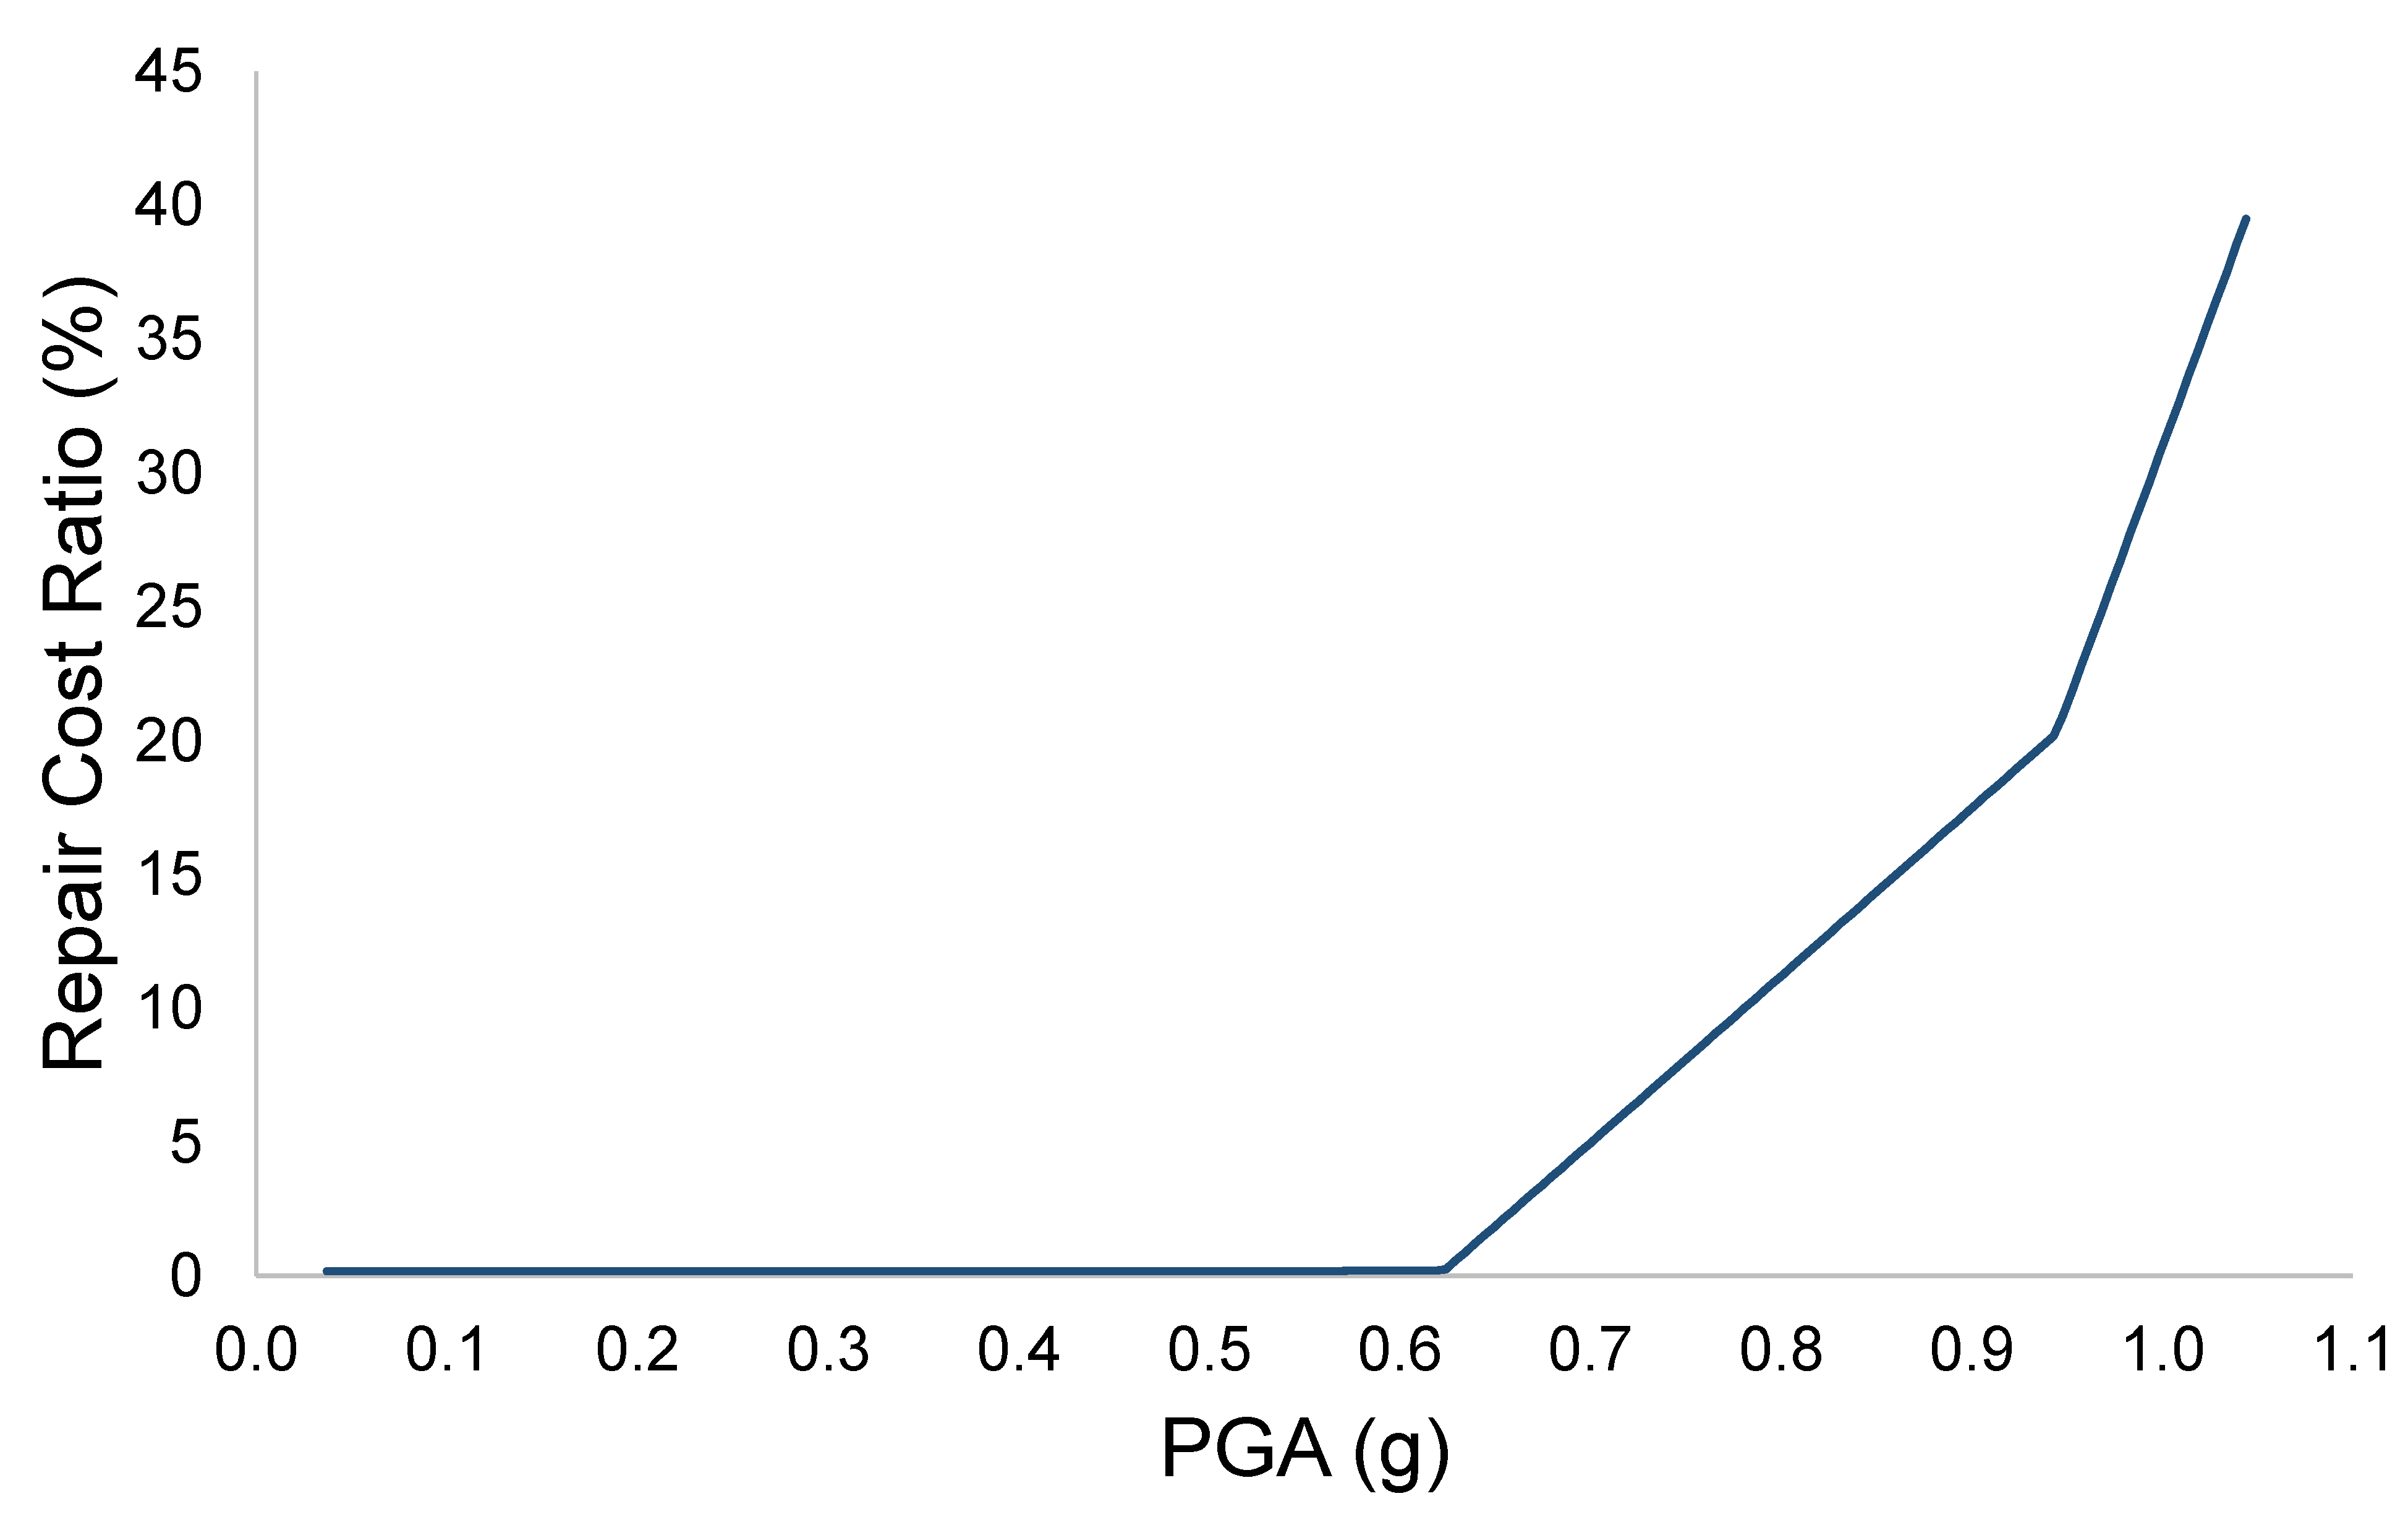
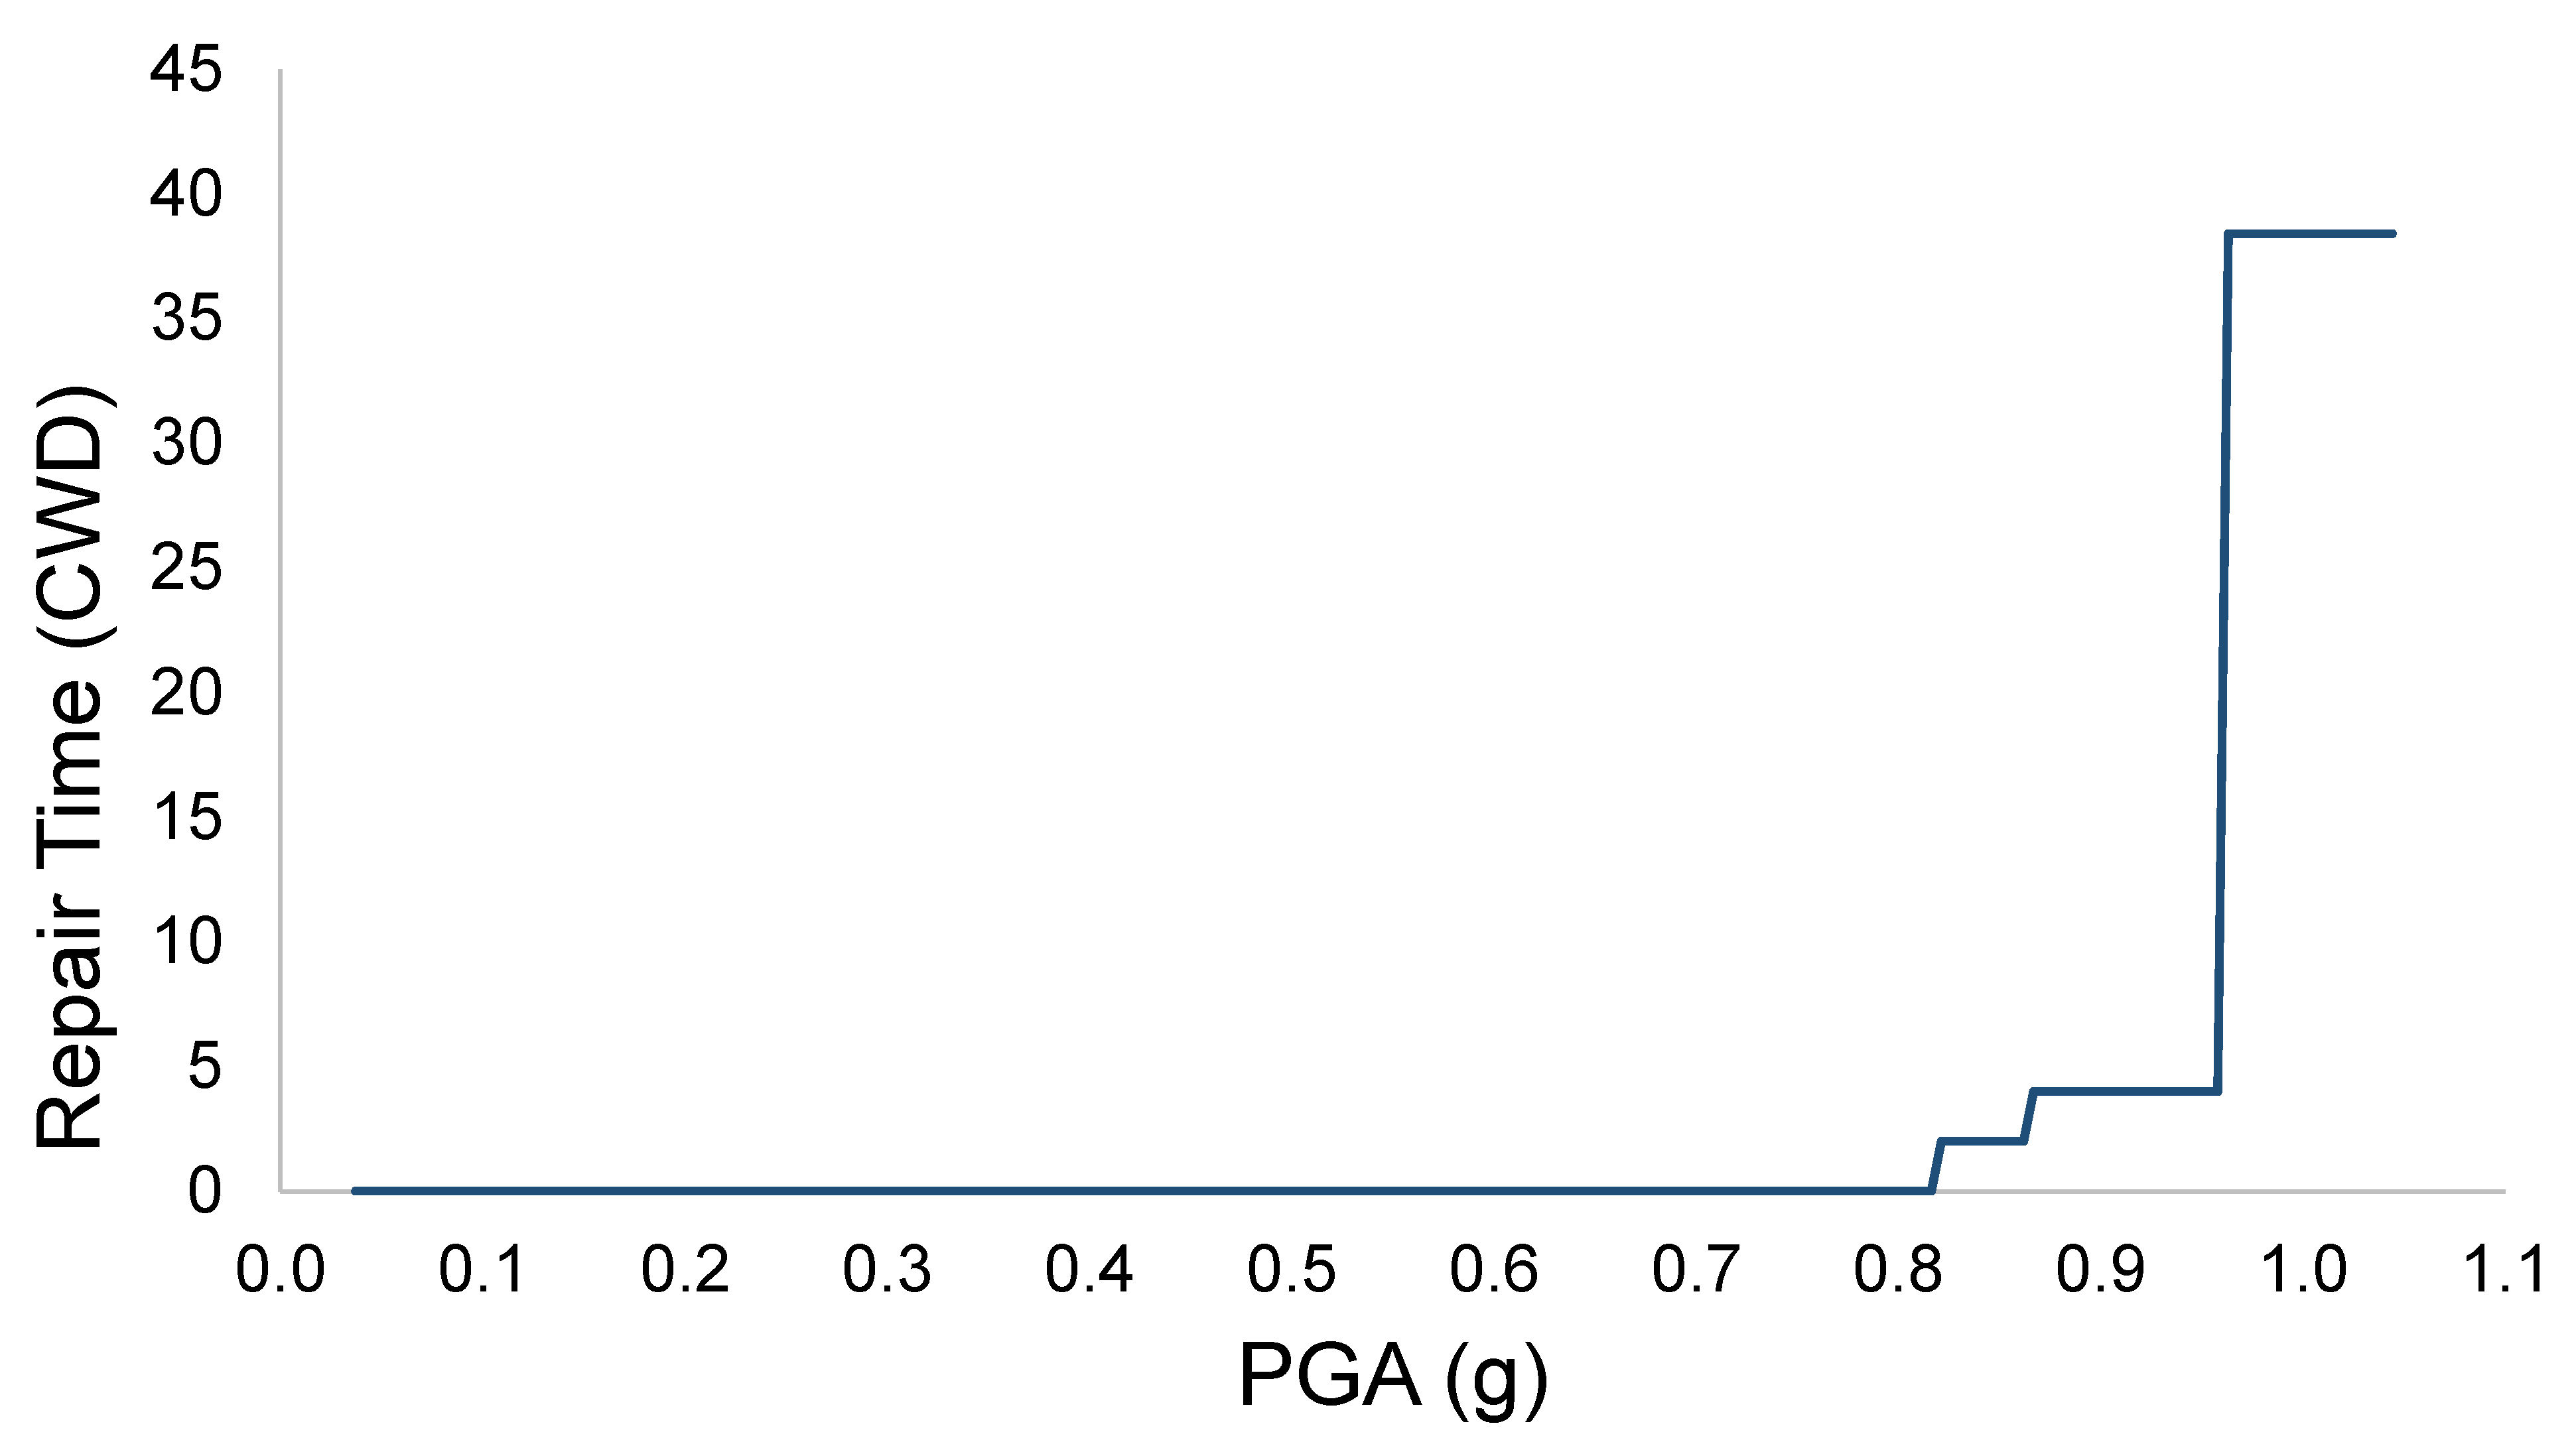
The results in terms of the repair cost ratio (RCR) and repair time (RT) are represented in Figure 4 and Figure 5. The results show that the bridge behaves with no damage at low intensities (PGA < 0.62 g), confirming that the bridge is seismic-resistant. After this level of intensity, the losses increase bilinearly (maximum value: 39.5% for PGA = 1.04 g). RT increases with different levels to 38.4 crew working days (CWDs). Direct losses (DL, unit: %) were calculated by considering the following:
D L = α R C R
where α = 1, assuming that DL corresponds to 100% RCR.
Indirect losses may be assessed using expert judgment to include the socioeconomic impacts on transportation infrastructures, and they are based on the extent of the damage to daily traffic or accessibility to critical facilities [39]. In this regard, ref. [32] suggested that the percentage of indirect losses to be considered is between 5% and 15%. In this paper, indirect losses were assessed by referring to [40], which proposed the consideration of two contributions.
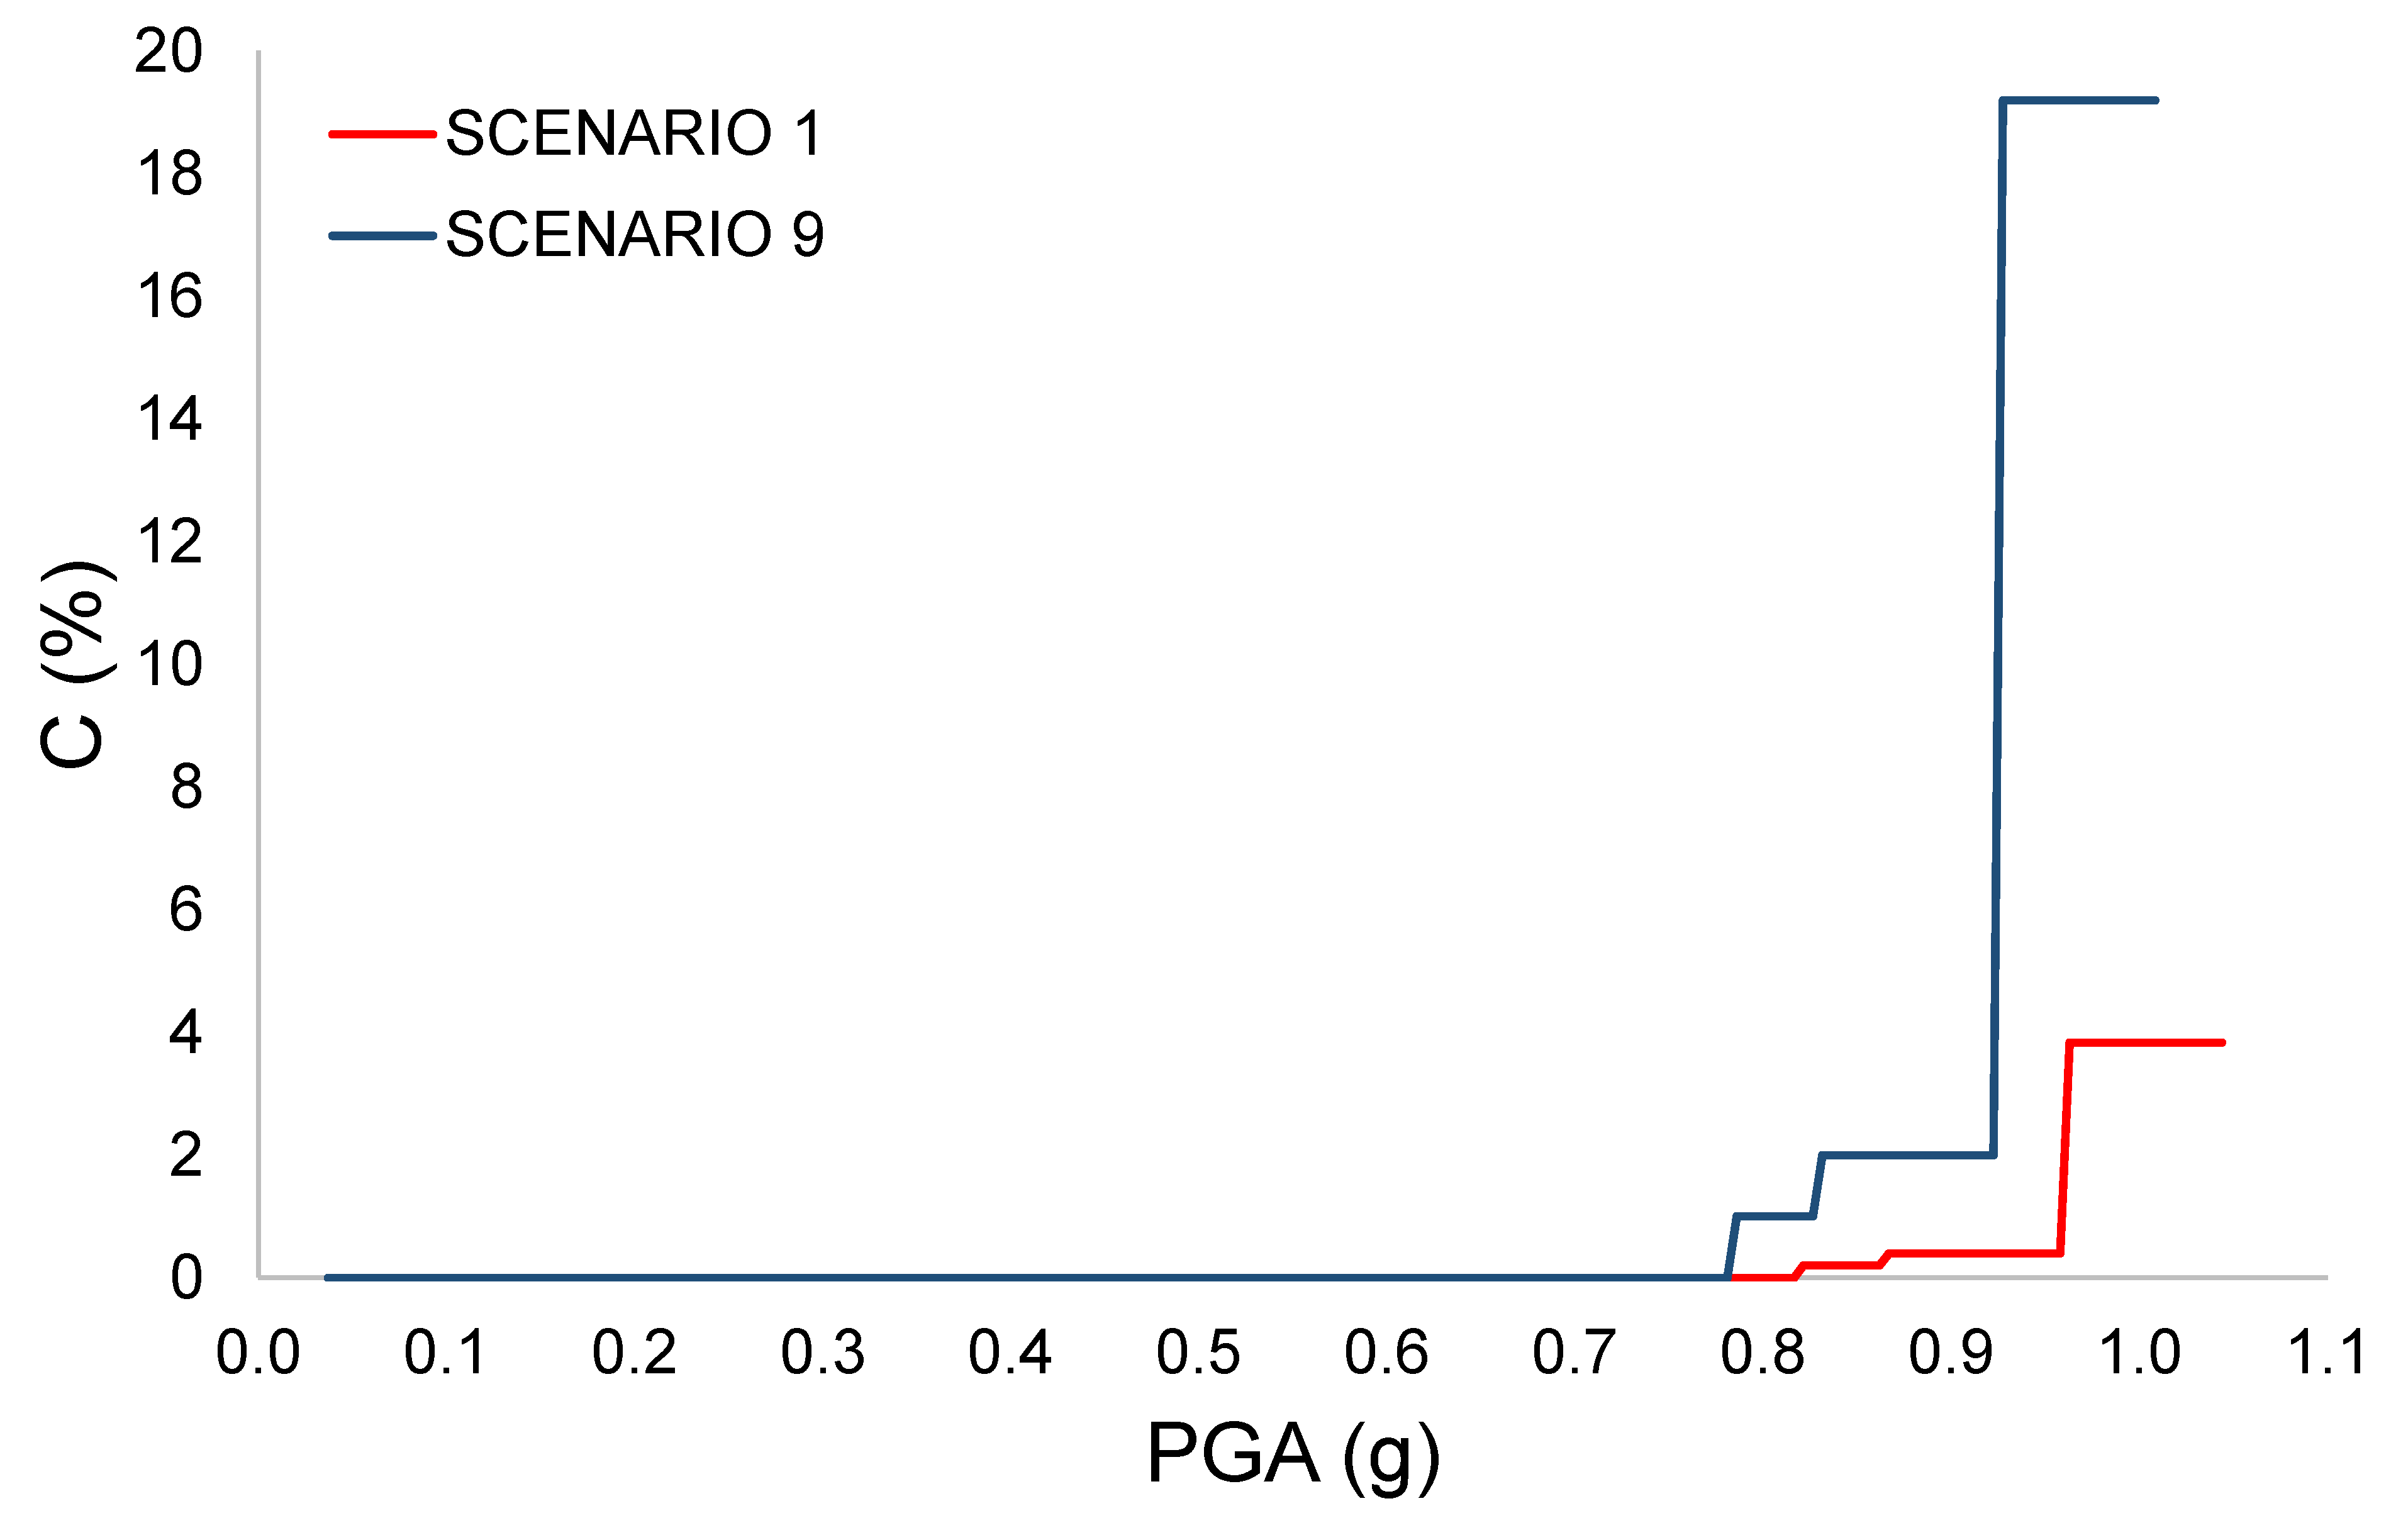
Connectivity losses (C, unit: %): these losses depend on the connectivity of the network where the bridge is inserted. Realistic values may be derived by statistical assessments, and herein, three different values of c were considered (0.10, 0.20 e 0.50) in order to study several scenarios.
C = cRT
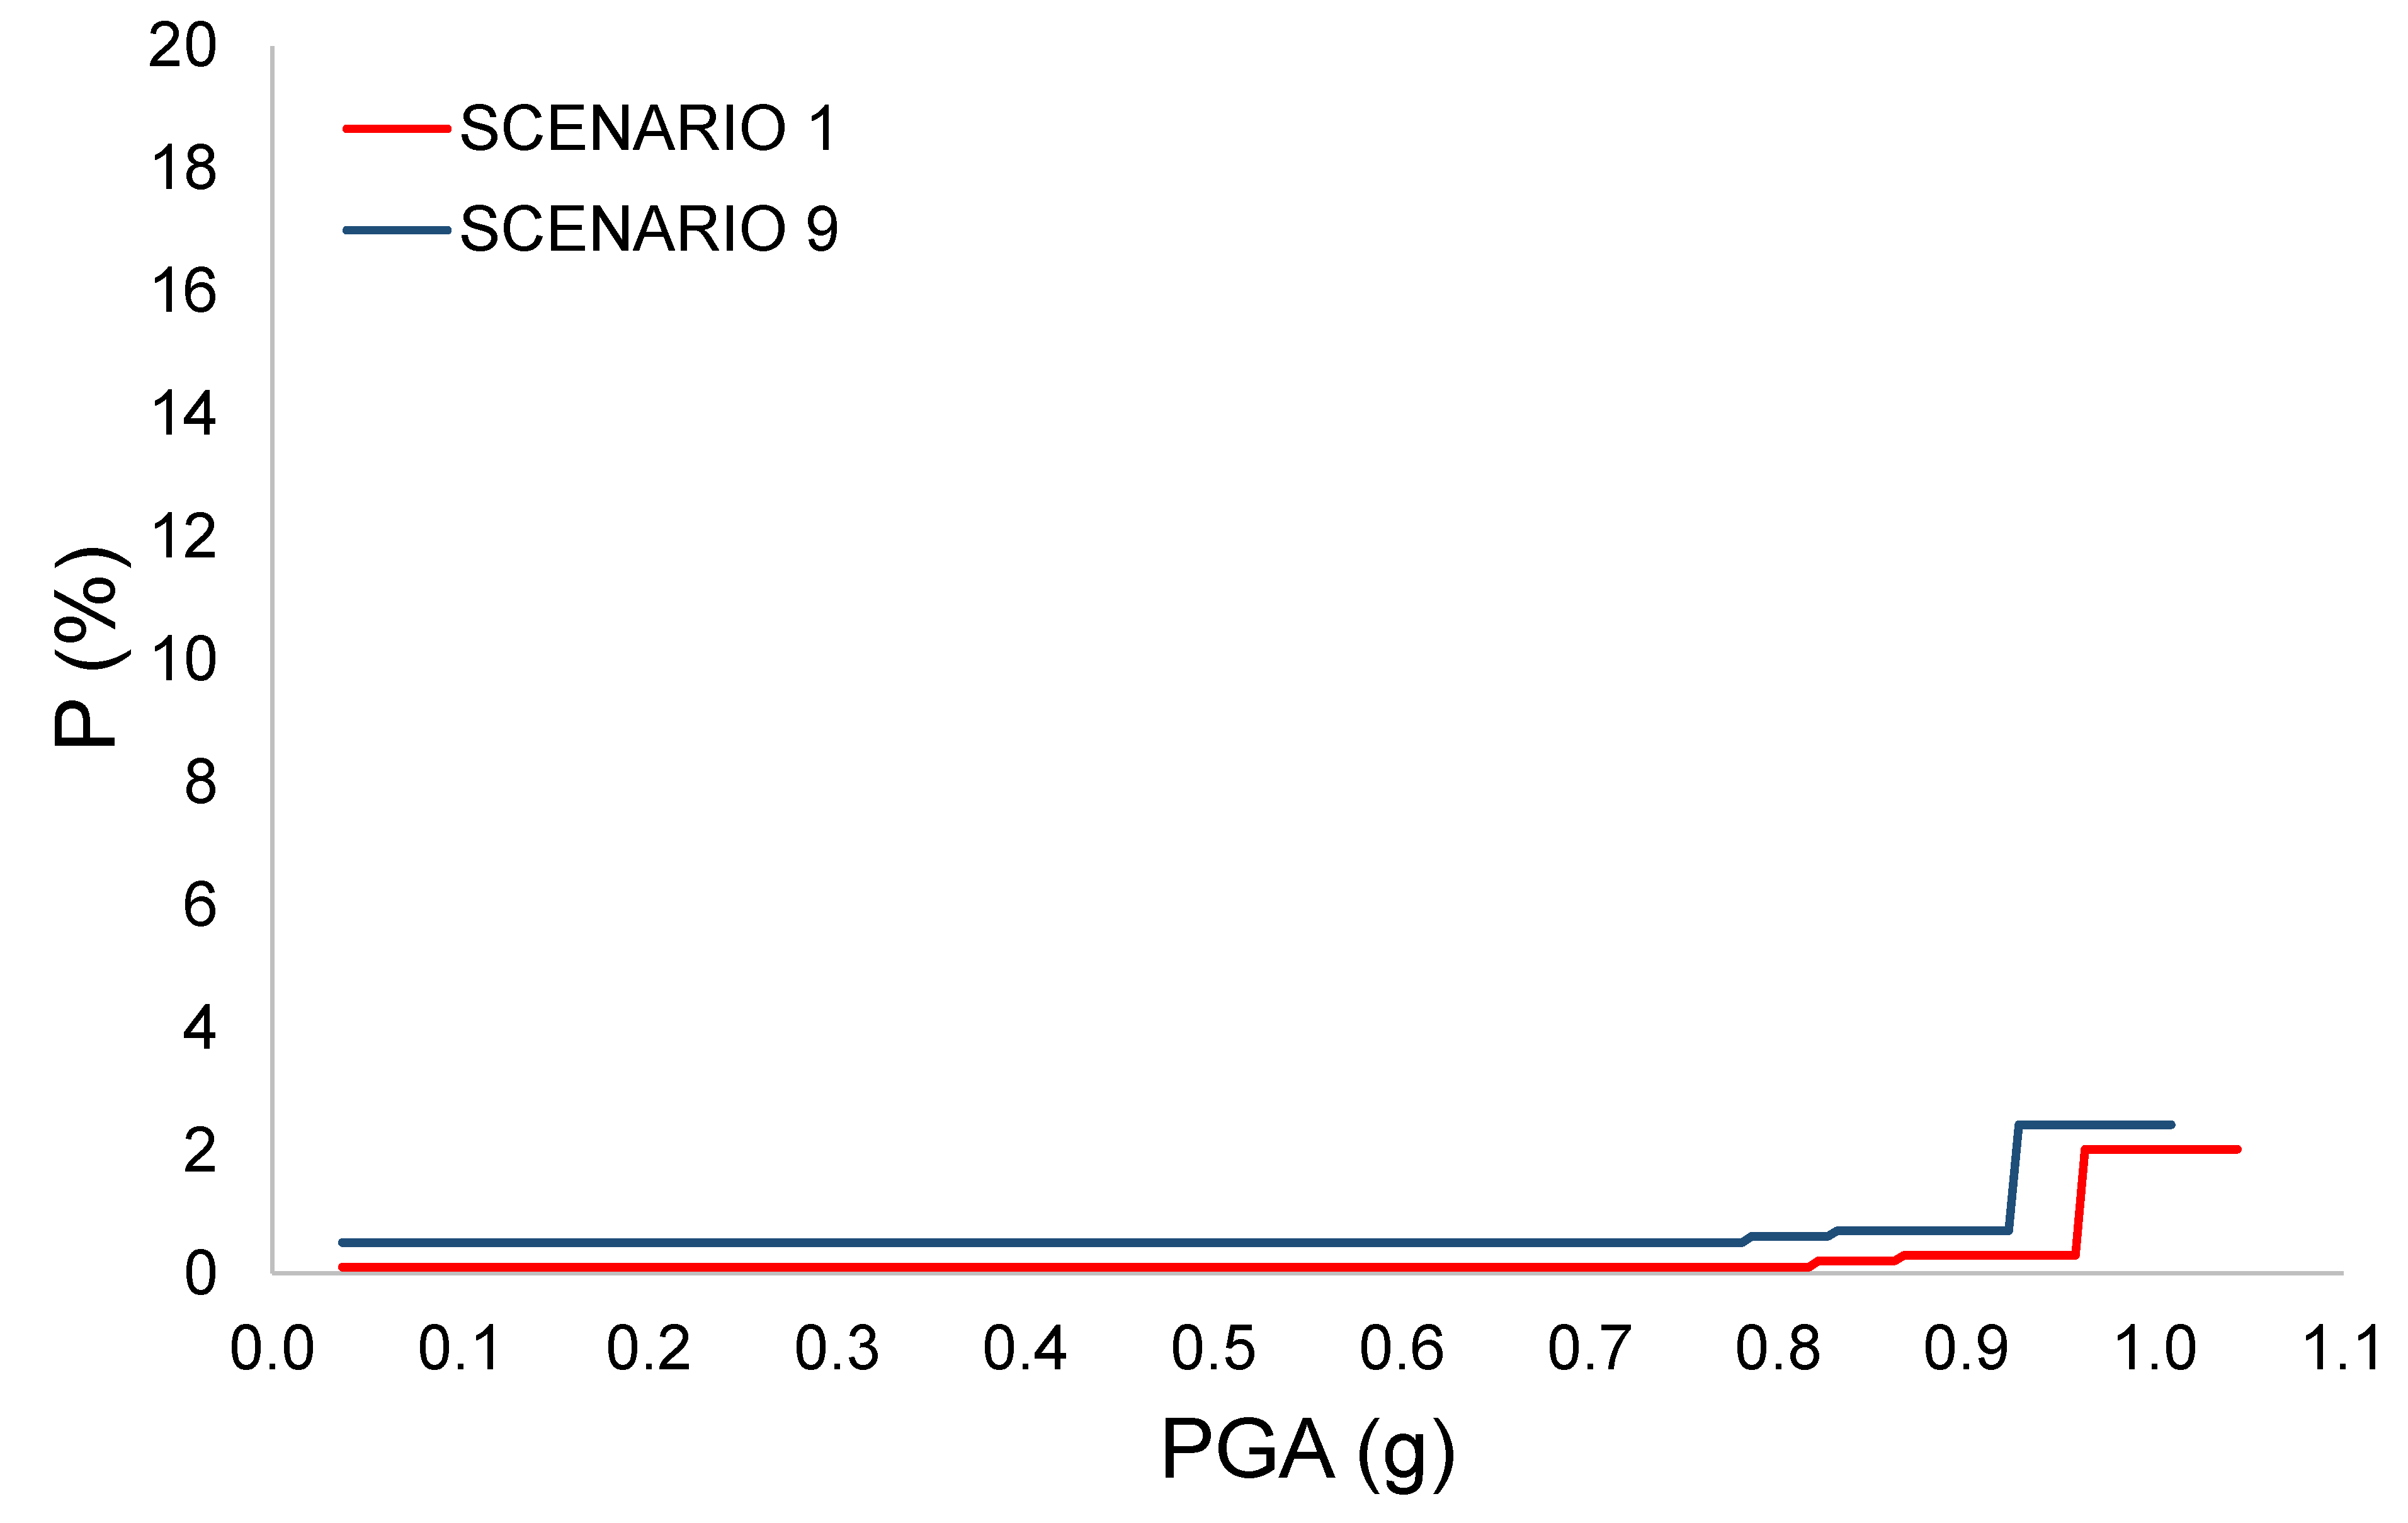
Prolongation time (P, unit: %): this parameter models the increase in the travel time and costs due to the loss of functionality of the bridge and depends on the interdependency of the infrastructures. Herein, three parameters of p2 (0.10, 0.20, and 0.50) were considered, while the coefficient p1 was considered equal to 0.05.
P = p 1 RT + p 2
Table 1 shows the values of DL, C, and P, while Figure 6 and Figure 7 show C and P at different levels of PGA for scenarios 1 and 9, which are the most extreme cases. It is worth noting that the maximum value of the losses for PGA = 1.04 g. For scenario 1, the maximum values are 3.84% and 2.02%, respectively, for the connectivity losses and the prolongation time. For scenario 9, these values are 19.2% and 2.42%, respectively (more details in Table 1).

5. The Role of Delay Time

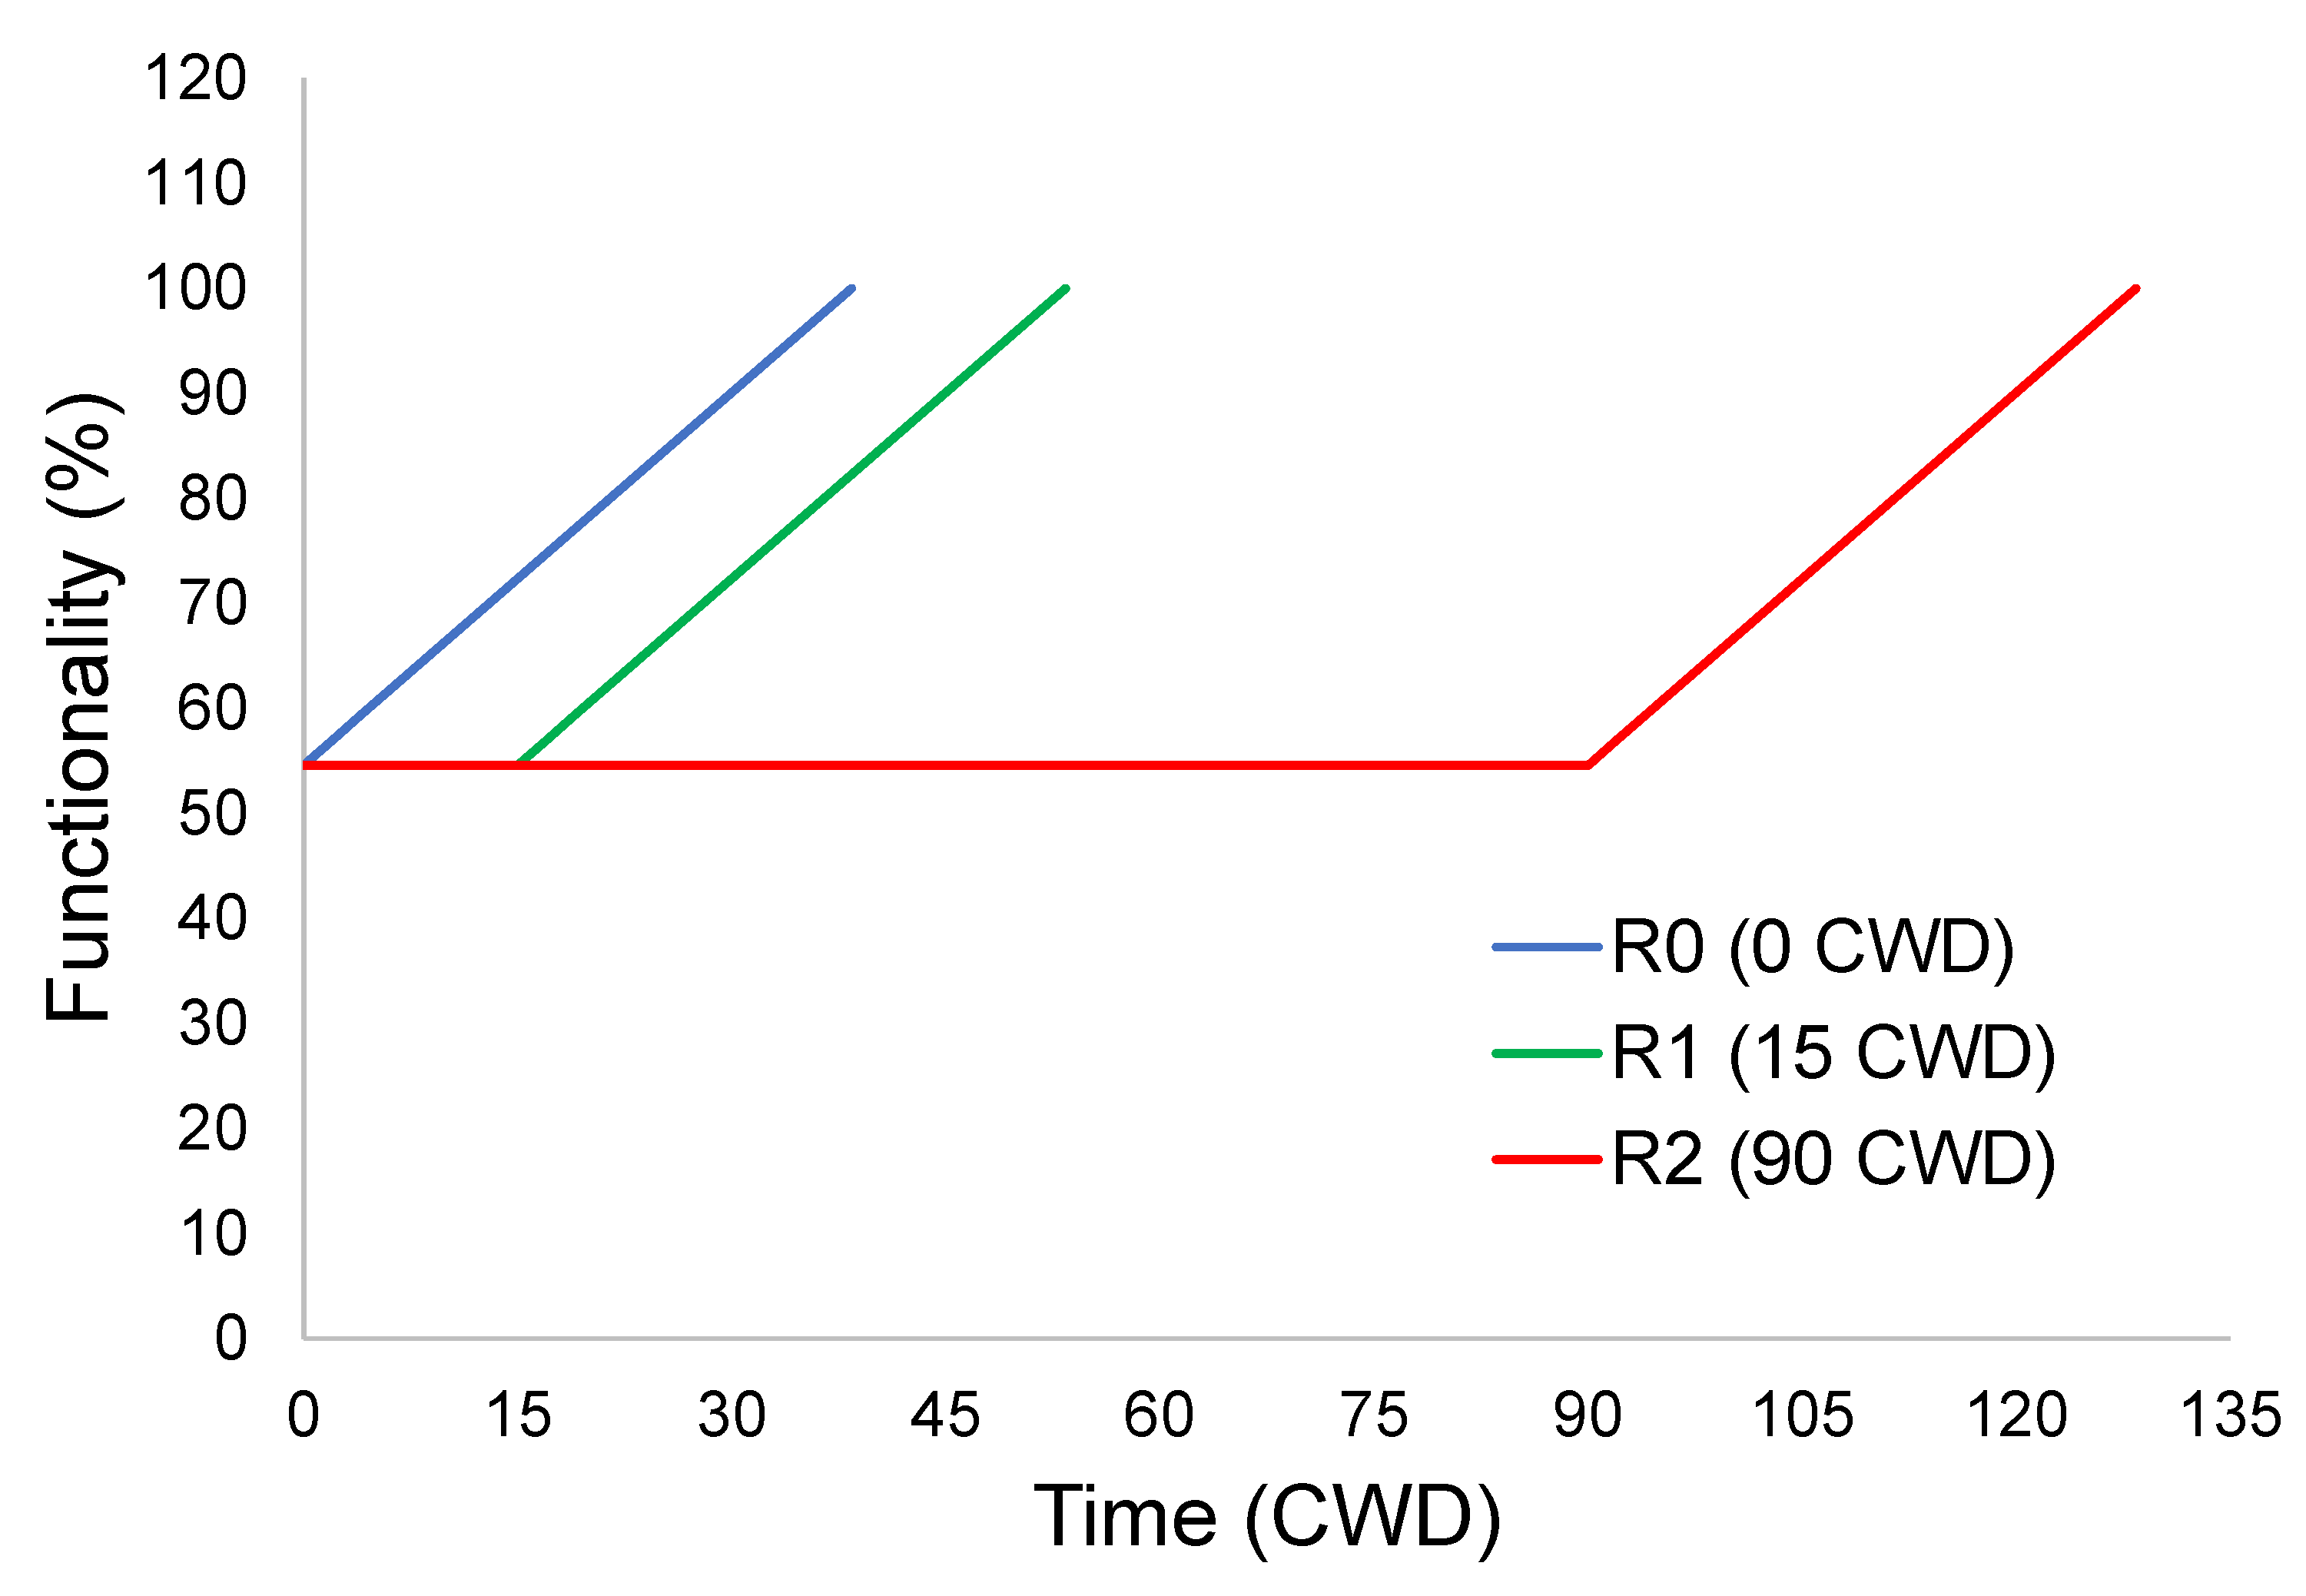
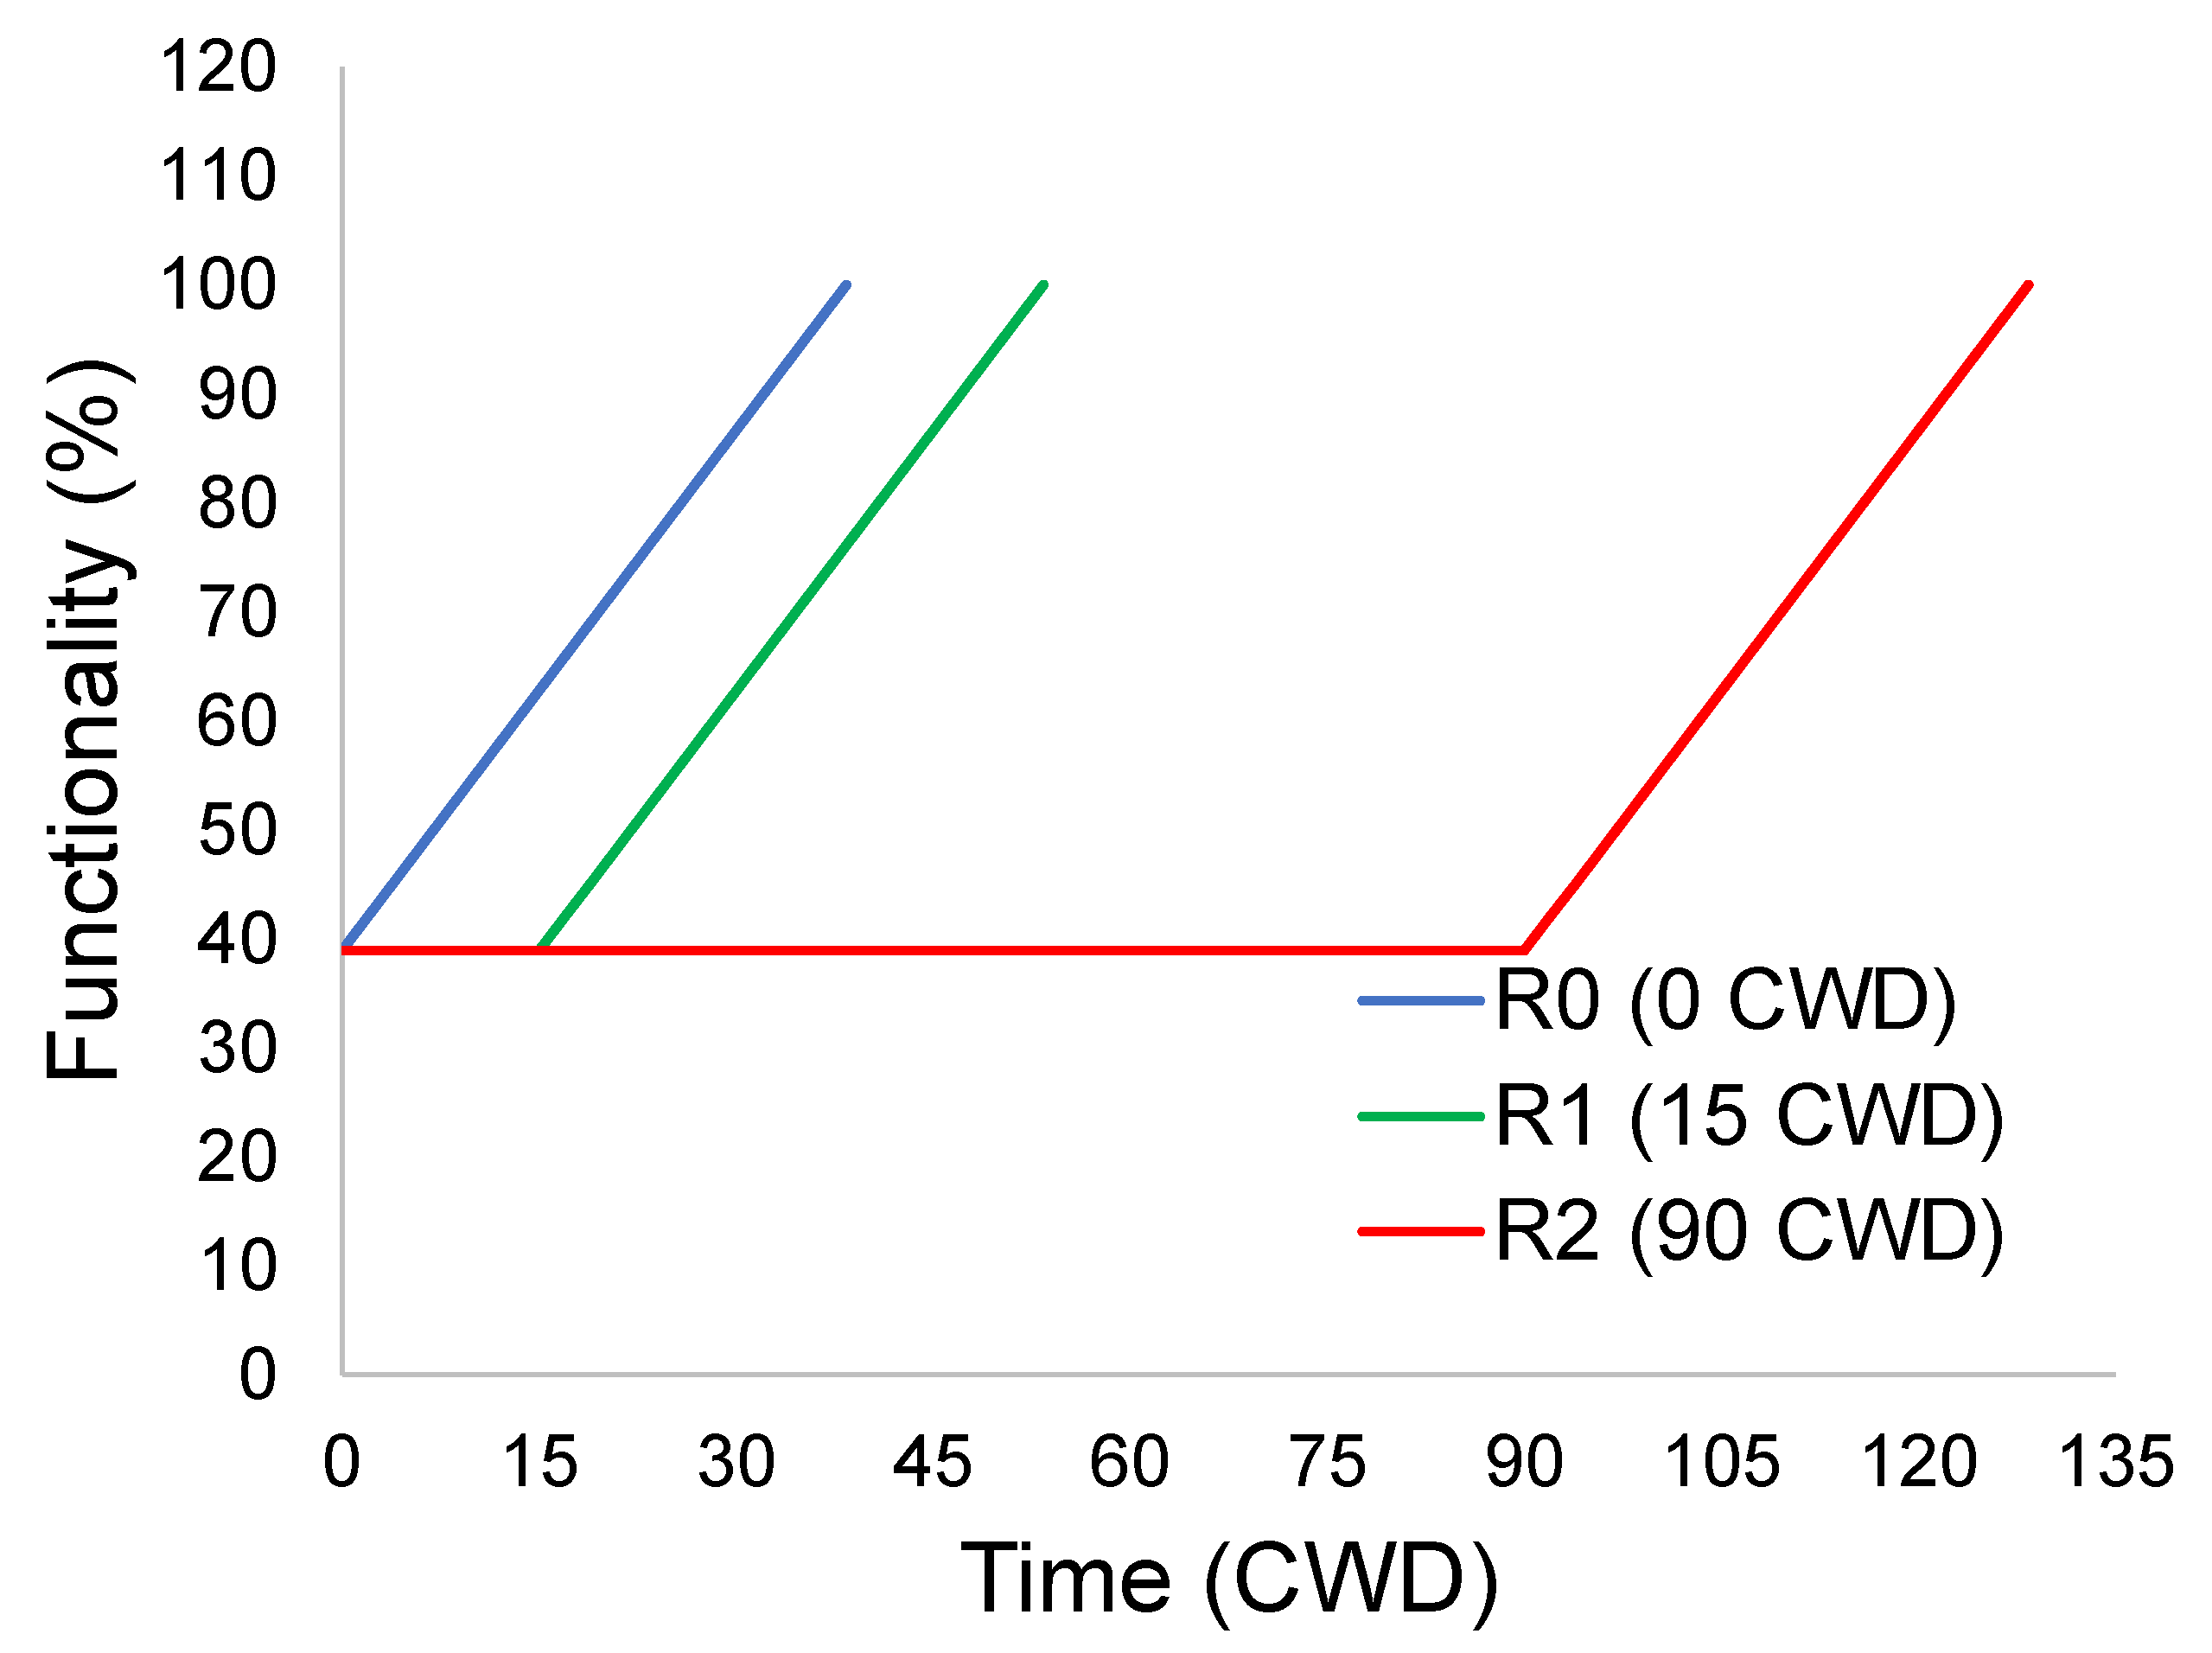
The delay time was considered herein by selecting three different values, R0 = 0, R1 = 15, and R2 = 90 CWD, in order to investigate its role in the reduction in the seismic resilience of the bridge. The applied values were assumed to investigate nine scenarios, for which three different delay times were evaluated (0, 15, and 90 days). Then, within these 27 cases, the possibility of partial, total, or improved recovery functionality (80%, 100%, and 110%) was assumed by considering a total of 81 scenarios. In particular, the functionality ratios were considered to evaluate three limit cases: a partial recovery of functionality equal to 80% (to represent an acceptable level at which the infrastructure might still be operative), a total recovery of functionality (100%), and a possible improved recovery equal to 110% (that may represent the possibility of new investments).
Figure 8 and Figure 9 show the recovery model for the two extreme scenarios, 1 and 9, for three values of the delay time (R0: blue, R1: green, and R2: red). The recovery function was considered with different functionality ratios (80%, 100% and 110%). It is worth noting that the reduction in functionality was due to the increase in indirect losses (scenario 9) when compared with scenario 1 (compare with Table 1). The rates of increase in the functionality were different between the two scenarios. They were similar among the same scenarios because the delay time was assumed not to modify the rate of the recovery.
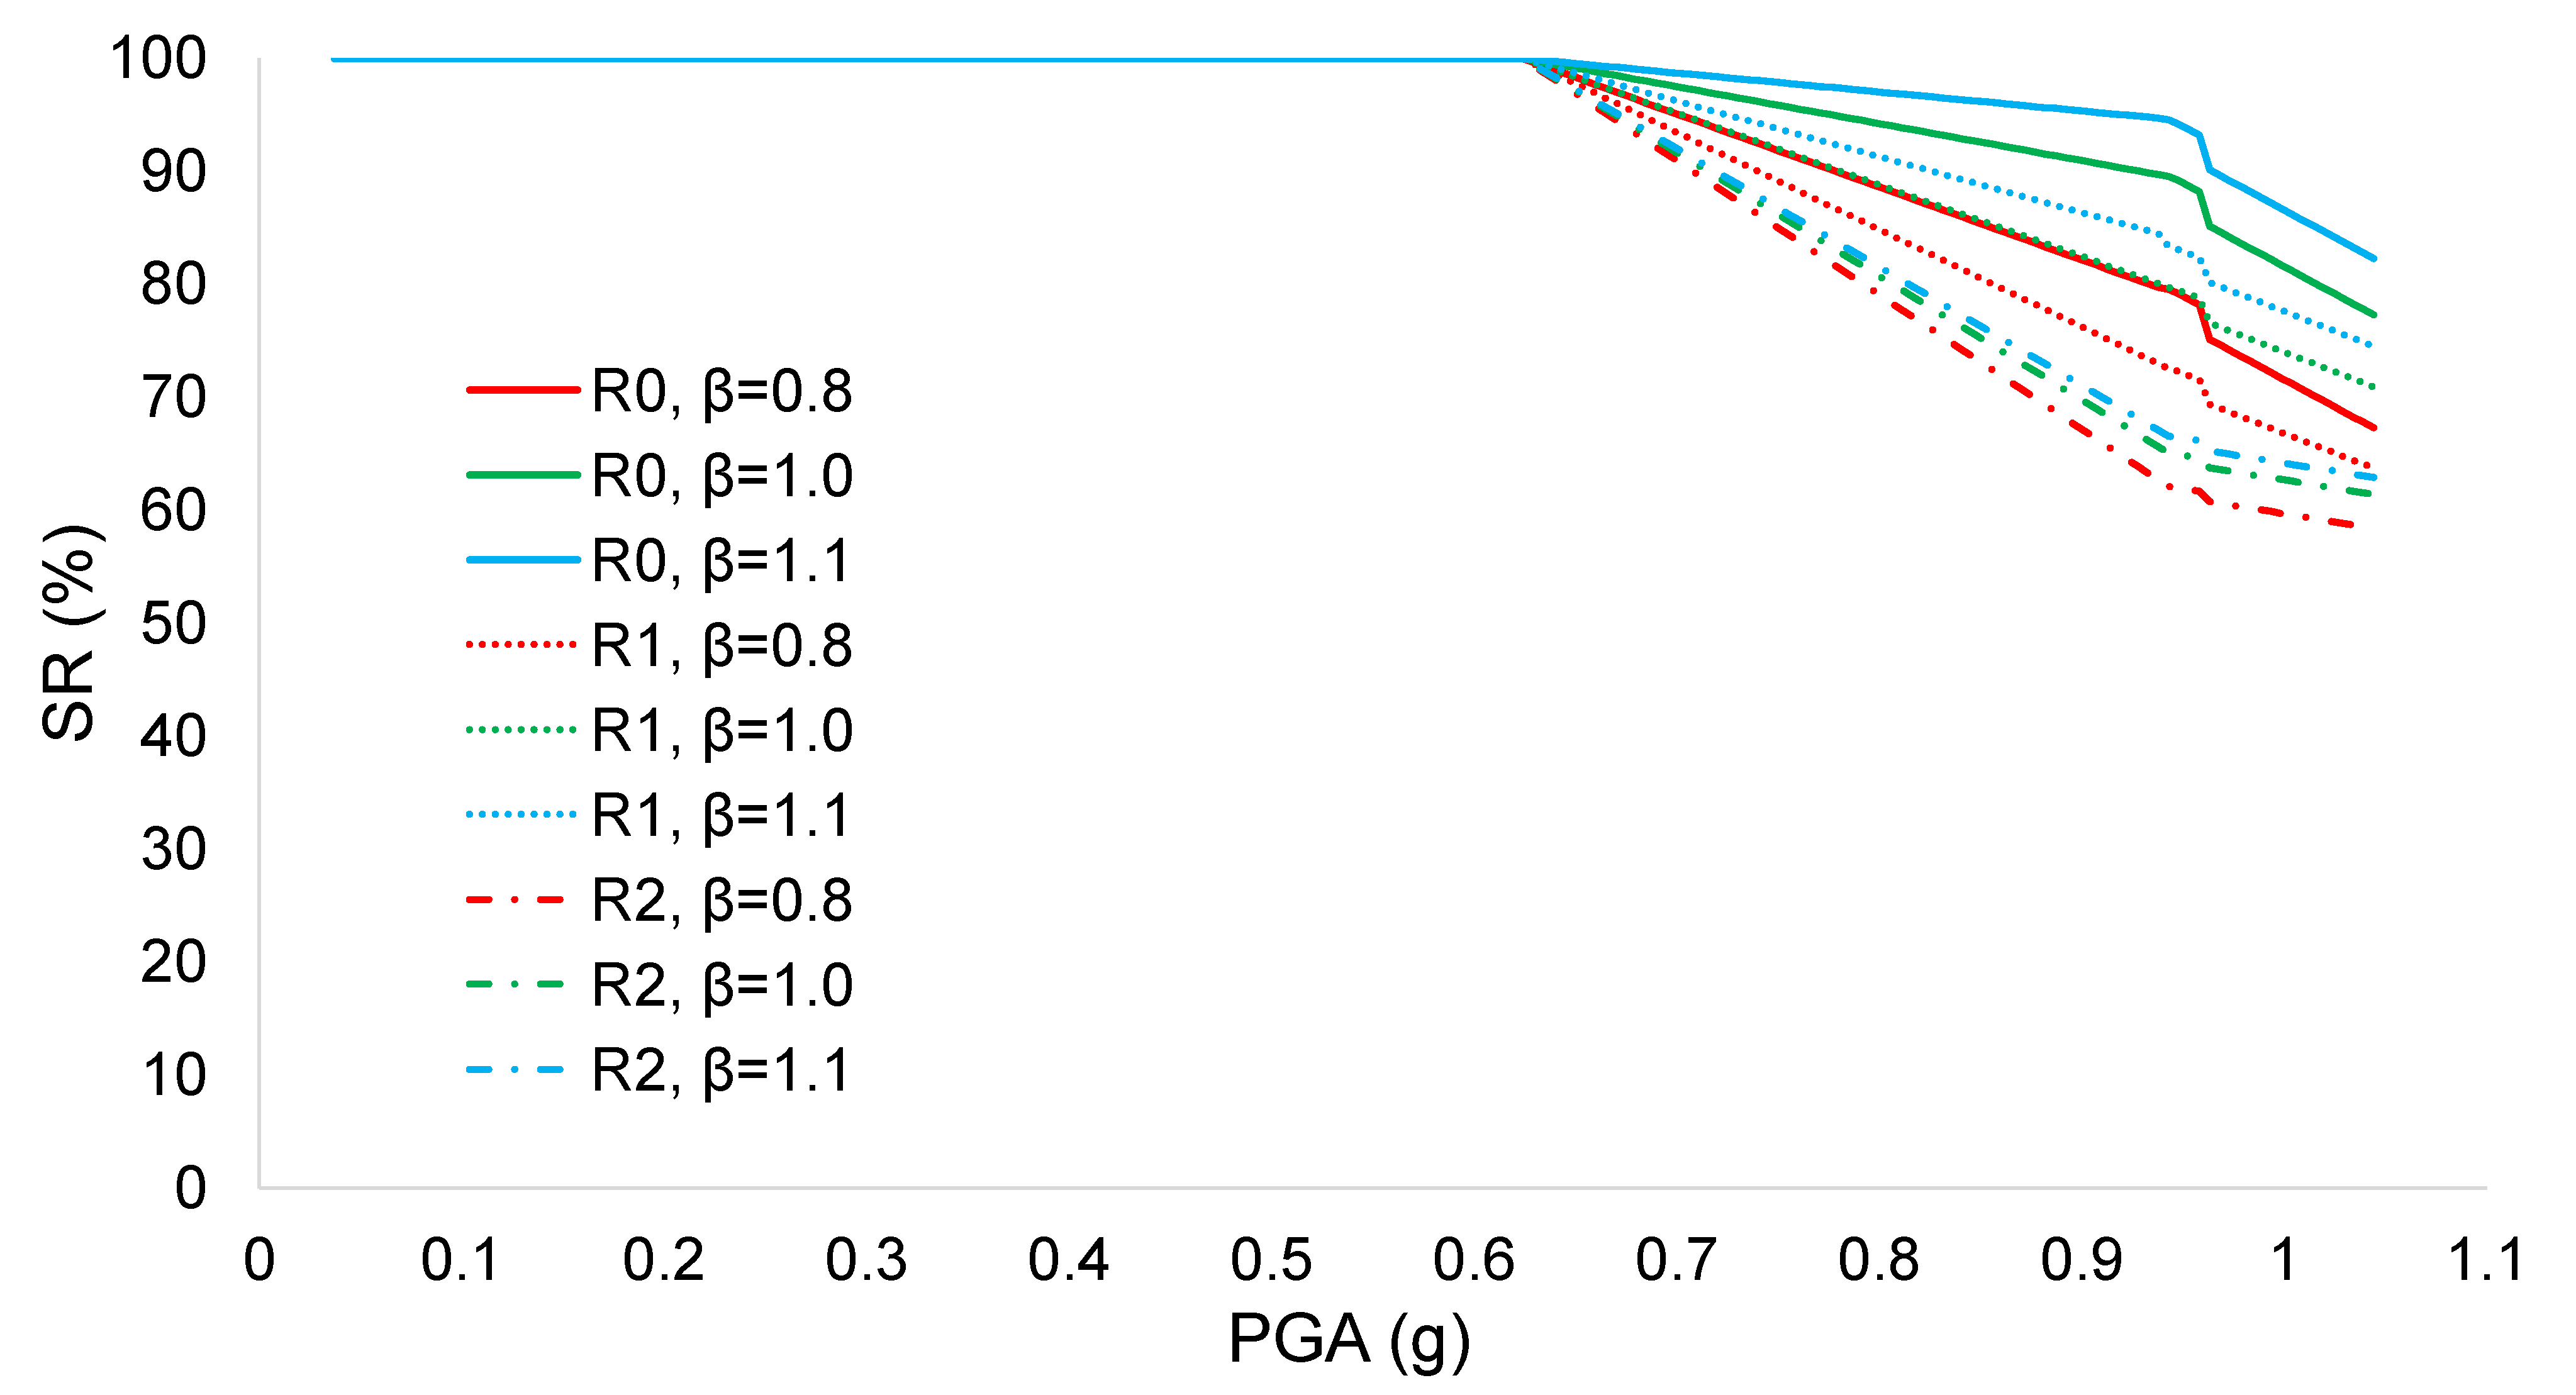
Then, seismic resilience (SR) was calculated for all 81 cases. In order to investigate the role of delay time, a comparison between the various results for scenario 1 (R0 and β = 1.1) is displayed in Figure 10, showing the 9 cases obtained by setting one of the two parameters (R and β) as constant and varying the other. It is worth noting that the maximum value was found to be SR = 82.32. The values were calculated for every case, and the minimum value was obtained for scenario 9 (R2 and β = 0.8): SR = 45.03, as shown in Table 2. Among these values, the difference was 82.8%, demonstrating the importance of the delay time in the assessment of SR. It is also worth noting that SR remains 100% for low intensities (PGA < 0.60 g), demonstrating that the bridge has earthquake-resisting resources. This depends on the fact that at low intensities, RCRs are zero (Figure 4).
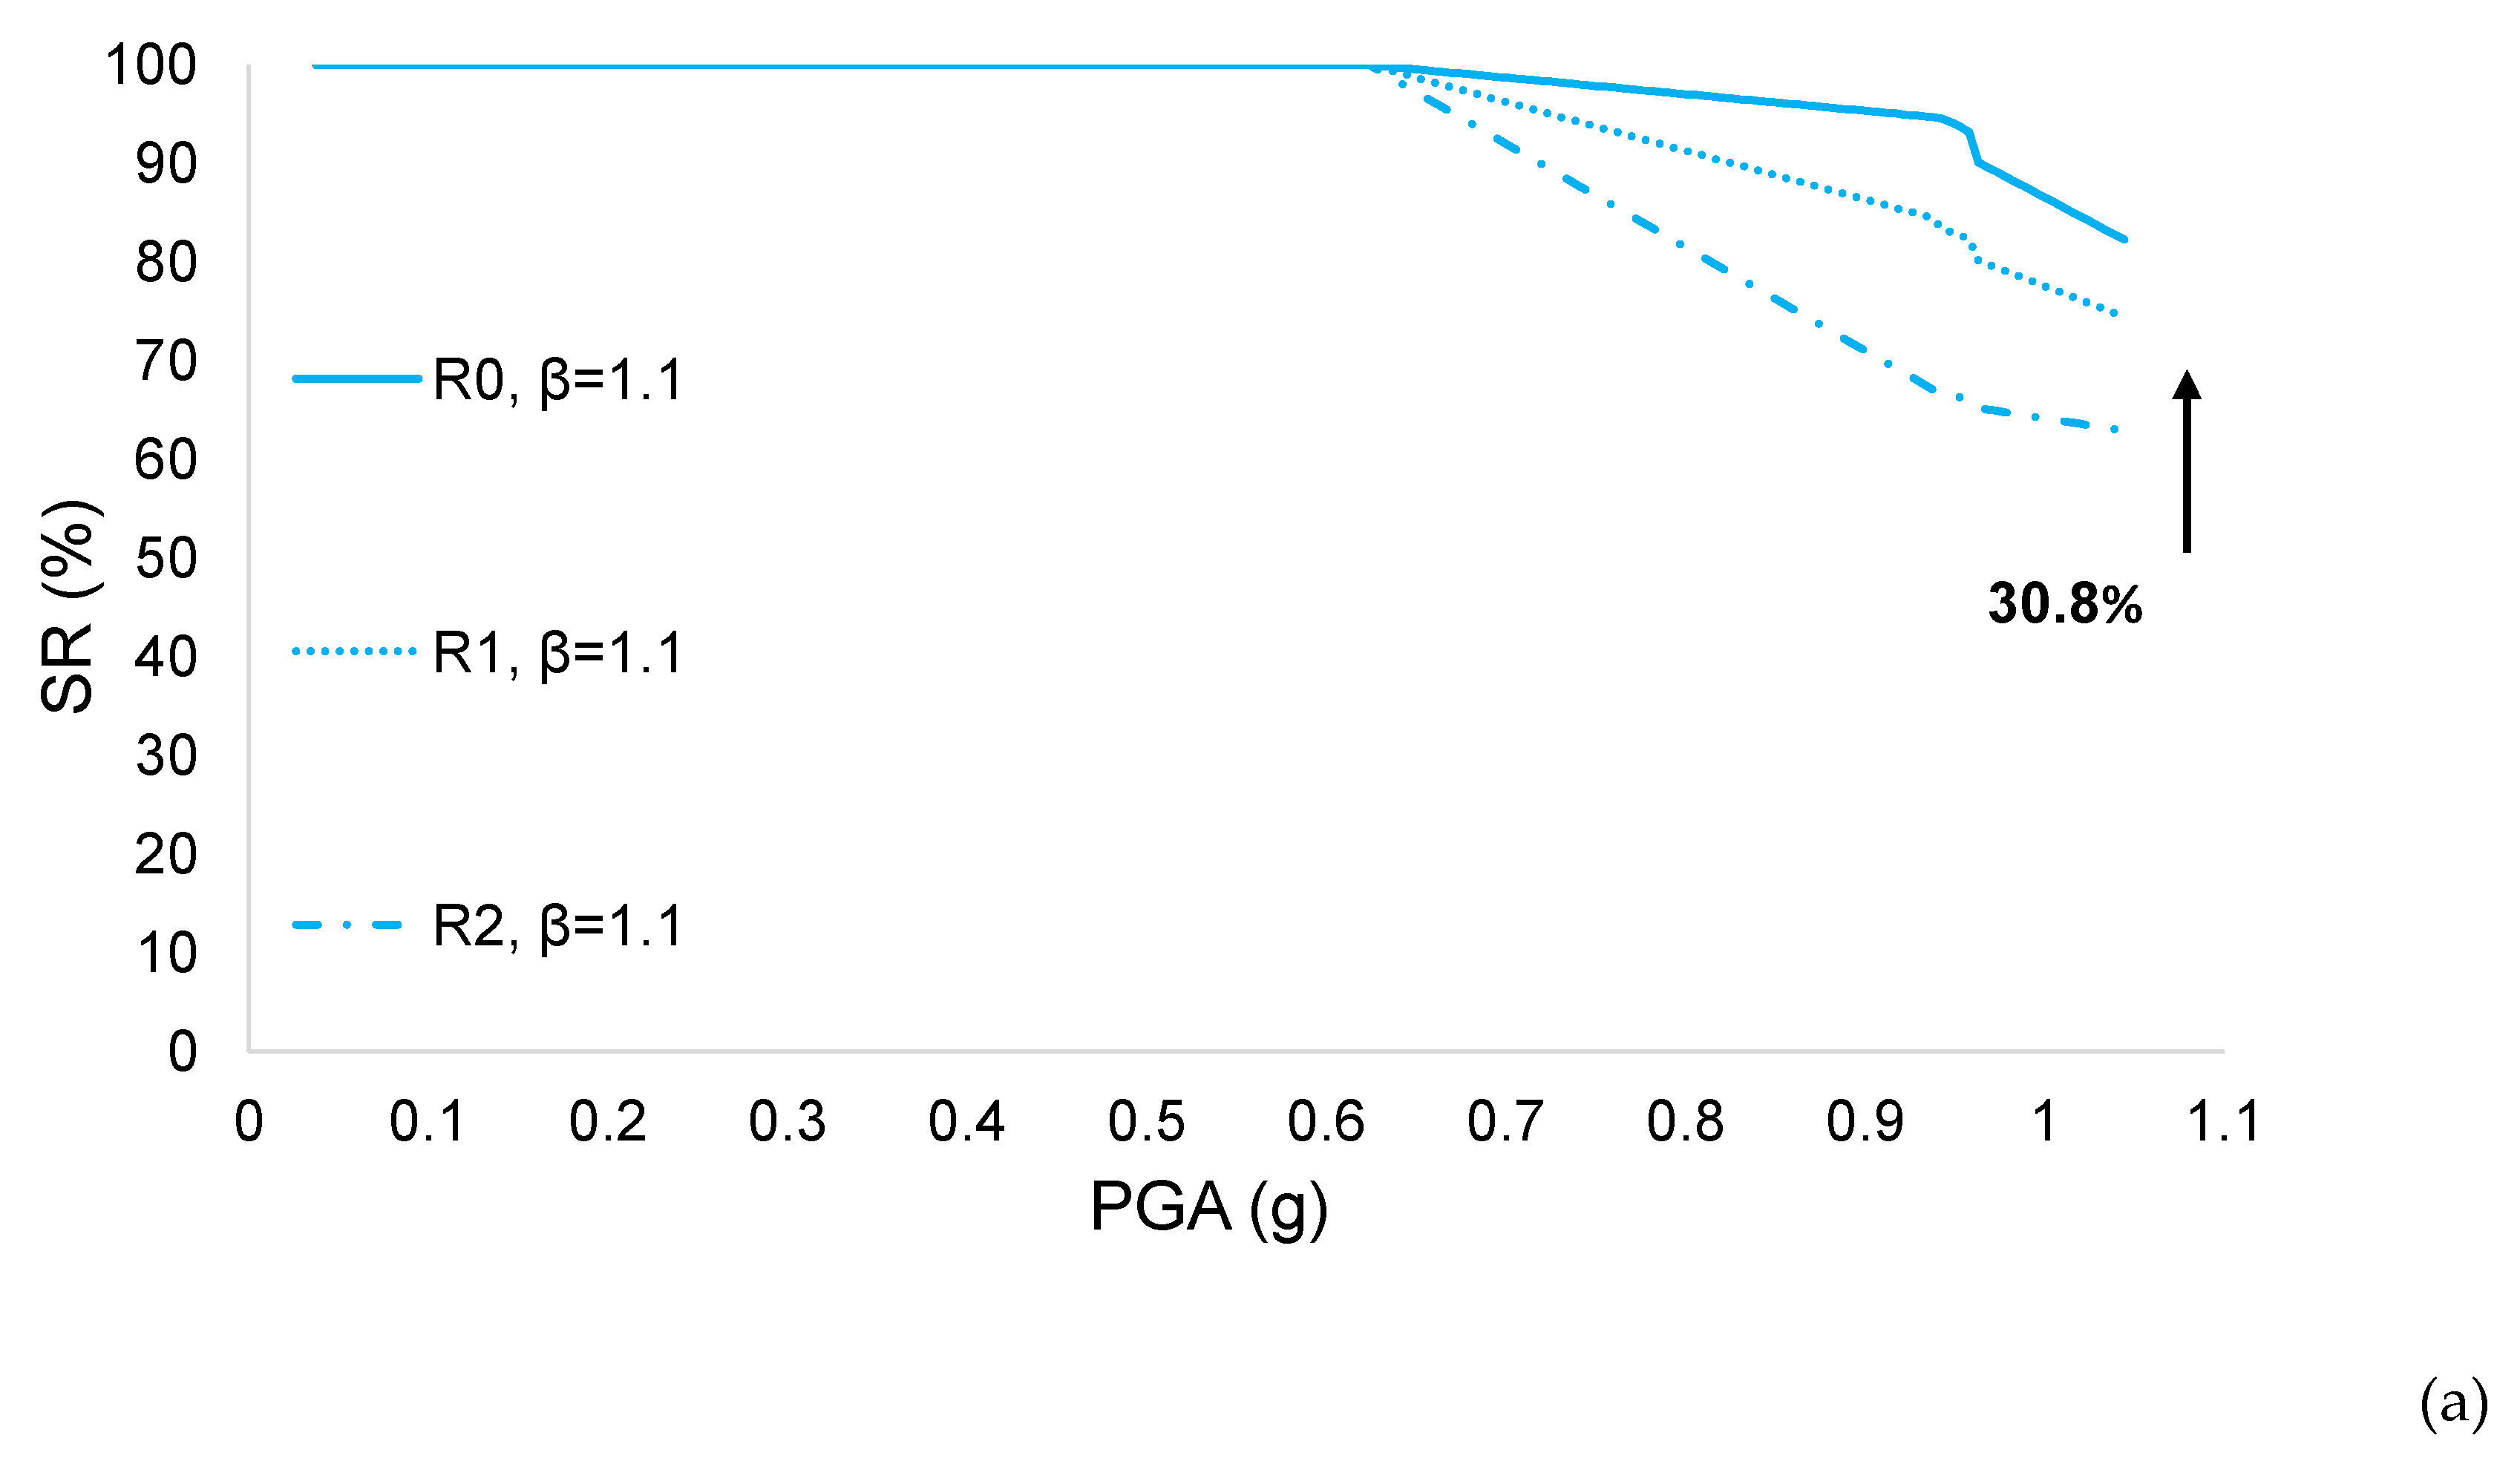
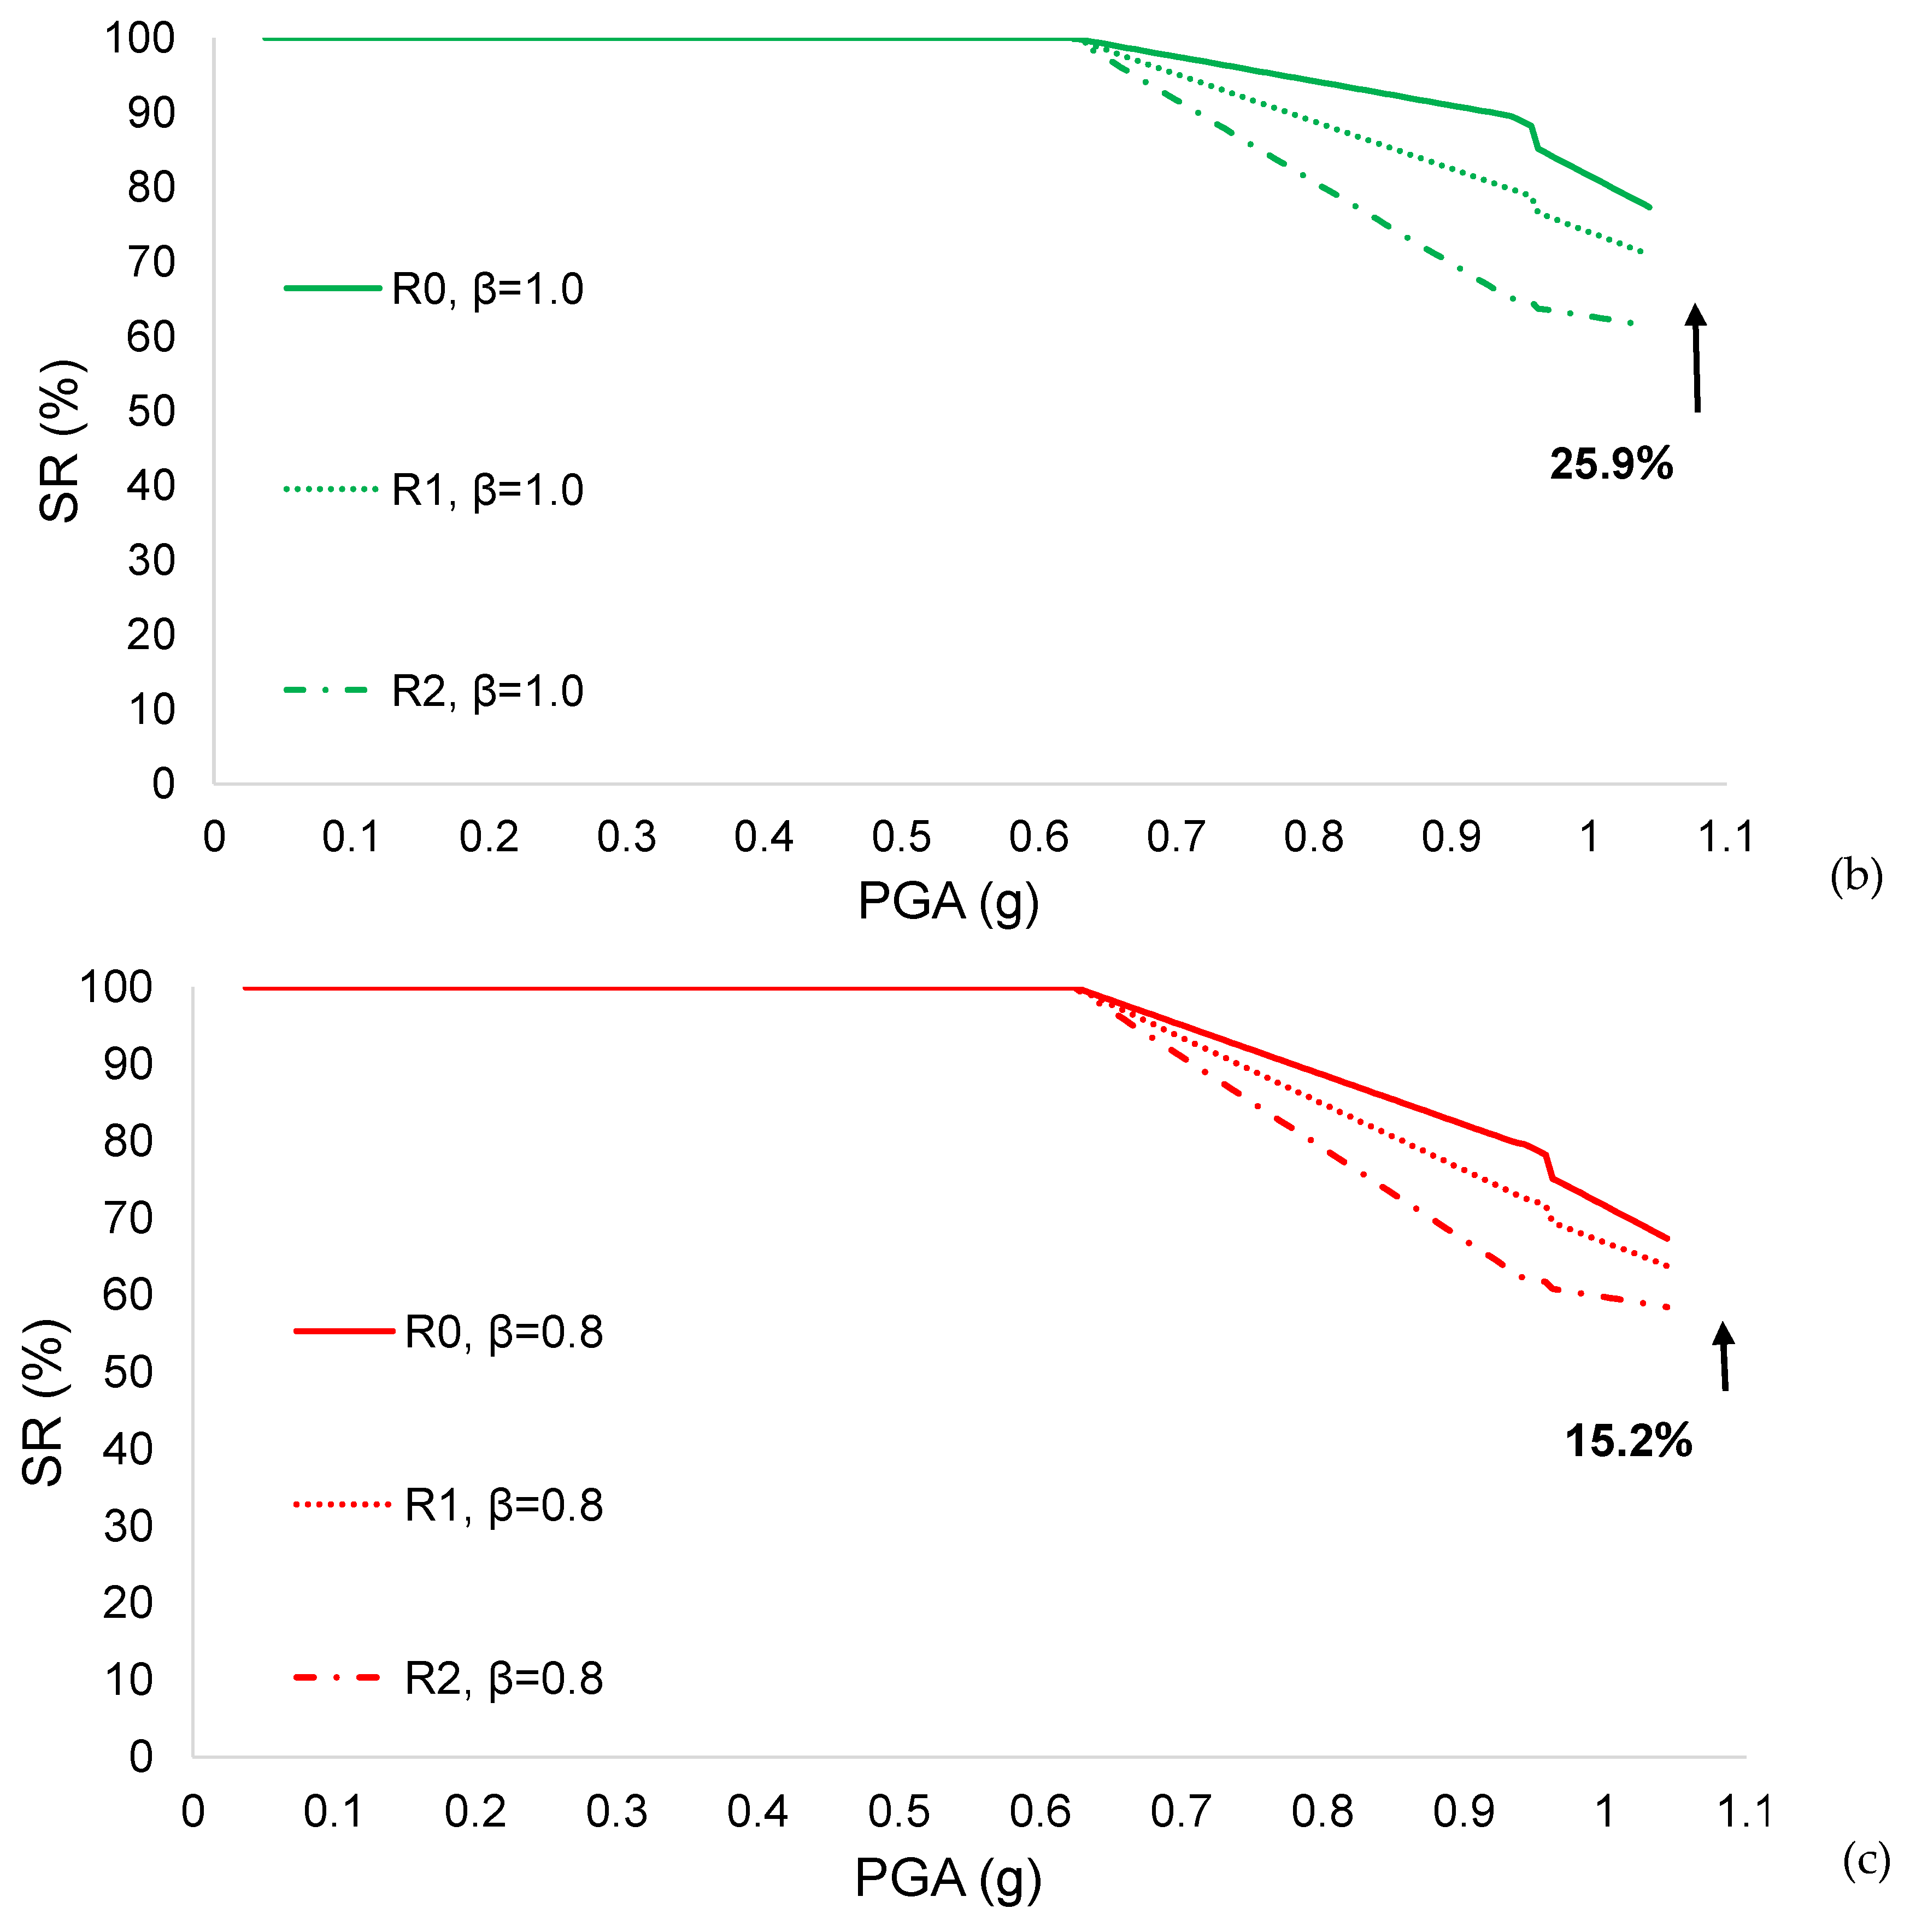
Two parametric studies are shown in Figure 11 and Figure 12 for scenario 1. In Figure 11, the delay time was varied for the three values of β in order to make a comparison between the various values of the delay time (0, 15, and 90 days). It is worth noting that SR decreases significantly when the delay time increases. For example, for scenario 1, the values of SR are 62.92 and 82.32 for the delay times of 90 days and 0 days, respectively. The reductions (30.8%, 25.9%, and 15.2% for the cases of β = 1.1, β = 1, and β = 0.8) depend on β, demonstrating that the delay time is more critical for higher functionality ratios (β = 1.1), or in other words, in the case of improvements to the bridge.
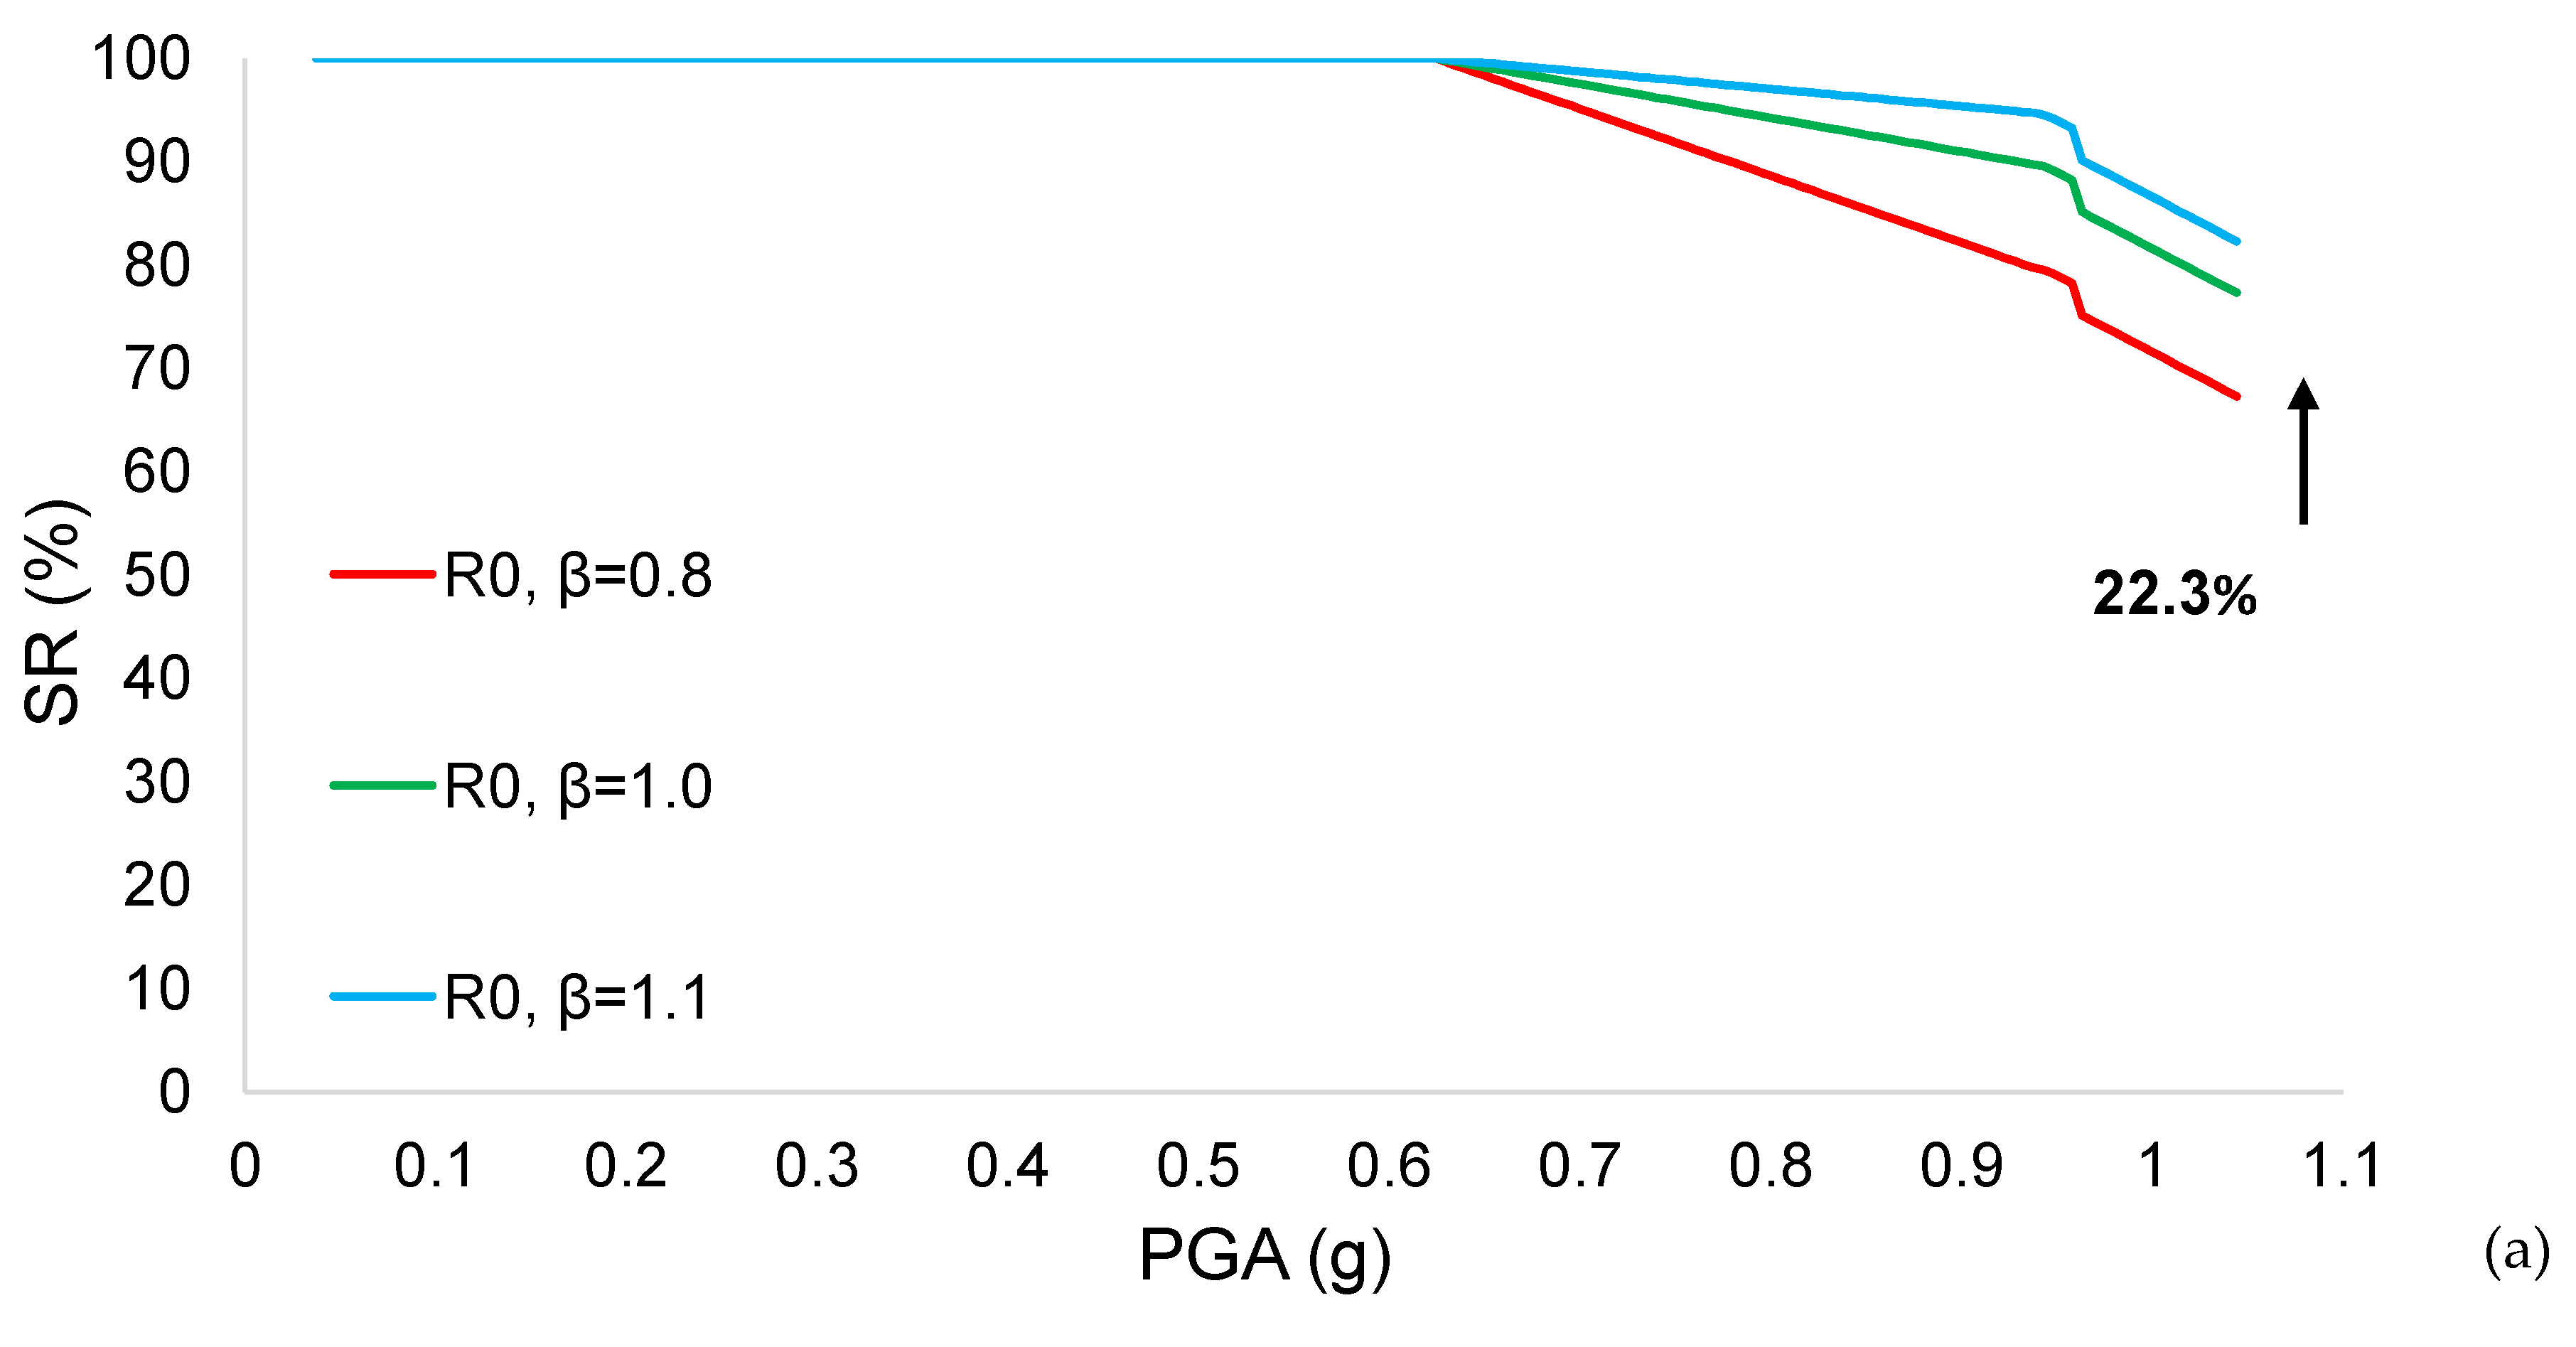
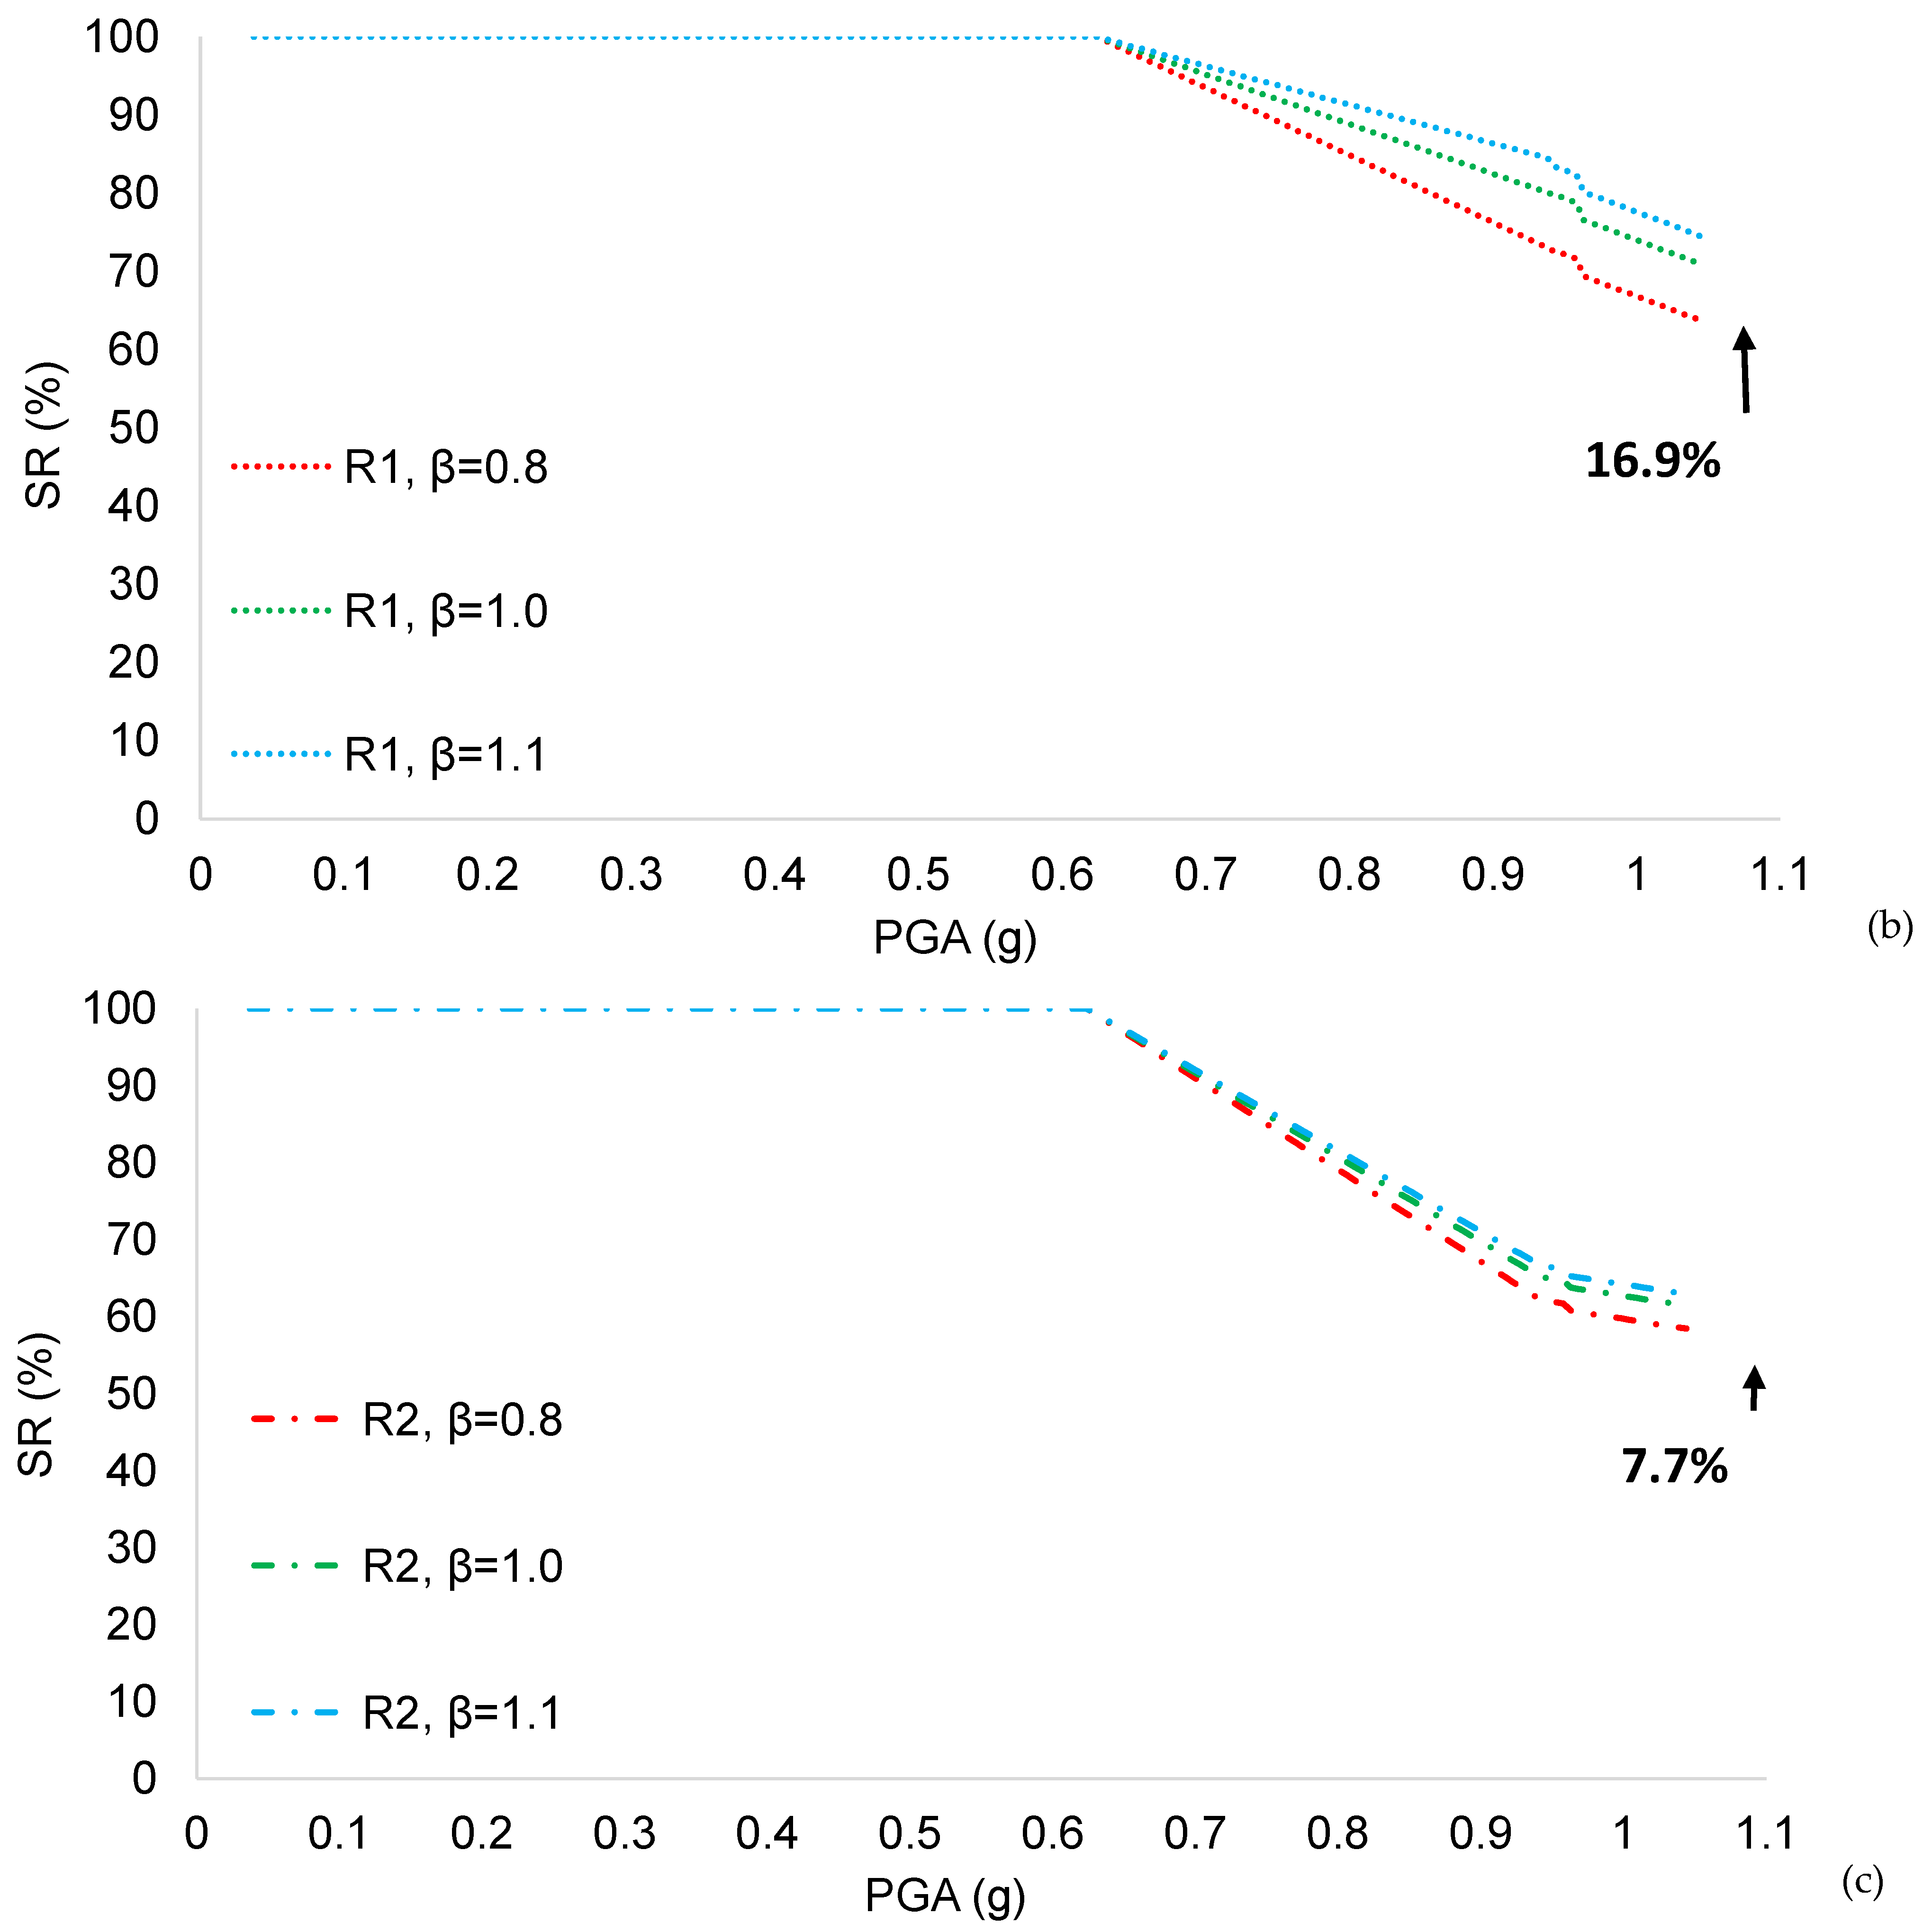
Figure 12 shows the comparison among the results for different functionality ratios (β = 0.8, β = 1, and β = 1.1). It is worth noting that when comparing the cases of improved functionality (β = 1.1) with the case of reduced functionality (β = 0.8) for zero delay time, the increment of SR is 22.3%, while this increment is 16.9% and 7.7% for 15 and 90 days, respectively.
These results may help decision makers to evaluate the best choices among several solutions during pre-earthquake or post-earthquake preliminary assessments of the role of delay time on the seismic resilience of bridges. Several interesting findings have been deduced. First of all, it is important to investigate the causes of the delay time (i.e., lack of economic funds, and/or technical skills and human resources, difficulties due to the locations, etc.) in order to reduce it and, thus, improve the seismic resilience of the system. The results also demonstrated that when the delay time cannot be reduced, the investments in improvements to the bridge are less beneficial than in those cases with small values of delay time. Moreover, the cases of no delay time showed that the immediate recovery of the bridge may be considered an ideal reference for effective and rapid recovery processes. Finally, it is worth noting that these results were obtained with linear recovery functions, and thus, the implementation of different recovery curves is necessary.

6. Conclusions

This paper proposes the investigation of the delay time in the seismic resilience of a bridge case study. The repair costs and the repair time were calculated on the basis of the PBEE methodology in order to assess the seismic resilience of the bridge. Several scenarios were considered, and 81 cases were analyzed to assess whether the role of the delay time on the assessment of the seismic resilience is significant, especially for the high functionality ratio. This finding may be particularly interesting for the preliminary assessments of practical solutions and the selection of various investments and decision-making procedures. In this regard, the seismic resilience was calculated by considering the state-of-the-art approach that consists of defining the loss model and the recovery model. These losses were calculated by applying the PBEE methodology, and some assumptions were implemented in the assessment of the direct and indirect losses. The recovery model was defined based on linear recovery functions that may be applied for preliminary case studies, such as the one presented herein. More realistic recovery models will be the object of future work. In addition, the recovery rate was calculated without considering the role of the delay time, which may affect the recovery process. This will be considered in future investigations. However, the presented approach may be applied by several stakeholders (such as infrastructure owners, public administrators, community planners, public investors, and designers) to make oriented decisions for the entire community.

Author Contributions

Conceptualization, D.F. and F.B.; methodology, D.F.; software, F.B.; validation, F.B. and D.F.; formal analysis, F.B.; investigation, D.F.; resources, F.B.; data curation, F.B.; writing—original draft preparation, F.B.; writing—review and editing, D.F.; visualization, F.B.; supervision, D.F.; project administration, F.B.; funding acquisition, F.B. All authors have read and agreed to the published version of the manuscript.

Funding

No funds were received by the authors.

Data Availability Statement

Data is contained within the article.

Conflicts of Interest

The authors declare no conflicts of interest.

References

  1. Yang, L.; Wang, P.; Wang, Q.; Bi, S.; Peng, R.; Behrensdorf, J. Reliability analysis of a complex system with hybrid structures and multi-level dependent life metrics. Reliab. Eng. Syst. Saf. 2021, 209, 107469. [Google Scholar] [CrossRef]
  2. Karakoc, D.B.; Almoghathawi, Y.; Barker, K.; González, A.D.; Mohebbi, S. Community resilience-driven restoration model for interdependent infrastructure networks. Int. J. Disaster Risk Reduct. 2019, 38, 101228. [Google Scholar] [CrossRef]
  3. Forcellini, D.; Tarantino, A.M. Assessment of stone columns as a mitigation technique of liquefaction-induced effects during Italian earthquakes (May 2012). Sci. World J. 2014, 2014, 216278. [Google Scholar] [CrossRef] [PubMed]
  4. Paulik, R.; Gusman, A.; Williams, J.H.; Pratama, G.M.; Lin, S.-L.; Prawirabhakti, A. Tsunami hazard and built environment damage observations from Palu city after the september 28 2018 Sulawesi earthquake and tsunami. Pure Appl. Geophys. 2019, 176, 3305–3321. [Google Scholar] [CrossRef]
  5. Chang, S.E.; Shinozuka, M. Measuring improvements in the disaster resilience of communities. Earthq. Spectra 2004, 20, 739–755. [Google Scholar] [CrossRef]
  6. Bruneau, M.; Chang, S.E.; Eguchi, R.T.; Lee, G.C.; O’Rourke, T.D.; Reinhorn, A.M.; Shinozuka, M.; Tierney, K.; Wallace, W.A.; VonWinterfeldt, D. A Framework to Quantitatively Assess and Enhance the Seismic Resilience of Communities. Earthq. Spectra 2003, 19, 733–752. [Google Scholar] [CrossRef]
  7. Cimellaro, G.; Reinhorn, A.M.; Bruneau, M. Framework for analytical quantification of disaster resilience. Eng. Struct. 2010, 32, 3639–3649. [Google Scholar] [CrossRef]
  8. Zelaschi, C.; De Angelis, G.; Giardi, F.; Forcellini, D.; Monteiro, R.; Papadrakakis, M. Performance based earthquake engineering approach applied to bridges in a road network. In Proceedings of the 5th International Conference on Computational Methods in Structural Dynamics and Earthquake Engineering Methods in Structural Dynamics and Earthquake Engineering (ECCOMAS), Crete Island, Greece, 25–27 May 2015; pp. 900–910. [Google Scholar] [CrossRef]
  9. Forcellini, D. Seismic resilience of bridges isolated with traditional and geotechnical seismic isolation (GSI). Bull. Earthq. Eng. 2023, 21, 3521–3535. [Google Scholar] [CrossRef]
  10. Giordano, P.F.; Iacovino, C.; Quqa, S.; Limongelli, M.P. The value of seismic structural health monitoring for post-earthquake building evacuation. Bull. Earthq. Eng. 2022, 20, 4367–4393. [Google Scholar] [CrossRef]
  11. Cardone, D.; Flora, A.; De Luca, P.M.; Martoccia, A. Estimating direct and indirect losses due to earthquake damage in residential RC buildings. Soil Dyn. Earthq. Eng. 2019, 126, 105801. [Google Scholar] [CrossRef]
  12. Comerio, M.C. Estimating downtime in loss modeling. Earthq. Spectra 2006, 22, 349–365. [Google Scholar] [CrossRef]
  13. Burton, H.V.; Deierlein, G.; Lallemant, D.; Lin, T. Framework for Incorporating Probabilistic Building Performance in the Assessment of Community Seismic Resilience. J. Struct. Eng. 2016, 142, C4015007. [Google Scholar] [CrossRef]
  14. Federal Emergency Management Agency (FEMA). FEMA P-58-1: Seismic Performance Assessment of Buildings, Volume 1–Methodology; Federal Emergency Management Agency: Washington, DC, USA, 2018.
  15. Kolozvari, T. Methodology for developing practical recovery-based design requirements for buildings. Eng. Struct. 2023, 274, 115102. [Google Scholar] [CrossRef]
  16. Cook, D.T.; Liel, A.B.; Haselton, C.B.; Koliou, M. A framework for operationalizing the assessment of post-earthquake Functional recovery of buildings. Earthq. Spectra 2022, 38, 1972–2007. [Google Scholar] [CrossRef]
  17. Dahlhamer, J.M.; Tierney, K.J. Rebounding from disruptive events: Business recovery following the Northridge earthquake. Sociol. Spectr. 1998, 18, 121–141. [Google Scholar] [CrossRef]
  18. Aghababaei, M.; Koliou, M.; Pilkington, S.; Mahmoud, H.; Van de Lindt, J.W.; Curtis, A.; Smith, S.; Ajayakumar, J.; Watson, M. Validation of time-dependent repair recovery of the building stock following the 2011 Joplin Tornado. Nat. Hazards Rev. 2020, 21, 04020038. [Google Scholar] [CrossRef]
  19. Elms, D. The systems stance. Civ. Eng. Environ. Syst. 2020, 37, 166–182. [Google Scholar] [CrossRef]
  20. Almufti, I.; Willford, M. The REDiTM Rating System: Resilience-Based Earthquake Design Initiative for the Next Generation of Buildings; Arup Co.: London, UK, 2013. [Google Scholar]
  21. Burton, H.V.; Kang, H.; Miles, S.B.; Nejat, A.; Yi, Z. A framework and case study for integrating household decision-making into post-earthquake recovery models. Int. J. Disaster Risk Reduct. 2019, 37, 101167. [Google Scholar] [CrossRef]
  22. Cremen, G.; Seville, E.; Baker, J.W. Modeling post-earthquake business recovery time: An analytical framework. Int. J. Disaster Risk Reduct. 2019, 42, 101328. [Google Scholar] [CrossRef]
  23. Han, R.; Li, Y.; van de Lindt, J. Seismic Loss Estimation with Consideration of Aftershock Hazard and Post-Quake Decisions. ASCE-ASME J. Risk Uncertain. Eng. Syst. Part A Civ. Eng. 2016, 2, 04016005. [Google Scholar]
  24. Thöns, S.; Stewart, M.G. On the cost-efficiency, significance and effectiveness of terrorism risk reduction strategies for buildings. Struct. Saf. 2020, 85, 101957. [Google Scholar] [CrossRef]
  25. Losanno, D.; Caterino, N.; Chioccarelli, E.; Rainieri, C.; Aiello, C. Structural Monitoring of a Railway Bridge in Southern Italy for Automatic Warning Strategy. In Civil Structural Health Monitoring; Springer: Cham, Switzerland, 2021; pp. 585–601. [Google Scholar]
  26. Nuzzo, I.; Riascos, C.; Losanno, D.; Caterino, N. Loss-Driven Rapid Warning Methodology for Seismic Risk Mitigation of a Target Railway Infrastructure. Procedia Struct. Integr. 2023, 44, 1832–1839. [Google Scholar] [CrossRef]
  27. Pang, Y.; Wei, K.; He, H.; Wang, W. Assessment of lifetime seismic resilience of a long-span cable-stayed bridge exposed to structural corrosion. Soil Dyn. Earthq. Eng. 2022, 157, 107275. [Google Scholar] [CrossRef]
  28. Pang, Y.; Wei, K.; Yuan, W. Life-cycle seismic resilience assessment of highway bridges with fiber-reinforced concrete piers in the corrosive environment. Eng. Struct. 2020, 222, 111120. [Google Scholar] [CrossRef]
  29. Li, Y.; Sun, Z.; Li, Y.; Dong, J.; He, W. Time-dependent combined index seismic resilience assessment of shear-critical RC bridge piers with height-varying corrosion. Eng. Struct. 2024, 308, 117957. [Google Scholar] [CrossRef]
  30. Li, Y.; Sun, Z.; Li, Y.; Zhu, W.; Zheng, H.; Zheng, S. Exploring the shear performance and predictive shear capacity of corroded RC columns utilizing the modified compression-field theory: An investigative study. Eng. Struct. 2024, 302, 117390. [Google Scholar] [CrossRef]
  31. Forcellini, D. An expeditious framework for assessing the seismic resilience (SR) of structural configurations. Structures 2023, 56, 105015. [Google Scholar] [CrossRef]
  32. Argyroudis, S.A.; Nasiopoulos, G.; Mantadakis, N.; Mitoulis, S.A. Cost-based resilience assessment of bridges subjected to earthquakes. Int. J. Disaster Resil. Built Environ. 2020, 12, 209–222. [Google Scholar] [CrossRef]
  33. Akiyama, M.; Frangopol, D.M.; Ishibashi, H. Toward life-cycle reliability-, risk- and resilience-based design and assessment of bridges and bridge networks under independent and interacting hazards: Emphasis on earthquake, tsunami and corrosion. Struct. Infrastruct. Eng. 2020, 16, 26–50. [Google Scholar] [CrossRef]
  34. Mackie, K.; Lu, J.; Elgamal, A. Performance-based earthquake assessment of bridge systems including ground-foundation interaction. Soil Dyn. Earthq. Eng. 2012, 42, 184–196. [Google Scholar] [CrossRef]
  35. Caltrans (California Department of Transportation). Seismic Design Criteria Version 1.3; Caltrans: Sacramento, CA, USA, 2003.
  36. Forcellini, D. Quantification of the Seismic Resilience of Bridge Classes. J. Infrastruct. Syst. Am. Soc. Civ. Eng. 2024, 30, 04024016. [Google Scholar] [CrossRef]
  37. Mina, D.; Forcellini, D. Soil-structure interaction assessment of the 23 November 1980 Irpinia-Basilicata earthquake. Geosciences 2020, 10, 152. [Google Scholar] [CrossRef]
  38. Forcellini, D. 3D Numerical simulations of elastomeric bearings for bridges. Innov. Infrastruct. Solut. 2016, 1, 45. [Google Scholar] [CrossRef]
  39. Cimellaro, G.P. Urban resilience for emergency response and recovery. In Fundamental Concepts and Applications, Geotechnical, Geological and Earthquake Engineering; Springer: Berlin/Heidelberg, Germany, 2016. [Google Scholar]
  40. Forcellini, D. A resilience-based methodology to assess the degree of interdependency between infrastructure. Struct. Infrastruct. Eng. 2024, 1–8. [Google Scholar] [CrossRef]
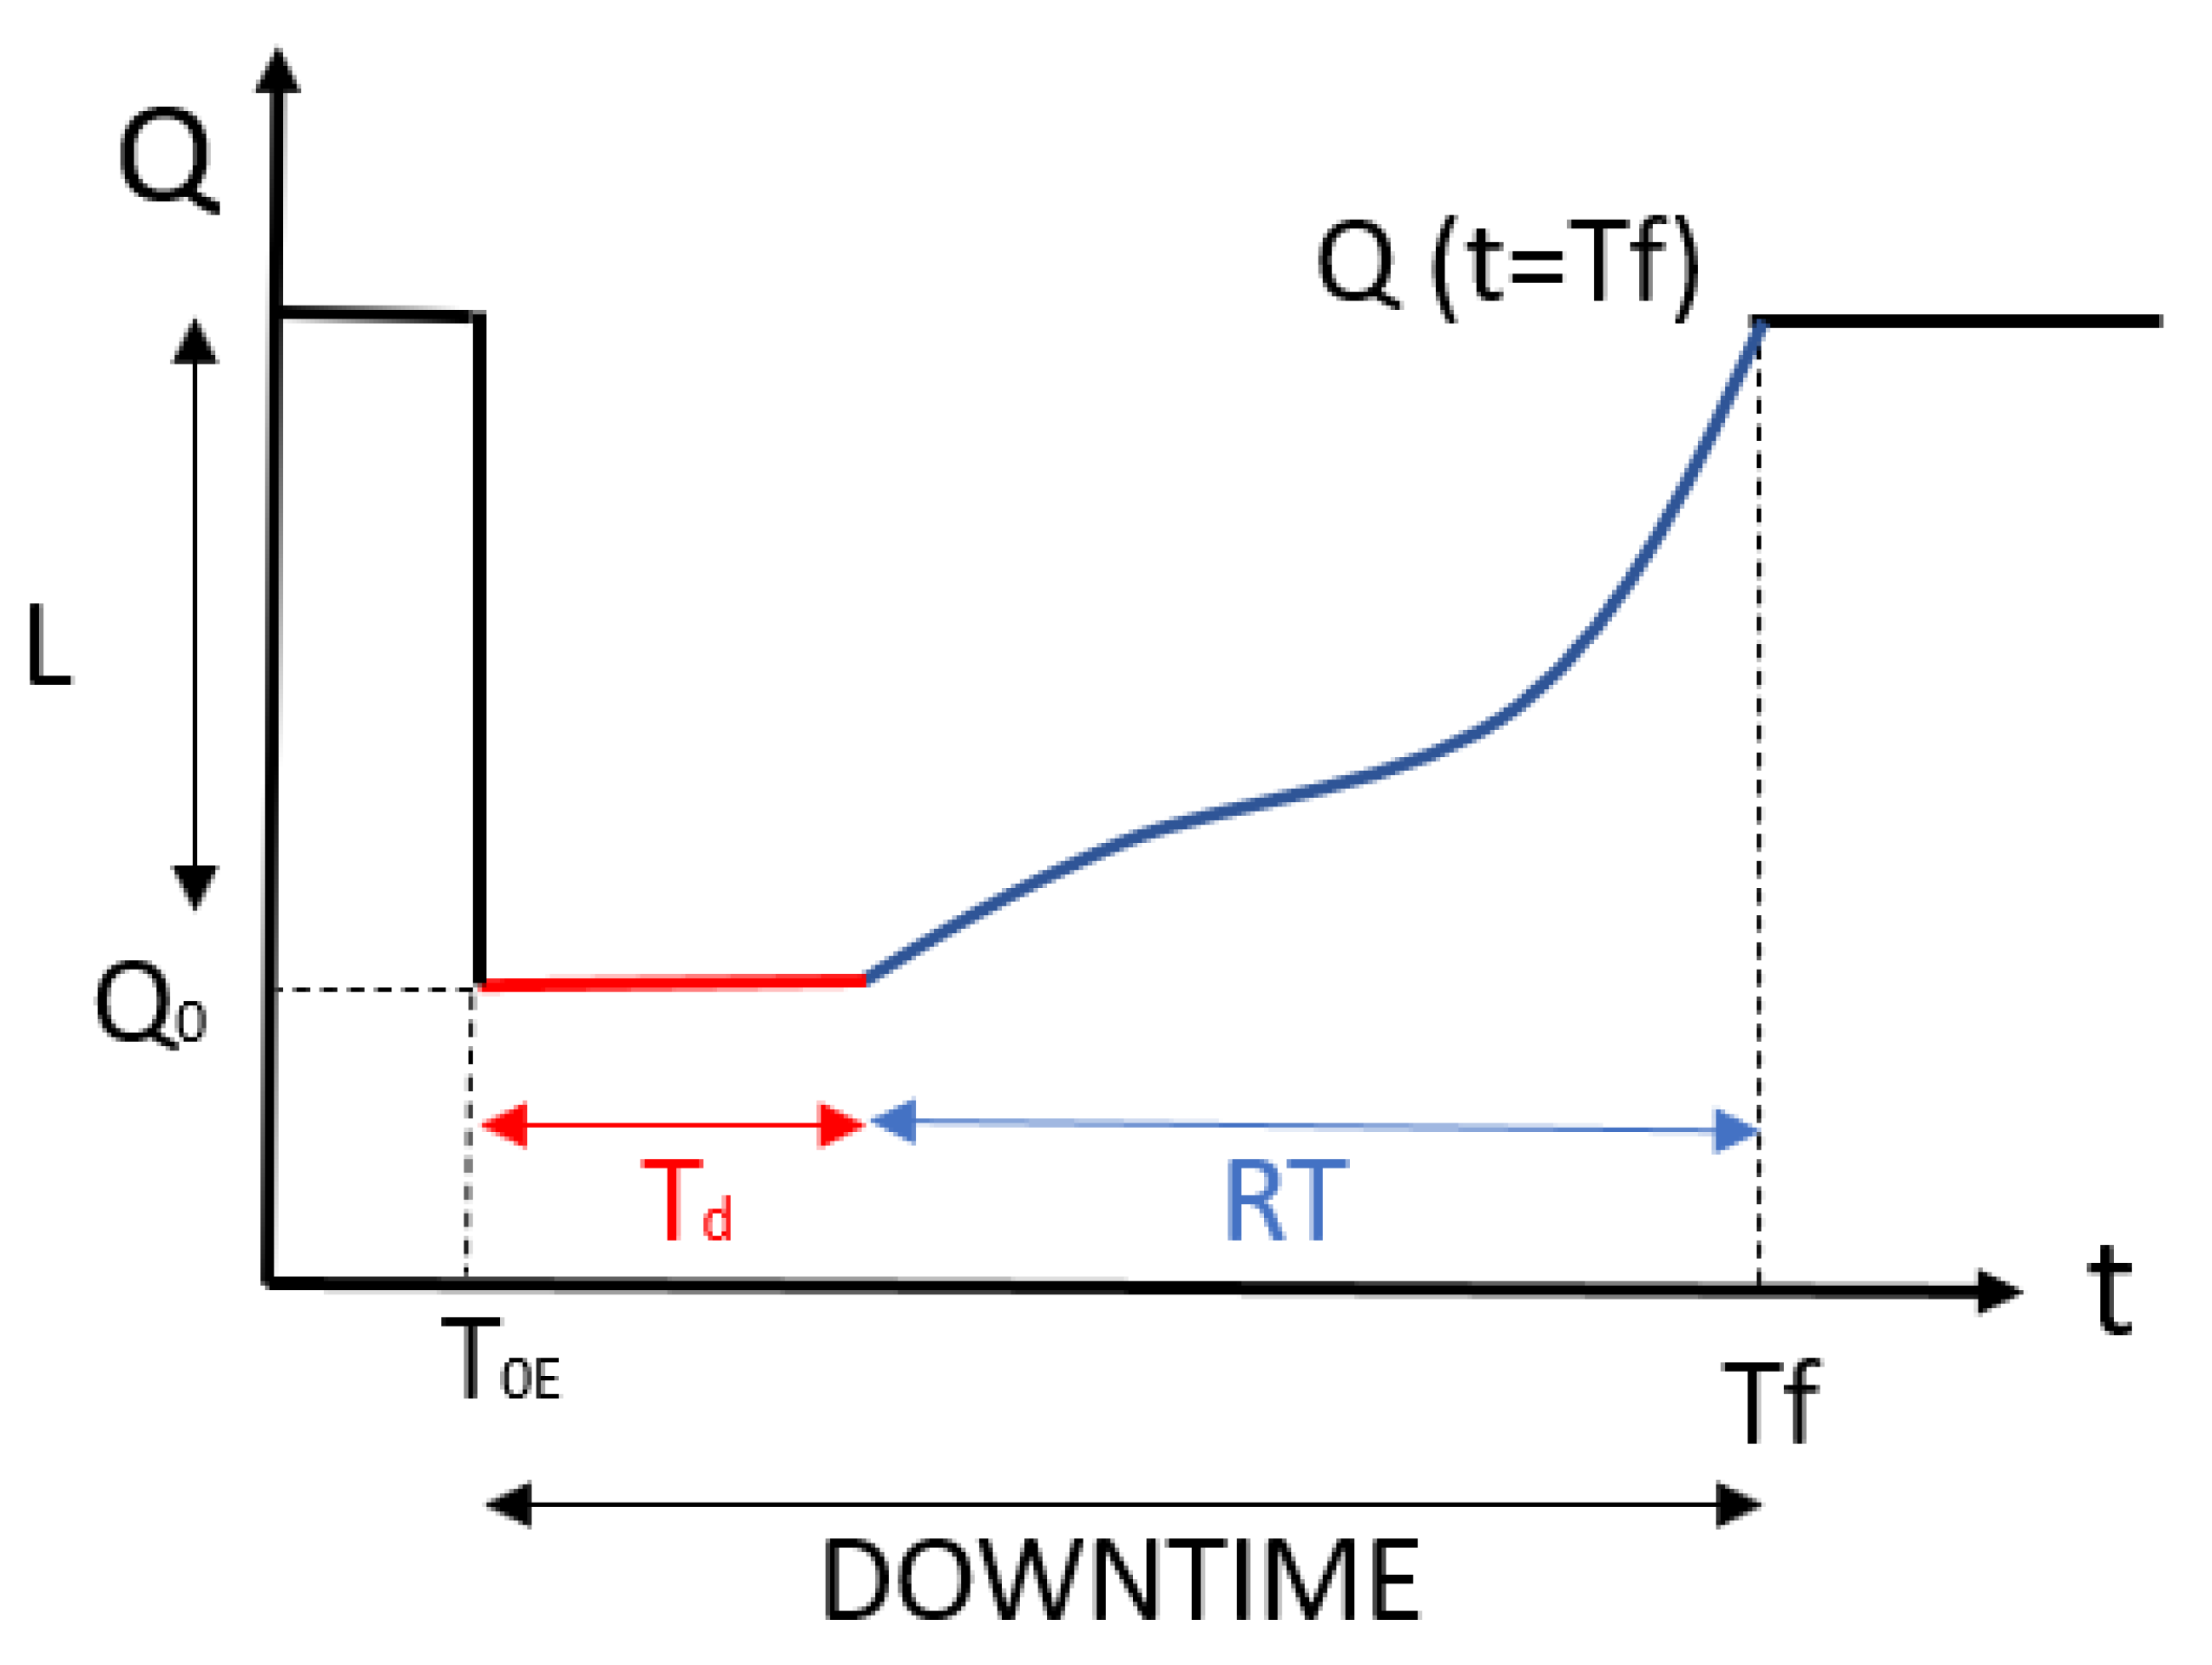
Figure 1. Delay time (Td).
Infrastructures 09 00108 g001
Figure 2. Bridge scheme: (a) Vertical view; (b) plan view.
Infrastructures 09 00108 g002
Figure 3. Non-linear beam column (fiber section).
Infrastructures 09 00108 g003
Figure 4. Repair cost ratio (%) vs. PGA (g).
Infrastructures 09 00108 g004
Figure 5. Repair time (CWD) vs. PGA (g).
Infrastructures 09 00108 g005
Figure 6. Connectivity losses (scenarios 1 and 9).
Infrastructures 09 00108 g006
Figure 7. Prolongation time (scenarios 1 and 9).
Infrastructures 09 00108 g007
Figure 8. Recovery process (scenario 1: R0, R1, and R2).
Infrastructures 09 00108 g008
Figure 9. Recovery process (scenario 9: R0, R1, and R2).
Infrastructures 09 00108 g009
Figure 10. Scenario 1 (R0, R1, and R2; β = 1.1, β = 1, and β = 0.8).
Infrastructures 09 00108 g010
Figure 11. Scenario 1: (a) β = 1.1: R0, R1, and R2; (b) β = 1: R0, R1, and R2; and (c) β = 0.8: R0, R1, and R2.
Infrastructures 09 00108 g011aInfrastructures 09 00108 g011b
Figure 12. Scenario 1: (a) R0: β = 1.1, β = 1, and β = 0.8; (a) R1: β = 1.1, β = 1, and β = 0.8; and (c) R2: β = 1.1, β = 1, and β = 0.8.
Infrastructures 09 00108 g012aInfrastructures 09 00108 g012b
Table 1. Direct (DL) and indirect losses (IL) for the nine scenarios.
Scenariocp1p2DL (%)C (%)P (%)IL (%)
10.10.050.139.53.82.05.8
20.10.050.239.53.82.15.9
30.10.050.539.53.82.46.2
40.20.050.139.57.72.09.7
50.20.050.239.57.72.19.8
60.20.050.539.57.72.410.1
70.50.050.139.519.22.021.2
80.50.050.239.519.22.121.2
90.50.050.539.519.22.421.6
Table 2. SR for the 81 case studies.
ScenarioR0R1R2
β = 0.8β = 1.0β = 1.1β = 0.8β = 1.0β = 1.1β = 0.8β = 1.0β = 1.1
167.3277.3282.3263.7670.9574.5558.4461.4362.92
267.2777.2782.2763.7070.8974.4858.3561.3462.84
367.1277.1282.1263.5170.7074.2958.1061.0962.58
465.4075.4080.4061.3068.4972.0955.1758.1659.66
565.3575.3580.3561.2468.4372.0355.0958.0859.57
665.2075.2080.2061.0568.2471.8354.8357.8259.32
759.6469.6474.6453.9251.1264.7145.3748.3649.86
859.5969.5974.5953.8261.0564.6545.2948.2849.77
959.4469.4474.4453.6760.8664.4545.0348.0249.52
Disclaimer/Publisher’s Note: The statements, opinions and data contained in all publications are solely those of the individual author(s) and contributor(s) and not of MDPI and/or the editor(s). MDPI and/or the editor(s) disclaim responsibility for any injury to people or property resulting from any ideas, methods, instructions or products referred to in the content.