Article

Vehicle Driving Safety of Underground Interchanges Using a Driving Simulator and Data Mining Analysis

1
Department of Roadway Engineering, School of Transportation, Southeast University, Nanjing 211189, China
2
BYD Company Limited (Headquarter), Shenzhen 518118, China
*
Author to whom correspondence should be addressed.
Infrastructures 2024, 9(2), 28; https://doi.org/10.3390/infrastructures9020028
Submission received: 4 December 2023 / Revised: 26 January 2024 / Accepted: 29 January 2024 / Published: 2 February 2024
(This article belongs to the Special Issue Recent Progress in Transportation Infrastructures)

Abstract

:
In the process of driving in an underground interchange, drivers are faced with many challenges, such as being in a closed space, visual changes alternating between light and dark conditions, complex road conditions in the confluence section, and dense signage, which directly affect the safety and comfort of drivers in an underground interchange. Thus, driving simulation, building information modeling (BIM), and data mining were used to analyze the impact of underground interchange safety facilities on driving safety and comfort. Acceleration disturbance and steering wheel comfort loss values were used to assist the comfort analysis. The CART algorithm, classification decision trees, and neural networks were used for data mining, which uses a dichotomous recursive partitioning technique where multiple layers of neurons are superimposed to fit and replace very complex nonlinear mapping relationships. Ten different scenarios were designed for comparison. Multiple linear regression combined with ANOVA was used to calculate the significance of the control variables for each scenario on the evaluation index. The results show that appropriately reducing the length of the deceleration section can improve driving comfort, setting reasonable reminder signs at the merge junction can improve driving safety, and an appropriate wall color can reduce speed oscillation. This study indicates that the placement of traffic safety facilities significantly influences the safety and comfort of driving in underground interchanges. This study may provide support for the optimization of the design of underground interchange construction and internal traffic safety facilities.

1. Introduction

The evaluation and optimization of traffic safety facilities is one of the important means by which to solve the safety problem of underground interchanges (UIs), which is of great significance to reduce the severity of accidents, eliminate all kinds of horizontal and longitudinal interference and provide line of sight guidance [1,2]. In the process of driving, the information collected through vision accounts for the vast majority of cues, but since it is affected by the light environment inside and outside the entrance, the driver will encounter visual obstacles after entering the tunnel, affecting driving safety [3,4]. Therefore, the deceleration section and sign setting at the hole is particularly important, as it can guide drivers to slow down and help them better adapt to the environment inside and outside the hole [5].
Scholars have carried out extensive research on the traffic safety of UIs [6,7,8], and research methods are mainly divided into three types: theoretical derivation methods, subjective evaluation, and analysis methods based on vehicle data.
(1)
Theoretical derivation methods generally investigate the facilities of underground roads. Hsu et al. used the driver’s reaction time and visual recognition distance, combined with the running state of the vehicle, to derive the optimal placement position of signs and the distance between sign placements [9]. Zhang et al. used analytical methods to check and optimize the visibility of underground roads [10]. Although the theoretical derivation method has strong advantages, the practical problem is more abstract, and the theoretical derivation is more difficult to develop; therefore, this research method needs to be further studied and understood.
(2)
Subjective evaluation methods are generally used for safety evaluation. Combined with engineering standards and practical experience, the safety analysis of underground roads can be realized. Zotic et al. accounted for the characteristics of underground roads and the factors affecting traffic safety and combined the consultation and scoring of expert opinions to establish a safety evaluation suitable for the design stage of urban underground roads [11]. However, this method is highly subjective, requires sufficient engineering experience, and has certain limitations.
(3)
Vehicle-data-based methods are the most common [12]. Wan et al. used the coil detector on each lane of Shanghai express roads to obtain the flow rate, speed, occupancy rate, and number of vehicles of each vehicle type in each lane of a right on-ramp. Then, they used surveillance video image processing and obtained the corresponding data for a left on-ramp and compared the left on-ramp with the right on-ramp [13]. However, the coil data acquisition period in their study was 20 s, and only macro traffic flow research on underground roads could be carried out, so the relevant data regarding vehicle micro behavior cannot be obtained.
The safety research on urban UIs mainly focuses on accident characteristics analysis [14], driving behavior on underground expressways [15], lighting evaluation and so on. Yeung and Wong et al. [16] analyzed traffic accident data from urban underground expressways in Singapore and concluded that the transition area near the entrance (the range of 250 m before and after the entrance) was the area with a high incidence of traffic accidents. Chen et al. [17] analyzed the characteristics of different mechanisms of vehicle operation on underground expressways from the perspective of visual information load. This study belonged to the deep mechanism study and laid out a theoretical foundation for technical research on improving traffic safety in the visual environment of underground expressways.
Research involving driving simulators in the field of road safety research is very extensive, with investigations including driving distraction [18], road design [19], traffic design [20], traffic accidents [21] and driving fatigue [22]. Through the driving simulator, the traffic operation characteristics of drivers under different roads and traffic conditions can be obtained, such as speed, acceleration, lane offset, steering wheel angle, etc. [23,24]. Complete data can provide strong support for research. Research regarding underground expressways based on driving simulators is also emerging gradually. To explore the driver’s speed perception mechanism, Zhang et al. [25] designed a driving simulation experiment to collect the driver’s perceived speed and the actual driving speed and analyze the influence of factors such as geometric alignment and sidewall change frequency on the driver’s speed perception sensitivity. Huang et al. [26] proposed four different integrated traffic guidance schemes and studied their effects on driver behavior through driving simulator experiments and questionnaires. However, driving simulation analysis for urban UIs is relatively lacking.
Overall, there have been a lot of research results on UI safety, but there is no clear process and method for safety evaluation based on driving simulators, and further research is also needed on the standardization of driving simulation tests. Furthermore, a lack of advanced technical methods is present in the data processing and evaluation process. Therefore, through the analysis of the traffic characteristics of different sections of the underground interchange and the safety and comfort of the UI, this study designs different traffic safety facility configuration schemes. Driving simulator test data and a machine learning model are combined to evaluate driving safety and comfort in different sections of a UI.

2. Methodology

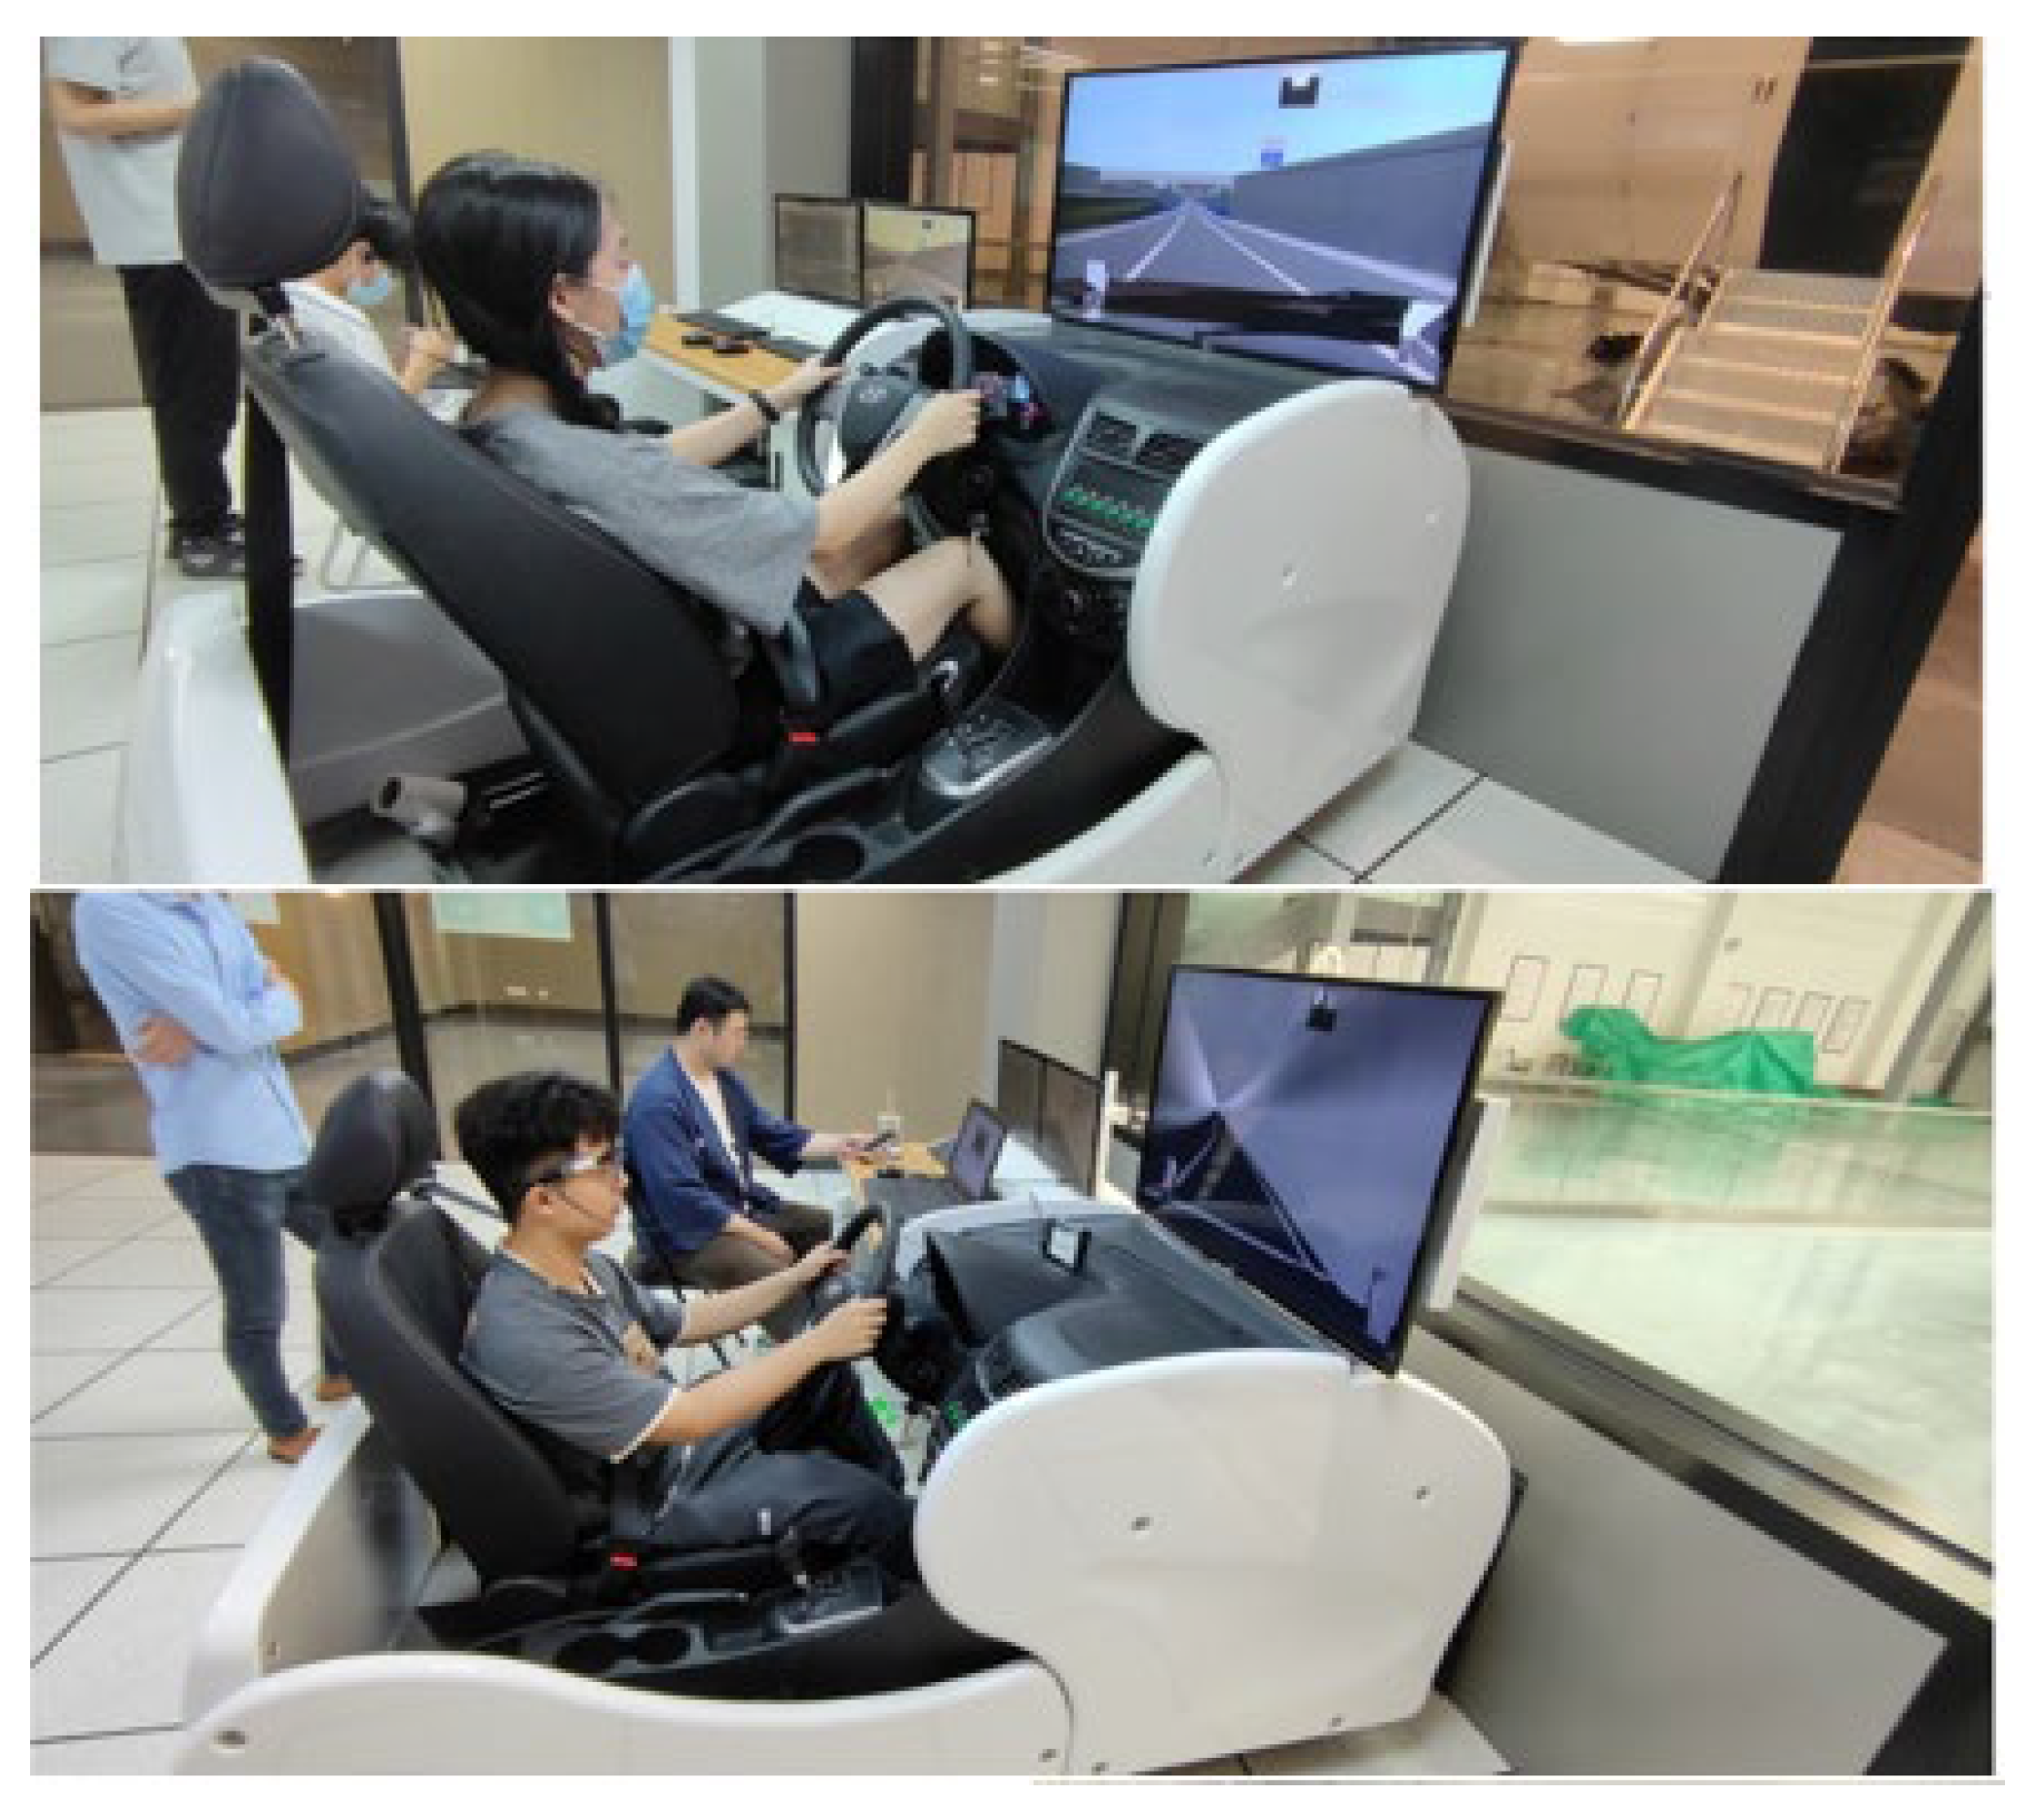
2.1. Driving Simulator Tests

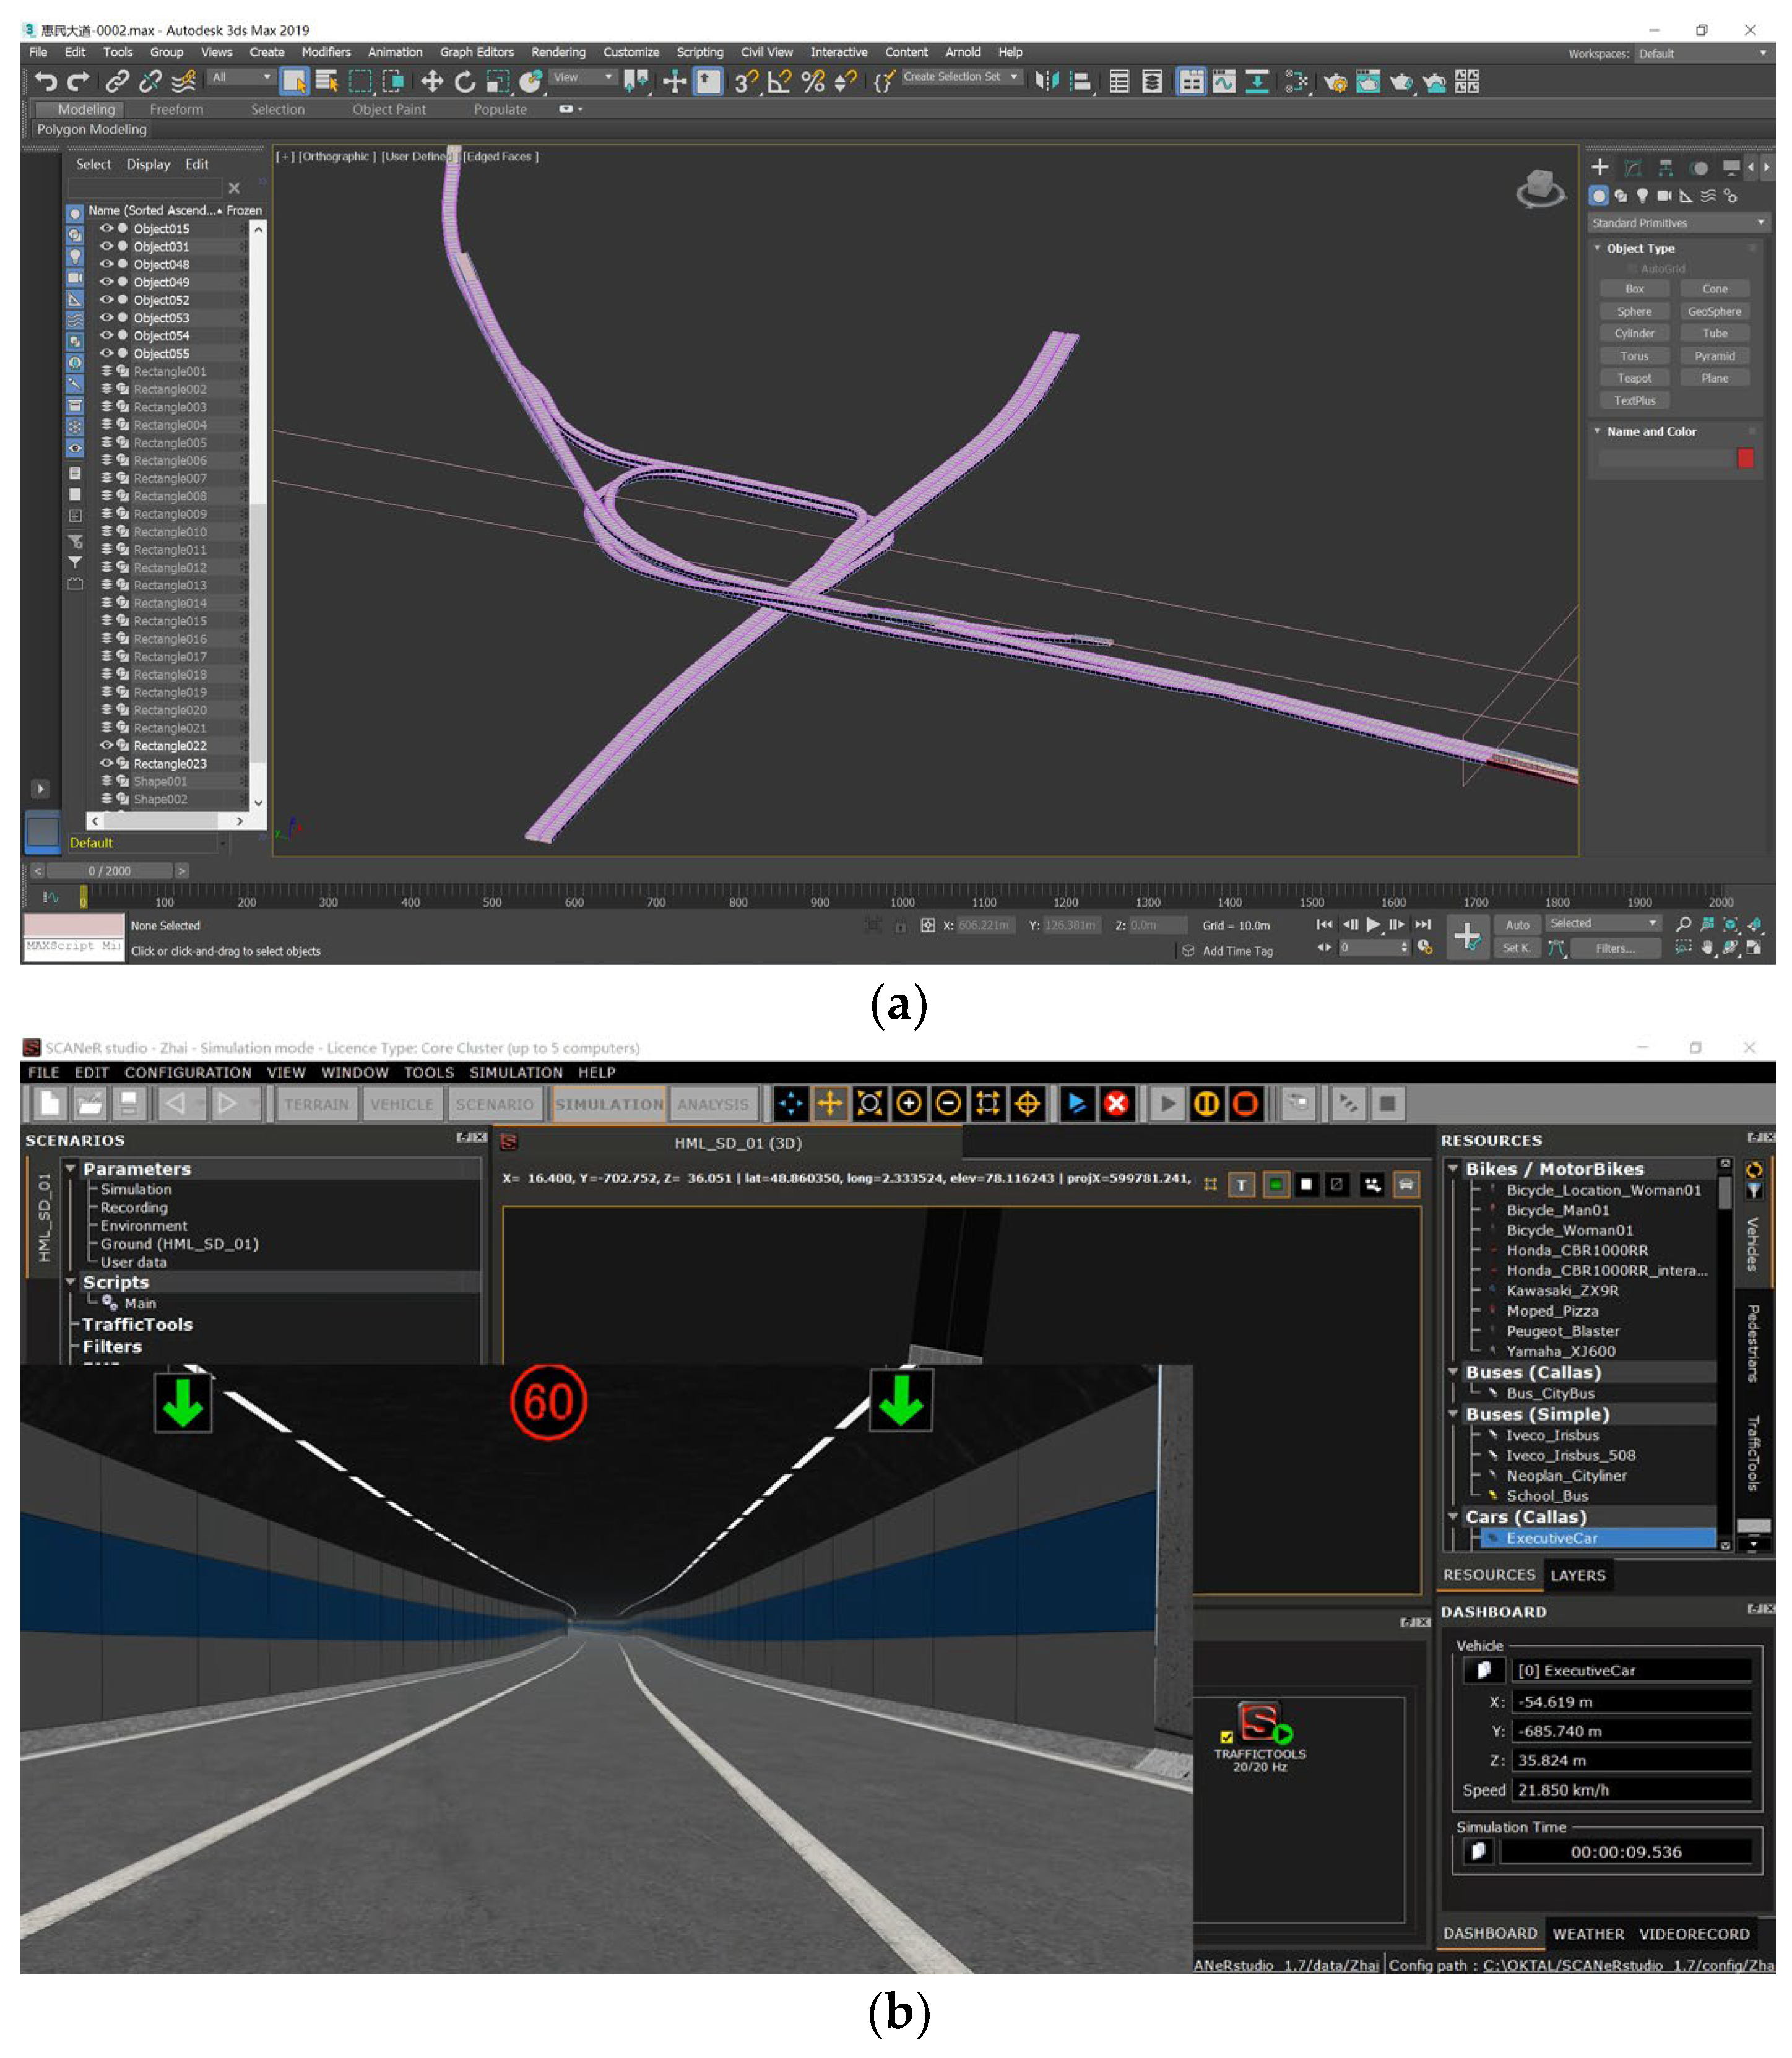
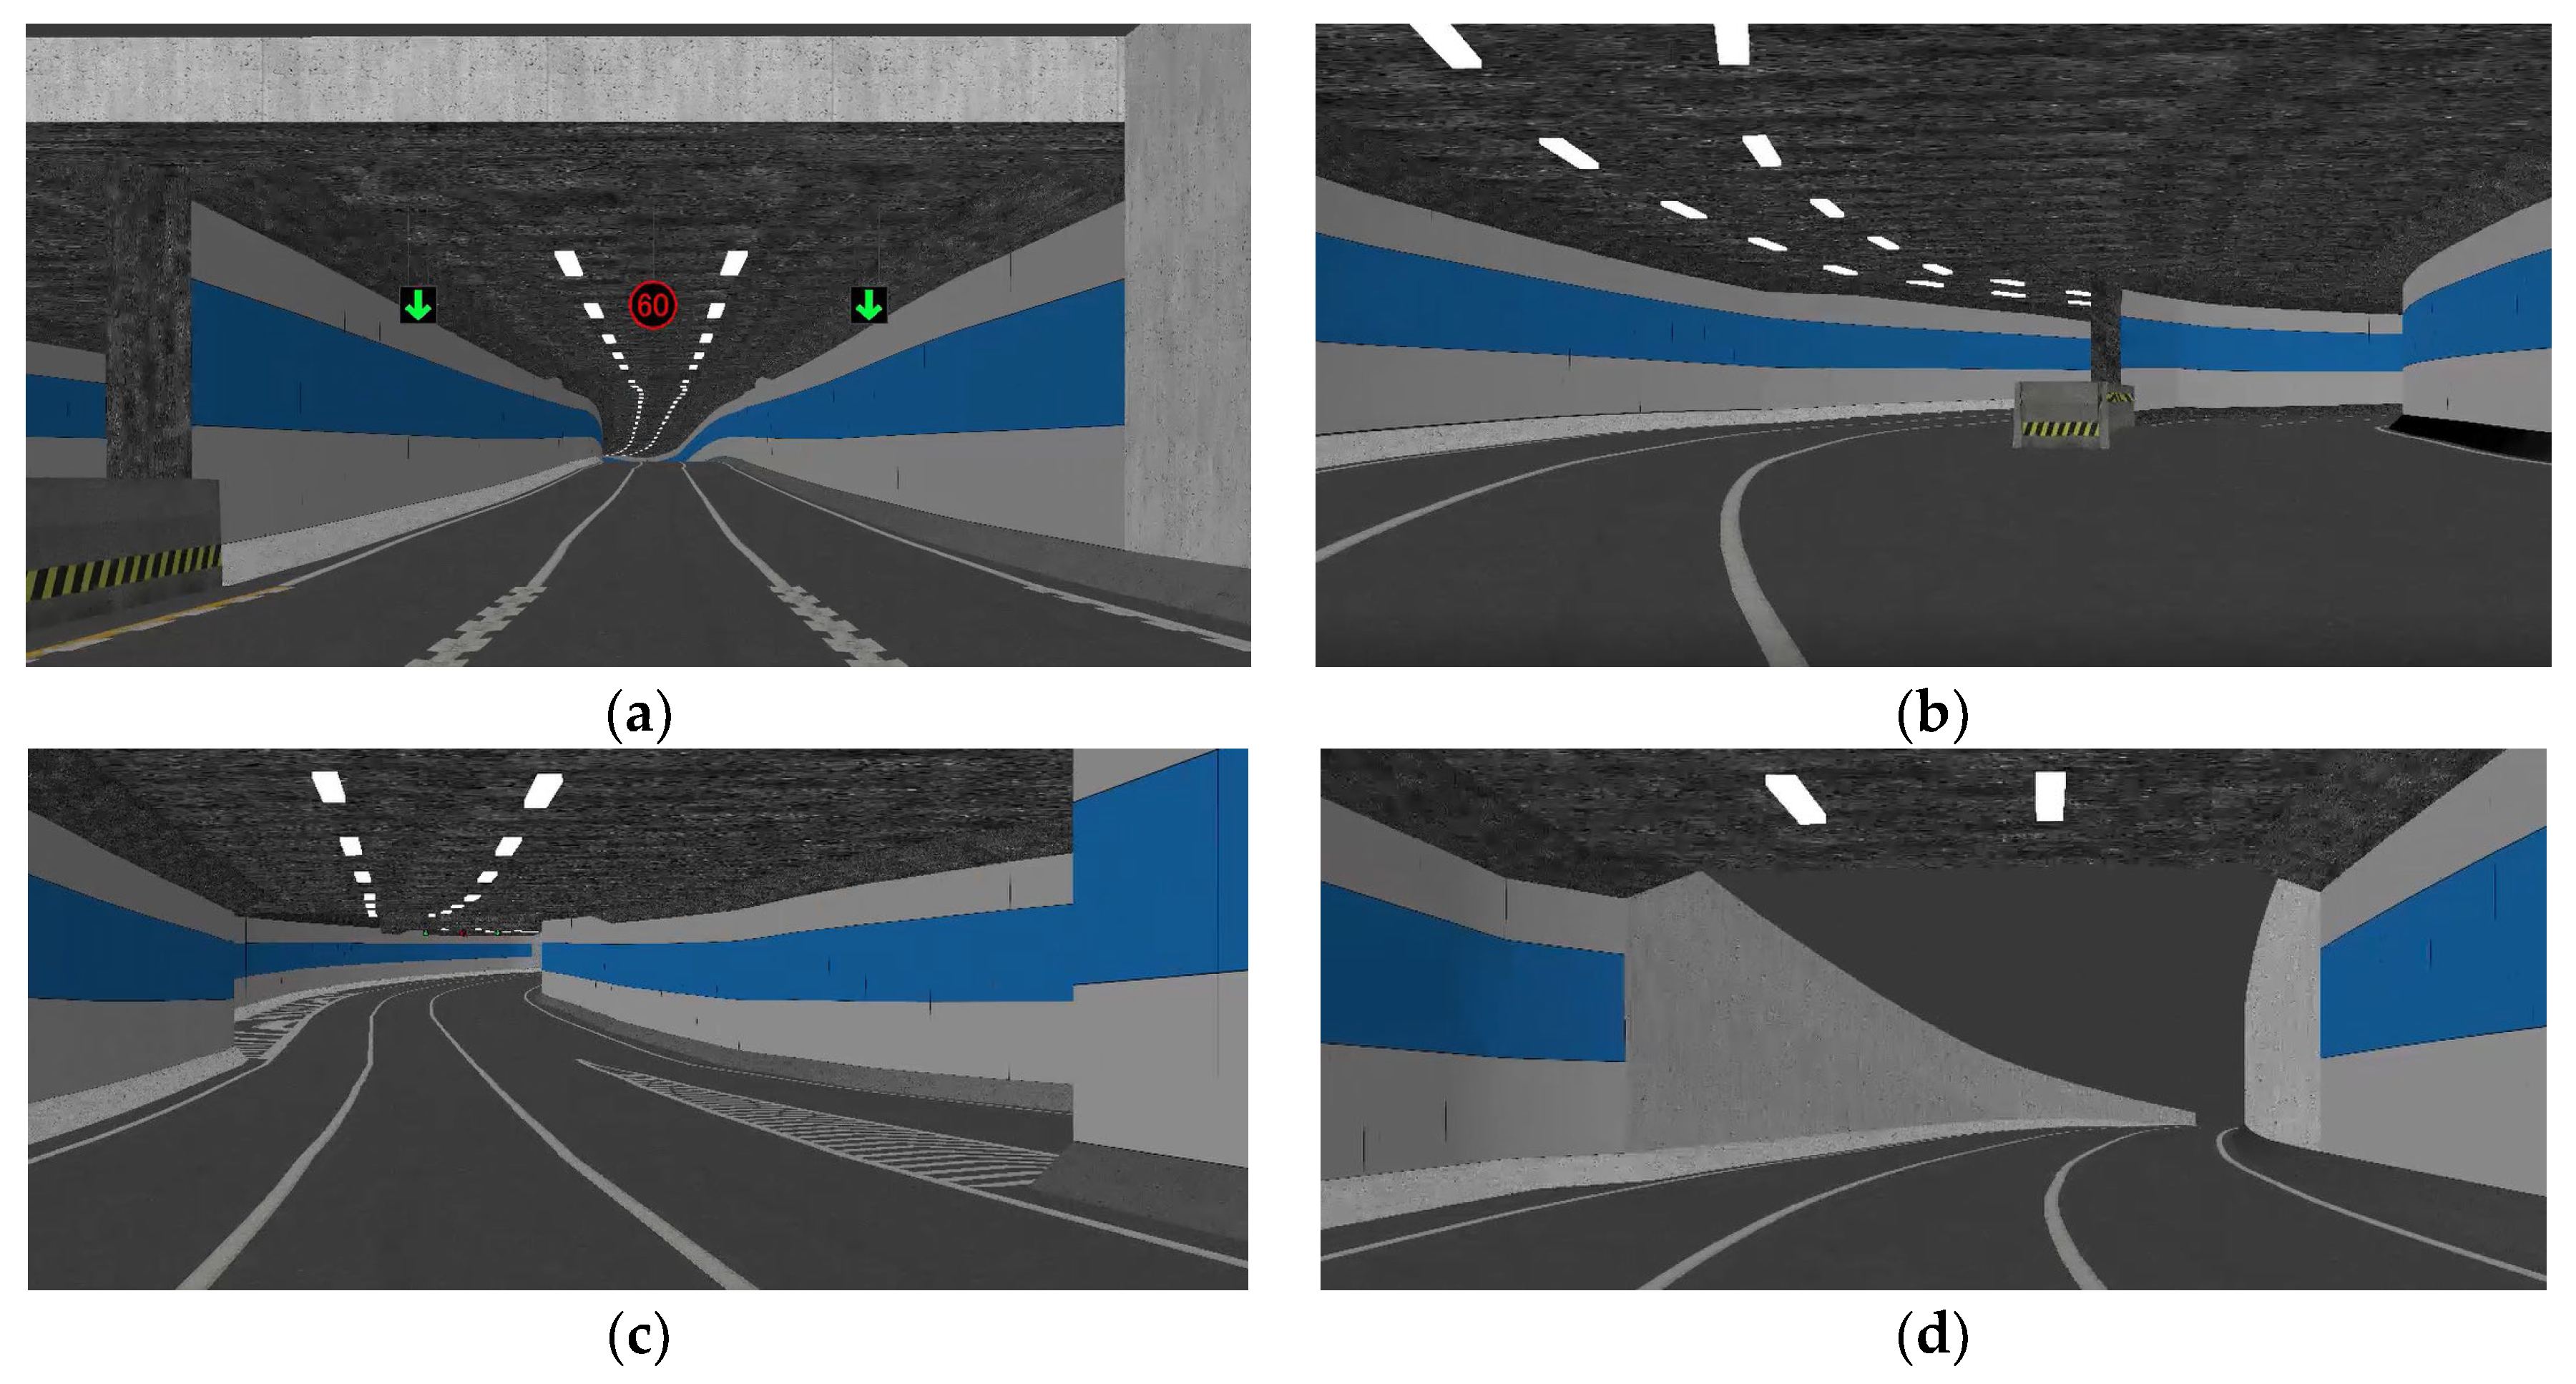
2.1.1. Modeling of Underground Interchanges

The precision and accuracy of the modeling methods used in traditional driving simulation are not guaranteed. To reduce the gap between the simulation results and the actual situation, the authors of this study used MicroStation V8i of the Bentley Company to conduct 3D modeling of the UI. Firstly, a 3D UI model was constructed according to the existing 2D AutoCAD drawings, as shown in Figure 1a. Then, the model was imported into the SCANeR STUDIO platform of driving simulation to build virtual simulation scenes, as shown in Figure 1b.

2.1.2. Scheme Design

This study attempted to evaluate the effect of large-scale UI safety facilities quantitatively. Therefore, a large UI was selected as the prototype of a driving simulation scene. The test section was 2500 m, and design parameters are shown in Table 1.
The original design of the UI safety facilities is shown in Table 2.
The color choice of the UI walls can directly affect the driver’s vision and driving experience. In addition, the internal color is also an essential component of landscape design, and its choice will also affect the overall design beauty of the structure.
Due to the large difference between the internal and external environment of the UC entrance, when the driver enters and exits the entrance, it is challenging to adapt to light and dark, which easily produces visual obstacles and interferes with driving safety [27]. Therefore, the deceleration section at the entrance is particularly important. According to standard GB51038-2015 of China [28], when the design speed is greater than or equal to 60 km/h, it is appropriate to adopt the longitudinal deceleration marking of the roadway but to set the transverse deceleration vibration marking before the entrance of the UC road. The deceleration section’s length is also one factor to be considered; too short a deceleration section may not result in the driver slowing down, and the deceleration effect is not good. Too long a deceleration will cause excessive tension and discomfort for the driver, thus reducing the driving experience.
In addition, the difference between UI and ordinary tunnels is that there is a confluent section in the middle of the UI. According to relevant studies, their driving states will significantly differ when drivers drive in different tunnel sections. [29]. When drivers drive in the middle of the tunnel, drivers are prone to a serious optical illusion, reducing driving speed and improving driving safety.
Based on the above data and combined with the design of the selected UI facilities, ten safety facility schemes were designed in this study, of which scheme 1 is the basic scheme, and the other schemes are optimized for the entrance and exit and the confluence section, respectively, as shown in Table 3.

2.1.3. Testing Procedure

A total of 24 volunteers were recruited for the experiment; 80% of the subjects were male, and 20% were female, and the gender ratio was close to the statistical characteristics of Chinese drivers. As shown in Figure 2, the driving simulator was set to record the vehicle operating parameters at a frequency of 20 Hz, including the speed, acceleration, lateral offset, throttle, brake, steering wheel angle, clutch, vehicle coordinates, etc.
In the procedure, each person performed ten groups of experiments. The order of experiments was random, and the driving time of each scene was about 3 min. The UI model was imported into the simulator. When it was ready, the experimenter entered the cockpit to start the simulation test. To ensure the accurate measurement of lane offset, the test required the subjects to drive in the right lane, and it was forbidden to change lanes. The test steps were as follows:
  • Fill in the personal information form, including gender, age, and driving experience;
  • Carry out about five minutes of driving practice, and learn the precautions and instrument use points;
  • Learn the destination and complete the driving simulation;
  • Record the driving conditions and save the data.

2.1.4. Data Pre-Processing

According to the traffic characteristics of the UI, the tunnel can be divided into seven different sections, including the section before the entrance, the entrance section, the transition section, the middle section, the transition section, the exit section, and the section after the exit [30].
According to the scheme design, the section in the tunnel is divided into four sections: entrance section, basic section, confluence section, and exit section. According to standard JTJ026 of China [31], the entrance section of the UI was 100 m. However, considering an 80 m deceleration section at the entrance in the experimental design, the entrance section was defined as 100 m before the entrance and 50 m after the entrance. The remaining sections are prescribed to be 100 m, as shown in Table 4. According to the position coordinate data graph in the 3D model, the specific sections of the data were determined, as shown in Figure 3.

2.2. Evaluation Index System

In this study, seven indexes were selected to construct an evaluation index system from the aspects of safety and comfort of UI, considering the influence of lane marking on driving behavior. The indicators are defined as follows:

2.2.1. Safety Index

(1)
Speed V: The distance traveled by the vehicle per unit time. Traditional automobile dynamics take the car as a particle or a rigid body, and the running speed method is used to evaluate the safety [32].
(2)
Acceleration a: The change in the speed of the vehicle in the direction of travel per unit time. According to the specifications of JTG D20-2017 in China [33], acceleration rates less than 0.9 m/s2 are the best acceleration conditions, while acceleration rates greater than 1.2 m/s2 are the worst. When the absolute value of acceleration is less than 1.3 m/s2, it is better, and greater than 2.5 m/s2 is worse.
(3)
Gas pedal Gp: The product of the depth of the driver’s pedal and the length of the pedal. This value indicates the driver’s ability to control the vehicle; the smaller it is, the better the control.

2.2.2. Comfort Index

(4)
Lateral acceleration a ¯ : The acceleration caused by the centrifugal force generated when the vehicle makes a turn. The value of lateral acceleration can indicate the driver’s comfort level.
(5)
Acceleration interference σ (m/s2): The standard deviation of the vehicle acceleration against the average acceleration. Acceleration interference represents the magnitude of velocity swing; the greater the acceleration interference, the lower the safety and comfort, and vice versa, as shown in Equation (1) [34].
σ = 0 T a t a ¯ 2 d t T
where T represents the total observation time, and a(t) represents the acceleration at time t.
(6)
Torque of the steering wheel m: An excessive m value will increase the difficulty of the driver’s control, affecting the comfort and safety of driving. The torque characteristic of the steering wheel (m) preferred by the driver is obtained by multiple linear regression, as calculated in Equation (2) [35].
m = 0.722 + 0.425 × a ¯ + 0.054 × V
where m represents the desired torque, and V represents the speed.
(7)
Comfort loss of steering wheel l: When the actual steering wheel torque of the vehicle is different from the torque preferred by the driver, there is a loss of driver comfort. Under certain working conditions, this value reflects the comprehensive degree to which the actual steering wheel torque characteristics of the vehicle make the driver feel uncomfortable relative to the driver’s preferred steering wheel torque characteristics, as shown in Equation (3). The larger the l, the farther the actual steering wheel torque characteristics deviate from the expected characteristics, and the lower the comfort. On the contrary, the smaller the l, the better the steering comfort of the vehicle. When l = 0, the actual steering characteristics of the vehicle fully coincide with the expected characteristics; that is, the driver can fully meet the comfort requirements of the steering wheel torque characteristics of the vehicle.
l = 1 n L i = 1 n i = 1 n k y i m i 2 k = 4 ( F S 60 F S 100 ) 2 r h 2
where y represents the actual torque characteristic of the steering wheel, k represents the comfort loss coefficient of the steering wheel torque characteristic, and rh denotes the radius of the steering wheel. i is used to distinguish between different working conditions. In this simulation, the average weight of the car was 1400 kg and the rh was 220 mm. According to the steering lightness test in QC/T 480-1999, the limit values of the average steering force of the steering disc are FS60 = 50 N and FS100 = 15 N. Thus, k = 0.0675 could be obtained.

2.2.3. Summary Variables

In the data mining model, the change in traffic safety facilities was taken as the independent variable, and the dependent variables were the data collected by the driving simulator. The summary is shown in Table 5 and Table 6. Table 5 provides a statistical description of the continuous variables using ANOVA. Table 6 provides a statistical description of the nominal variables. The data statistics and variance analysis of these variables can objectively evaluate the overall comfort level of UI, thus providing a scientific basis for UI optimization design.

2.3. Data Mining Method

In the process of driving in the UI, in addition to the type, length, and position of the marking line, the setting of the marking line influences the driver’s safety and comfort [36,37]. To explore the influence of traffic safety settings, we investigated the important control conditions that have a good effect on traffic safety facilities. Firstly, a whole decision tree was built for ten schemes, and then the decision tree was grouped into different sections. The independent variables considered included the deceleration section type, deceleration section length, sign information, sign location, sign density, wall color, etc. Before the analysis, it was necessary to adopt multiple linear regression to model the independent and dependent variables to consider the influence of different factors on the experimental results. The methods involved are detailed below:

2.3.1. Multiple Linear Regression (MLR)

MLR refers to the method of establishing a prediction model through the correlation analysis of two or more independent variables and one dependent variable [38,39]. This method can analyze the relationship between multiple marker control variables and driving evaluation, and the least squares method can be used to fit the parameters.
The least squares method is standard for establishing linear regression equations from driving simulation data. Due to the large amount of data generated in the driving simulator, the deviation at the data points of the fitting function cannot be strictly zero. However, to make the approximate curve reflect the changing trend of the given data points as much as possible, the sum of squares of the deviation should be minimized, and the residual sum of squares of all observed values should be minimized by selecting the parameters, as shown in Equation (4).
min e j 2 = Z j Z j ^ 2 = Z j a 0 a j x j 2
Based on this, the MLR model is shown in Equation (5).
z = b 0 + b 1 x 1 + b 2 x 2 + + b k x k + e
where b0 represents the constant term, and b1, b2, … bk represent the regression coefficient.

2.3.2. Analysis of Variance (ANOVA)

After modeling, it is necessary to conduct variance analysis to analyze whether different marker settings have a significant impact on driving safety and comfort. The ANOVA method, also known as “variance analysis” [40], is used to test the significance of differences between the means of two or more samples.
Due to the influence of various factors, the data obtained from the study show fluctuations. The causes of fluctuation can be divided into two categories: uncontrollable random factors and controllable factors exerted in the research to impact the results. The influence of controllable factors on the research results was determined by analyzing the contribution of variation from different sources to the total variation.
In the difference analysis method, for the sample population N (μ, σ2), different levels of the hypothesis factors have significant effects on the dependent variables, as shown in the hypothesis in Equation (6).
H : μ 1 = μ 2 = = μ k
If the hypothesis is rejected if at least one pair of μiμj is true, then the model in Equation (7) is introduced:
y i k = μ i + e i k , k = 1 , 2 , I
where eik denotes a random error and follows the normal distribution N(0, σ2).

2.3.3. Decision Tree

A classification and regression (CART) decision tree was adopted in this study. The advantage of the CART decision tree is that a complete binary tree can be constructed by pruning and evaluating the tree. The CART algorithm uses a binary recursive segmentation technique to divide the current sample set into two sub-sample sets so that each generated non-leaf node has two branches.
The CART algorithm examines each variable and all possible partition values for that variable to find the best partition. For continuous value processing, the idea of a “split point” is introduced, assuming that there are n consecutive values of a certain attribute in the sample set, there are N-1 split points, and each “split point” is the mean of two contiguous values (a[i] + a[i + 1])/2. All partitions of each property are sorted in order of the number of impurities (heterogeneous, different components in the composite) they can reduce; the reduction of impurities is defined as the sum of the impurities before the partition minus the impurity mass at each node after the partition * the ratio of the partition to the sample.
The impurity measurement method adopted in this study is: GINI index, if k, k = 1, 2, 3, … C represents the class, where C represents the number of dependent variables of the class set result, and the GINI impurity of the A node is defined by Equation (8):
G i n i A = 1 k = 1 c p k 2
where pk represents the probability of belonging to class k in the observation point. When Gini (A) = 0, all samples belong to the same class, and when all classes occur with the same probability in the node, Gini (A) is maximized, being (c-1) C/2. Through the auxiliary analysis of the decision tree, the maximum influence of the setting of traffic security facilities on the data results can be determined.

2.3.4. Neural Network Models

In the driving simulation, the series of traffic safety facilities on driving safety have correlating influence, showing a nonlinear relationship, and it is difficult to distinguish and judge the influence law by traditional methods such as variance analysis. The structure and calculation process of the neural network model are very simple, and the result can better fit and replace the very complex nonlinear mapping relationship [41,42]. A neural network profiler is a modeling tool based on neural networks that captures potential relationships in data by training neural networks with multiple hidden layers. Compared to traditional statistical models, neural network profilers can deal with nonlinear relationships better and learn complex features and relationships [43]. In this study, a feedforward neural network (FNN) was used for data mining, which is suitable for various types of data. Compared to traditional methods, FNNs can learn and represent complex nonlinear relationships more accurately, and they have stronger prediction performance [44].

3. Results and Discussions

When analyzing the data, the four special sections of the UI, namely the entrance, DC 1, DC 2, and exit sections, were considered first. There is a high incidence of accidents in these four sections, so safety is the top priority, followed by comfort.

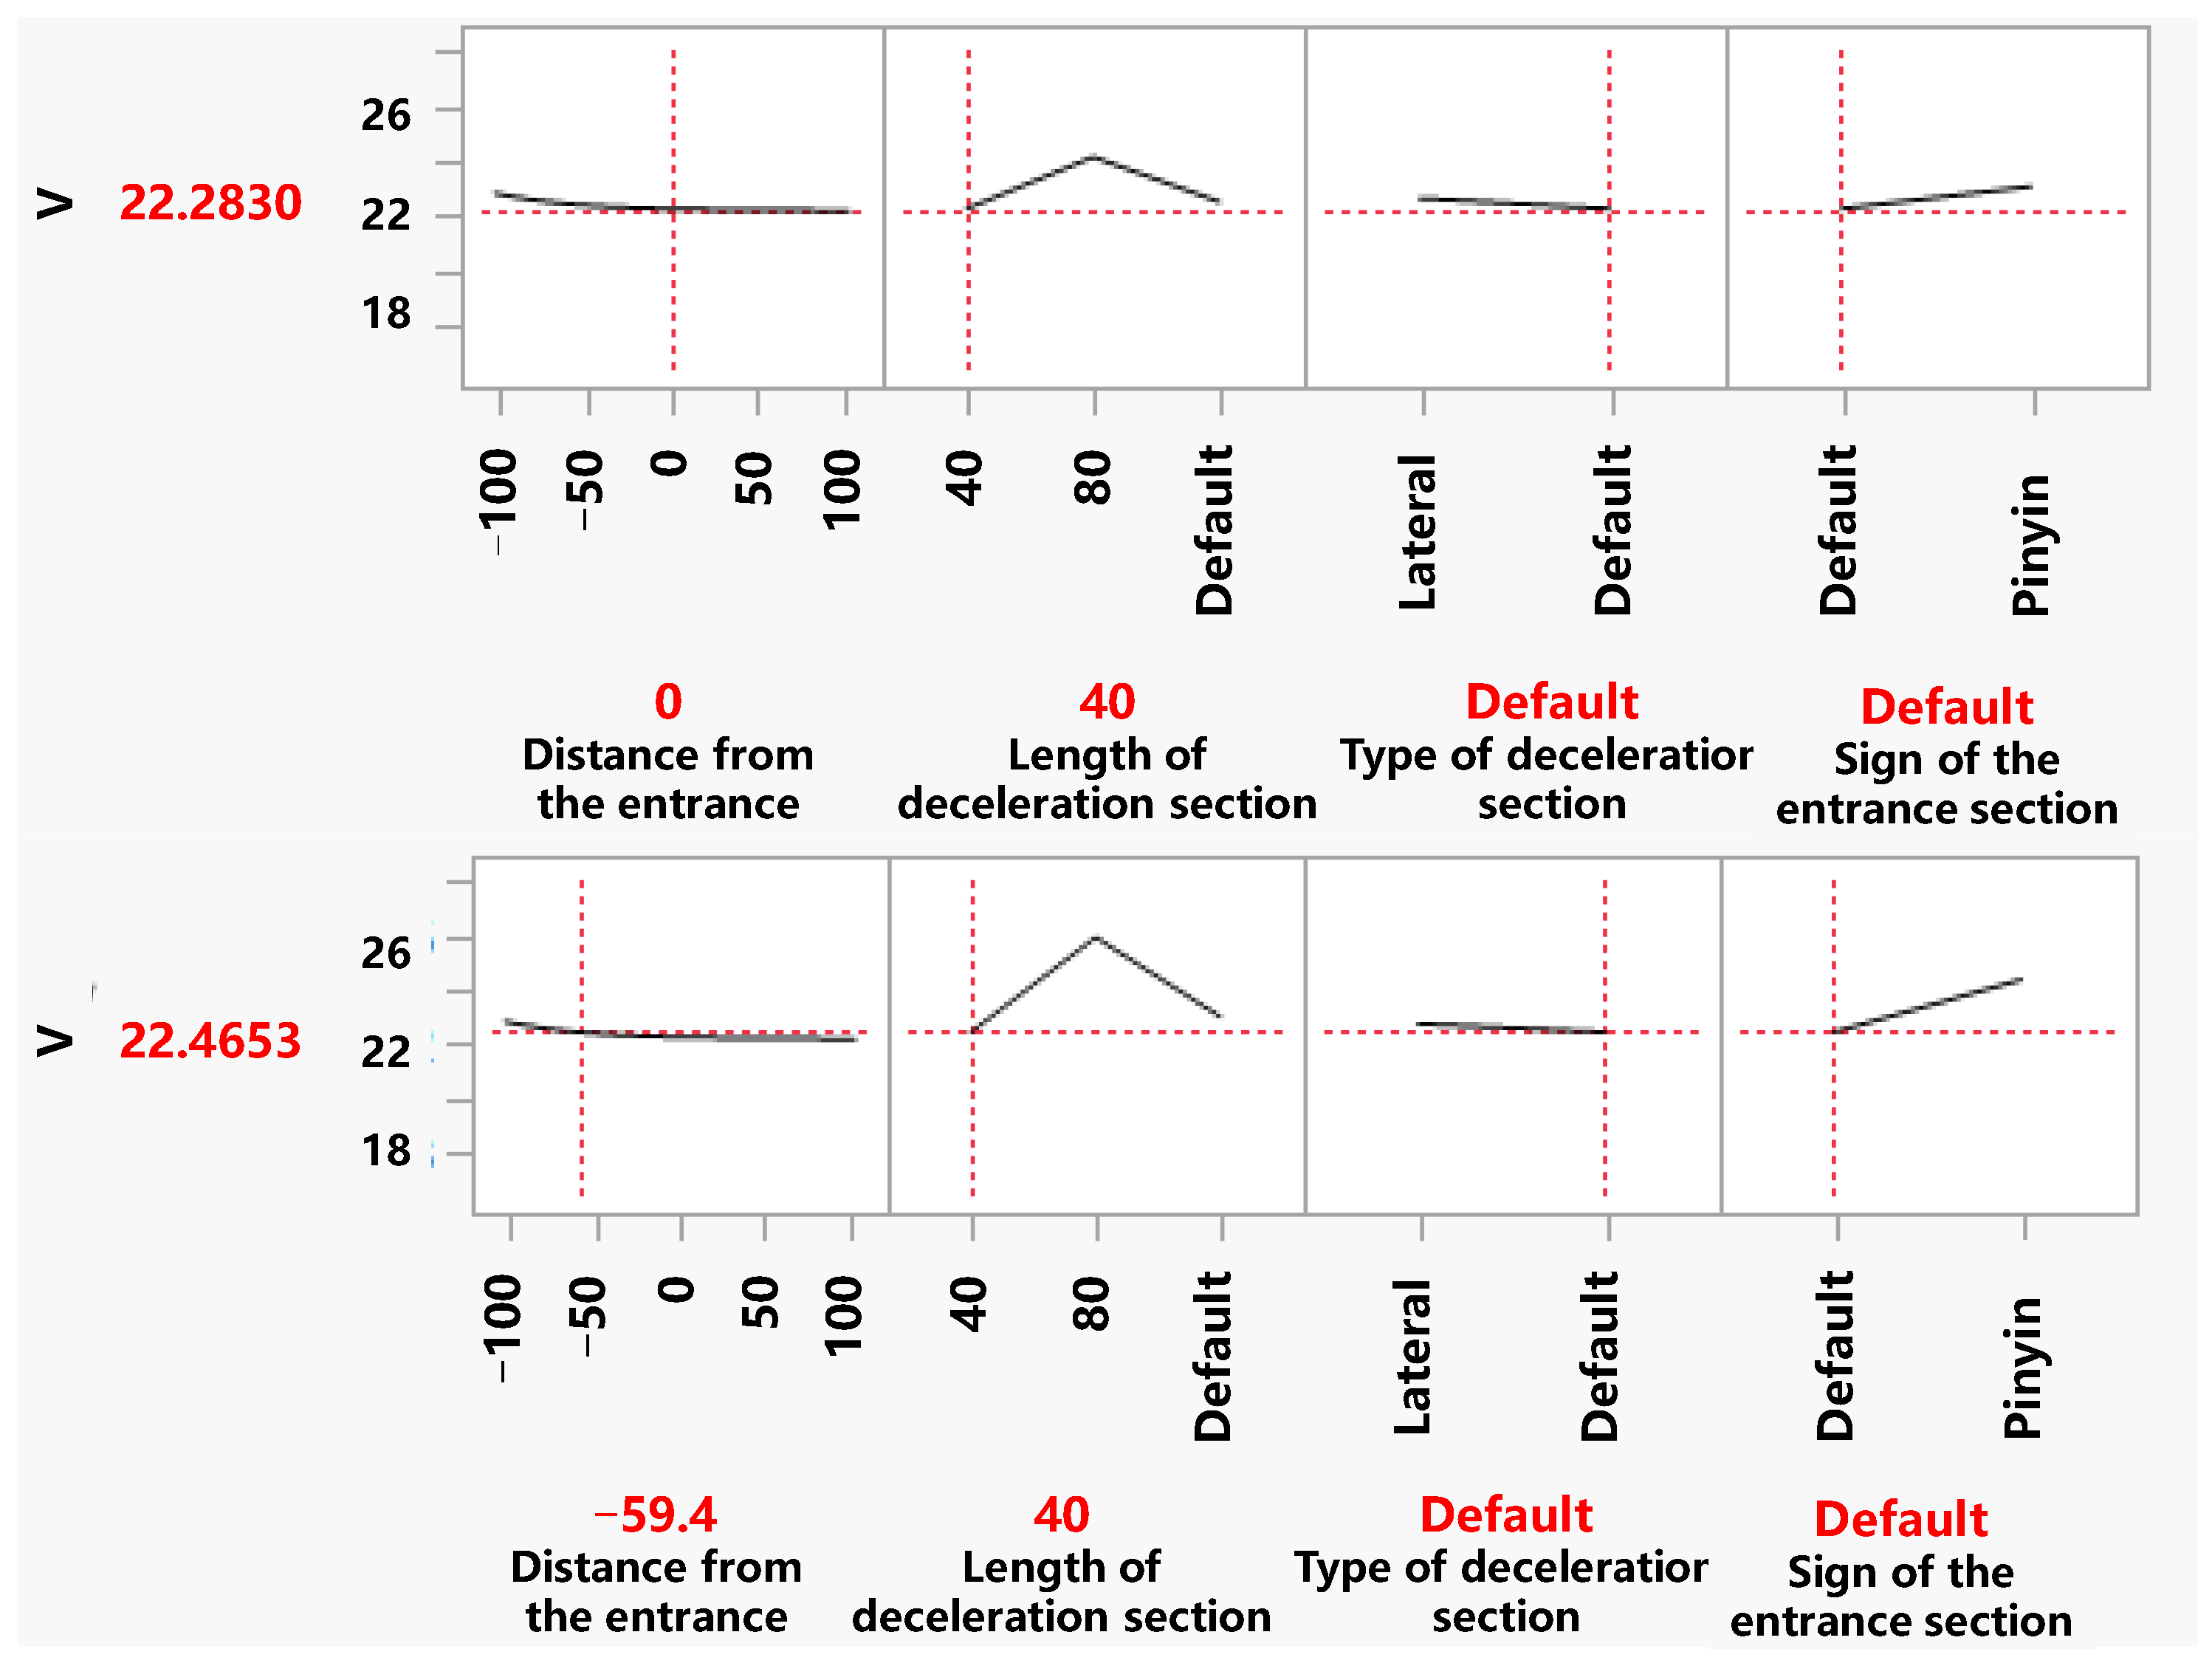
3.1. Driving Safety Analysis

Data mining analysis was carried out on the influencing factors of driving safety in the entrance segments of the 10 schemes. An effect analysis was first carried out, as shown in Table 7, and the results of the decision tree analysis are shown in Figure 4.
As can be seen, the average speed of the entry sign after the pinyin annotation was changed from 23.85 to 24.62, which does not indicate an excellent slowing effect. The change in the type and length of the deceleration section did not achieve a good effect. In addition, compared to the other influencing factors, the influence of the wall color on the speed of the entrance section was also not evident. However, it is still unclear whether the default length of the deceleration segment is better than reducing the deceleration segment length to 40 m. We further analyzed the influence of the deceleration section length, and the analysis results of the neural network are shown in Figure 5. After the relationship of the neural network was determined, the speed was analyzed by the predictive profiler. Its main function is to train the neural network model so that the model learns the speed data collected at a frequency of 20 Hz in the entrance segment, so that it can predict the speed trend in other cases in the future. It can be seen that the scheme that increases the length of the deceleration section had the maximum speed of 50 m after entering the UI entrance, indicating that the driver is more likely to drive at a faster speed than in the other schemes after a long deceleration section. At the entrance, the changes in the deceleration section type and entrance sign did not have a significant effect on speed, and the length of 40 m and the default 60 m deceleration section achieved a better deceleration effect than 80 m. Based on this, for the setting of the entrance section, it is recommended to maintain the default settings of the type of deceleration section and the entrance sign but to adjust the length of the deceleration section from 60 m to 40 m.
Other segments were analyzed using the CART decision tree, and the obtained results are shown in Figure 6. For the DC1 section, the mean speed decreased from 19.84 to 18.44 after adding road information, indicating that this helped the drivers to pass the DC1 section at a lower and safer speed. For the DC2 section, the mean lateral acceleration of the driver increased from 0.21 to 0.5 after adding the side-approach reminder. This shows that within the scope of not affecting the driver’s comfort, the addition of side-approach reminders can increase the driver’s alertness, improve the steering wheel operation frequency, and thus, improve driving safety. For the exit section, the first node of the CART decision tree was grouped according to the wall color, and the scheme with the white ceiling and white, blue, and white had a smaller average speed in the exit section. For lateral acceleration, the first node of the CART decision tree was grouped according to the wall color. In the default scheme, the lateral acceleration of the wall color relative to the other two schemes was higher in the DC1, and the standard deviation was larger. The vehicle’s lateral acceleration in the flat curve section was positively correlated with the lateral offset in pairs. When the vehicle’s lateral acceleration was too large, the lateral offset of the vehicle had further increasing trend. To control the vehicle along a safe track, the driver needs to carry out more tasks, increasing the complexity of driving operations. This will lead to an increase in the driver’s risk factor, which will lead to a decrease in the safety of driving.

3.2. Driving Comfort Analysis

In the basic section, which occupies most of the road sections, there are fewer accidents than in the other sections. The main consideration is driving comfort, which is mainly reflected by the stability of the driving speed. We used acceleration interference to evaluate the size of the speed change in a period of time, and the results are shown in Table 8. As can be seen, scheme 2 had the lowest acceleration interference, indicating that the black ceiling and the white–blue–white wall can increase the driver’s driving stability. This is because the darker tone of black has a strong ability to absorb light, which is less likely to cause visual fatigue in the case of long-distance driving. In addition, the black ceiling can also prevent reflection, reducing the driver’s visual interference, and thereby, improving the driving comfort.
Finally, the steering wheel comfort loss value was used to evaluate the comfort of the overall driving experience, as shown in Table 9. It can be seen that the minimum average comfort loss was 0.1679; that is, the adjustment of the deceleration section length to 40 m in scheme 6 was the most comfortable in terms of steering wheel torque as a whole.
Scheme 8 had the highest number of traffic safety facilities; although the driving safety is higher, the superfluous operations during the driving process affects the driver’s driving comfort. This shows that it is impossible to increase the settings of traffic safety facilities unquestioningly, and it is necessary to consider the drivers’ driving comfort to ensure the safety of the UI.

4. Conclusions

This study obtained driving data through BIM modeling combined with a driving simulation procedure. We adopted a data mining method to study the influence of different facility settings on the safety and comfort of UIs. The conclusions are as follows:
(1)
The length of the deceleration section should be adjusted from 60 m to 40 m, which can not only meet the deceleration effect of the entrance but can also make people feel more comfortable;
(2)
Setting up the road sign information at the DC section and the reminder for side-approaching cars at the DC section can improve the safety of driving;
(3)
The ceiling should be white, and the side walls should be white and blue, which can reduce the speed change in most sections of the underground interchange and increase the driving stability of the driver. For the basic section, a black ceiling instead of a bright color can reduce visual fatigue and glare caused by wall reflections, thus improving driving comfort.
(4)
When the driving comfort of a UI was studied from the perspective of comfort loss value, it was found that although the driver’s driving safety was high, the driving comfort was affected when too many traffic safety facilities were set up. Therefore, to explore the comprehensive evaluation of driving safety and comfort in underground interchanges, other methods must be used for evaluation.
This study provides a valuable reference for the design optimization of UI traffic security facilities, which can improve driving safety and maximize driving comfort.

Author Contributions

Conceptualization, Z.L. and X.G.; methodology, Z.L. and Q.Y.; software, Q.Y. and A.W.; formal analysis, Z.L. and X.G.; investigation, Z.L., Q.Y. and A.W.; resources, Z.L. and Q.Y.; writing—original draft preparation, Z.L. and Q.Y.; writing—review and editing, Z.L., Q.Y. and A.W.; supervision, X.G. All authors have read and agreed to the published version of the manuscript.

Funding

This research received no external funding.

Data Availability Statement

The data presented in this study are available upon request from the corresponding author.

Conflicts of Interest

Author Anlue Wang was employed by the company BYD Company Limited. The remaining authors declare that the research was conducted in the absence of any commercial or financial relationships that could be construed as a potential conflict of interest.

References

  1. Liu, Z.; Gu, X.; Hong, R. Fire Protection and Evacuation Analysis in Underground Interchange Tunnels by Integrating BIM and Numerical Simulation. Fire 2023, 6, 139. [Google Scholar] [CrossRef]
  2. Ding, J. Analysis on the Safety of Expressway Interchange. J. World Archit. 2021, 5, 5–8. [Google Scholar] [CrossRef]
  3. Pan, F.; Yang, Y.; Zhang, L.; Yang, X.; Yang, J.; Liu, M. Analysis of EEG characteristics of drivers at the entrance and exit of an undersea tunnel and research on driving safety. Int. J. Saf. Secur. Eng. 2021, 11, 155–165. [Google Scholar] [CrossRef]
  4. Liu, Z.; Gu, X.; Ren, H.; Li, S.; Dong, Q. Permanent Deformation Monitoring and Remaining Life Prediction of Asphalt Pavement Combining Full-Scale Accelerated Pavement Testing and FEM. Struct. Control Health Monit. 2023, 2023, 6932621. [Google Scholar] [CrossRef]
  5. Luo, Y.; Wan, Y. Analysis on Safety Influencing Factors on Highway Interchange Design. J. Archit. Res. Dev. 2022, 6, 27–32. [Google Scholar] [CrossRef]
  6. Bassan, S. Sight distance and horizontal curve aspects in the design of road tunnels vs. highways. Tunn. Undergr. Sp. Technol. 2015, 45, 214–226. [Google Scholar] [CrossRef]
  7. Scott, P.; Charters, D.; Faller, G. Underground road interchanges: Assessing options and reducing risk. Tunn. Manag. Int. 2005, 8, 30–37. [Google Scholar]
  8. Lee, I.-B.; Kim, N. A Study on Safe Separation Distance between Tunnel and Interchange. KSCE J. Civ. Environ. Eng. Res. 2019, 39, 273–279. [Google Scholar]
  9. Hsu, C.-C.; Chuang, K.-H. Traffic and Environmental Cues and Slow-Down Behaviors in Virtual Driving. Percept. Mot. Ski. 2016, 122, 101–122. [Google Scholar] [CrossRef]
  10. Zhang, C. Net Distance between an Urban Road Grade Crossing and a Tunnel. J. Highw. Transp. Res. Dev. 2017, 11, 85–89. [Google Scholar] [CrossRef]
  11. Zotic, V.; Alexandru, D.-E.; Egresi, I.O. Road Safety in the Romanian Cities. A Study on Urban Traffic Crashes. J. Settl. Spat. Plan. 2021, 12, 131. [Google Scholar] [CrossRef]
  12. Liu, Z.; Dong, Q.; Gu, X. Permanent deformation evaluation and instability prediction of semi-rigid pavement structure using accelerated pavement testing and finite element method. J. Test. Eval. 2024, 52, JTE20230209. [Google Scholar] [CrossRef]
  13. Wan, X.; Shao, M.; Sun, L. A Study on the Features of Traffic Flow at Ieft-side Merging Areas of Urban Freeways. J. Transp. Inf. Saf. 2016, 34, 117–122. [Google Scholar]
  14. Wang, E.; Huang, B.; Liu, B. Traffic Flow Characteristics and Vehicle Road Coordination Improvement in Subterranean Interweaving. In International Conference on Artificial Intelligence and Logistics Engineering; Springer: Cham, Switzerland, 2023; pp. 14–24. [Google Scholar]
  15. Zhu, J.; Chen, F.; Wang, Z.; Hu, F. Research on Optimization Design of Underground Interchange Ramp Radius Based on Driving Simulation. CICTP 2019, 2019, 6274–6286. [Google Scholar]
  16. Yeung, J.S.; Wong, Y.D. Road traffic accidents in Singapore expressway tunnels. Tunn. Undergr. Sp. Tech. 2013, 38, 534–541. [Google Scholar] [CrossRef]
  17. Chen, Y.R.; Zheng, S.W. Mechanism analysis of vehicle operating characteristic affected by visual environment of underground road. J. Tongji Univ. 2013, 41, 1031–1039. [Google Scholar] [CrossRef]
  18. Papantoniou, P.; Papadimitriou, E.; Yannis, G. Review of driving performance parameters critical for distracted driving research. Transp. Res. Procedia 2017, 25, 1796–1805. [Google Scholar] [CrossRef]
  19. Bobermin, M.P.; Silva, M.M.; Ferreira, S. Driving simulators to evaluate road geometric design effects on driver behaviour: A systematic review. Accid. Anal. Prev. 2021, 150, 105923. [Google Scholar] [CrossRef]
  20. Hou, Y.; Zhao, Y.; Hulme, K.F.; Huang, S.; Yang, Y.; Sadek, A.W.; Qiao, C. An integrated traffic-driving simulation framework: Design, implementation, and validation. Transp. Res. Part C Emerg. Technol. 2014, 45, 138–153. [Google Scholar] [CrossRef]
  21. Siedlecka, J.; Bortkiewicz, A. Driving simulators in risk assessment of traffic accident among drivers with obstructive sleep apnea. Med. Pr. 2012, 63, 229–236. [Google Scholar]
  22. Meng, F.; Wong, S.; Yan, W.; Li, Y.; Yang, L. Temporal patterns of driving fatigue and driving performance among male taxi drivers in Hong Kong: A driving simulator approach. Accid. Anal. Prev. 2019, 125, 7–13. [Google Scholar] [CrossRef]
  23. Li, L.; Tian, S.; Zhou, W.; Wang, F. Application of driving simulators in the validation test for vehicle active safety system. Int. J. Crashworthiness 2023, 28, 159–169. [Google Scholar] [CrossRef]
  24. Ezzati Amini, R.; Al Haddad, C.; Batabyal, D.; Gkena, I.; de Vos, B.; Cuenen, A.; Brijs, T.; Antoniou, C. Driver distraction and in-vehicle interventions: A driving simulator study on visual attention and driving performance. Accid. Anal. Prev. 2023, 191, 107195. [Google Scholar] [CrossRef]
  25. Zhang, L.; Wu, Y.; Wang, S.; Shi, J. Analysis and Modeling of Speed Perception Sensitivity of Drivers on Underground Expressways. J. Tongji Univ. Nat. Sci. 2023, 51, 83–90. [Google Scholar]
  26. Huang, Y.; Chen, F.; Song, M.; Pan, X.; You, K. Effect evaluation of traffic guidance in urban underground road diverging and merging areas: A simulator study. Accid. Anal. Prev. 2023, 186, 107036. [Google Scholar] [CrossRef] [PubMed]
  27. Ernst, S.; Patel, M.; Capers, H.A.; Dwyer, D.; Hawkins, C.; Jakovich, G.S.; Lupton, W.; Margro, T.; Ralls, M.L.; Rohena, J. Underground Transportation Systems in Europe: Safety, Operations, and Emergency Response; Federal Highway Administration, Office of International Programs: Alexandria, VA, USA, 2006. [Google Scholar]
  28. Wei, T.; Wei, W.; Li, H.; Liu, H.; Zhu, T.; Liu, F. An Analysis of Driving Behavior Model and Safety Assessment Under Risky Scenarios Based on an XGBoost Algorithm. J. Transp. Inf. Saf. 2022, 40, 53–60. [Google Scholar]
  29. Liu, Y. A study on merging and diverging area design for urban underground expressway. Procedia Eng. 2016, 165, 175–183. [Google Scholar] [CrossRef]
  30. Yuan, S.; Jing, X.; Shi, C. Traffic Capacity Calculation for Urban Underground Interchange. J. Tongji Univ. Nat. Sci. 2021, 49, 236–242. [Google Scholar]
  31. Liu, Z.; Gu, X. Performance evaluation of full-scale accelerated pavement using NDT and laboratory tests: A case study in Jiangsu, China. Case Stud. Constr. Mat. 2023, 18, e02083. [Google Scholar] [CrossRef]
  32. Sun, Y.; Zhou, J.; Gong, D.; Ji, Y. Study on multi-degree of freedom dynamic vibration absorber of the car body of high-speed trains. Mech. Sci. 2022, 13, 239–256. [Google Scholar] [CrossRef]
  33. Sun, L.; Gu, X.; Hu, D.; Zhou, Z.; Wang, G. Anti-aging mechanism and rheological properties of lignin, quercetin, and gallic acid as antioxidants in asphalt. Constr. Build. Mater. 2023, 369, 130560. [Google Scholar] [CrossRef]
  34. Liu, S.; Huang, H. The Control Standard for Settlement of Pavement Based on the Model of Acceleration Interference. Acad. J. Sci. Technol. 2022, 1, 47–52. [Google Scholar] [CrossRef]
  35. Uchino, D.; Hira, T.; Ogawa, K.; Ikeda, K.; Kato, T.; Endo, A.; Kato, H.; Narita, T. Effect of steering reaction torque of ultra-compact electric vehicle on steering burden for active steering wheel system. Int. J. Appl. Electromagn. Mech. 2023, 71, S363–S371. [Google Scholar] [CrossRef]
  36. Ma, S.; Hu, J.; Ma, E.; Li, W.; Wang, R. Cluster Analysis of Freeway Tunnel Length Based on Naturalistic Driving Safety and Comfort. Sustainability 2023, 15, 11914. [Google Scholar] [CrossRef]
  37. Jiangbi, H.; Meijie, Z. The Length Definition of the Expressway Tunnel Based on Driving Safety and Comfort. In Proceedings of the 2010 International Conference on Optoelectronics and Image Processing, Haikou, China, 11–12 November 2010; pp. 557–560. [Google Scholar]
  38. Liu, Z.; Chen, Y.H.; Gu, X.Y.; Yeoh, J.K.W.; Zhang, Q.P. Visibility classification and influencing-factors analysis of airport: A deep learning approach. Atmos. Environ. 2022, 278, 119085. [Google Scholar] [CrossRef]
  39. Liu, Z.; Zhou, Z.; Gu, X.; Sun, L.; Wang, C. Laboratory evaluation of the performance of reclaimed asphalt mixed with composite crumb rubber-modified asphalt: Reconciling relatively high content of RAP and virgin asphalt. Int. J. Pavement Eng. 2023, 24, 2217320. [Google Scholar] [CrossRef]
  40. Analysis of Variance (ANOVA). Rank-Based Methods for Shrinkage and Selection; John Wiley & Sons: Hoboken, NJ, USA, 2022; pp. 149–190. [Google Scholar] [CrossRef]
  41. Liu, Z.; Gu, X.; Chen, J.; Wang, D.; Chen, Y.; Wang, L. Automatic recognition of pavement cracks from combined GPR B-scan and C-scan images using multiscale feature fusion deep neural networks. Autom. Constr. 2023, 146, 104698. [Google Scholar] [CrossRef]
  42. Liu, Z.; Yang, Q.; Gu, X. Assessment of Pavement Structural Conditions and Remaining Life Combining Accelerated Pavement Testing and Ground-Penetrating Radar. Remote Sens. 2023, 15, 4620. [Google Scholar] [CrossRef]
  43. Wang, R.; Bian, J.; Nie, F.; Li, X. Nonlinear Feature Selection Neural Network via Structured Sparse Regularization. IEEE Trans. Neural Netw. Learn. Syst. 2023, 34, 9493–9505. [Google Scholar] [CrossRef]
  44. Satoh, S.; Yamagishi, K.; Takahashi, T. Comparing feedforward neural networks using independent component analysis on hidden units. PLoS ONE 2023, 18, e0290435. [Google Scholar] [CrossRef]
Figure 1. Three-dimensional scene of UI: (a) 3D modeling and (b) driving simulation scenario.
Infrastructures 09 00028 g001
Figure 2. Driving scenario of test personnel in driving simulation experiment.
Infrastructures 09 00028 g002
Figure 3. Area division of underground interchange: (a) entrance, (b) DC1, (c) DC2, and (d) exit.
Infrastructures 09 00028 g003
Figure 4. CART analysis results of the entrance section.
Infrastructures 09 00028 g004
Figure 5. Prediction results of neural network under different entrance distances of entrance segment.
Infrastructures 09 00028 g005
Figure 6. CART analysis results: (a) V of DC1, (b) a of DC2, and (c) V of exit section.
Infrastructures 09 00028 g006
Table 1. Design parameters of the underground interchange.
Design ParametersValues
Types of underground interchangeSix lanes, two ways, two entrances
Speed of vehicle (km/h)60 to 80
Length (km)2.5
Net height (m)5
Single-lane width (m)3.75
Road alignmentThe whole process is mainly linear, including part of the curve section, a diversion port, and a confluence port
Table 2. Original design of the UI safety facilities.
Facility TypesDesign Schemes
ColorWalls change from white to blue to white, with a black ceiling
Deceleration section at entranceLongitudinal deceleration mark, length of 60 m, gradient section of 30 m
Sign at entrance sectionBlue on white; top half: speed limit and reminder to use headlights; bottom half: road name
Sign at exit sectionConfirmation signs are set up at the diversion point, and exit warning signs are set up at 500 m, 1000 m, and 2000 m before the diversion point
Sign for diversion and confluence: Section 1 (DC1)Two of them on the right side of the road, 10 m and 50 m before DC1
Sign for diversion and confluence: Section 2 (DC2)Two of them on the right side of the road, 10 m and 50 m before DC2
Table 3. Optimized designs of the UI safety facilities.
NumberSign at Entrance SectionSign at Exit SectionDiversion 1Confluence 2Wall ColorTypes of Deceleration SectionLength of Deceleration Section
1Chinese
character
DefaultDefaultDefaultDefaultDefaultDefault
2Chinese
character
DefaultDefaultDefaultWalls change from white to blue to white, with a white ceilingDefaultDefault
3Chinese
character
DefaultDefaultDefaultWalls change from white to white to blue, with a black ceilingDefaultDefault
4Chinese
character
DefaultDefaultDefaultDefaultTransverseDefault
5Chinese
character
DefaultDefaultDefaultDefaultDefault80
6Chinese
character
DefaultDefaultDefaultDefaultDefault40
7Chinese
pinyin
DefaultDefaultDefaultDefaultDefaultDefault
8Chinese
character
Add a sign 250 m from the exitDefaultDefaultDefaultDefaultDefault
9Chinese
character
DefaultAdd road informationDefaultDefaultDefaultDefault
10Chinese
character
DefaultDefaultAdd a side-approach reminderDefaultDefaultDefault
Table 4. Section division of the scheme design.
SectionKey Point PositionSection Range
Entrance(−9, −265)100 m in front of entrance and 50 m behind entrance: (−15, −365) to (−6, −215)
DC1(48, 167)50 m before and after the DC1: (23, 124) to (83, 203)
DC2(163, 270)50 m before and after the DC2: (124, 237) to (202, 302)
Exit(458, 490)50 m before and after the exit: (416, 462) to (503, 514)
Table 5. Statistical description of continuous variables.
TypeMean
Values
Standard
Deviation
Standard Error
of the Mean
Upper 95%
Confidence Limit
Lower 95%
Confidence Limit
V21.7821.787.6840.0166221.82
a−0.1036−0.10361.4380.003111−0.09748
Gp0.18490.18490.24120.00052190.1859
a ¯ :−0.2993−0.29931.0470.002062−0.2952
m0.28620.28621.2420.0026870.2914
σ0.97030.97030.47860.067691.106
l0.18730.18730.082820.011710.2109
Table 6. Statistical description of nominal variables.
Nominal VariablesDesign Schemes
Types of deceleration sectionLongitudinal, lateral
Length of deceleration section40 m, 60 m, 80 m
Sign at entrance sectionDefault, add information
Sign at exit sectionDefault, add density
DC1Default, add a side approach reminder
DC2Default, add road section information
Wall colorDefault, the walls are white, blue, and white with a white ceiling; the walls are white, white, and blue with a black ceiling
Table 7. Effect analysis results.
VariablesV of Entrance SectionV of DC 1 Sectiona of Entrance SectionV of Exit Section
Sign at entrance section<0.0001 <0.0001 0.0067 <0.0001
Length of deceleration section<0.0001 <0.0001 <0.0001 <0.0001
Type of deceleration section<0.0001 0.7628<0.0001 <0.0001
Wall color<0.0001 0.0254 <0.0001 <0.0001
DC1 <0.0001 0.353<0.0001
DC2 <0.0001 0.0005
Sign at exit section <0.0001
Table 8. Acceleration interference values in the basic section.
Variables12345678910
σ (m/s2)1.571.391.811.761.921.931.691.731.671.58
Table 9. Values of comfort loss of steering wheel in the basic section.
Variables12345678910
l0.1870.1920.1690.1730.1680.1680.2010.2300.2050.182
Disclaimer/Publisher’s Note: The statements, opinions and data contained in all publications are solely those of the individual author(s) and contributor(s) and not of MDPI and/or the editor(s). MDPI and/or the editor(s) disclaim responsibility for any injury to people or property resulting from any ideas, methods, instructions or products referred to in the content.

