Article

Conceptual Design of Public Charging Stations for Freight Road Transport

Faculty of Transportation Sciences, Czech Technical University in Prague, 166 36 Prague, Czech Republic
*
Author to whom correspondence should be addressed.
Infrastructures 2024, 9(1), 7; https://doi.org/10.3390/infrastructures9010007
Submission received: 27 October 2023 / Revised: 17 December 2023 / Accepted: 24 December 2023 / Published: 27 December 2023
(This article belongs to the Special Issue Sustainable and Digital Transformation of Road Infrastructures)

Abstract

:
We present a comprehensive methodology for a two-step approach to address the task at hand. The first step involves the optimal placement of charging stations, while the second step focuses on determining the necessary capacity of the charging stations based on traffic factors. This methodology is applicable to countries, states, or specific areas where the placement and optimization of charging stations for truck road transport are being considered. We identify the key inputs required for solving such a task. In the results section, we demonstrate the outcomes using a model example for the Czech Republic.

1. Introduction

This article is focused on developing a methodology for the placement of charging stations for battery electric freight trucks (CHS). The specific task at hand involves designing charging stations with parameters different from those used for personal transportation, where demands on parking spaces and charging power of charging stands are lower, while facilities and services are planned for a higher number of people. Principles for the planning of public charging infrastructure for personal battery electric vehicles (BEV), including a literature review, are discussed, e.g., in [1,2]. Detailed technical guidelines are provided in [3].
Given that freight transportation entails distinct traffic patterns and typically covers larger distances, the allocation problem for locating these charging stations becomes a novel and specific challenge. Currently, almost no publicly accessible infrastructure for heavy-duty electric vehicles is available in the European Union. The most advanced exception is a 600-km road stretch between the Rhine-Neckar and Rhine-Ruhr metropolitan areas in Germany, built to boost the logistical sector along one of the busiest freight routes in Europe. Till the end of the year 2023, it is supposed to contain eight ultra-fast public charging locations.
Considering the commitment of countries to reduce CO2 emissions, a shift in traction within the freight truck industry can help achieve these goals. However, the “chicken-and-egg” problem persists in implementing electric freight transportation. This problem arises from carriers’ reluctance to invest in electric freight vehicles due to the lack of an adequate charging network. Simultaneously, private operators hesitate to invest in charging stations as there is currently no demand. Thus, the role of the government appears indispensable in facilitating the establishment of charging stations. Since the impetus for change comes from a higher level, namely the state, it is possible to plan and execute it optimally.
Consequently, in this case, the placement of charging stations should not be random, based solely on available space, but rather systematically designed to ensure maximum coverage of existing transportation flows in the automotive freight industry. This entails locating the minimum number of stations with sufficient capacity to achieve the desired coverage. Recently, several studies have been published aimed at the design of future charging infrastructure for electric road freight transport. Speth et al. [4] use traffic count data as input and combine them with on-site queueing models to obtain a fast-charging network in Germany with a 100 km distance between locations. Speth et al. [5] define a network of stations on a European highway network based on synthetic transport flow data. However, the location selection does not take into account the suitability of the location for a charging area. We find it important to incorporate more inputs, including parking area availability, power grid connection, and other aspects of the analysis.
To address the task at hand, we present a comprehensive methodology for a two-step approach. The first step involves the optimal placement of charging stations in three stages corresponding to the years 2025, 2030, and 2035. The first two stages are based on the Alternative Fuel Infrastructure Regulation (AFIR) [6], which requires charging stations for freight vehicles in urban nodes and at regular intervals along the TEN-T road network. The last stage, corresponding to the original proposal of AFIR by the European Commission [7,8] and the broadened version proposed by the European Parliament for trilogue negotiations), concludes the basic coverage of the whole network.
The second step of the methodology focuses on determining the necessary capacity and other parameters of the charging stations based on data related to traffic in the catchment area, the specific electricity consumption of considered types of vehicles under the given conditions, the ratio of BEV and the ratio of public charging, parameters of BEV, charging outlets and data on the electrical network. Sources for this data depend on available information in the investigated country/region. For the model example of the Czech Republic discussed in Section 2.2, data on traffic were obtained from the national traffic census [9], which provides traffic intensities of various types of vehicles (including five different categories of freight vehicles above 3.5 t) on work/weekend days, day/night-time, peak periods etc. This census data also includes geographic information on individual segments, allowing for the computation of traffic output (vehicle-kilometers per day) on main and other routes in catchment areas of particular stations, used subsequently for the assessment of the number of charging vehicles and their output [10]. Further, the document [11] provides data on daily, weekly, and yearly variations of traffic intensities.
To assess the specific electricity consumption of different types of vehicles in the conditions of the Czech Republic, the set of open simulation programs SUMO (Simulation of Urban Mobility), together with its extension PHEM, was used for modeling a substantial part of the traffic network in the Czech Republic, simulation of traffic flows and calculation of energy and fuel consumption for present types of vehicles and for various possible future scenarios [12]. Other approaches can also be used, as described e.g., in [13]. The assessment of spatial requirements was based on data from Technical Conditions 171 [14], including dimensions of vehicles from considered categories and the norm [15] specifying minimal distances between parked vehicles. The estimation of the ratio of BEV and the need for public charging is based on scenarios discussed in studies [16,17] that also take into account statistics of trip lengths in different countries. This ratio includes the fact that vehicles use the energy earned from depot chargers to get to the highway network, and vice versa; returning to the depot can be connected with a battery depletion even below a level that is safe for travel on highways. Data on the electric network and available capacity of transformer stations were obtained from electricity providers (ČEZ distribuce, PRE distribuce, and EG.D.).
The proposed methodology determines the course of the required power, load diagrams, numbers and occupancy of charging outlets, and space requirements of the charging infrastructure stations. It also evaluates free distribution capacity and specifies the choice of the station battery. It is applicable to countries, states, or specific areas where the placement and optimization of charging stations for truck road transport are being considered. We identify the key inputs required for solving such a task. In the results section, we demonstrate the outcomes using a model example for the Czech Republic.

2. Methods

The conceptual design of truck charging stations presented in this paper consists of two main steps: Expert design of the location of charging stations in the network (see Section 2.1) and power and spatial needs calculation based on traffic demands for individual charging stations (see Figure 1 and Section 2.2).
The fundamental aspect of a charging station is its location. In a given area, the total traffic in all directions is considered. Free transformer capacity of the nearest very high/high-voltage transformer station is then found.
The methodology uses vehicle categories monitored by the national traffic census [9]. The relevant categories for heavy road transport are SN, SNP, TN, TNP, and NSN; these categories cover the categories N2 and N3 according to European directive 2007/46/ES.

2.1. Location of Charging Stations

The placement of charging stations is based on the legislative package of the European Commission Fit for 55, in particular, the amendments to the legislation in the field of freight transport on land communications, which obliges individual member states to create a basic network of charging stations for freight transport. According to the proposal of the European Commission for the year 2021 [7], publicly accessible charging stations for freight transport are to be deployed on the roads of the Core TEN-T network at maximum distances of 60 km and in important urban nodes by the end of the year 2025. In the second stage, by the end of the year 2030, charging stations on the Comprehensive TEN-T is to be built at a maximum distance of 100 km, and the performances of the stations on the Core TEN-T are to be strengthened. In the third stage, the performances of the stations on the Comprehensive TEN-T network are also to be strengthened. The new version of AFIR [6] accepted in 2023 requires the deployment of charging stations along at least 15% of the length of the TEN-T road network till 2025 and 50% till 2027.
To satisfy the requirements as well as to cover the area, the target distances of ca. 50 km are considered. We are convinced that we cannot rely on the expectation of a significant breakthrough in the volume and mass capacity of charging cells in the near future, and a higher density of charging stations is necessary to ensure truly safe charging for freight transport throughout the country.
Besides the legislative conditions, the methodology is based on a detailed overview of all rest stops on the European TEN-T network (in the considered country/region), including stationing, the capacity of parking spaces for trucks and possibilities of its extension, the connection of directions, the existence, the size and the possibility of extension of electrical connection, distances from nearby charging stations, including those on other roads, and the existence of facilities for the driver or the possibility of their additional construction.
Charging stations are lined up at indicated distances on the respective main roads, with the lining up starting at the main communication hubs of city centers, especially Prague and Brno. This also corresponds to the requirement of deploying charging stations in important urban nodes in the first stage. Charging stations for the city center and the first charging points of the TEN-T network are located on city bypasses. These stations often overlap or are located at minimum distances. For example, Prague is the main communication hub of the republic; the stations are located at the exits from Prague at the rest stops on the D1, D11, D8, and D5 highways as Core TEN-T roads, as close as possible to the Prague Ring Road D0. Additional charging stations on the Core TEN-T follow every 50 km from these first charging stations. For the location of charging stations on the TEN-T comprehensive, the length of the Prague Ring Road, approx. 88 km, must be considered; the circuit is divided by stations into four approximately equal, 22 km long sections. This distance must be taken into account when leaving the circuit on the radials of the Comprehensive TEN-T network. The first charging stations on the Comprehensive TEN-T starting from Prague are, therefore, approximately 30 km from the Prague Ring Road. Furthermore, they are, of course, at distances of 100 and 50 km, respectively. On the other hand, the stations have to cover the network up to the frontiers, facilitating the transfer between neighboring countries (in any case, the distance of the last station from the frontiers should be smaller than 30 km); in the model example of the Czech Republic, this distance was minimized.

2.1.1. Phase 1: Urban Nodes and Core TEN-T

The location of charging stations on the Core TEN-T network (marked in blue) is based on urban nodes where the charging stations (marked in red in Figure 2) are expected to be built by 2025.
Due to the closeness of the deadline of the first phase, the uncertainty regarding the supply of electric vehicles and their price, and the uncertainty regarding the availability and price of electricity, it is proposed to split the construction of stations on the Core network into the first two stages. Thus, in the first stage, a network of charging stations for Core TEN-T would be built, but at distances of 100 km, which still meets the requirements of [6].

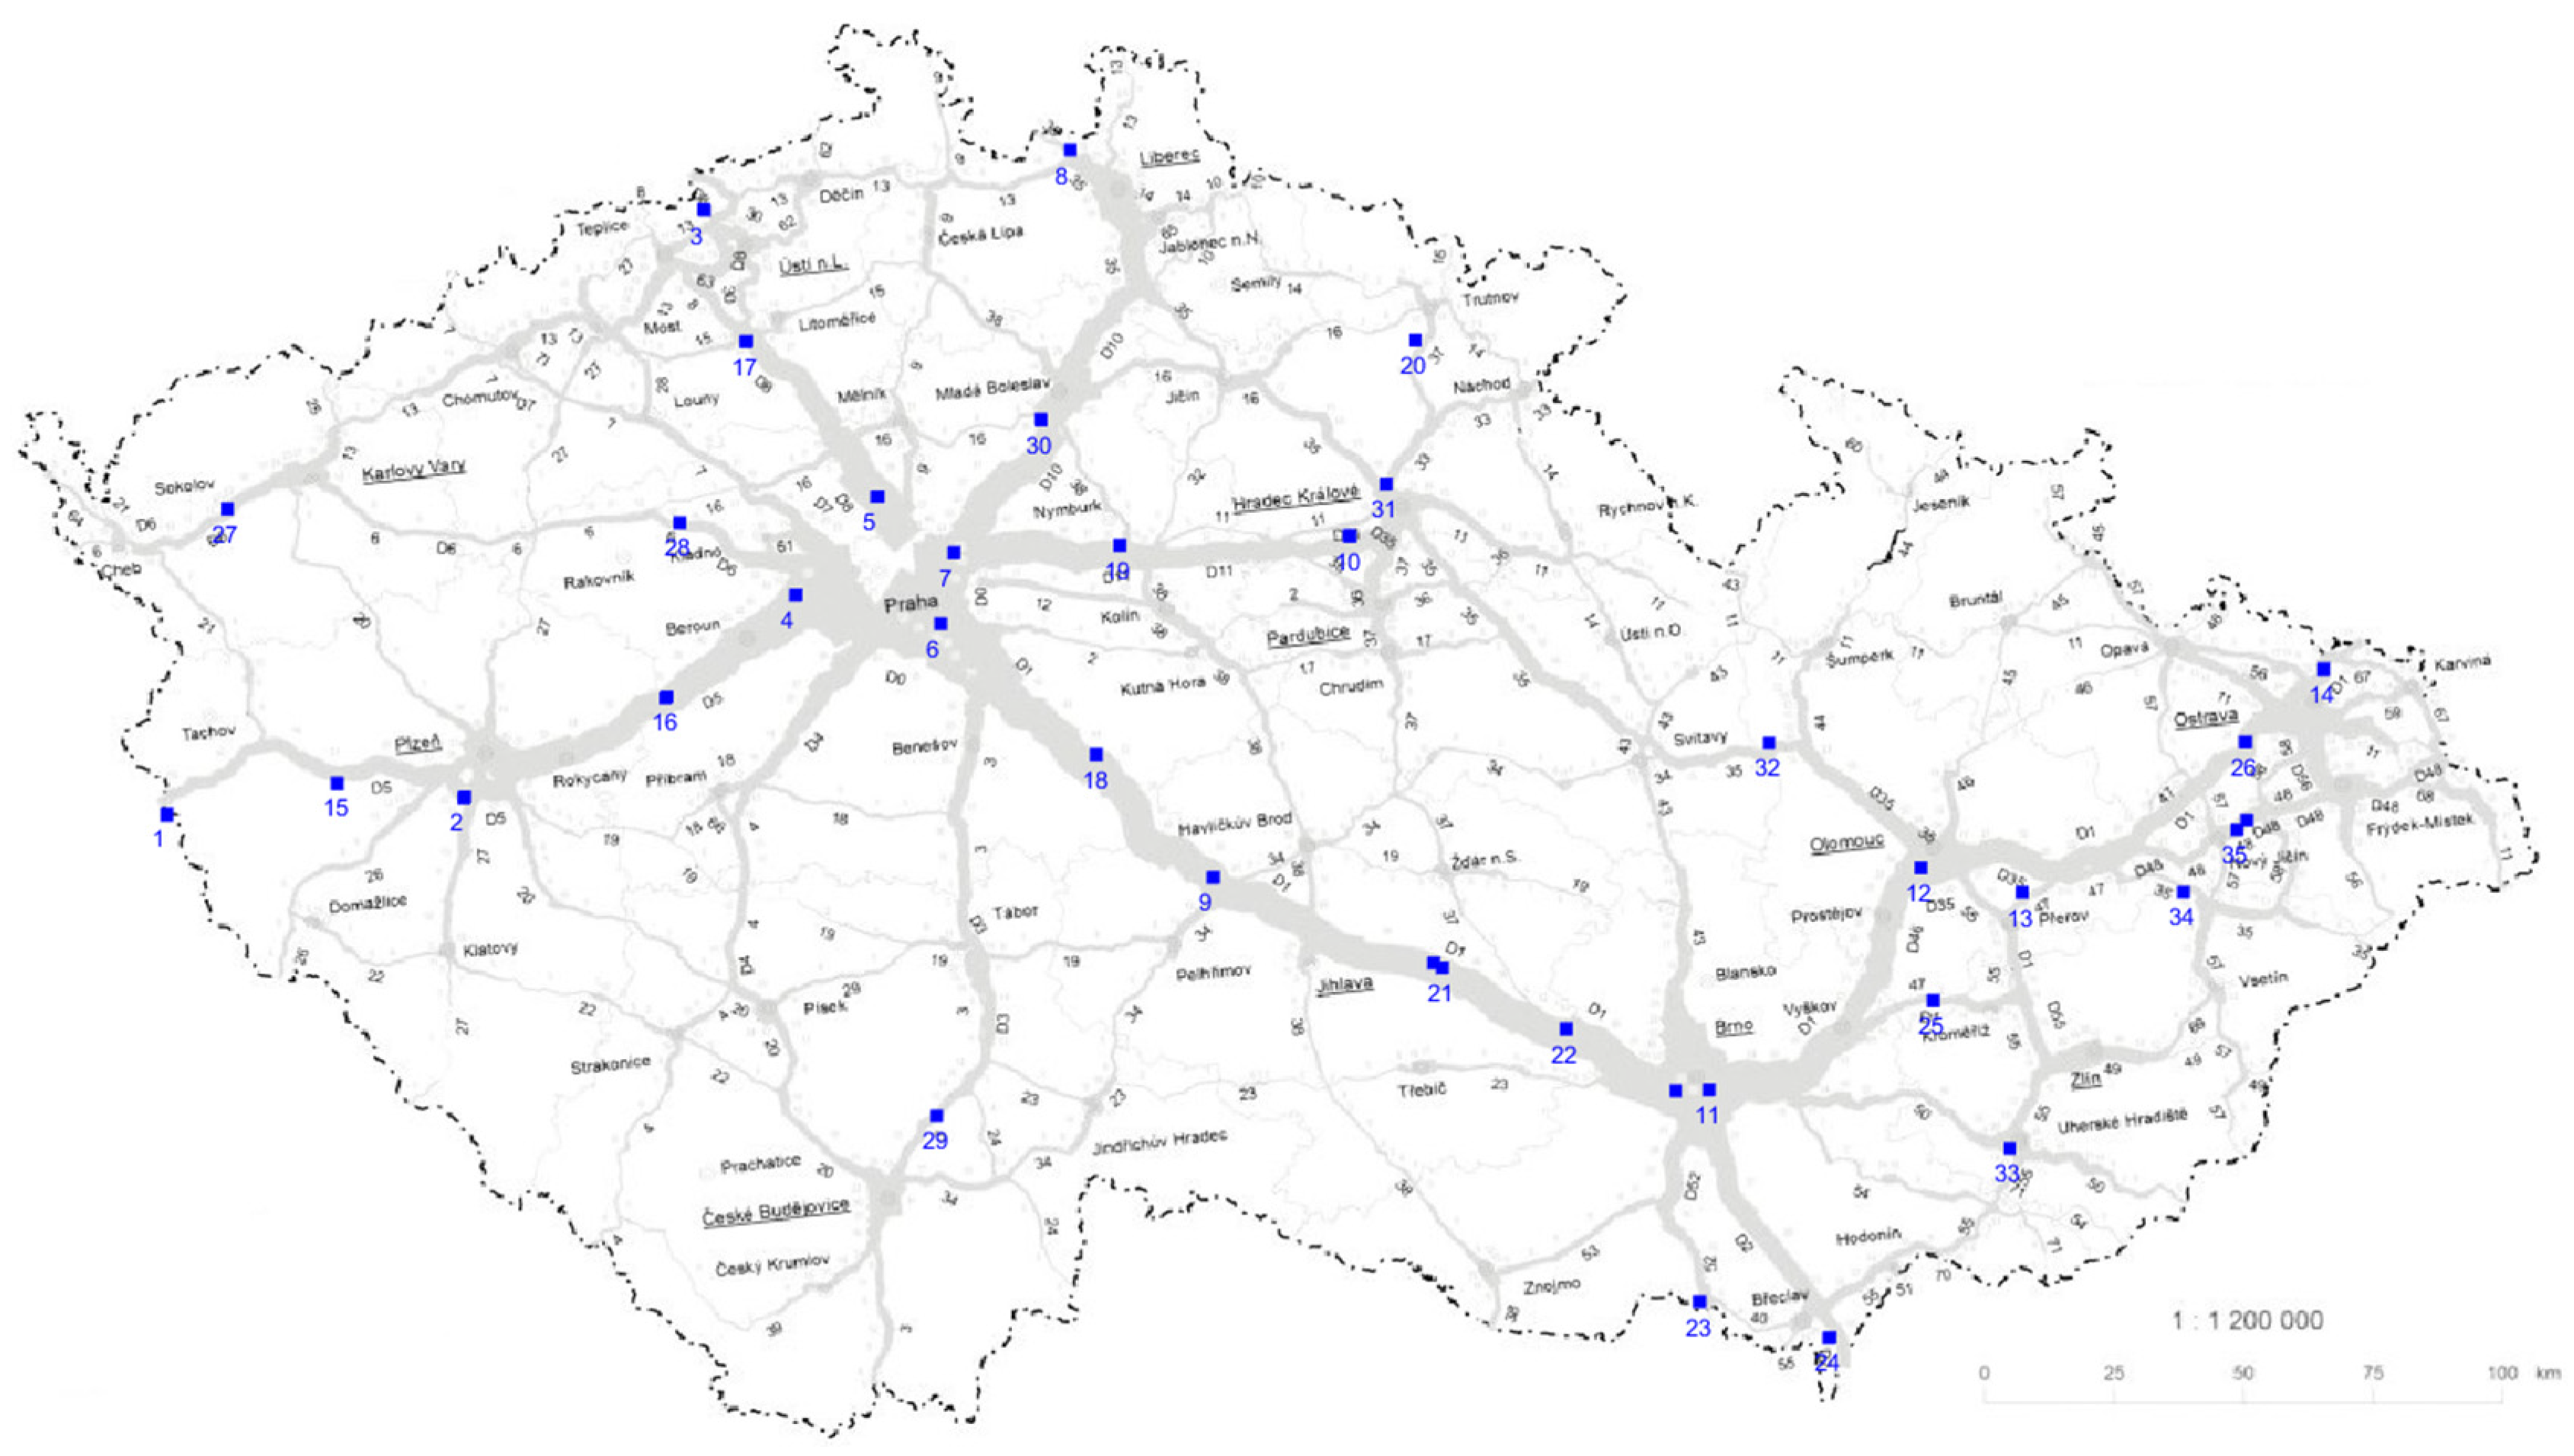
2.1.2. Phase 2: Densification of the Core TEN-T Network and Basic Coverage of the Comprehensive TEN-T Network

For the second phase until 2030, the Core TEN-T network charging station distances will be densified to 50 km. See in Figure 3. In addition, the construction of a network of charging stations on the Comprehensive TEN-T is planned. Here, according to European recommendations, the distances between stations should be a maximum of 100 km.

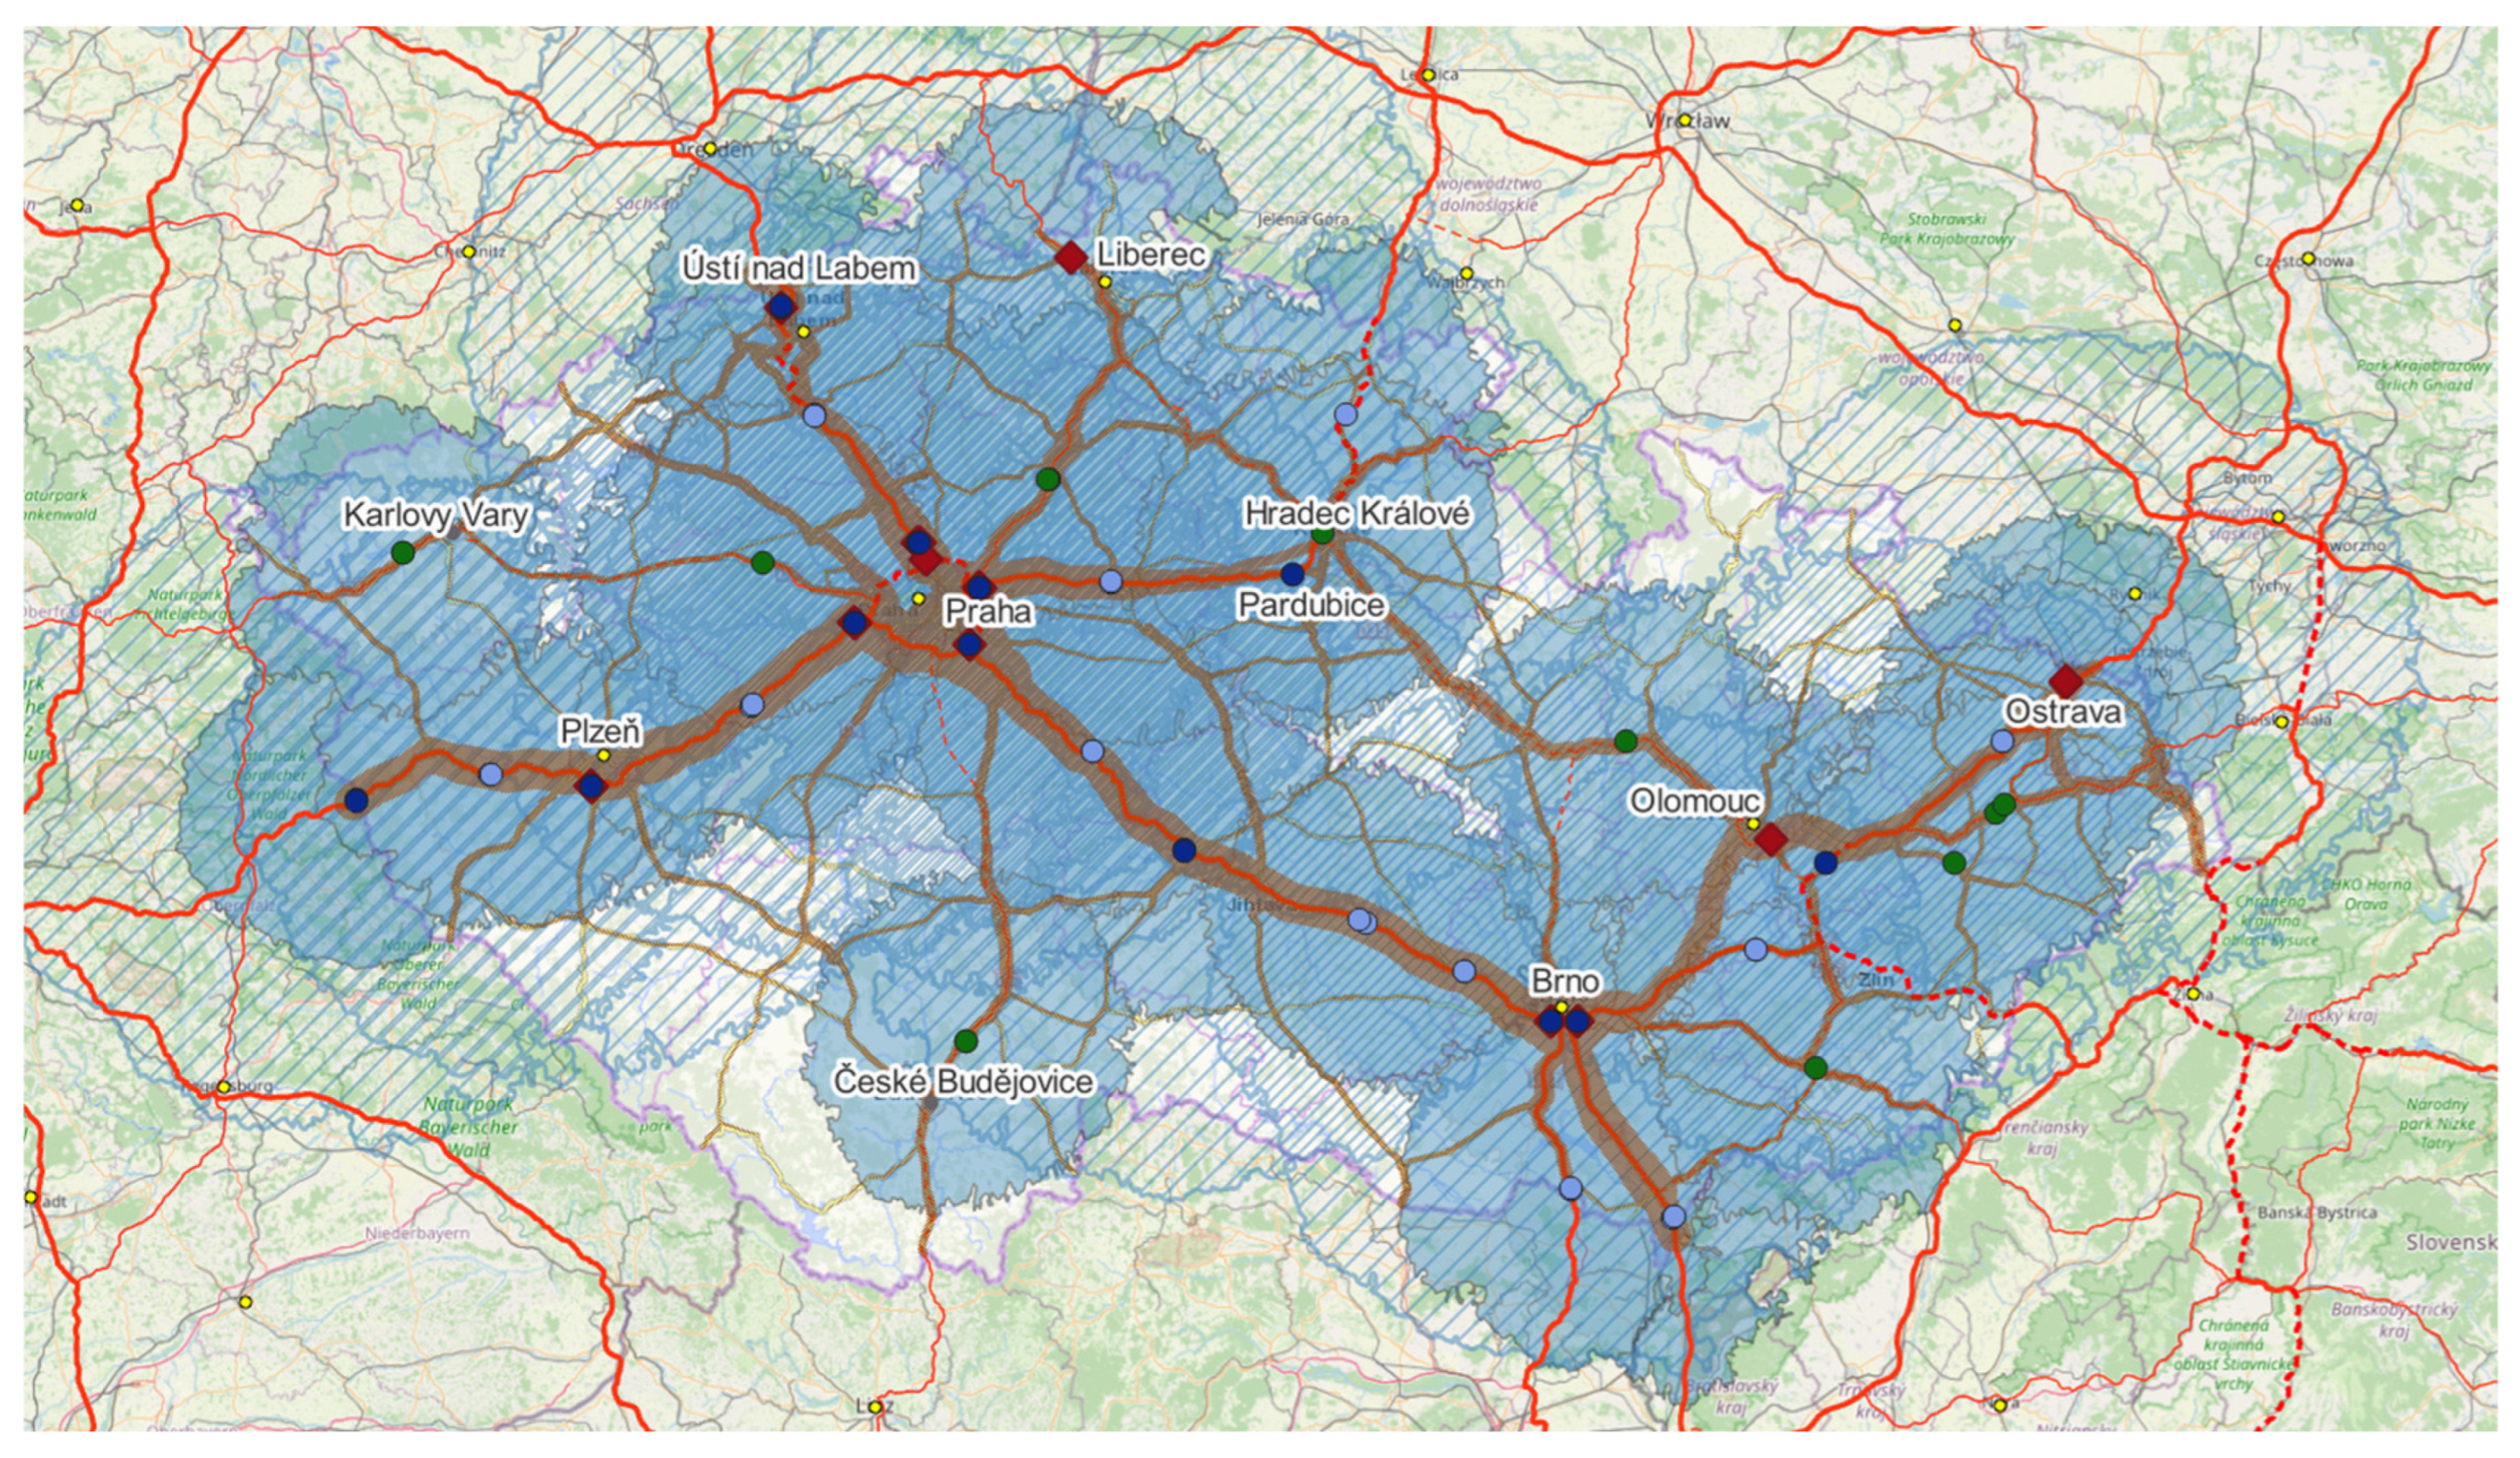
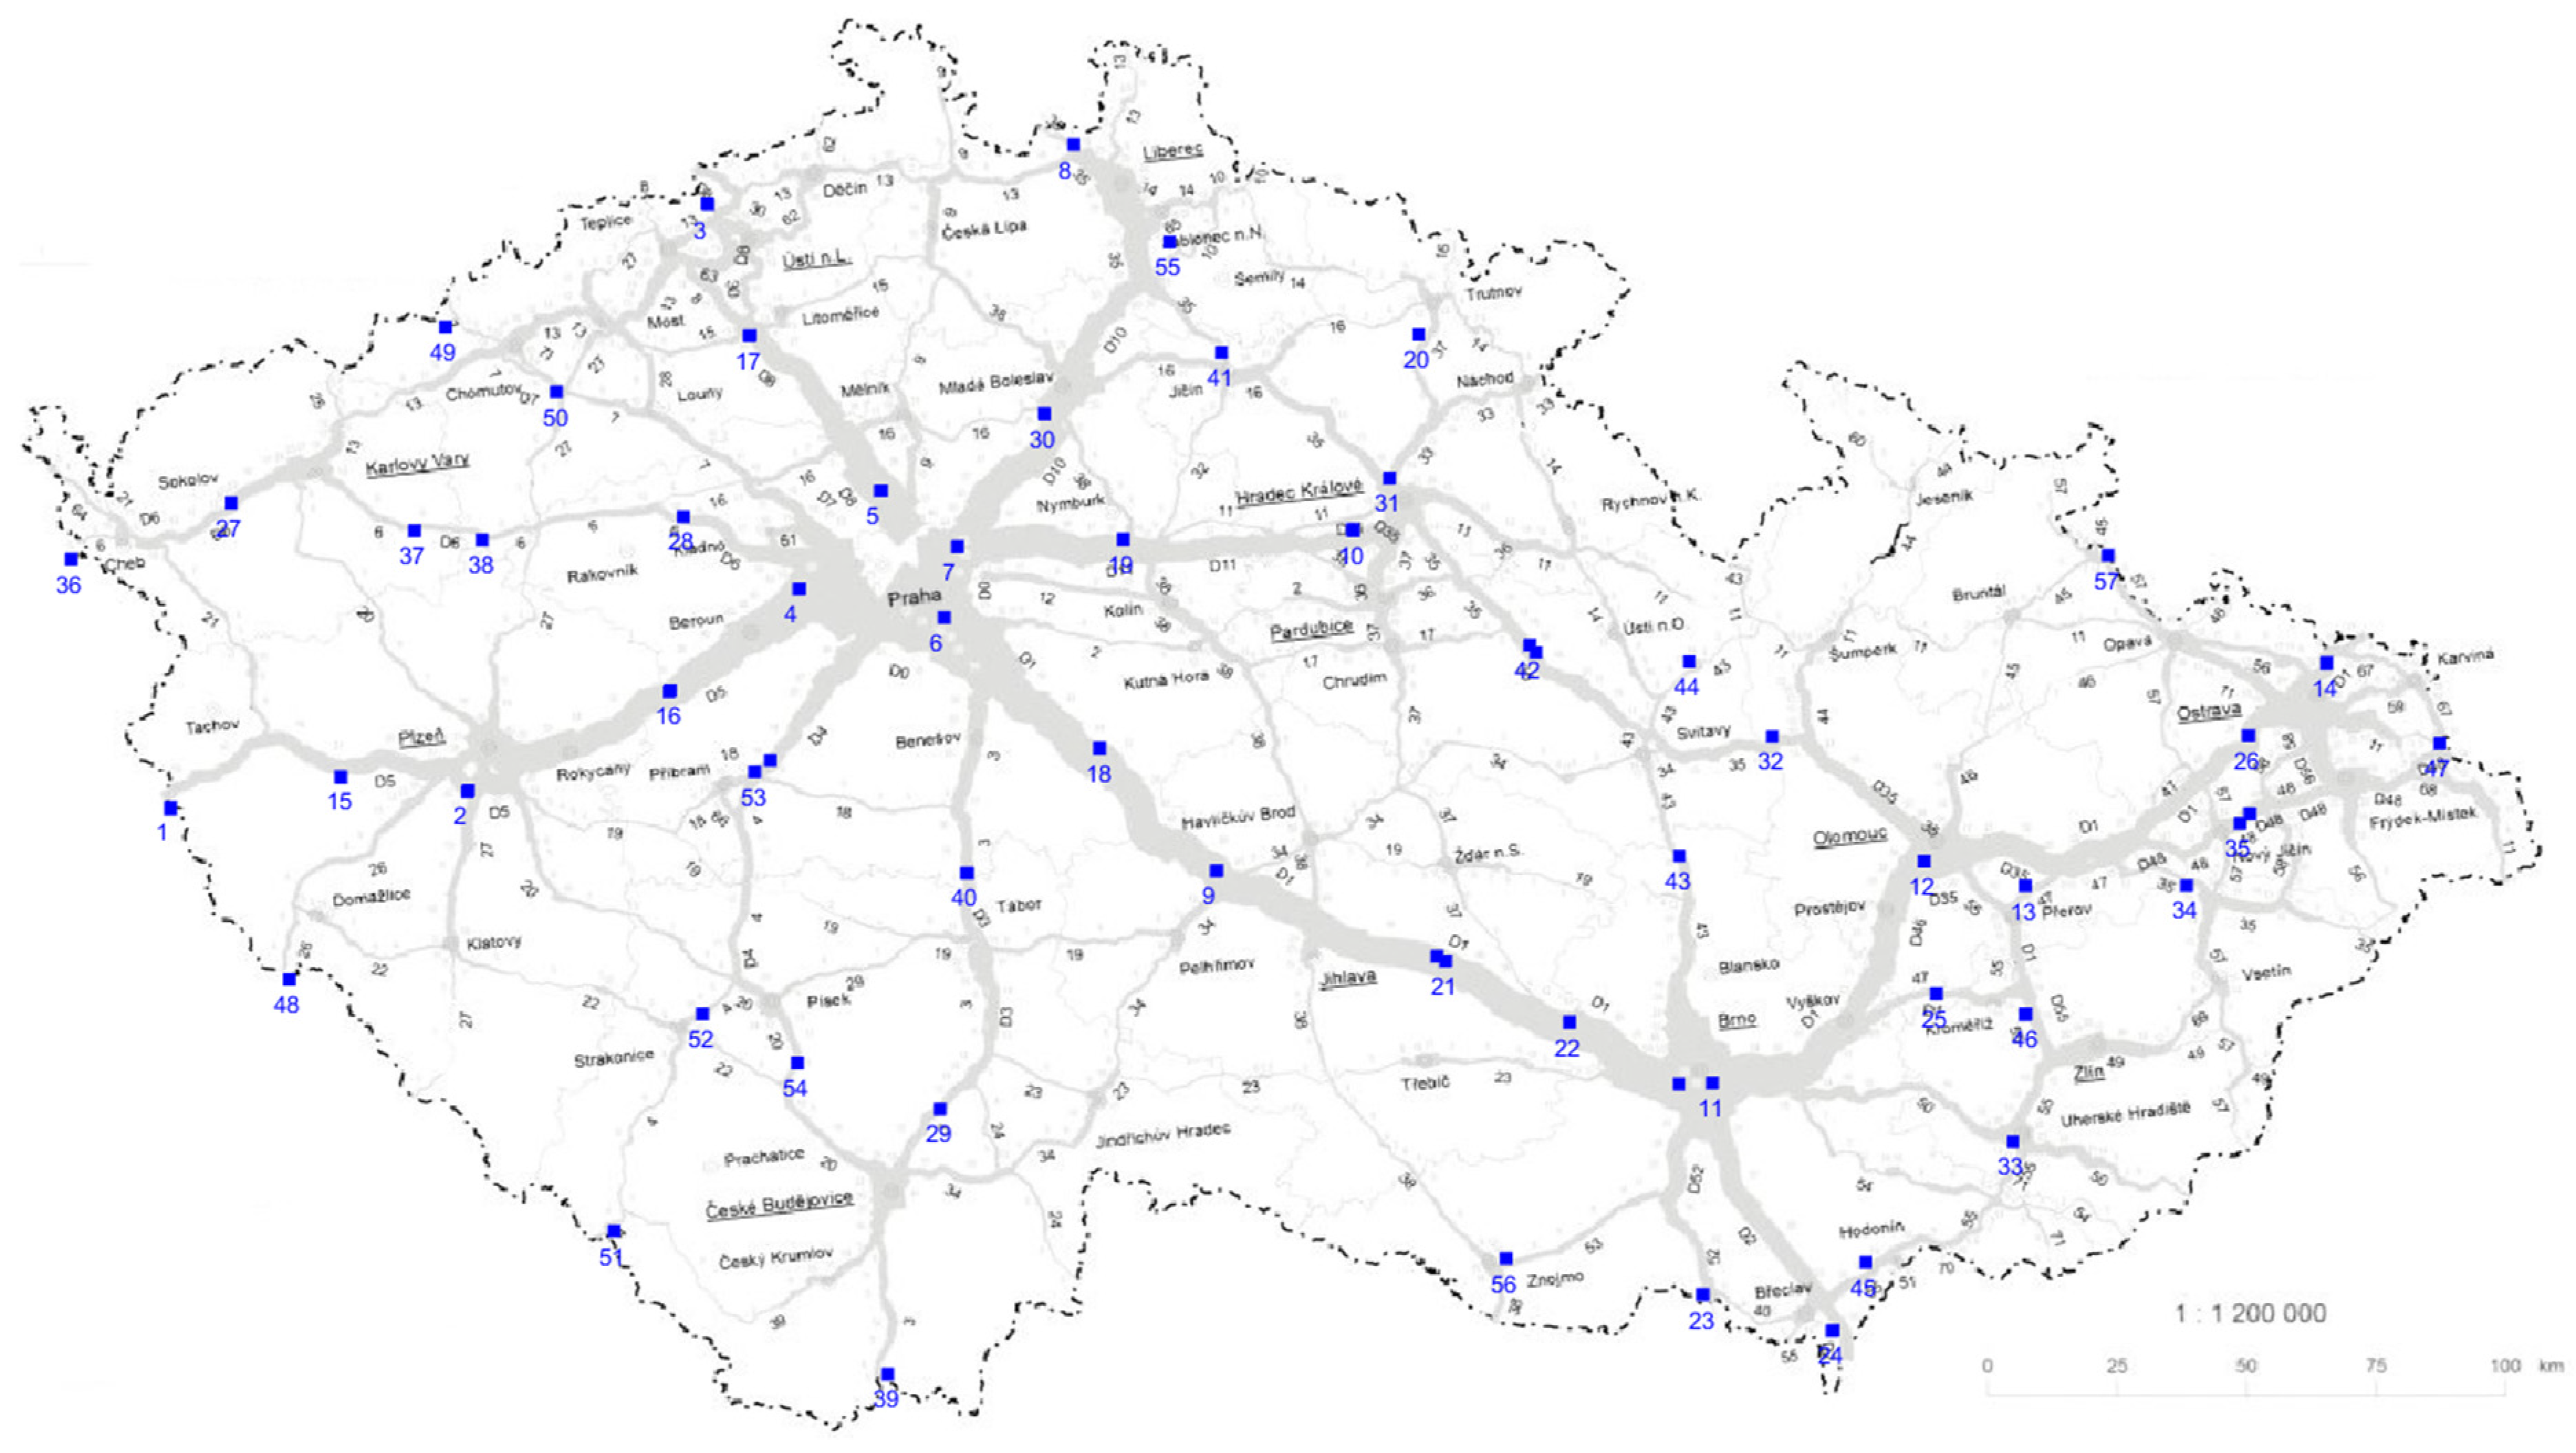
2.1.3. Phase 3 (Figure 4): Densification of the Comprehensive TEN-T Network, Additional Coverage of the Czech Republic

For the third phase until 2035, the Comprehensive TEN-T network charging station distances would be densified to 50 km to ensure truly safe charging for freight transport throughout the entire territory of the Czech Republic, without the need to rely on a significant breakthrough in the volume and energy density of traction batteries.
Figure 4. Phase 3, Densification of the Comprehensive TEN-T network (light green) and additional coverage of the traffic network of the Czech Republic (orange).
Infrastructures 09 00007 g004

2.2. Methodology of Choosing the Concept of Charging Stations for Road Freight Transport

This is the second step in the process. This step takes place after the task “Location of charging stations in the network” described in Section 2.1 is completed. The schematics of this step are described in Figure 1. The aim of this methodology is to systematically establish suitable concepts of charging stations for road freight transport for the given location of the charging station. The methodology will determine the course of the required power, load diagrams, numbers and occupancy of charging outlets, and space requirements of the charging infrastructure stations; it will evaluate free distribution capacity and specify the choice of the station battery.

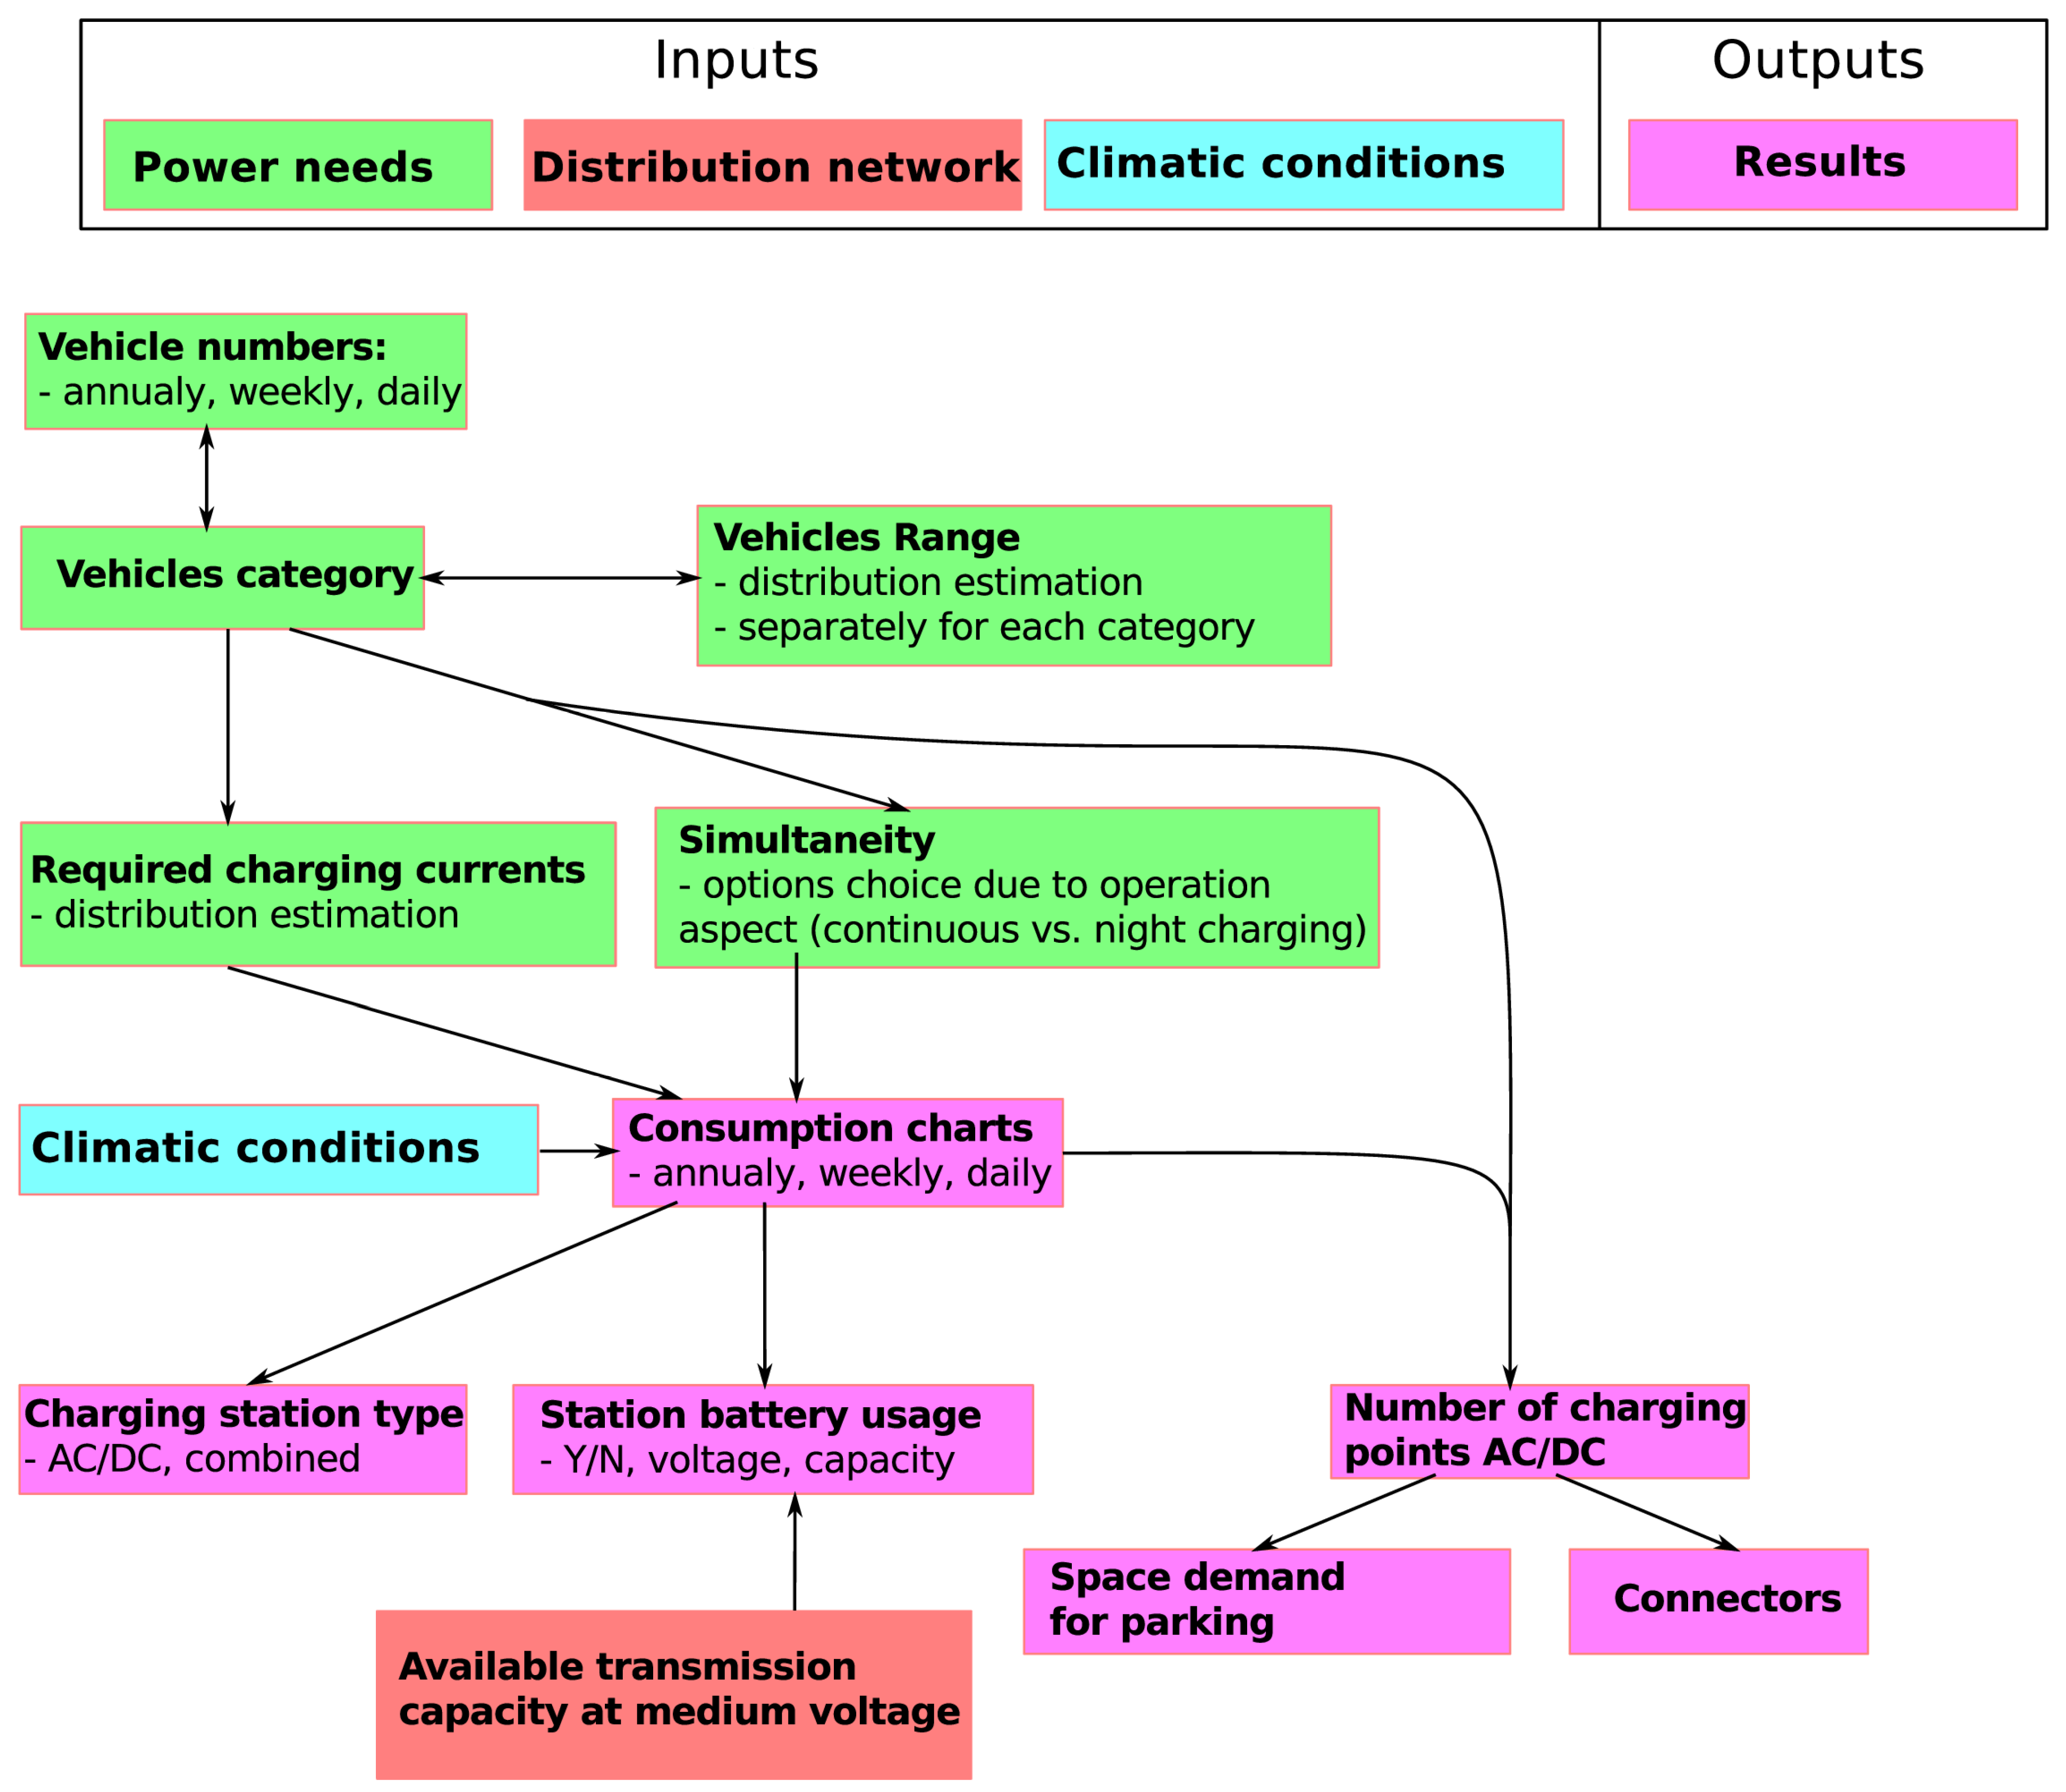
2.2.1. Input Parameters

The methodology assumes the following input parameters, and we provided the sources which we used, for example, the case of the Czech Republic:
  • Traffic intensity in the area on workdays [9],
  • Data from Technical Conditions 189: daily, weekly, and yearly variations in traffic intensity [11],
  • Data from Technical Conditions 171: dimensions of vehicles in each category [14],
  • Data from ČSN 73 6056: minimum distances between vehicles in each category in perpendicular parking [15],
  • Traffic output of main and other routes in the catchment area [10],
  • Electricity consumption [12],
  • The ratio of battery electric vehicles (BEV) and the ratio of public charging, in the form of scenarios (sets of parameters),
  • Probability of overnight charging of BEV, if the vehicle arrives at night,
  • BEV parameters: range, charging current of the traction battery in xC units, Current stated in units of a multiple of the battery capacity.
The methodology assumes the following input parameters of the charging station:
  • Selected power of charging outlets (e.g., 43, 170, 350 kW),
  • Free capacity of the nearest transformer station (MVA),
  • Distance to high-voltage power lines,
  • High-voltage level,
  • Dimensions of the charging stand structure.

2.2.2. Calculation

The basic time step in the calculation of daily courses of the quantities is 1 min. One day corresponds to 1440 samples (discrete time intervals).

2.2.3. Load Diagrams
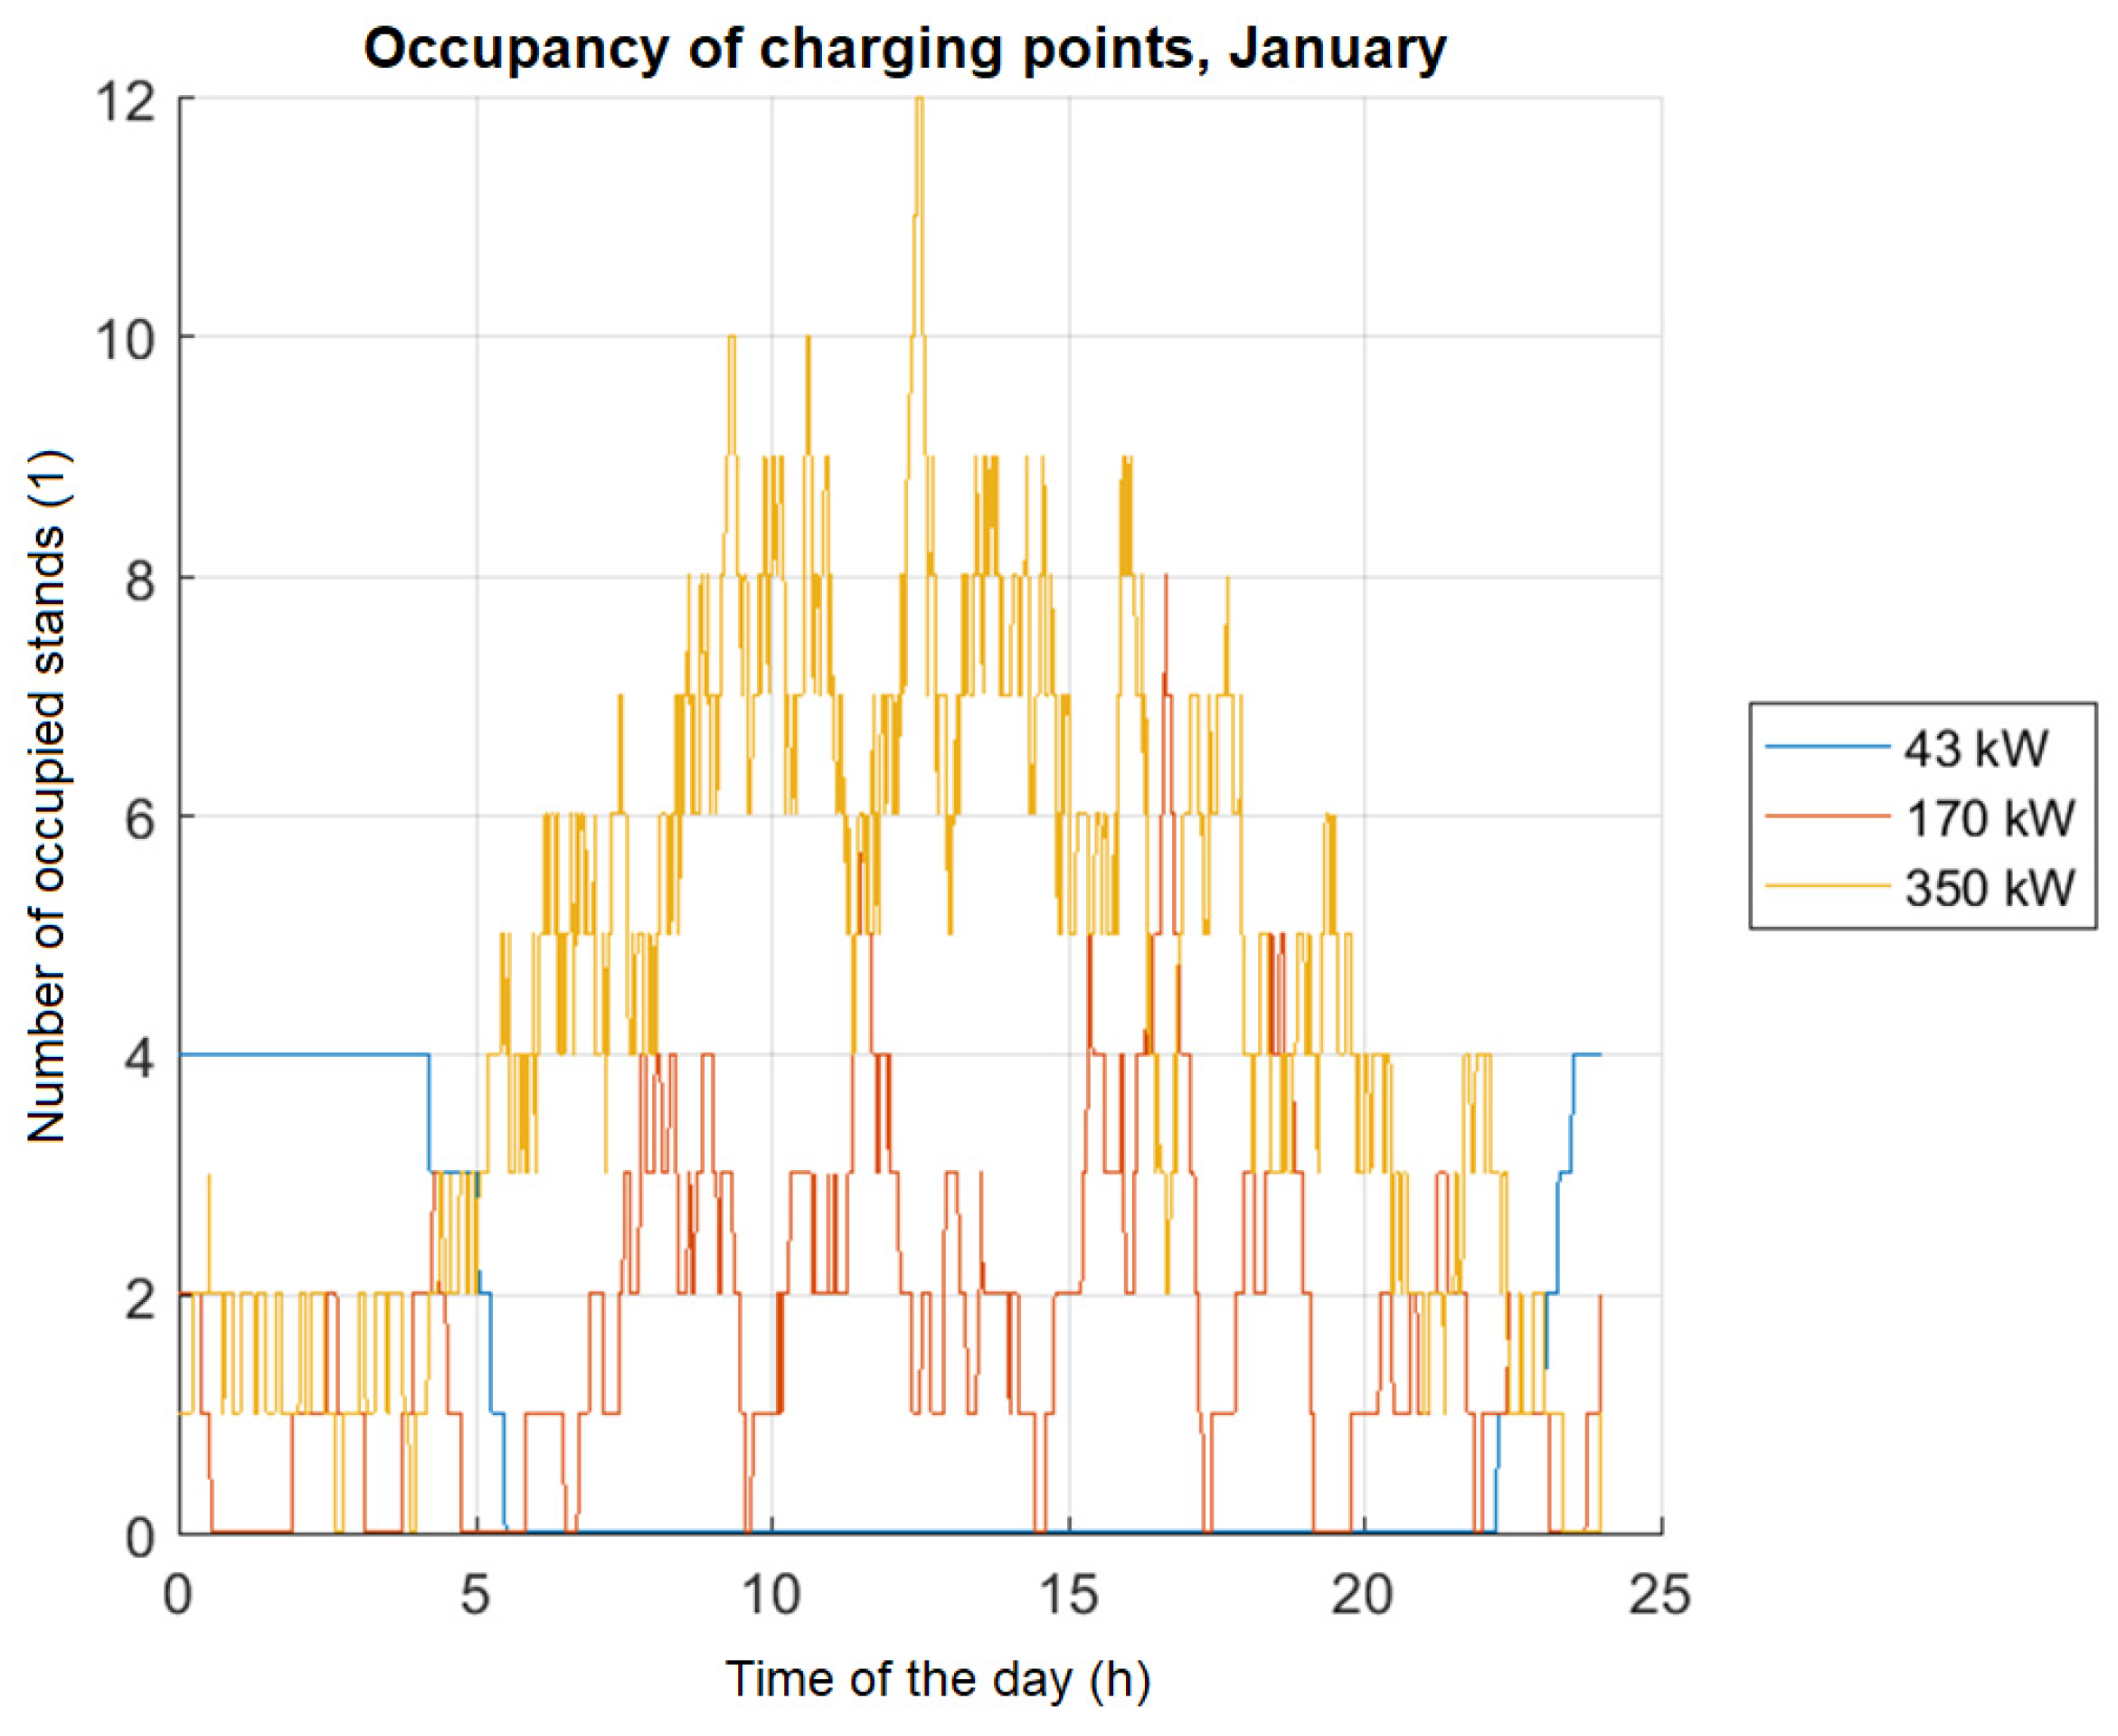
Daily, weekly, and yearly variations of traffic intensity are determined for each vehicle category based on data from [11]. Based on daily traffic intensities corrected for weekly and yearly variations and based on the number of charged BEVs in the catchment area of the charging station, moments of arrival of individual vehicles at the charging station, the required charging distance (Distance of BEV ride within its range and which corresponds to the respective charge of the traction battery at the charging station), charge, charging current and the duration of discharge are determined. The course of the power of individual BEVs is summed up to determine the necessary momentary power and the reserved capacity (Reserved capacity is the power determined as the energy per a period of 15 min divided by 15 min). The results are determined for the worst-case day in the year. Figure 5 shows an example of the course of the power required together with the reserved capacity during the day in the given month.

2.2.4. Occupancy

In each time step, it is found out which new vehicles have arrived to be charged, and they are allocated to a charging outlet according to the required power. In the case of a lack of sufficient charging outlets of the required power level, a charging outlet is added. The occupancy of charging outlets of each power level and the usability of the power of the charging outlet is monitored.

2.2.5. Climatic Conditions

Temperatures measured at the meteorological station in the Clementinum, Prague, are considered [18]. The average minimum values of average daily temperatures over the past 20 years are determined for each month in the year. It is assumed that the range of a BEV is lower and the consumption is higher due to heating in lower temperatures. A decrease in battery capacity is not considered; it is assumed that the station battery is placed in an air-conditioned space.
Load diagrams (Figure 5) are determined for individual months in the year while respecting climatic conditions. Occupancy calculation is done separately for each month in the year. The highest occupancy of all months of the year is determined for each 15 min interval.

2.2.6. Estimation of Reserved Capacity

Values of reserved capacity for individual months (Figure 6) are determined. In the case of variance of the parameters of the uniform distribution, the calculation is repeated. Power and occupancy are calculated repeatedly, and the 90th percentile of the results is determined. The reserved capacity for the worst-case day in the year is determined and compared to the free distribution capacity in the very high/high-voltage transformer station, which is closest in terms of power lines.

2.2.7. Station Battery

After evaluating the free distribution capacity, it is determined whether it is advantageous to use a station battery in the given month. If the use of the station battery is recommended, the basic parameters of the battery are designed.

2.2.8. Space Requirements

The calculation of space requirements is based on the dimensions of vehicles in each category, the smallest distance between vehicles in each category, and the size of the charging outlet structure. Only perpendicular parking is considered. The calculation does not include the space requirements of the high- and low-voltage substations, the space for safe operation of the stands, the dimensions of the pavement and access roads, and the turning envelope of the vehicles. The required area of parking is assigned to the charging outlets of the given power level based on the knowledge of their occupancy by each category of vehicle. A maximalist approach is considered when calculating the parking area, going from the category with the largest vehicle dimensions to the smallest ones. The area required for the charging stand is calculated from the knowledge of their total number and the dimensions of their structures.

3. Results

After the two aforementioned steps, the following results are achieved.

3.1. Results of Location of Charging Stations (Step 1)

This section contains the results of the placement of charging stations for a model example of the Czech Republic.
The phasing is proposed by authors and goes as follows:

3.1.1. Year 2025: Phase 1

Core TEN-T network with maximum distances of 100 km (near-term, uncertain BEV availability) in significant urban nodes, see in Figure 7.

3.1.2. Year 2030: Phase 2 (Figure 3)

Core TEN-T network with maximum distances of 50 km.
Comprehensive TEN-T network with maximum distances of 100 km. See in Figure 8.

3.1.3. Year 2035: Phase 3

Comprehensive TEN-T network with maximum distances of 50 km.
Coverage of the transport network in the Czech Republic outside the TEN-T network.
Determination of P [MW] and n_(≥350 kW) for each phase based on the methodology results [19].
Phase 2 corresponds to the spacing requirements for charging stations (CHS) as specified by AFIR for the Core TEN-T and Comprehensive TEN-T networks. Phase 3 introduces additional CHS beyond the requirements set by AFIR. See in Figure 9.

3.1.4. Charging Stations Overview

The following Table 1 summarizes the list of proposed charging stations for phases 1 to 3 described above.

3.2. Results of Power and Spatial Needs (Step 2)

3.2.1. Scenarios

The calculation using this methodology was performed for the following scenarios:
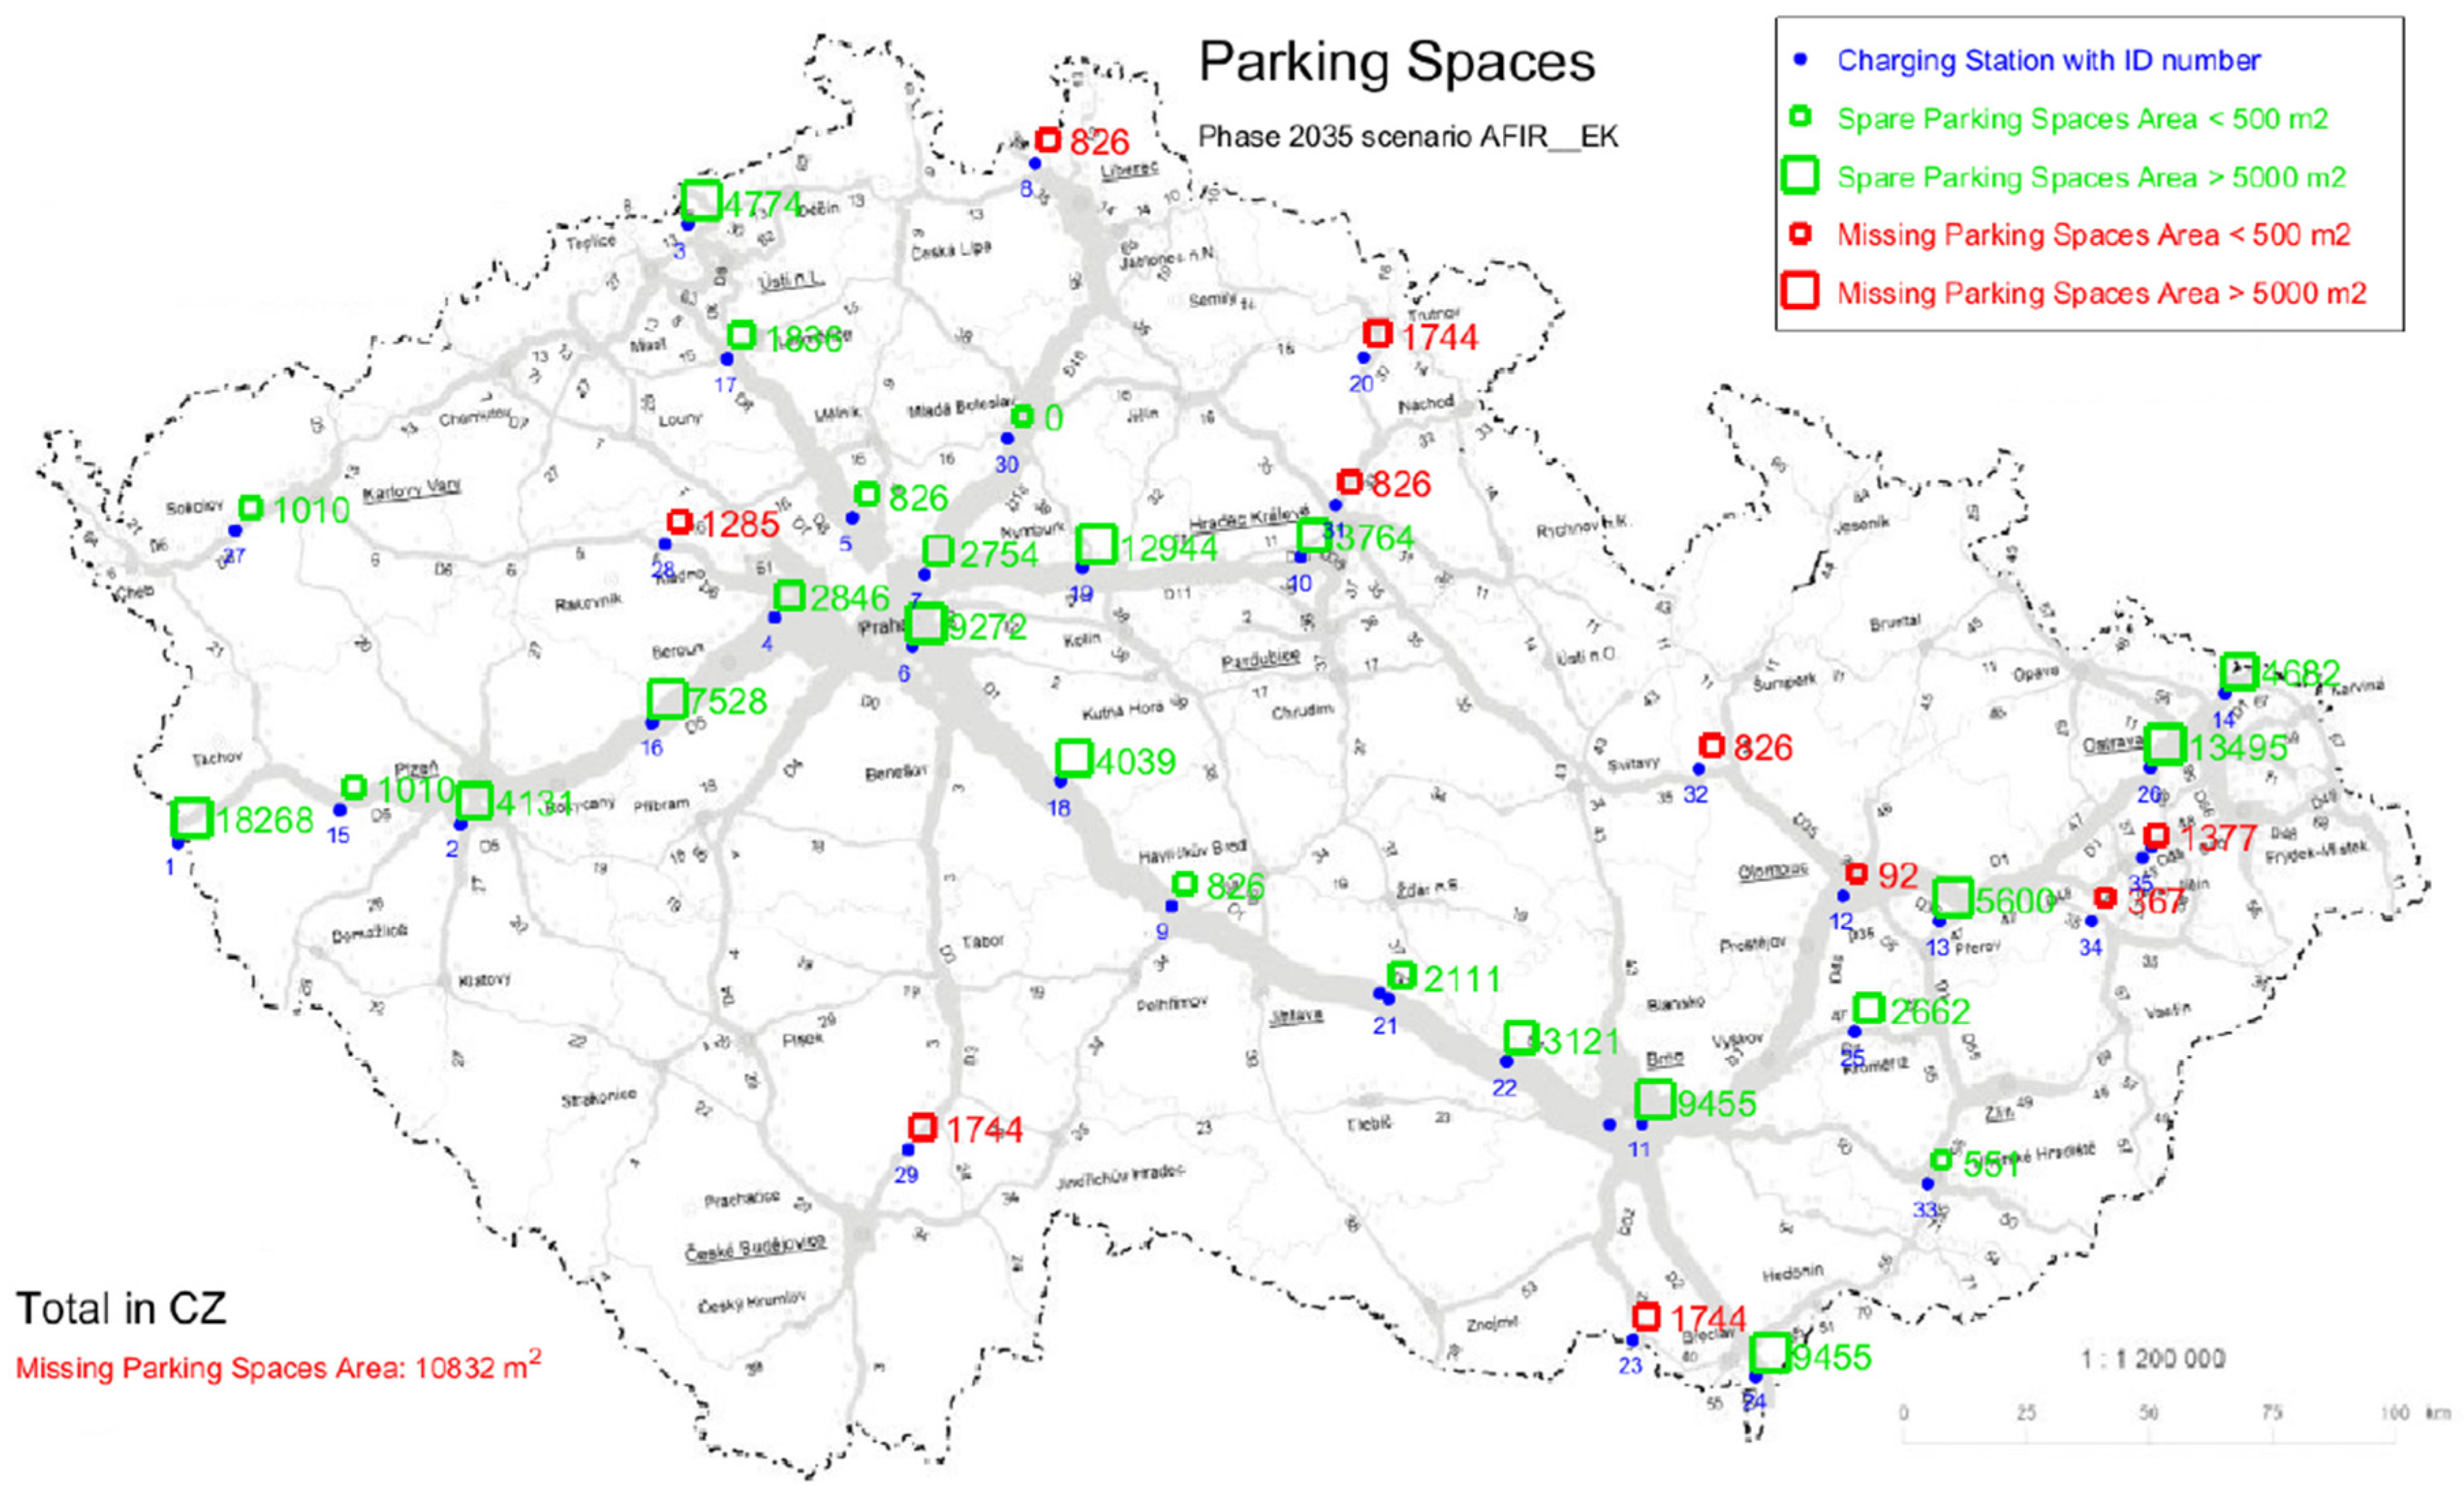
  • AFIR_EK: The scenario is determined by the requirements formulated in the original proposal of AFIR by the European Commission [7] for CHS in the years 2025, 2030, and 2035 (max charging power 350 kW).
  • AFIR_EP: The scenario is determined by the requirements of AFIR broadened by a proposal of the European Parliament for CHS in the years 2025, 2027, 2030, and 2032 (max charging power 700 kW; see report to [8] from February 2022).
  • Industry baseline: The scenario is detailed in [16,17].
  • EV-Leaders: The scenario is detailed in [16,17].
  • Road-2-Zero: The scenario is detailed in [16,17].
Based on the data in [17,20,21] and expertly corrected based on [9], the shares of BEV and public charging are determined for the Industry-baseline, EV-Leaders, and Road-2-Zero scenarios for the observed stages and vehicle categories. The vehicle categories are described in detail in [10]. The shares of BEV (ratio of traffic realized by BEV to the total traffic) are presented in Table 2; the shares of public charging were expertly estimated to be 40% on average (distinguished for each vehicle category).
The distinction between AFIR_EK and AFIR_EP lies in the proposed maximum output of a single charging station. However, the final compromise version [6] accepted in 2023 requires an individual power output of only 350 kW. In general, it denotes the Regulation for the deployment of alternative fuels infrastructure, and it sets mandatory deployment targets for electric recharging and hydrogen refueling infrastructure for the road sector, for shore-side electricity supply in maritime and inland waterway ports, and for electricity supply to stationary aircraft. The significant part of heavy-duty vehicles states: “Recharging stations dedicated to heavy-duty vehicles with a minimum output of 350 kW need to be deployed every 60 km along the TEN-T core network, and every 100 km on the larger TEN-T comprehensive network from 2025 onwards, with complete network coverage to be achieved by 2030. In addition, recharging stations must be installed at safe and secure parking areas for overnight recharging as well as in urban nodes for delivery vehicles” [21].

3.2.2. Parameters for Charging Stations

For each charging station and for all stations in our model example in the Czech Republic, the following is determined:
  • CHS Cap: Maximum monthly reserved capacity of the lines (MVA),
  • Energy: Annual energy consumption (GWh),
  • Techl./Park. Area: Required area of the charging technology and parking (m2),
  • MissPark: Total missing parking area for all charging stations (m2),
  • MissDistr: Power deficiency of the distribution network (MVA),
  • Stat. Batt: Nominal energy of the station batteries of all charging stations (MWh),
  • ChPts: Number of charging points for individual power levels.
The following result sets are listed in Table 3:
  • AFIR_EK for power levels of charging stations at 170 and 350 kW,
  • AFIR_EP for power levels of charging stations at 170 and 700 kW,
  • Phase 1, according to the methodology for power levels of charging stations at 170 and 350 kW,
  • Phase 2, according to the methodology for power levels of charging stations at 170 and 350 kW,
  • Phase 3, according to the methodology for power levels of charging stations at 170 and 350 kW,
  • Phase 3, according to the methodology for power levels of charging stations at 170, 350, and 700 kW,
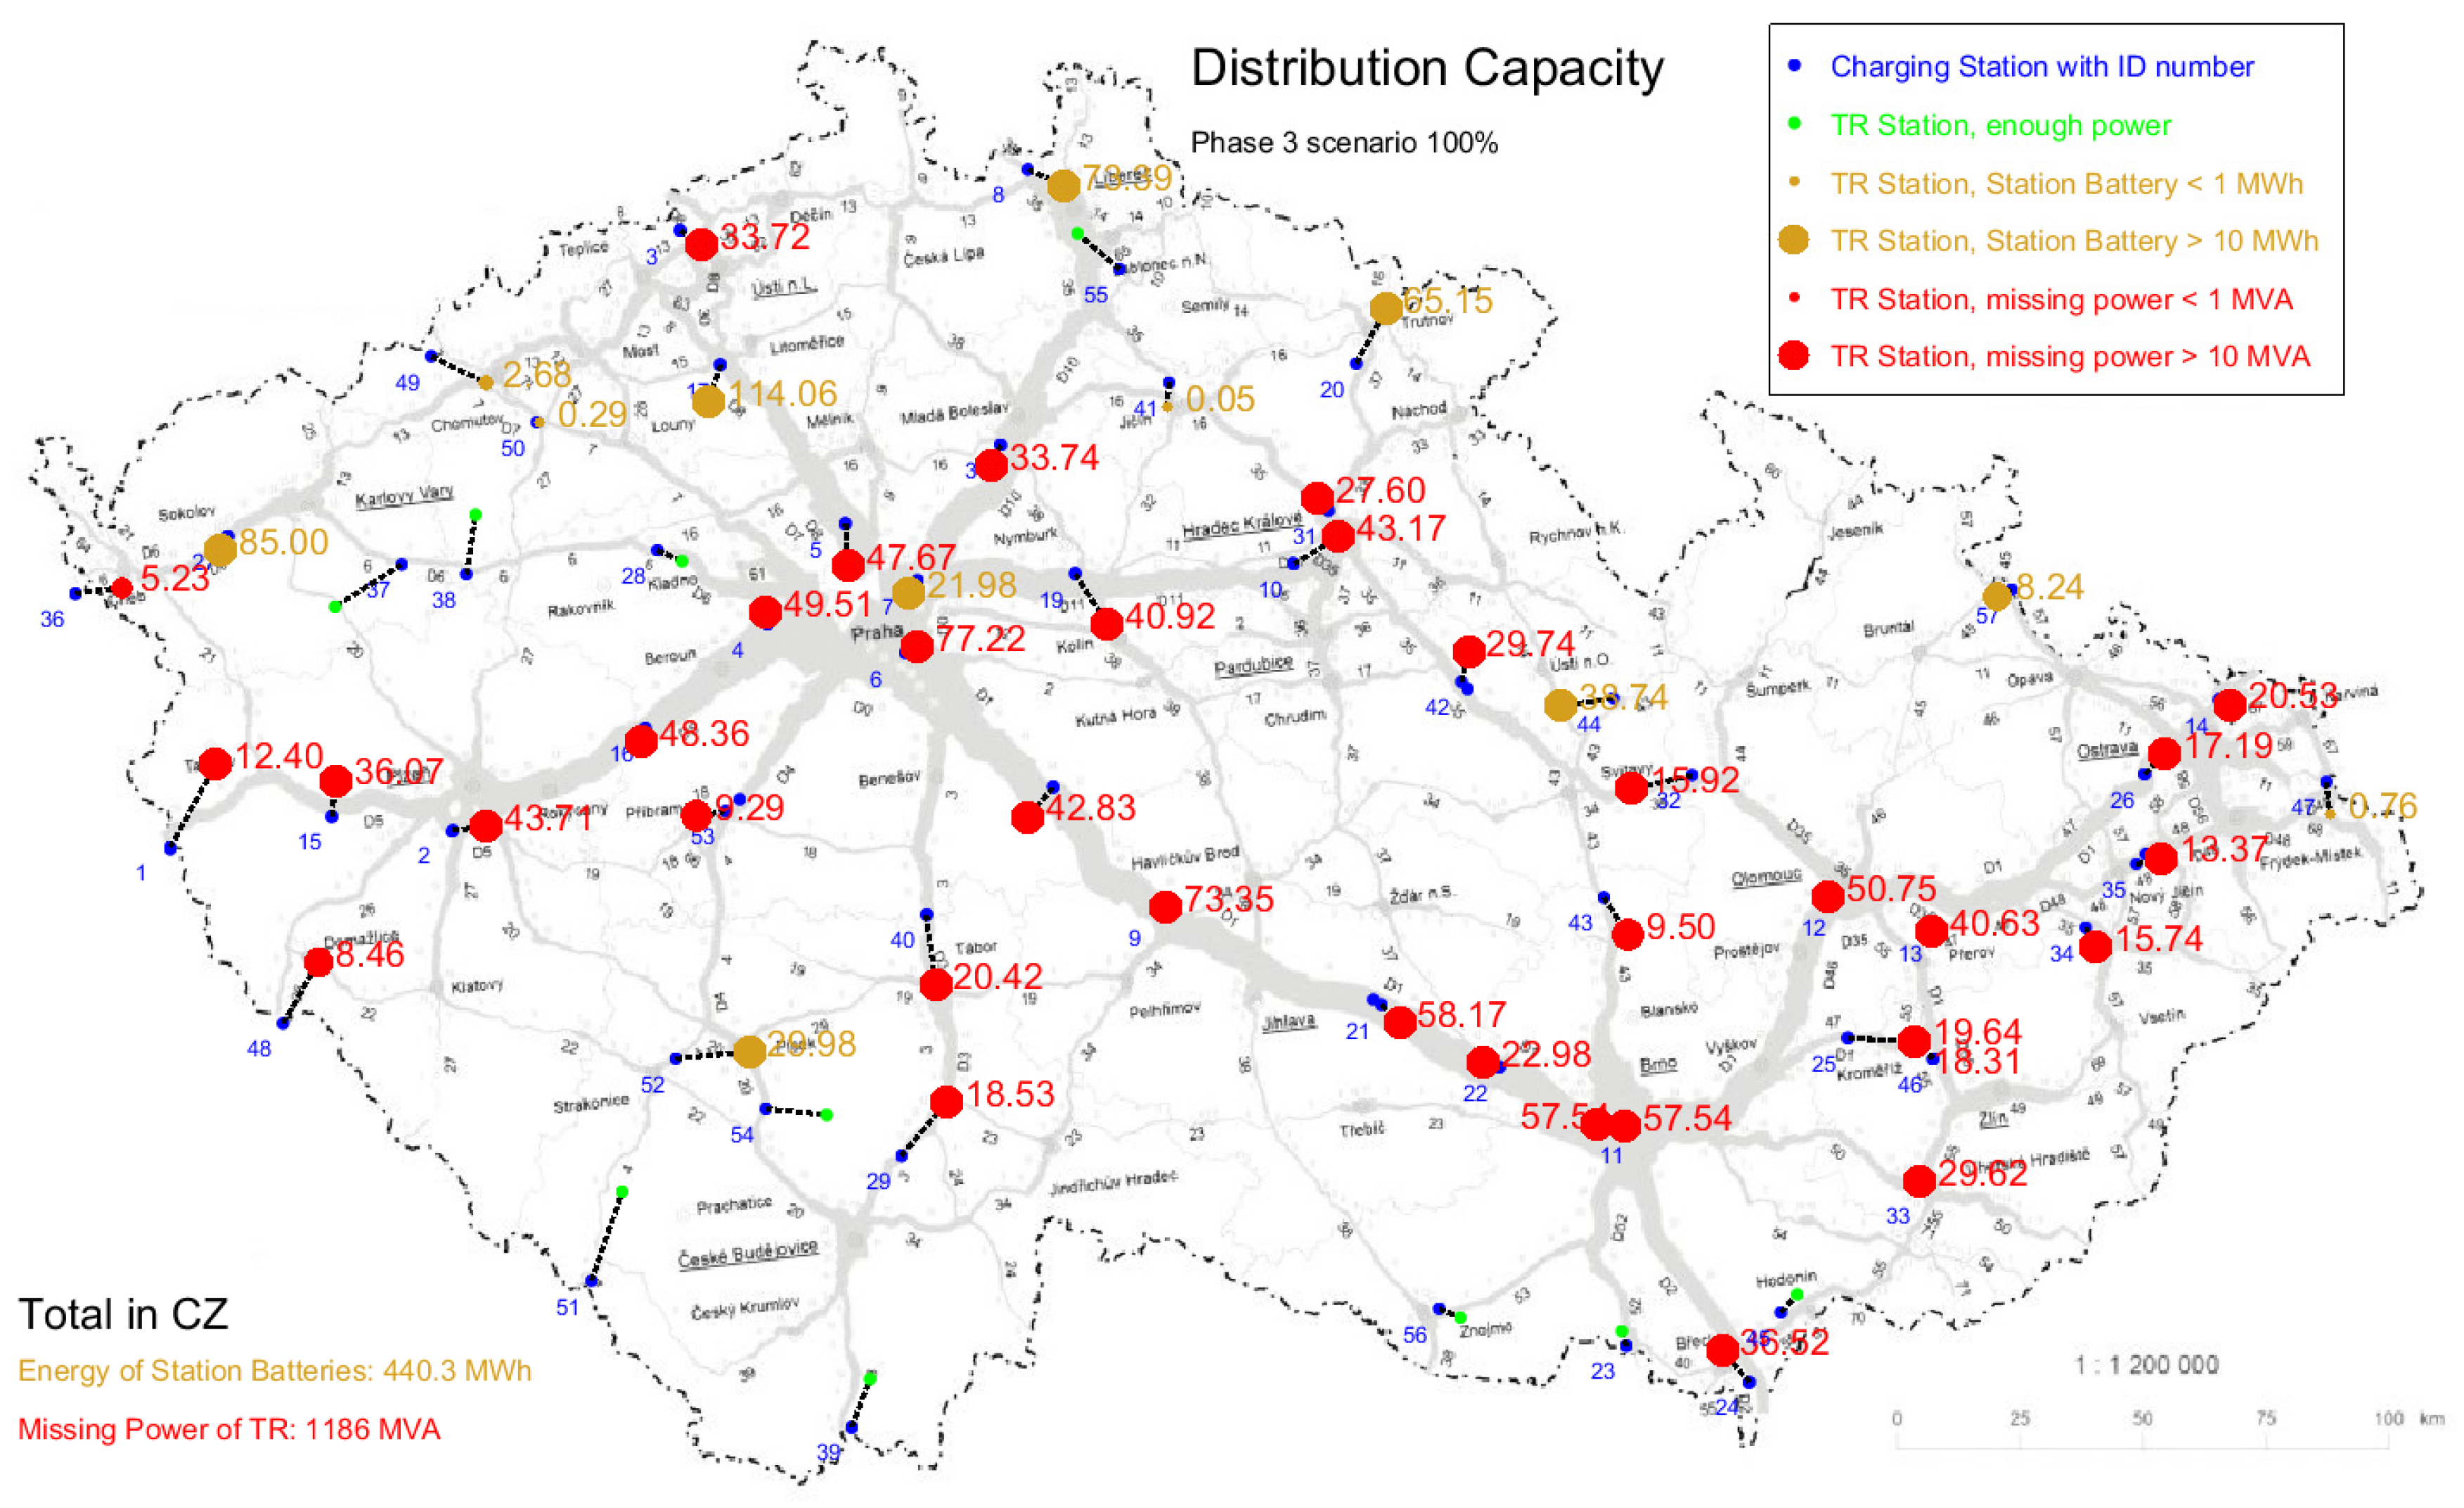
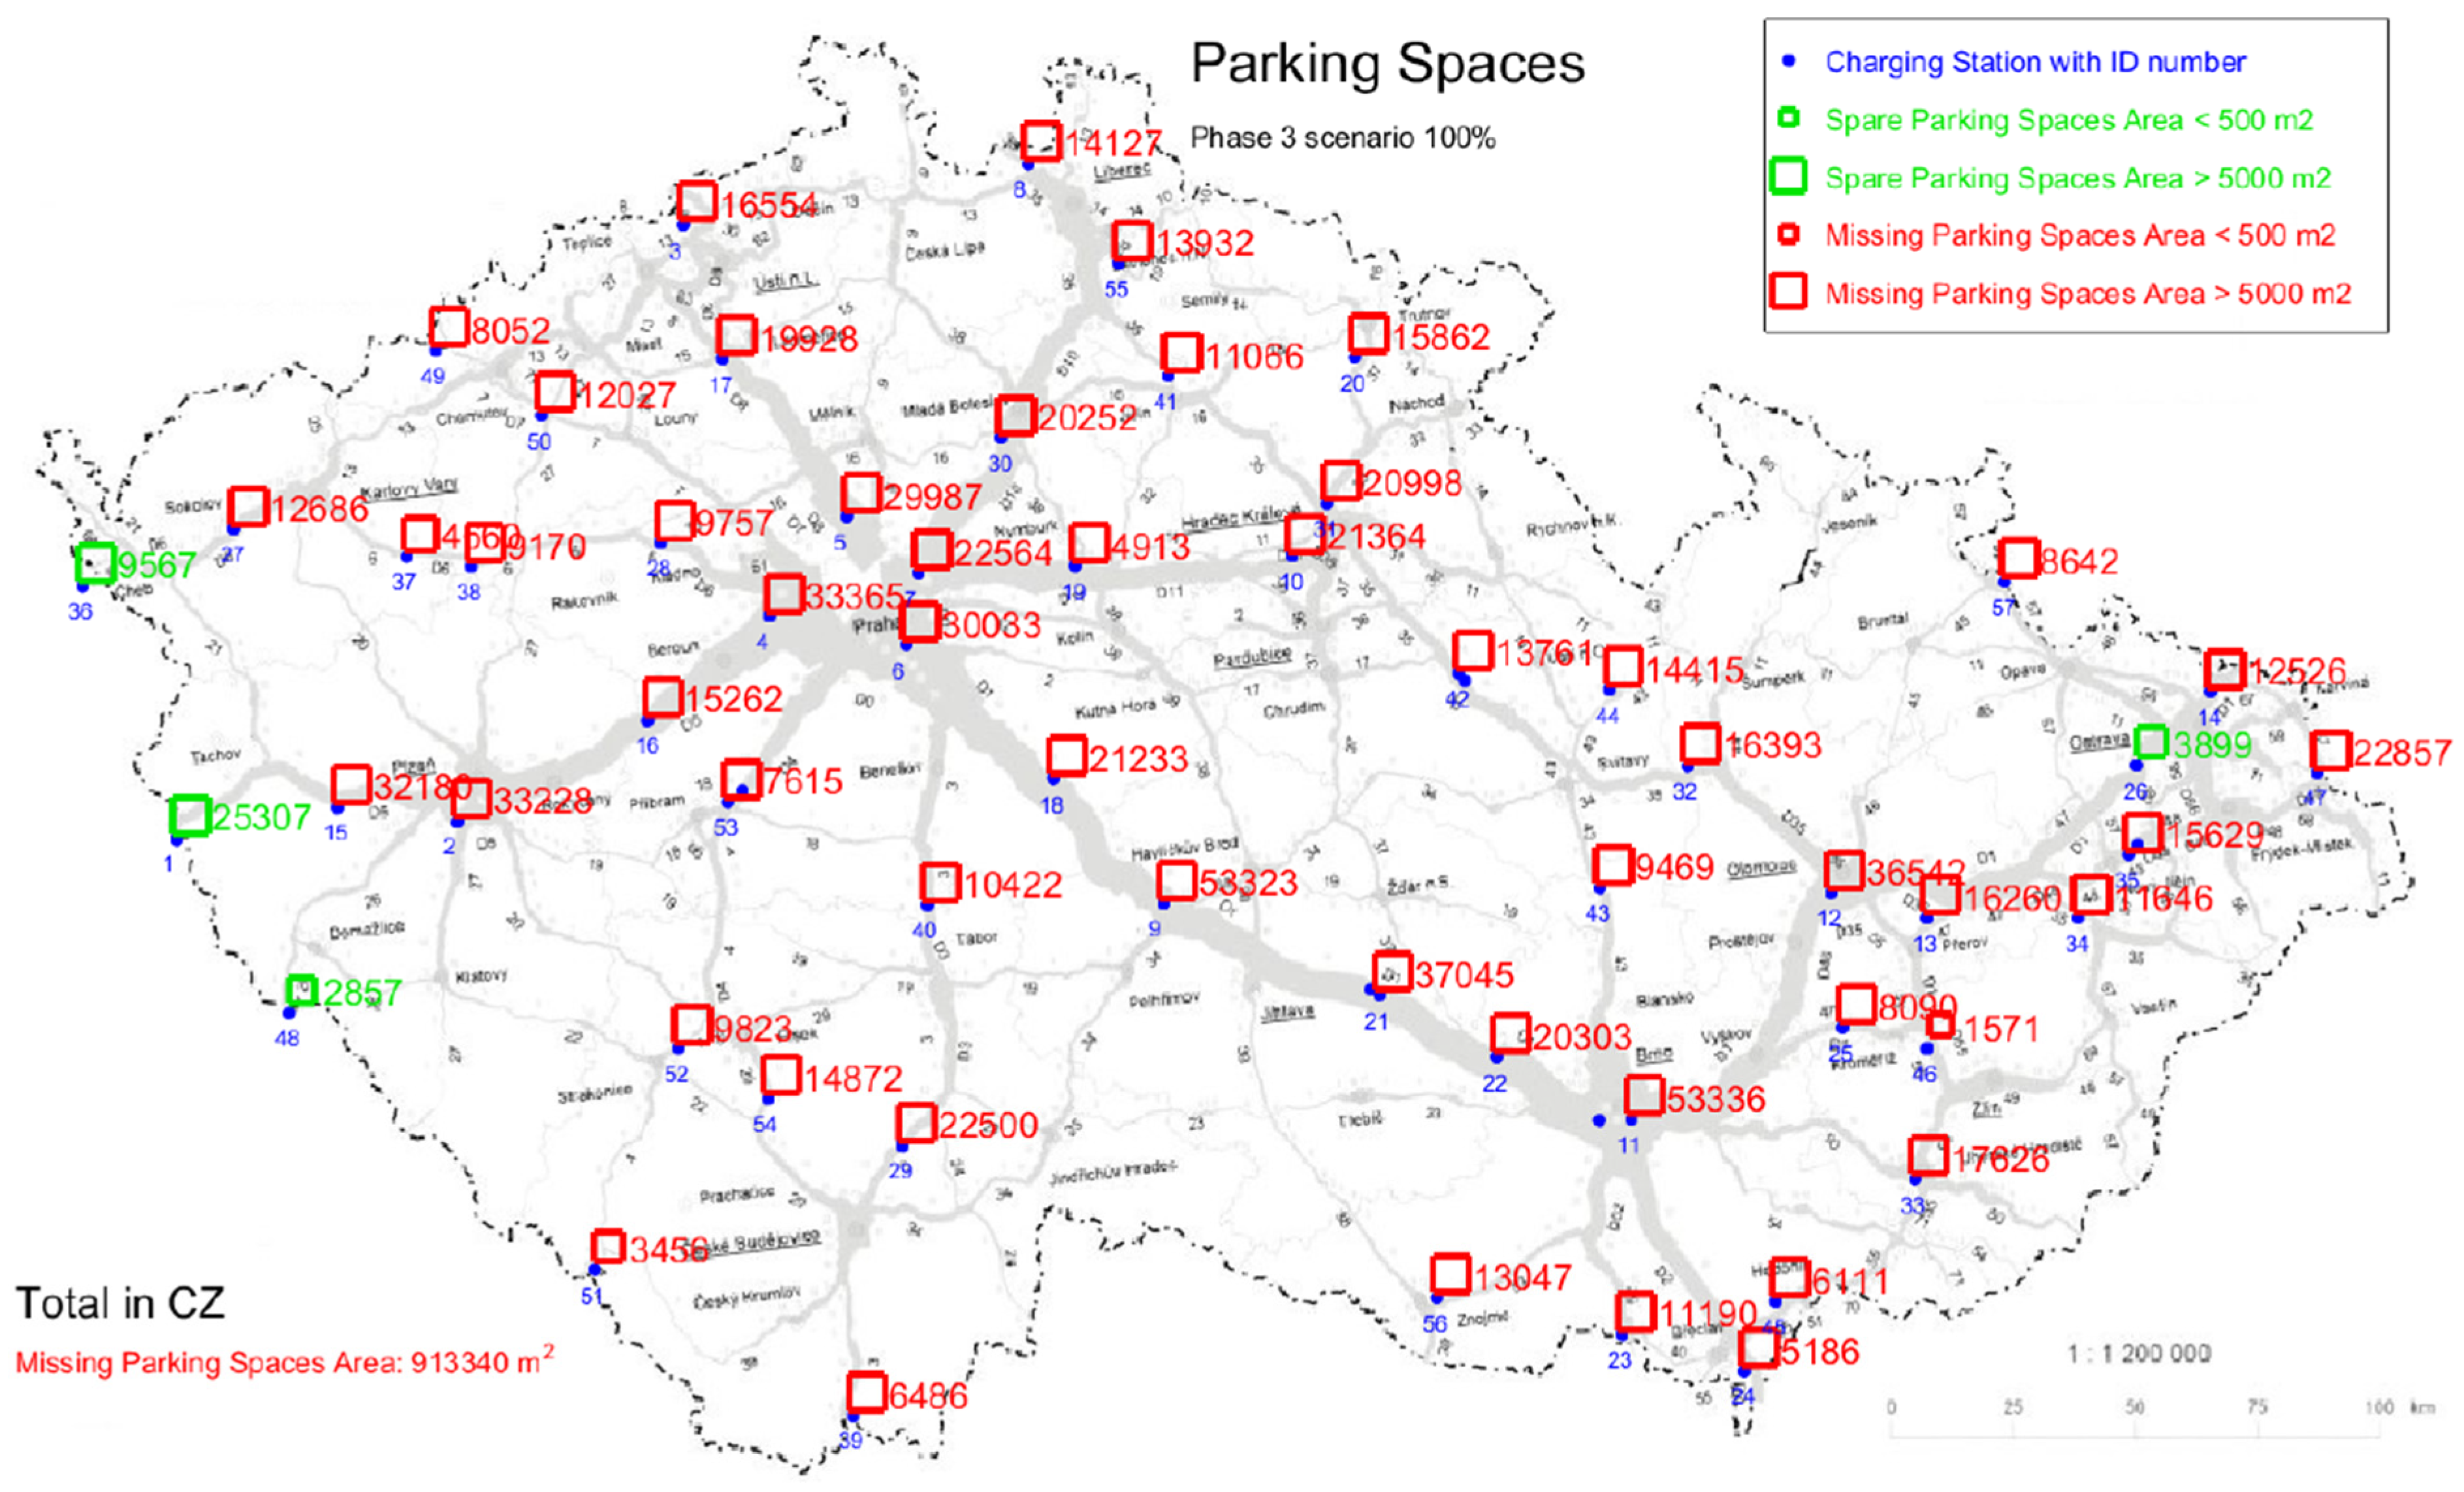
  • Verification calculation with 100% share of BEVs and 100% share of public charging for power levels from the set {170, 350} or {170, 350, 700} kW.

3.3. Graphical Results

This section contains selected results in graphical form.

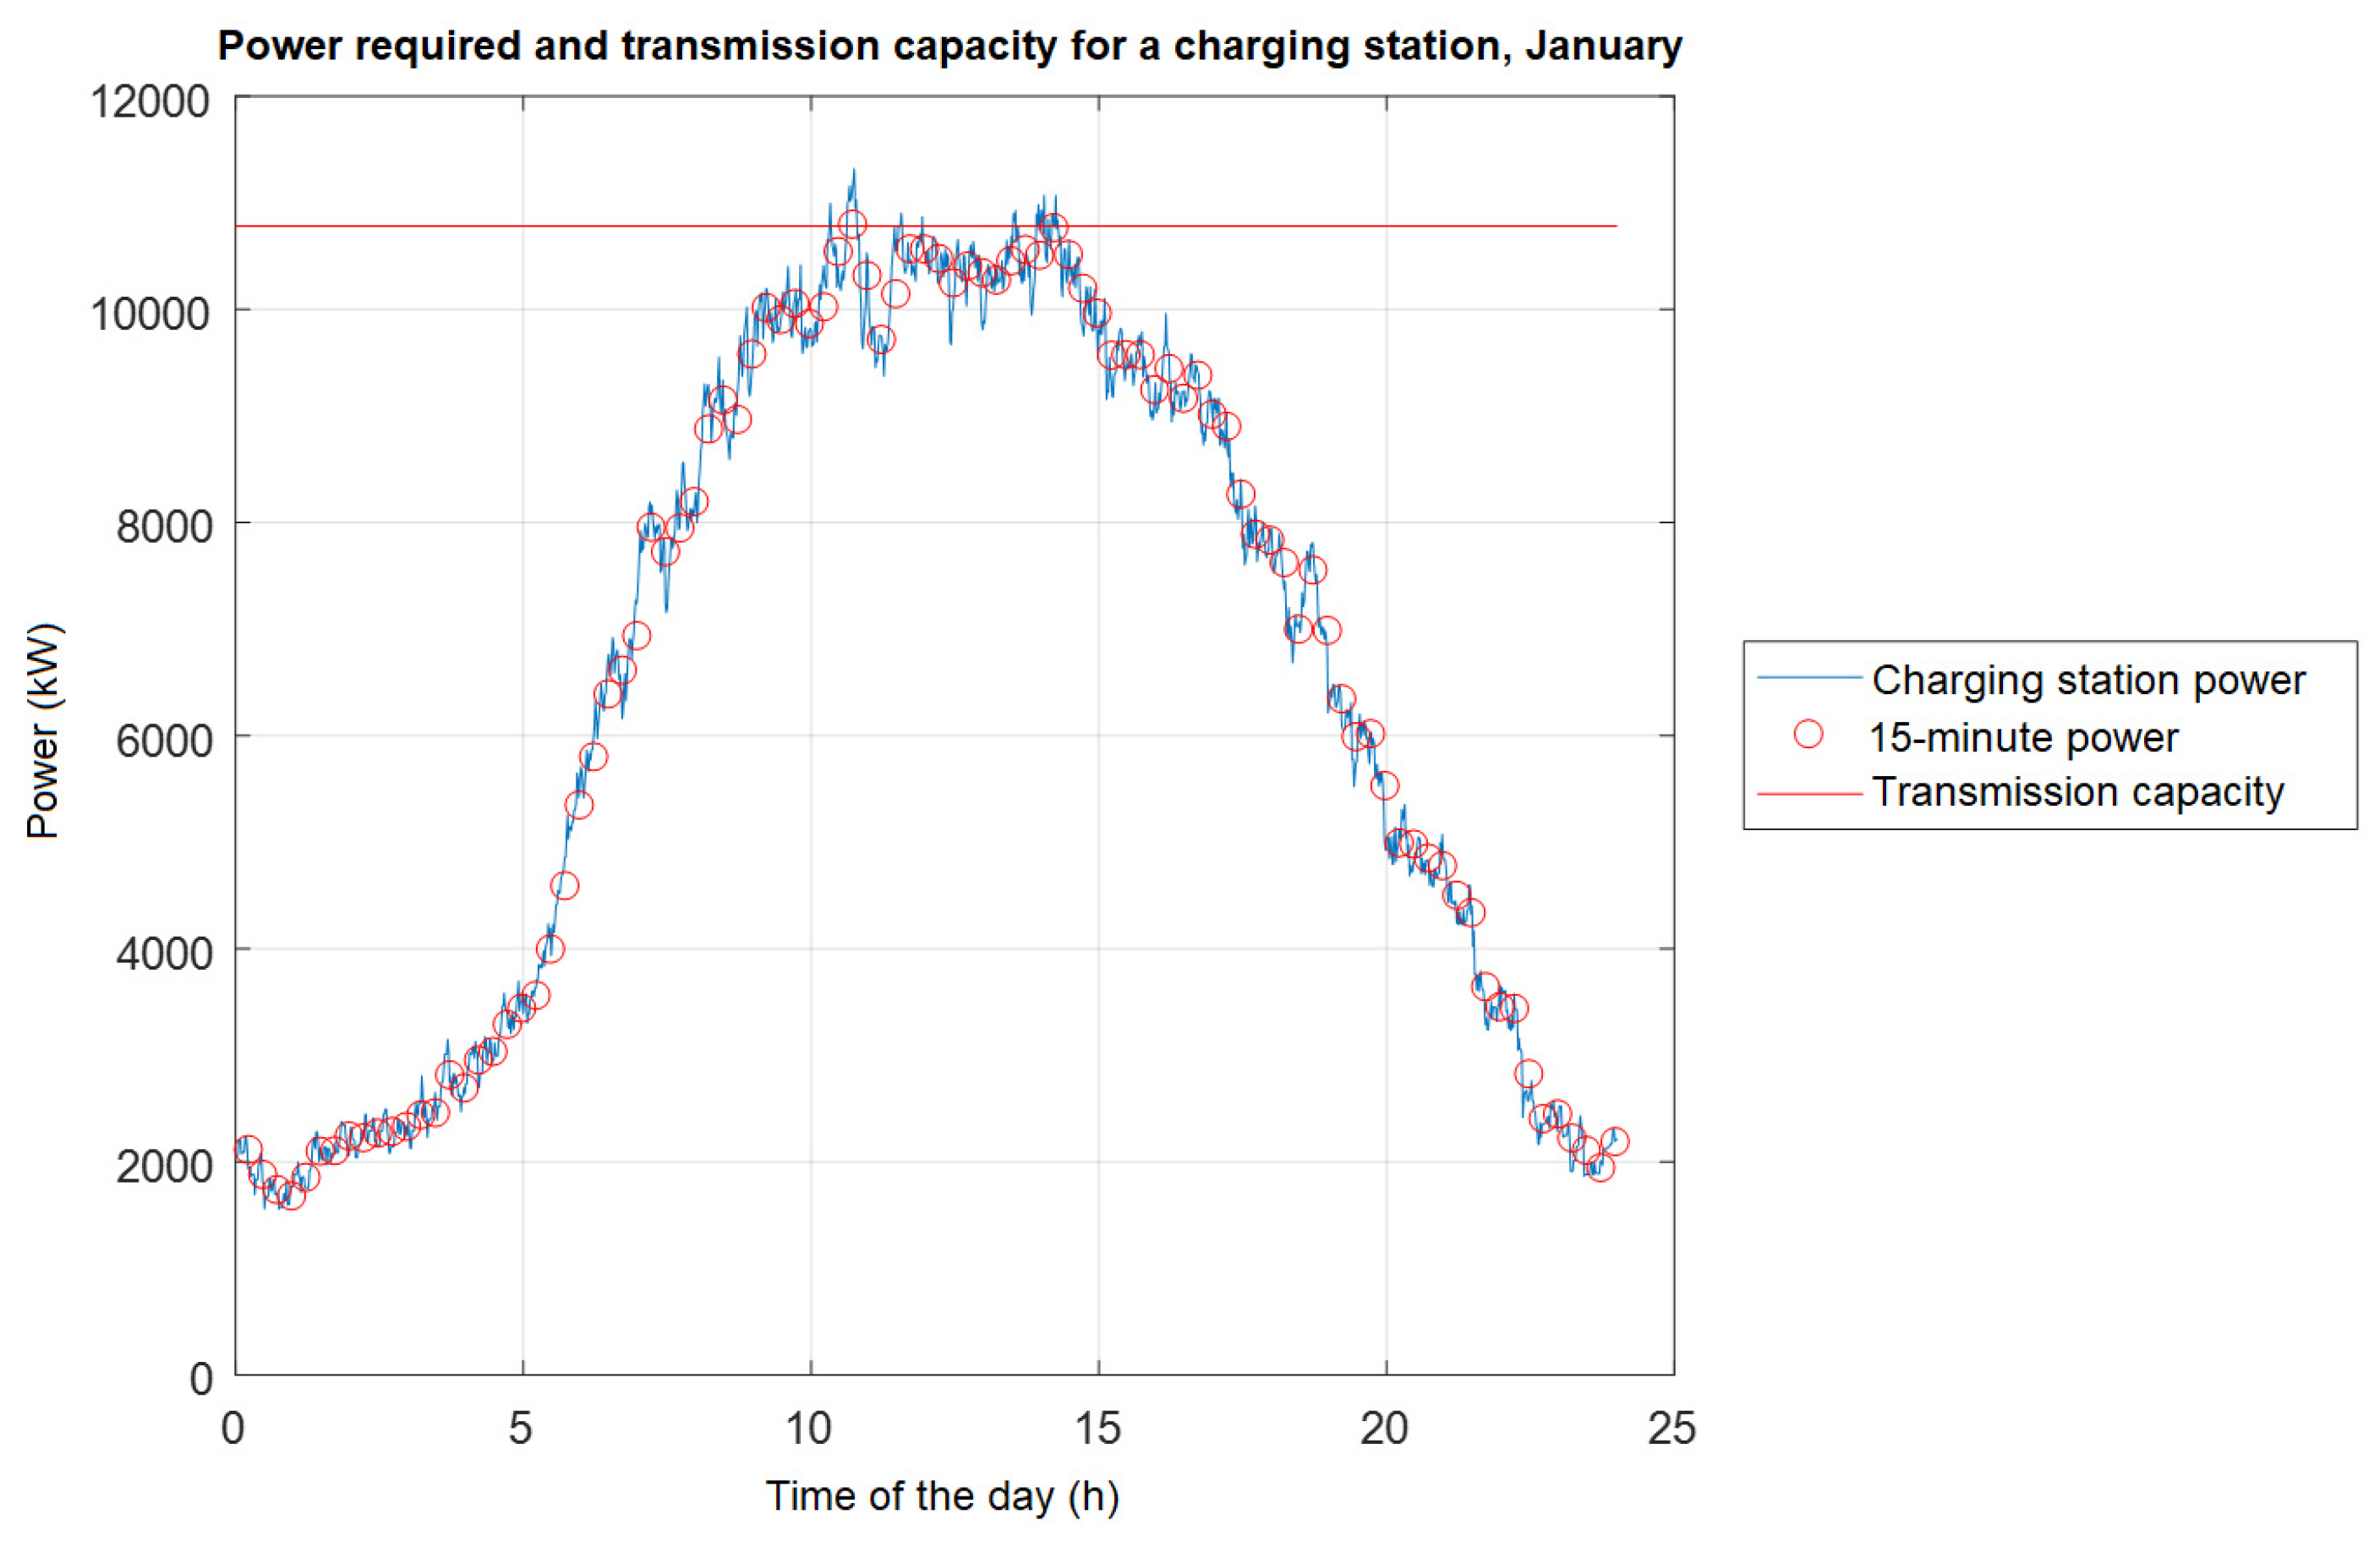
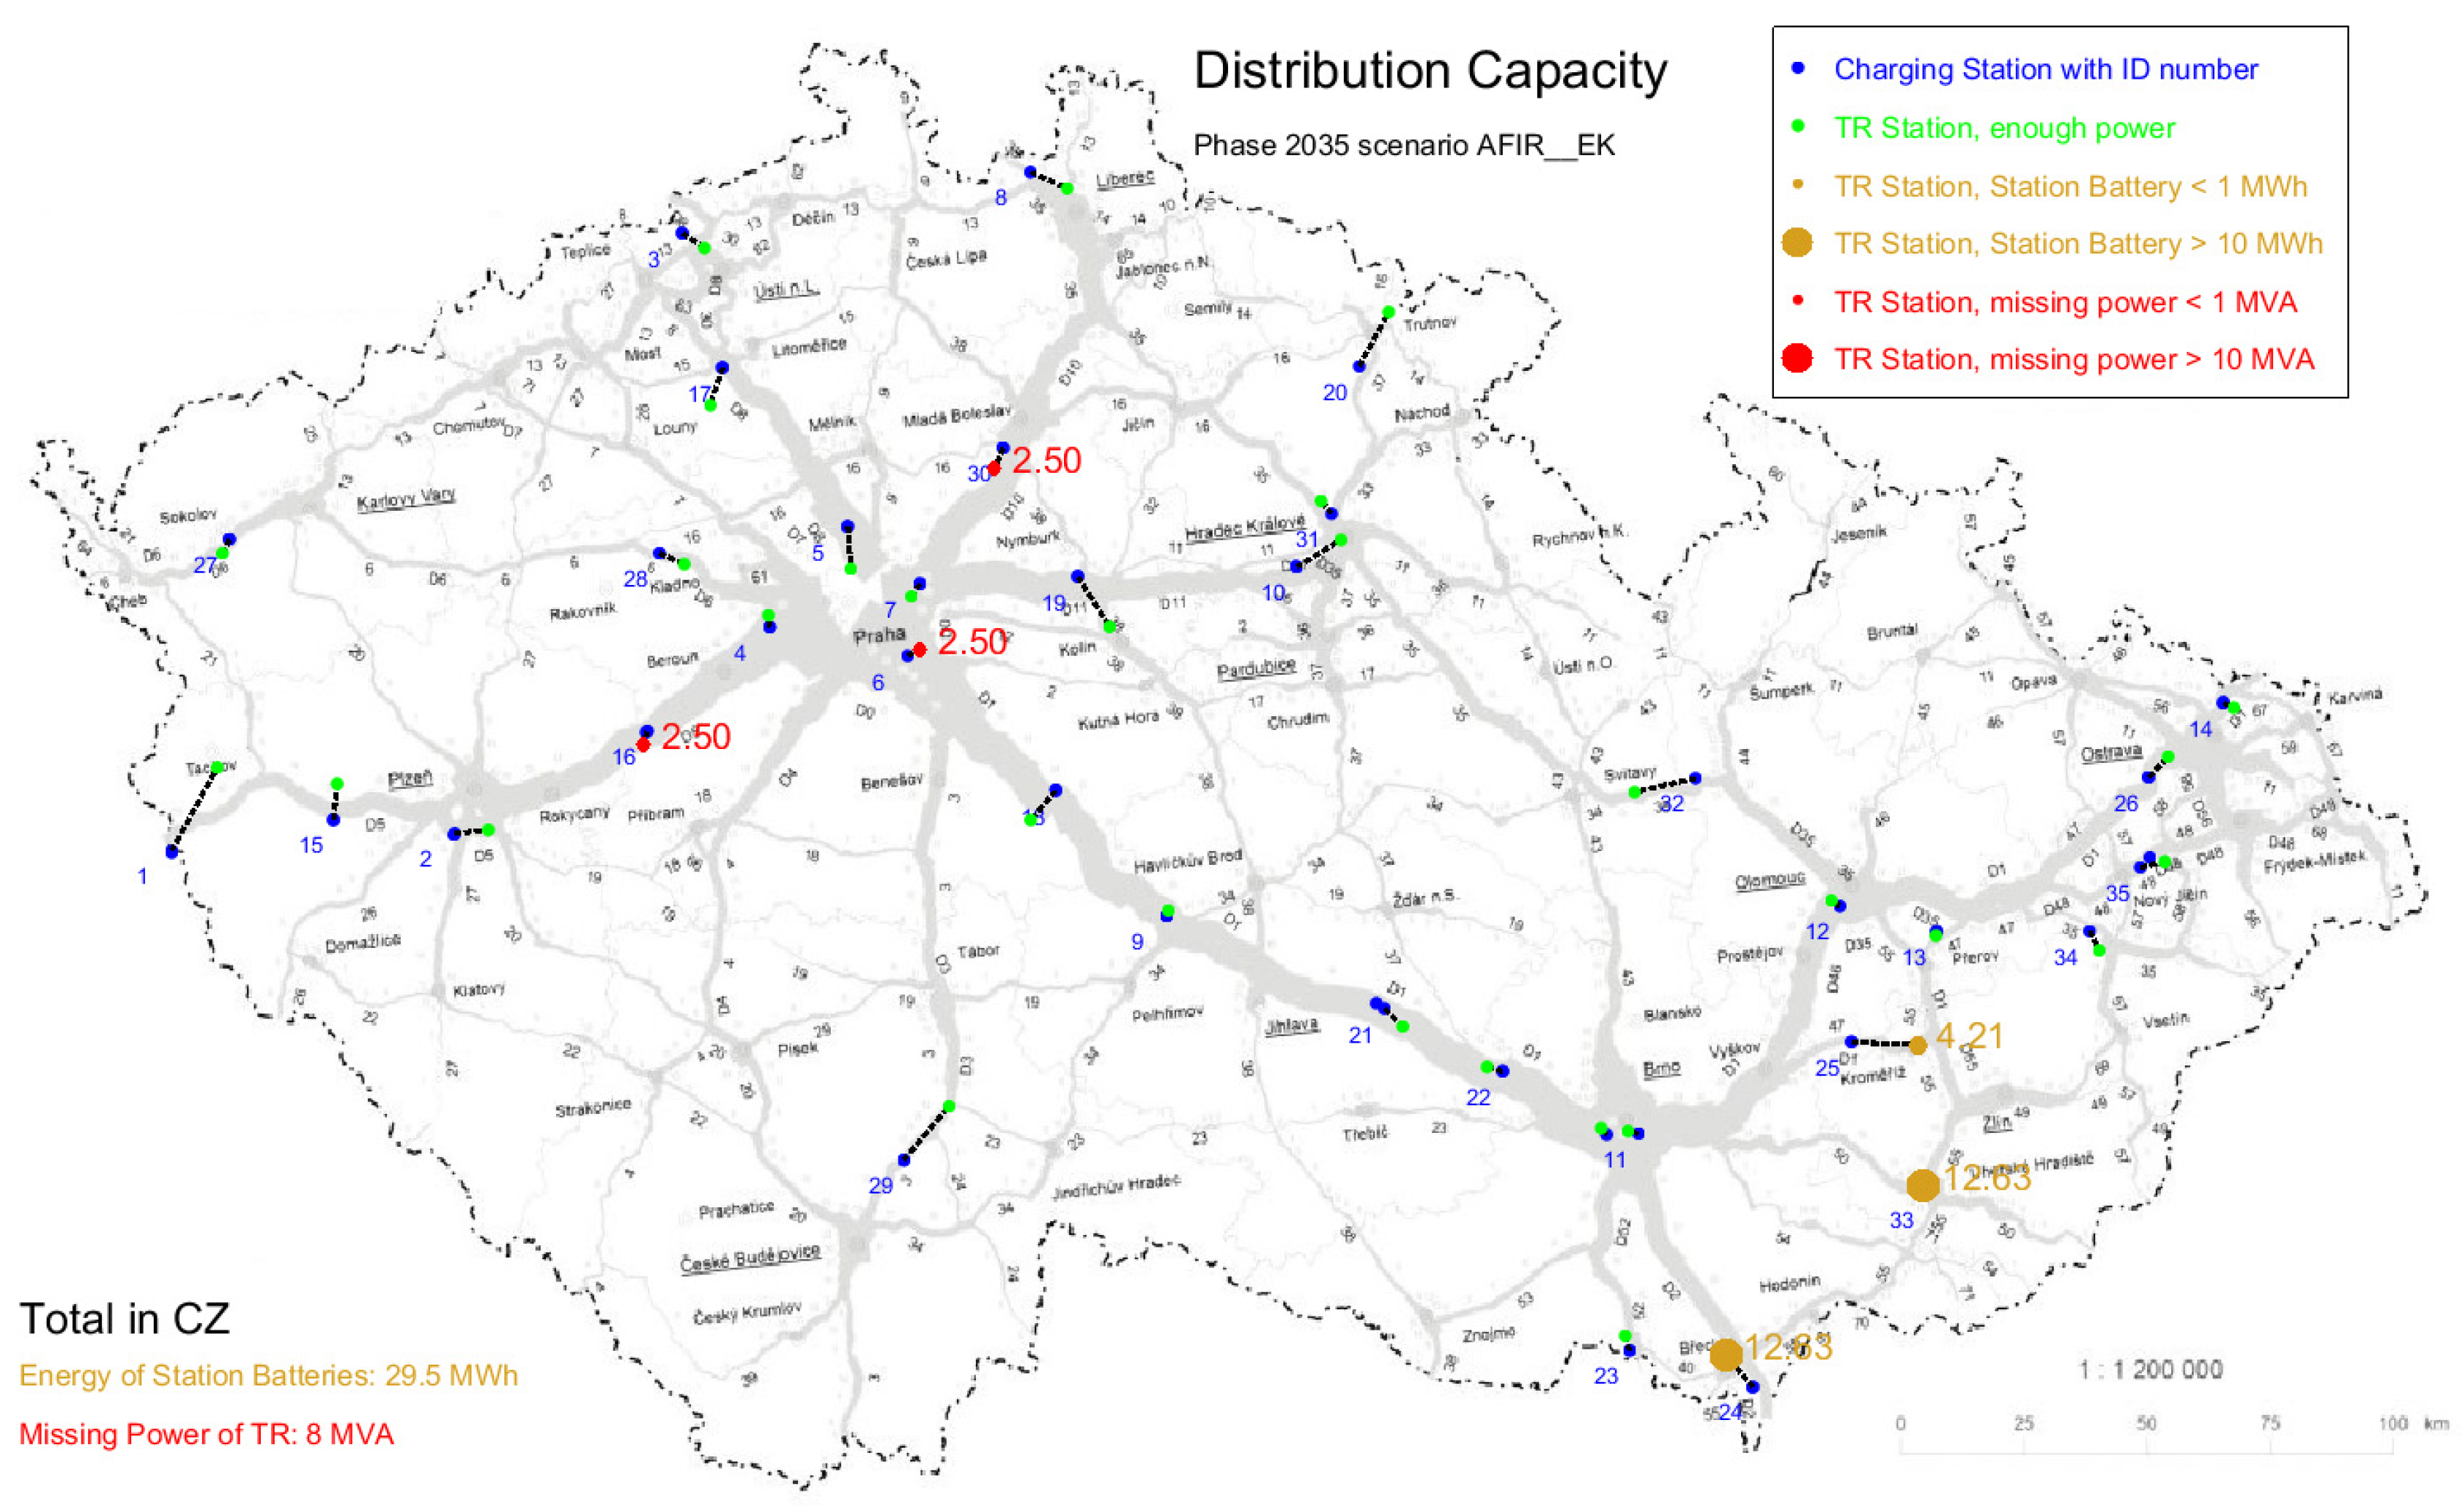
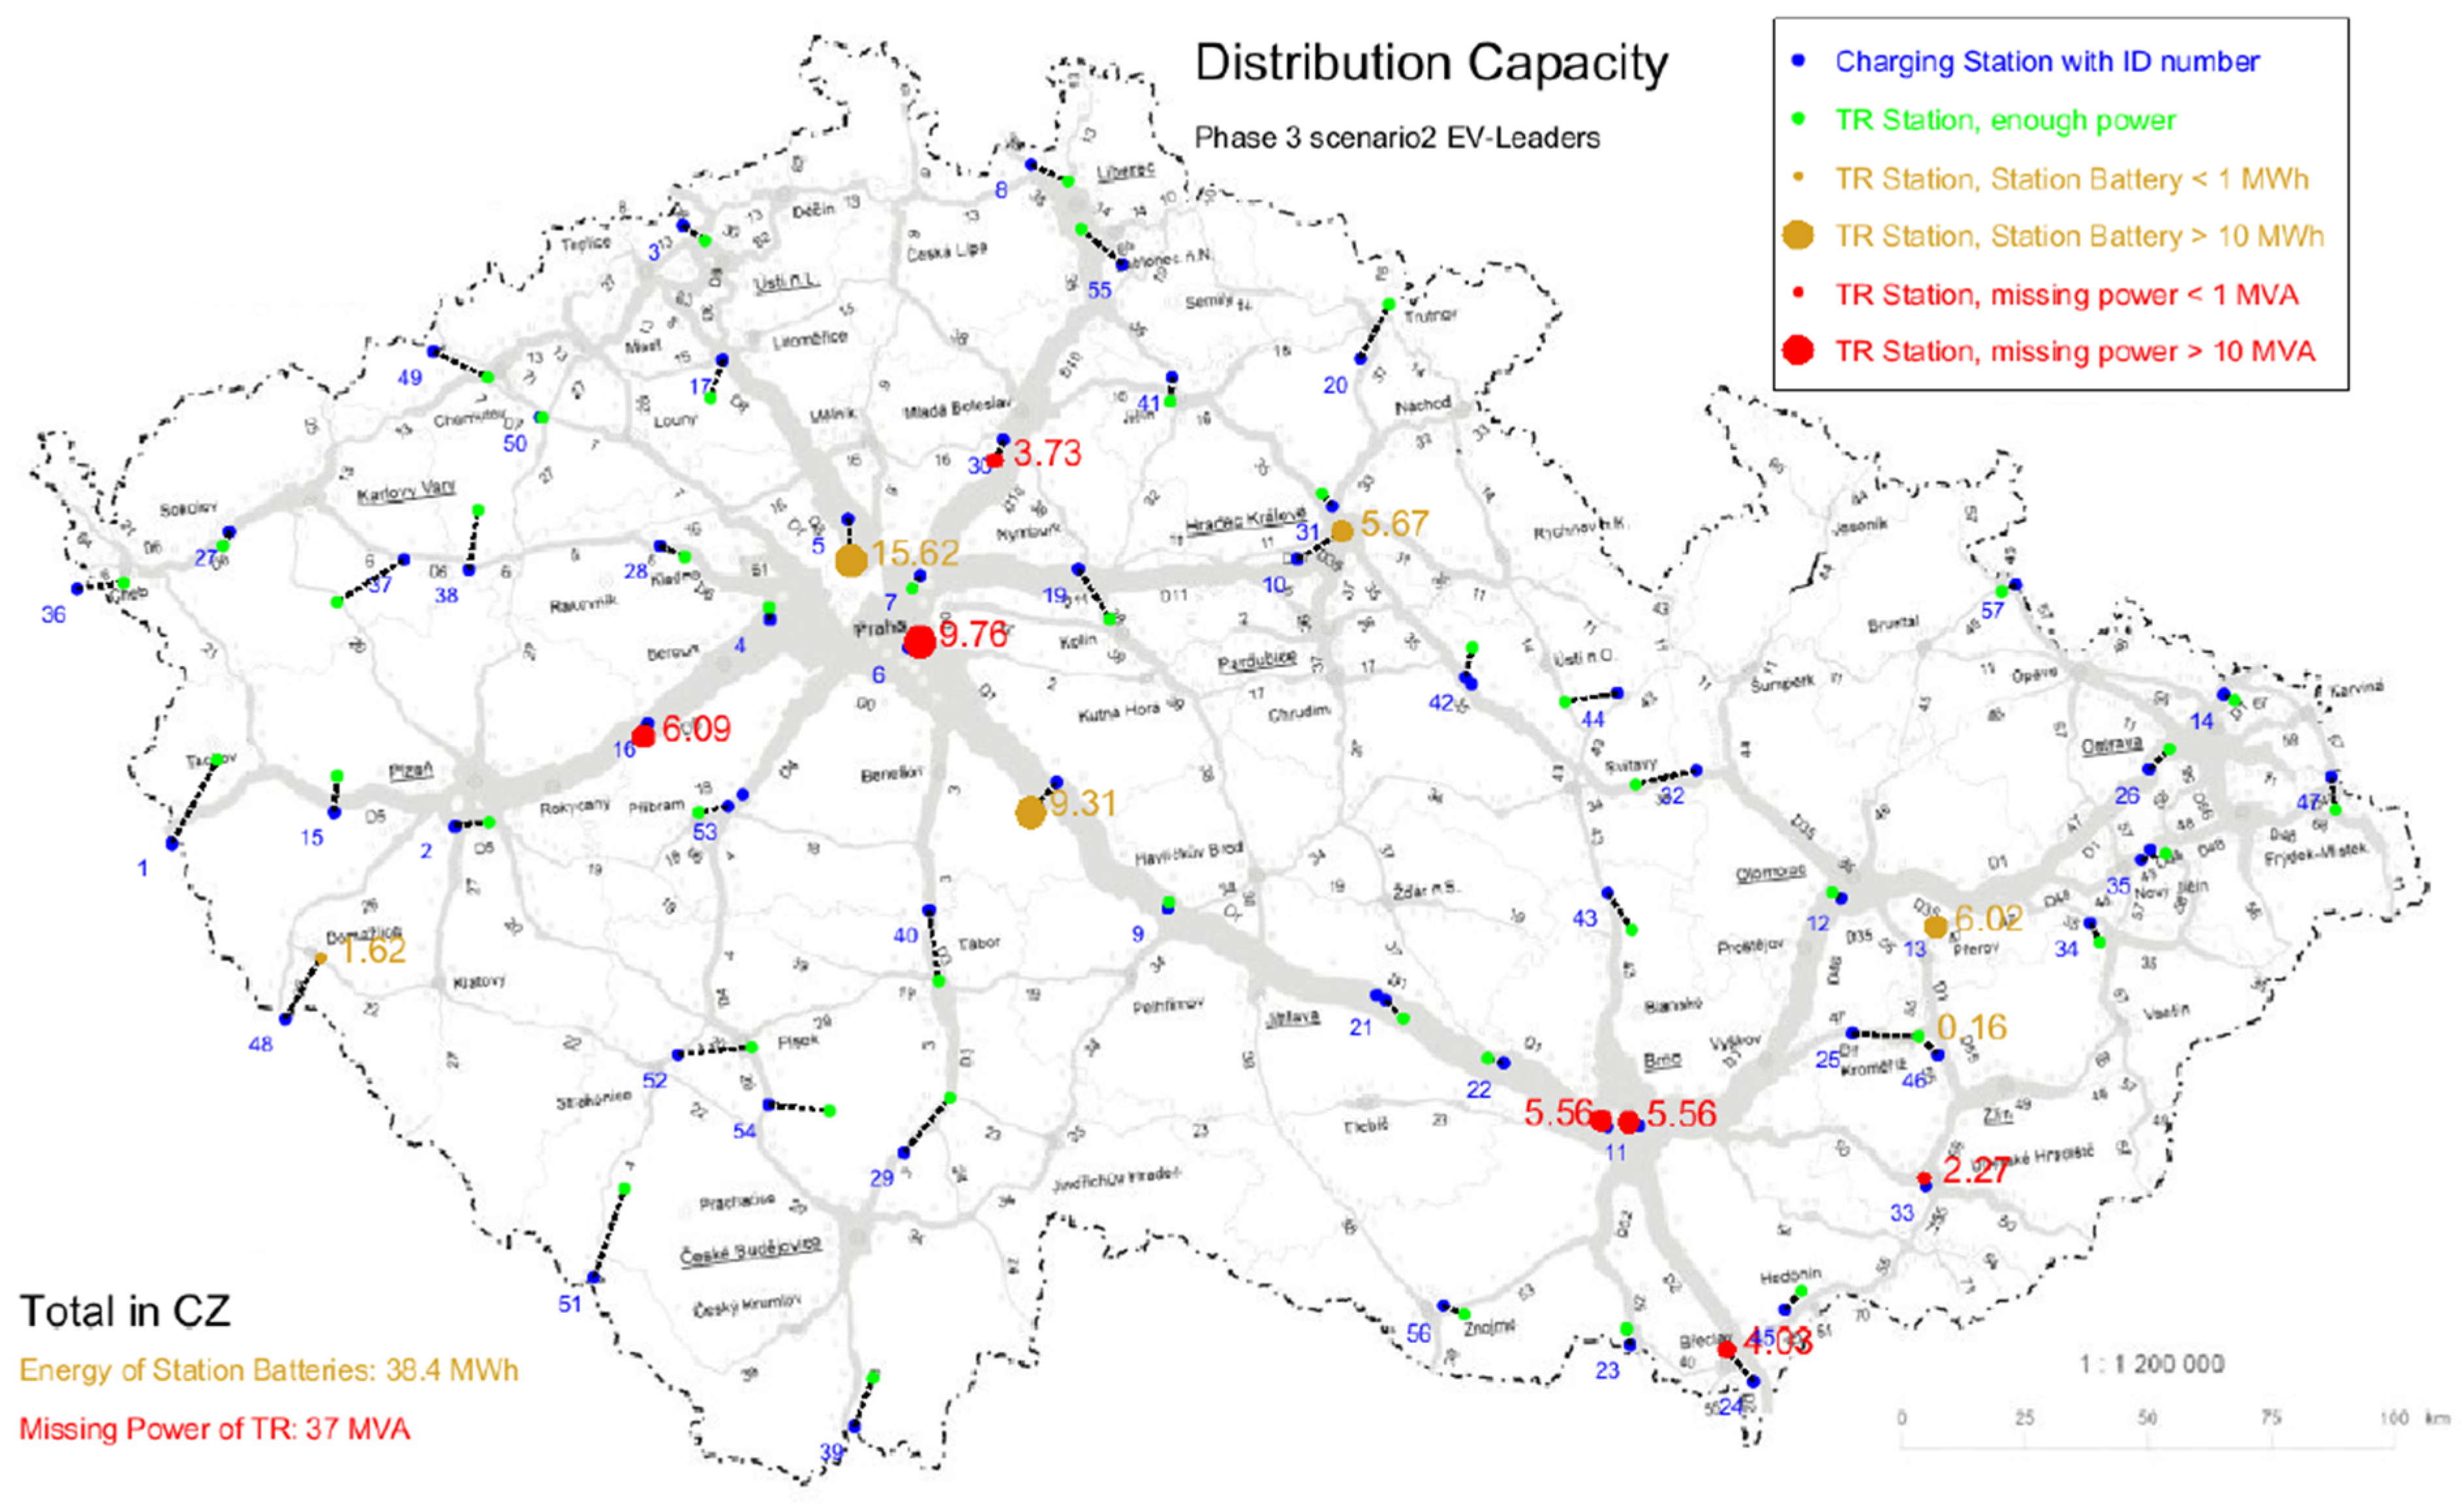
3.3.1. Power Distribution Demands

Power distribution demands of AFIR_EK scenario depicted in Figure 10. In the Figure 11 is depicted power distribution demands of Phase 3, and Figure 12 shows power distribution demands of verification scenario with 100% share of electric trucks. Comparison of different scenarios is shown in the Figure 13.

3.3.2. Spatial Demands for Parking

Following charts show parking space demands for different scenario Figure 14 shows demand for AFIR_EK scenario, Figure 15 shows demand for Phace3 and Figure 16 show demand for of verification scenario of 100% share of electric trucks.

3.4. Comment on Numerical Results

3.4.1. Scenario AFIR_EK

In the year 2025, the distribution capacity is sufficient, and in one out of the total of 14 CHS, it would be necessary to install a station battery with an energy capacity of 3.4 MWh. Sufficient parking areas are available.
In the year 2030, the distribution capacity would need to be increased by a total of 5 MVA for 2 CHS out of the total of 35. In 3 additional CHS, station batteries with a total energy capacity of 20.2 MWh would need to be installed. Parking areas would need to be increased by a total of 4865 m2 in five CHS.
In the year 2035, the distribution capacity would need to be increased by a total of 8 MVA for 3 CHS out of the total of 35. In 3 additional CHS, station batteries with a total energy capacity of 29.5 MWh would need to be installed. Parking areas would need to be increased by a total of 10,832 m2 in ten CHS.

3.4.2. Scenario AFIR_EP

In the year 2025, the distribution capacity is sufficient, and in one out of the total of 14 CHS, it would be necessary to install a station battery with an energy capacity of 8.4 MWh. Sufficient parking areas are available.
In the year 2027, station batteries with a total energy capacity of 25.3 MWh would need to be installed in three CHS. Parking areas would need to be increased by a total of 1928 m2 in five CHS.
In the year 2030, the distribution capacity would need to be increased by a total of 8 MVA for 2 CHS out of the total of 35. In 3 additional CHS, station batteries with a total energy capacity of 50.5 MWh would need to be installed. Parking areas would need to be increased by a total of 3947 m2 in five CHS.
In the year 2032, the distribution capacity would need to be increased by a total of 12 MVA for 3 CHS out of the total of 35. In 3 additional CHS, station batteries with a total energy capacity of 67.3 MWh would need to be installed. Parking areas would need to be increased by a total of 9088 m2 in nine CHS.

3.4.3. Scenario INDUSTRY BASELINE According to the Methodology

In the year 2025, the distribution capacity is sufficient, and no CHS out of the total of 14 would require the installation of a station battery. Sufficient parking areas are available.
In the year 2030, the distribution capacity would need to be increased by a total of 2 MVA for 1 CHS out of the total of 35. In 2 additional CHS, station batteries with a total energy capacity of 3.8 MWh would need to be installed. Parking areas would need to be increased by a total of 4,79 m2 in seven CHS.
In the year 2035, the distribution capacity would need to be increased by a total of 15 MVA for 4 CHS out of the total of 57. In 3 additional CHS, station batteries with a total energy capacity of 11.8 MWh would need to be installed. Parking areas would need to be increased by a total of 18,004 m2 in 18 CHS.

3.4.4. Scenario EV-Leaders According to the Methodology

In the year 2025, the distribution capacity is sufficient, and in one out of the total of 14 CHS, it would be necessary to install a station battery with an energy capacity of 0.01 MWh. Sufficient parking areas are available.
In the year 2030, the distribution capacity would need to be increased by a total of 5 MVA for 2 CHS out of the total of 35. In 3 additional CHS, station batteries with a total energy capacity of 4.1 MWh would need to be installed. Parking areas would need to be increased by a total of 7849 m2 in 8 CHS.
In the year 2035, the distribution capacity would need to be increased by a total of 37 MVA for 6 CHS out of the total of 57. In 6 additional CHS, station batteries with a total energy capacity of 38.4 MWh would need to be installed. Parking areas would need to be increased by a total of 39,634 m2 in 21 CHS.

3.4.5. Scenario Road-2-Zero According to the Methodology

In the year 2025, the distribution capacity is sufficient, and in one out of the total of 14 CHS, it would be necessary to install a station battery with an energy capacity of 1.6 MWh. Sufficient parking areas are available.
In the year 2030, the distribution capacity would need to be increased by a total of 8 MVA for 3 CHS out of the total of 35. In 3 additional CHS, station batteries with a total energy capacity of 17.5 MWh would need to be installed. Parking areas would need to be increased by a total of 11,232 m2 in nine CHS.
In the year 2035, the distribution capacity would need to be increased by a total of 52 MVA for 7 CHS out of the total of 57. In 10 additional CHS, station batteries with a total energy capacity of 76.2 MWh would need to be installed. Parking areas would need to be increased by a total of 56,929 m2 in 24 CHS.

4. Conclusions

The article presents a methodology for the placement of charging stations specifically designed for heavy-duty vehicles. The methodology provides detailed information regarding the spatial distribution and power requirements of the stations. It can be applied in any area where the necessary inputs are available. The study case presented in this article focuses on the specific context of the Czech Republic, reflecting the reality of the country.
Results of the methodology presented in this paper are as detailed as possible, but still, they are conceptual results, not covering such details as, e.g., which part of available distribution power capacity is reserved for which purposes. Only the value of distribution capacity in the area neighboring the respective charging station is evaluated.
Based on the results analyzed in detail in Section 3.4 Comment on Numerical Results, the most feasible considered scenario is AFIR_EK. In the year 2035, the distribution capacity would need to be increased by a total of 8 MVA for 3 charging stations out of the total of 35. In 3 additional charging stations, station batteries with a total energy capacity of 29.5 MWh would need to be installed. Parking areas would need to be increased by a total of 10,832 m2 in ten charging stations.
AFIR_EP is the more demanding scenario with the necessary increasing the distribution capacity by a total of 12 MVA for 3 charging stations out of the total of 35 necessary station batteries with a total energy of 67.3 MWh and parking places deficit of a total 9088 m2, in the year 2032.
Results of the author’s methodology presented in this paper compare three main scenarios: Industry Baseline, EV-Leaders, and Road-2-Zero in the year 2025, 2030, and 2035. The Industry Baseline scenario is feasible without any modification of distribution capacity or parking areas in 2025, but will require increasing to 2 MVA distribution capacity, 3.8 MWh station batteries, and 4479 m2 of parking areas in 2030, and increasing to 15 MVA distribution capacity, 11.8 MWh station batteries, and 18,004 m2 of parking areas in 2035.
The EV-Leaders scenario will require building 0.01 MWh station batteries in 2025, increasing to 5 MVA distribution capacity, 4.1 MWh station batteries, and 7849 m2 of parking areas in 2030, and increasing to 37 MVA distribution capacity, 38.4 MWh station batteries and 39,634 m2 of parking areas in 2035.
The most demanding Road-2-Zero scenario will require building 1.6 MWh station batteries in 2025, an increase to 8 MVA distribution capacity, 17.5 MWh station batteries, and 11,232 m2 of parking areas in 2030, and increasing to 52 MVA distribution capacity, 76.2 MWh station batteries, and 56,929 m2 of parking areas in 2035.

Author Contributions

Conceptualization, J.H., K.F., N.K., J.S. and H.O.; methodology, J.S., H.O., H.M. and J.H.; software, H.O.; validation, J.H., J.S. and K.F.; formal analysis, J.H.; investigation, N.K.; resources, H.B.; data curation, H.O. and J.S.; writing—original draft preparation, J.H.; writing—review and editing, J.H.; visualization, J.S.; supervision, J.H.; project administration, H.B.; funding acquisition, H.B. All authors have read and agreed to the published version of the manuscript.

Funding

This research has been supported by the grant TA ČR Théta Dynamické dobíjení TK 05010044, CTU in Prague.

Data Availability Statement

Data are contained within the article and referenced materials.

Acknowledgments

Part of this research has been supported by the grant TA ČR Théta 2 TK02010106 Čistá mobilita a její perspektiva v nákladní silniční dopravě. CTU in Prague.

Conflicts of Interest

The authors declare no conflict of interest.

References

  1. Mortimer, B.J.; Hecht, C.; Goldbeck, R.; Sauer, D.U.; De Doncker, R.W. Electric Vehicle Public Charging Infrastructure Planning Using Real-World Charging Data. World Electr. Veh. J. 2022, 13, 94. [Google Scholar] [CrossRef]
  2. Unterluggauer, T.; Rich, J.; Andersen, P.B.; Hashemi, S. Electric vehicle charging infrastructure planning for integrated transportation and power distribution networks: A review. ETransportation 2022, 12, 100163. [Google Scholar] [CrossRef]
  3. Balcioglu, G. (Ed.) Charging Infrastructure Electromobility. DKE–German Commission for Electrical, Electronic & Information Technologies in DIN and VDE; DKE–VDE Association for Electrical, Electronic & Information Technologies: Offenbach am Main, Germany, 2022. [Google Scholar]
  4. Speth, D.; Plötz, P.; Funke, S.; Vallarella, E. Public fast charging infrastructure for battery electric trucks–a model-based network for Germany. Environ. Res. Infrastruct. Sustain. 2022, 2, 025004. [Google Scholar] [CrossRef]
  5. Speth, D.; Sauter, V.; Plötz, P. Where to Charge Electric Trucks in Europe–Modelling a Charging Infrastructure Network. In Proceedings of the 35th International Electric Vehicle Symposium and Exhibition (EVS35), Oslo, Norway, 11–15 June 2022; Available online: https://publica-rest.fraunhofer.de/server/api/core/bitstreams/4940547d-9398-40ae-90a3-a2d35201b895/content (accessed on 10 July 2023).
  6. Regulation of the European Parliament and of the Council on the Deployment of Alternative Fuels Infrastructure, and Repealing Directive 2014/94/EU of the European Parliament and of the Council, Brussels, 13.7.2023, 2021/0223(COD) (AFIR). Available online: https://eur-lex.europa.eu/legal-content/en/TXT/?uri=CELEX%3A52021PC0559 (accessed on 15 October 2023).
  7. Proposal for a Regulation of the European Parliament and of the Council on the Deployment of Alternative Fuels Infrastructure, and Repealing Directive 2014/94/EU of the European Parliament and of the Council, Brussels, 14.7.2021, COM(2021) 0559 Final, European Commission (AFIR–Proposal of EC). Available online: https://eur-lex.europa.eu/legal-content/EN/TXT/PDF/?uri=CELEX:52021DC0550&from=EN (accessed on 23 December 2023).
  8. Draft European Parliament Legislative Resolution on the proposal for a Regulation of the European Parliament and of the Council on the Deployment of Alternative Fuels Infrastructure, and Repealing Directive 2014/94/EU of the European Parliament and of the Council, Brussels, 19.10.2022, COM(2021) 0559–C9-0331/2021–2021/2023(COD), European Parliament (AFIR–Proposal of EP for Trilogue Negotations). Available online: https://eur-lex.europa.eu/legal-content/EN/TXT/HTML/?uri=OJ:C:2022:209:FULL&from=EN (accessed on 23 December 2023).
  9. Ministry of Transport ČR. National Traffic Census-Celostátní Sčítání Dopravy 2016, ŘSD. Available online: http://scitani2016.rsd.cz/ (accessed on 10 July 2023).
  10. Hykš, O. Tabulky dopravních výkonů v atrakčních obvodech jednotlivých nabíjecích stanic, Output of the project grant TAČR Théta 2 TK02010106 Čistá mobilita a její perspektiva.
  11. Ministry of Transport ČR, Document TP 189, Stanovení Intenzit Dopravy na Pozemních Komunikacích, Technické Podmínky. 2018. Available online: https://pjpk.rsd.cz/data/USR_001_2_8_TP/TP_189_2018_final.pdf (accessed on 6 October 2023).
  12. Hykš, O. Měrná spotřeba pro jednotlivé kategorie vozidel, model SUMO, Mgr. Oldřich Hykš, Output of the project grant TAČR Théta 2 TK02010106 Čistá mobilita a její perspektiva.
  13. Croce, A.I.; Musolino, G.; Rindone, C.; Vitetta, A. Traffic and Energy Consumption Modelling of Electric Vehicles: Parameter Updating from Floating and Probe Vehicle Data. Energies 2022, 15, 82. [Google Scholar] [CrossRef]
  14. Ministry of Transport ČR. Document TP 171, Vlečné křivky pro ověřování průjezdnosti směrových prvků pozemních komunikací, Technické podmínky, 2005.
  15. ČSN 73 6056; Odstavné a Parkovací Plochy Silničních Vozidel. MDT: Praha, Czech Republic, 1987.
  16. Mathieu, L. Unlocking Electric Trucking in the EU: Recharging in Cities; Transport & Environment: Brussels, Belgium, 2020; Available online: https://www.smarttransport.org.uk/whitepapers/reports-1/unlocking-the-electric-trucking-in-the-eu-recharging-in-cities (accessed on 10 July 2023).
  17. Suzan, S.; Mathieu, L. Unlocking Electric Trucking in the EU: Recharging along Highways, Electrification of Long-Haul Trucks; Transport & Environment: Brussels, Belgium, 2021; Volume 2. [Google Scholar]
  18. ČHMÚ, Database of Emtorologicla Reports, Regular Meteorological Meassurements Praha. Available online: https://www.chmi.cz/historicka-data/pocasi/praha-klementinum# (accessed on 10 October 2023).
  19. Bínová, H.; Hykš, O.; Hospodka, J.; Kekula, F.; Neubergová, K.; Sadil, J. Document Metodika pro volbu koncepce nabíjecí stanice pro nákladní silniční dopravu, verze 4-0, 2022, Output of the project grant TAČR Théta 2 TK02010106 Čistá mobilita a její perspektiva.
  20. Ahmadian, A.; Mohammadi-ivatloo, B.; Elkamel, A. Electric Vehicles in Energy Systems: Modelling, Integration, Analysis, and Optimization; Springer Nature: Cham, Switzerland, 2020; ISBN 978-3-030-34448-1. [Google Scholar]
  21. Mathieu, L. Recharge EU Trucks: Time to Act! Transport & Environment: Brussels, Belgium, 2020; Available online: https://evmarketsreports.com/recharge-eu-trucks-time-to-act/ (accessed on 10 July 2023).
Figure 1. Architecture of the proposed methodology—Step 2: Calculation.
Infrastructures 09 00007 g001
Figure 2. Phase 1, Urban nodes (red) and basic coverage of the Core TEN-T (dark blue).
Infrastructures 09 00007 g002
Figure 3. Phase 2, Densification of the Core TEN-T network (light blue) and basic coverage of the Comprehensive TEN-T network (dark green).
Infrastructures 09 00007 g003
Figure 5. An illustrative example of required power and reserved capacity of a specific charging station of a specific month.
Infrastructures 09 00007 g005
Figure 6. An illustrative example of occupancy of charging points of power levels of a specific charging station in a specific month.
Infrastructures 09 00007 g006
Figure 7. Map depicting 14 charging stations in Phase 1.
Infrastructures 09 00007 g007
Figure 8. Map depicting 35 charging stations in Phase 2.
Infrastructures 09 00007 g008
Figure 9. Map depicting 57 charging stations in Phase 3.
Infrastructures 09 00007 g009
Figure 10. Power distribution demands of AFIR_EK scenario.
Infrastructures 09 00007 g010
Figure 11. Power distribution demands of Phase 3 EV_Leaders scenario according to the author’s methodology.
Infrastructures 09 00007 g011
Figure 12. Power distribution demands of verification scenario of 100% share of electric trucks, according to the author’s methodology.
Infrastructures 09 00007 g012
Figure 13. Power distribution demands comparison of different scenarios according to the author’s methodology with AFIR requirements.
Infrastructures 09 00007 g013
Figure 14. Parking space demands of AFIR_EK scenario.
Infrastructures 09 00007 g014
Figure 15. Parking space demands of Phase 3 EV-Leaders scenario according to the author’s methodology.
Infrastructures 09 00007 g015
Figure 16. Parking space demands of verification scenario of 100% share of electric trucks, according to the author’s methodology.
Infrastructures 09 00007 g016
Table 1. Summary of the main attributes of the proposed charging stations for phases 1 to 3. Shortcuts used in the table: CHS—charging station, TR—transformer station, Lon.—Longitude, Lat.—latitude, capac.—capacity, mv—medium voltage, comp—comprehensive.
PhaseStation IDTypeRoad Nr.CHS NameCHS Lon.
(°N)
CHS Lat.
(°E)
TR Lon.
(°N)
TR Lat.
(°E)
TR NameTR Capac. (MVA)Missing mv Line (km)Parking Places (Pcs.)
Phase 11coreD5Rozvadov49.649012.532149.792012.6604Tachov50.6218
2coreD5Šlovice49.678713.328949.684813.4239Černice240.664
3coreD8Varvažov50.711813.970250.686614.0320Ustí Sever100.371
4coreD5Rudná50.033614.216350.054314.2120Chýně150.450
5coreD8Klíčany50.207214.435950.134014.4439Praha Bohnice50.228
6coreD1Nupaky49.984114.603849.995214.6366Říčany10.3120
7coreD11Beranka50.108314.638950.086714.6145Běchovice390.249
8compI/35Chrastava50.817514.949850.789515.0531Hrádek n.Nisou140.210
9coreD1Humpolec49.536615.332449.546215.3376Humpolec170.228
10coreD11Osice50.137115.699050.184115.8235Hradec Králové 51.160
11coreD1Brno49.162516.661549.167116.6313Komárov51122
12compD35Olomouc49.553817.228249.563317.2043Hněvotín101.618
13coreD1Osek49.510517.500249.503017.4981Prosenice50.680
14cityD1Antošovice49.902418.306949.895018.3367Bohumín101.153
Phase 215coreD5Kladruby49.702912.987649.764012.9980Stříbro180.230
16coreD5Záluží49.854813.871349.830913.8587Hořovice10101
17coreD8Siřejovice50.480814.083950.415914.0485Libochovice250.239
18coreD1Střechov49.752015.020849.701714.9503Řimovice50.863
19coreD11Vrbova Lhota50.120415.082950.034315.1724Kolín západ71.1160
20coreI/37Výšinka50.482915.875250.576615.9582Poříčí1500
21coreD1Kochánov49.377515.946449.346815.9977Velké Meziříčí112.942
22coreD1Devět Křížů49.269816.278649.277416.2348Velká Bíteš201.153
23coreD52Mikulov48.789516.635848.815116.6238Mikulov180.20
24coreD2Lanžhot48.726716.984248.781216.9061Břeclav20.7122
25coreD1Křenovice49.320217.261049.314917.4494Kojetín1,5248
26coreD1Klimkovice49.775318.097649.810718.1519Ostrava Poruba201166
27compD6Staré Sedlo50.184712.694850.160712.6750Vítkov150.230
28compD6Nové Strašecí50.161113.905250.142113.9751Tuchlovice1805
29compI/3Švamberk49.117114.592949.209714.7207Veselí n Lužnicí140.30
30compD10Brodce50.342414.873550.307614.8482Dražice10.319
31compI/35HradecKrálové50.229015.797250.251115.7674Všestary5010
32compI/35Mohelnice49.773716.821649.749616.6500Mor. Třebová100.910
33compD55Uher. Hradiště49.059217.466549.073117.4627Uher.Hradiště20.325
34compI/35Lešná49.510917.930749.477517.9580ValašskéMeziříčí50.315
35compD48Libhošť49.620318.073749.630118.1422Příbor100.254
Phase 336compI/6Pomezí50.086912.265250.096912.3970Jindřichov40.497
37compI/6Verušičky50.136713.184850.063812.9972Toužim120.116
38compI/6Lubenec Ležky50.119913.367050.222213.3924Podbořany2005
39compD3Dolní Dvořiště48.649214.452648.732314.5050Kaplice170.415
40compD3Mitrovice49.533114.663249.411214.6898Tábor100.860
41compI/35Jičín50.450315.347350.408115.3424Nová Paka20020
42compI/35Vysoké Mýto49.934616.171649.984816.1918Choceň10175
43compI/43Letovice49.562616.572749.499116.6405Boskovice300
44compI/43Lanškroun49.906316.599449.892316.4506Česká Třebová1502
45compD55Lužice48.847317.071848.878117.1184Hodonín230.222
46compD55Kurovice49.284717.501549.315117.4491Hulín1.51.580
47compD48Chotěbuz49.761918.609149.706318.6198Ropice350.1510
48doplnI/26Folmava49.345612.849949.450512.9491Domažlice10.560
49doplnI/7Hora sv. Šebes50.495513.267850.450013.4205Chomutov100.64
50doplnD7Velemyšleves50.381613.565950.380813.5748Triangle250.233
51doplnI/4Strážný48.901713.719449.055413.8056Vimperk140.59
52doplnI/4Rovná49.284813.956949.296614.1640Písek160.430
53doplnI/4Příbram49.711614.096849.702114.0156Příbram město60.320
54doplnI/20Protivín49.198314.211049.187714.3822Křtěnov300.77
55doplnI/10Malá Skála50.645815.207750.706915.0898Jeřmanice350.55
56doplnI/53Znojmo48.853716.108948.838216.1691Hodonice2505
57doplnI/57Krnov50.093317.721950.082217.6813Krnov15020
Table 2. The shares of BEV (ratio of traffic realized by BEV to the total traffic) for individual vehicle categories and years.
ScenarioVehicle Category
According to [10]
Vehicle Class
According to ECE
Year 2025Year 2030Year 2035
Industry baselineSNN20.33.09.7
SNPN2 + O0.33.09.7
TNN30.43.711.7
TNPN3 + O0.76.219.9
NSNN3 + O0.76.219.9
EV-LeadersSNN21.97.023.9
SNPN2 + O1.97.023.9
TNN31.77.525.6
TNPN3 + O1.09.532.5
NSNN3 + O1.09.532.5
Road-2-ZeroSNN23.910.532.4
SNPN2 + O3.910.532.4
TNN33.511.033.9
TNPN3 + O1.712.939.9
NSNN3 + O1.712.939.9
Table 3. Summary of the main attributes of the proposed charging stations for phases 1 to 3. Shortcuts used in the table heading are listed above within Section 3.2.2, as well as detailed descriptions of the result set. Other shortcuts used in the table: InB—Industry Baseline scenario, EVL— EV-Leaders scenario, R2Z—Road to zero scenario.
Result SetScenarioTraffic FeasibilityCHS Cap (MVA)Energy (GWh/ann)Techl. Area (m2)Park. Area (m2)MissPark (m2)MissDistr (MVA)Stat. Batt. (MWh)ChPts 170 kWChPts 350 kWChPts 700 kWChPts
Total
AFIR_EK2025100.00015.40.0280431500.03.47711088
2030100.00095.90.072424,18948655.020.2468570525
2035100.000119.00.074529,74310,8327.529.5578680646
AFIR_EP2025100.00022.00.0287330500.08.44402266
2027100.00068.00.0720945519280.025.3136068204
2030100.000137.00.080021,06839478.050.53430114457
2032100.000170.00.085026,622908812.067.34420136578
Phase 1InB97.91410.316.7280464100.00.02234056
EVL97.47715.632.1280757200.00.04054094
R2Z97.51822.358.828010,84700.01.657800137
Phase 2InB99.68354.8152.870028,14844791.63.81292240353
EVL99.67478.5247.470038,41678494.84.11793050484
R2Z99.672101.5341.773349,71611,2328.217.52363930629
Phase 3InB99.998149.9490.9116873,06218,00415.311.83275960923
EVL99.997240.3844.91324110,47039,63437.038.449091301403
R2Z99.997294.81053.71501132,62056,92952.176.2579111301692
Phase 3InB_700 kW99.997159.5490.9117072,88517,68516.912.4199414300913
EVL_700 kW99.997251.7845.01336106,24538,11539.640.13046064281338
R2Z_700 kW99.997305.01053.71515123,10350,12156.478.53487065021556
Verif
100%
-99.9981736.66445.76992655,525913,3401185.9440.33961525709218
700 kW99.9981758.86446.07073549,733710,3761211.4443.21730350919677206
Disclaimer/Publisher’s Note: The statements, opinions and data contained in all publications are solely those of the individual author(s) and contributor(s) and not of MDPI and/or the editor(s). MDPI and/or the editor(s) disclaim responsibility for any injury to people or property resulting from any ideas, methods, instructions or products referred to in the content.

