1. Introduction
Due to new materials and technological developments, road maintenance and pavement design methods are continuously a research focus. These thematics are fundamental to promoting the road pavement’s durability during its life span and users’ safety. On the other hand, freight transportation is indispensable in any part of the world, especially in countries where the primary mode of transportation is based on roads.
Considering the great importance of the goods transported by trucks, several companies developed automated vehicles, which sometimes do not need a driver. In this sense, evaluating the impact of this revolution in transport logistics and, mainly, its consequences concerning this new technology is crucial.
Nowadays, automated vehicles (AVs) are the world’s focus, and commercial truck and individual vehicle companies have invested vast resources in their implantation [
1].
The last World Forum for Harmonization of Vehicle Regulations (WP.29) of the United Nations published a framework for road safety and environmental protection related to automated vehicles. The framework set out a series of topics to be considered to ensure safety. One of them was related to automated (autonomous) vehicles that do not have any risk or cause many traffic accidents resulting in injury or death that are reasonably foreseeable and preventable [
2].
Moreover, some specific conditions under automated mode must be described in the operational design of automated vehicles. At a minimum, it includes information such as roadway types, geographic area; speed range; environmental conditions (weather and day/nighttime) [
2].
As for pavement conditions, some aspects have to be investigated about automated vehicles during travel, including, for example, the vehicle system capacity in identifying pavement distress (cracking, potholes, permanent deformation) or vehicle positions in the road lane, which can contribute to minimizing possible accidents.
Zhou et al. [
1] stated that there is still a lack in the literature concerning AVs’ impact on roadway hydroplaning and pavement life risk. As AVs are equipped with location systems, they are expected to position themselves within a traffic lane, keeping their position in the lane more precisely than human-driven vehicles [
1]. On the other hand, AVs have lower lateral wandering, which can induce more damage to pavements, such as cracking and permanent deformation [
3]. This condition leads to pavement damage and deeper rutting, causing hydroplaning potential, which must be quantified.
Human drivers usually change the lateral positioning of vehicles on a lane during travelling. Wheel lateral movement along the lane width is called wheel wander. This wheel wanders of vehicular movement could be modelled with the probabilistic distribution [
4].
Blab and Litzka [
5] asserted that not all vehicles travelling along a road use the same wheel path. In Austria, the authors investigated the extent of the lateral shift of the load applied to the pavement at the cross-section, considering the lane width, permanent deformation, and vehicle speed. Through the Lateral Displacement Measurement System, the lateral position of a tire’s footprint on the vehicle’s wheel was measured on 27 Austrian road sections. Statistical analysis confirmed a theoretical distribution using the Laplace distribution (double exponential distribution). The findings showed that the lateral wheel path distribution significantly influences speed level and permanent deformation. The results also showed a strong influence on the pavement design that requires increased pavement thickness to support the accumulation of permanent deformation.
Gungor et al. [
6] highlighted that autonomous and connected trucks (truck platoons) during travel can increase pavement damage because of channelized load application. The factors contributing to damage are constant lateral truck position and reduced resting time between two consecutive loadings.
Yeganeh et al. [
7] stated that AVs and their different potential lateral movement patterns, combined with the lane width effect, lead to different load distributions, impacting pavement performance. The authors evaluated the permanent deformation induced by different load distribution scenarios by setting out different penetration rates (i.e., 0, 20, 40, 60, 80, and 100% of autonomous vehicles), wander modes (zero, normal, uniform-time, and uniform frequency wander), and lane widths (i.e., 3, 3.25, and 3.5 m). The results showed different levels of permanent deformation induced by different wander modes and lane widths. As expected, the results are influenced by the AVs’ penetration rate. The penetration rate of AVs’ is a decisive factor in the practical decision-making process in the wander mode definition and lane width design for AVs.
Considering the vast investment in pavement construction and maintenance, Georgouli et al. [
8] also researched the impact of the AVs lateral wheel wander on both new flexible pavement design and the damage accumulation within the existing flexible pavements. They found that the AVs zero lateral wheel wander has a negative structural impact on flexible pavements compared to non-autonomous vehicles that follow a normal lateral wheel wander distribution.
Gungor and Al-Qadi [
9] studied the AV’s lateral position and proposed a framework (Wander 2D) that can compute accumulated pavement damage as a function of the lateral loading position. Due to the truncated normal distributions, lane and vehicle width effects on pavement damage accumulation were also considered. From a numerical example, the authors demonstrated the application of Wander 2D on the Mechanistic-empirical Pavement Design Guide (MEPDG) damage accumulation approach. The Wander 2D can be applied to any analytical pavement design approach if the damage can be computed at discrete points along the pavement cross-section.
Rana [
4] evaluated the permanent deformation due to the movement of autonomous trucks. The results showed that the lane-centring tendency of AT was a significant contributor to the increment of permanent deformation due to the increase of load repetition on a single point in the cross-section of the road.
Because AVs tend to circulate continuously at the equal transversal road position, one of the main concerns for pavement design and performance is the frequency with which the same point is loaded, causing increased structural degradation. This work fills a gap in providing fatigue and permanent deformation performance evaluation reduction due to AVs circulation by a simple methodology and equations that can be applied in other studies.
Thus, it is necessary to evaluate and provide means to reduce the negative impact of AVs on pavement life and improve roadway safety in the presence of AVs by an optimal lateral wandering pattern for AVs.
2. Objective
This paper studies the effect of traffic wander on pavement performance, considering its fatigue and permanent deformation resistance. The results can be used to define limits for traffic wander that can be applied on CAV to minimize pavement distresses.
The study is carried out by applying a normal distribution corresponding to different wanders to the damage installed in the pavement and verifying the reduction in fatigue and permanent deformation resistance. For this study, a 10 cm asphalt layer pavement was considered. The lateral wander effect is studied for the maximum damage installed in the pavement used to calculate the pavement damage.
3. Methodology
This study was developed for a pavement composed of two layers: the asphalt layer with 10 cm with a dynamic modulus of 5000 MPa, whereas the granular layer was modelled by 20 cm with a modulus of 200 MPa. The subgrade was modelled with a dynamic modulus of 100 MPa. For this pavement, the tensile strain at the bottom of the asphalt layer and the compressive strain at the top of the subgrade were evaluated using the linear elastic theory. Two 20 kN loads were applied with a radius of 0.125 m and 0.375 m between centres. This pavement structure and traffic configuration were chosen to sample the proposed methodology, which can be applied to other conditions.
The lateral wander was considered by following a normal distribution expressed by Equation (1), where f
(x) is the probability density function, σ is the standard deviation, and μ is the load position means, which is the centerline of the wheel loads.
Five maximum lateral wanders were modelled using the normal distribution, namely, 0.2, 0.3, 0.4, 0.5, and 0.6 m, as in
Figure 1. The standard deviation was defined as one-third of the wander for each normal distribution, meaning that only 0.2% of the traffic is outside the maximum wander distance. Observing these density functions concludes that as the wander increases, the traffic is spread by a more considerable transverse distance, reducing the effect on the central position of the wheel loads. Compared to the wander of 0.6 m, the central position for 0.2 m wander has three times more frequency, significantly increasing the pavement damage.
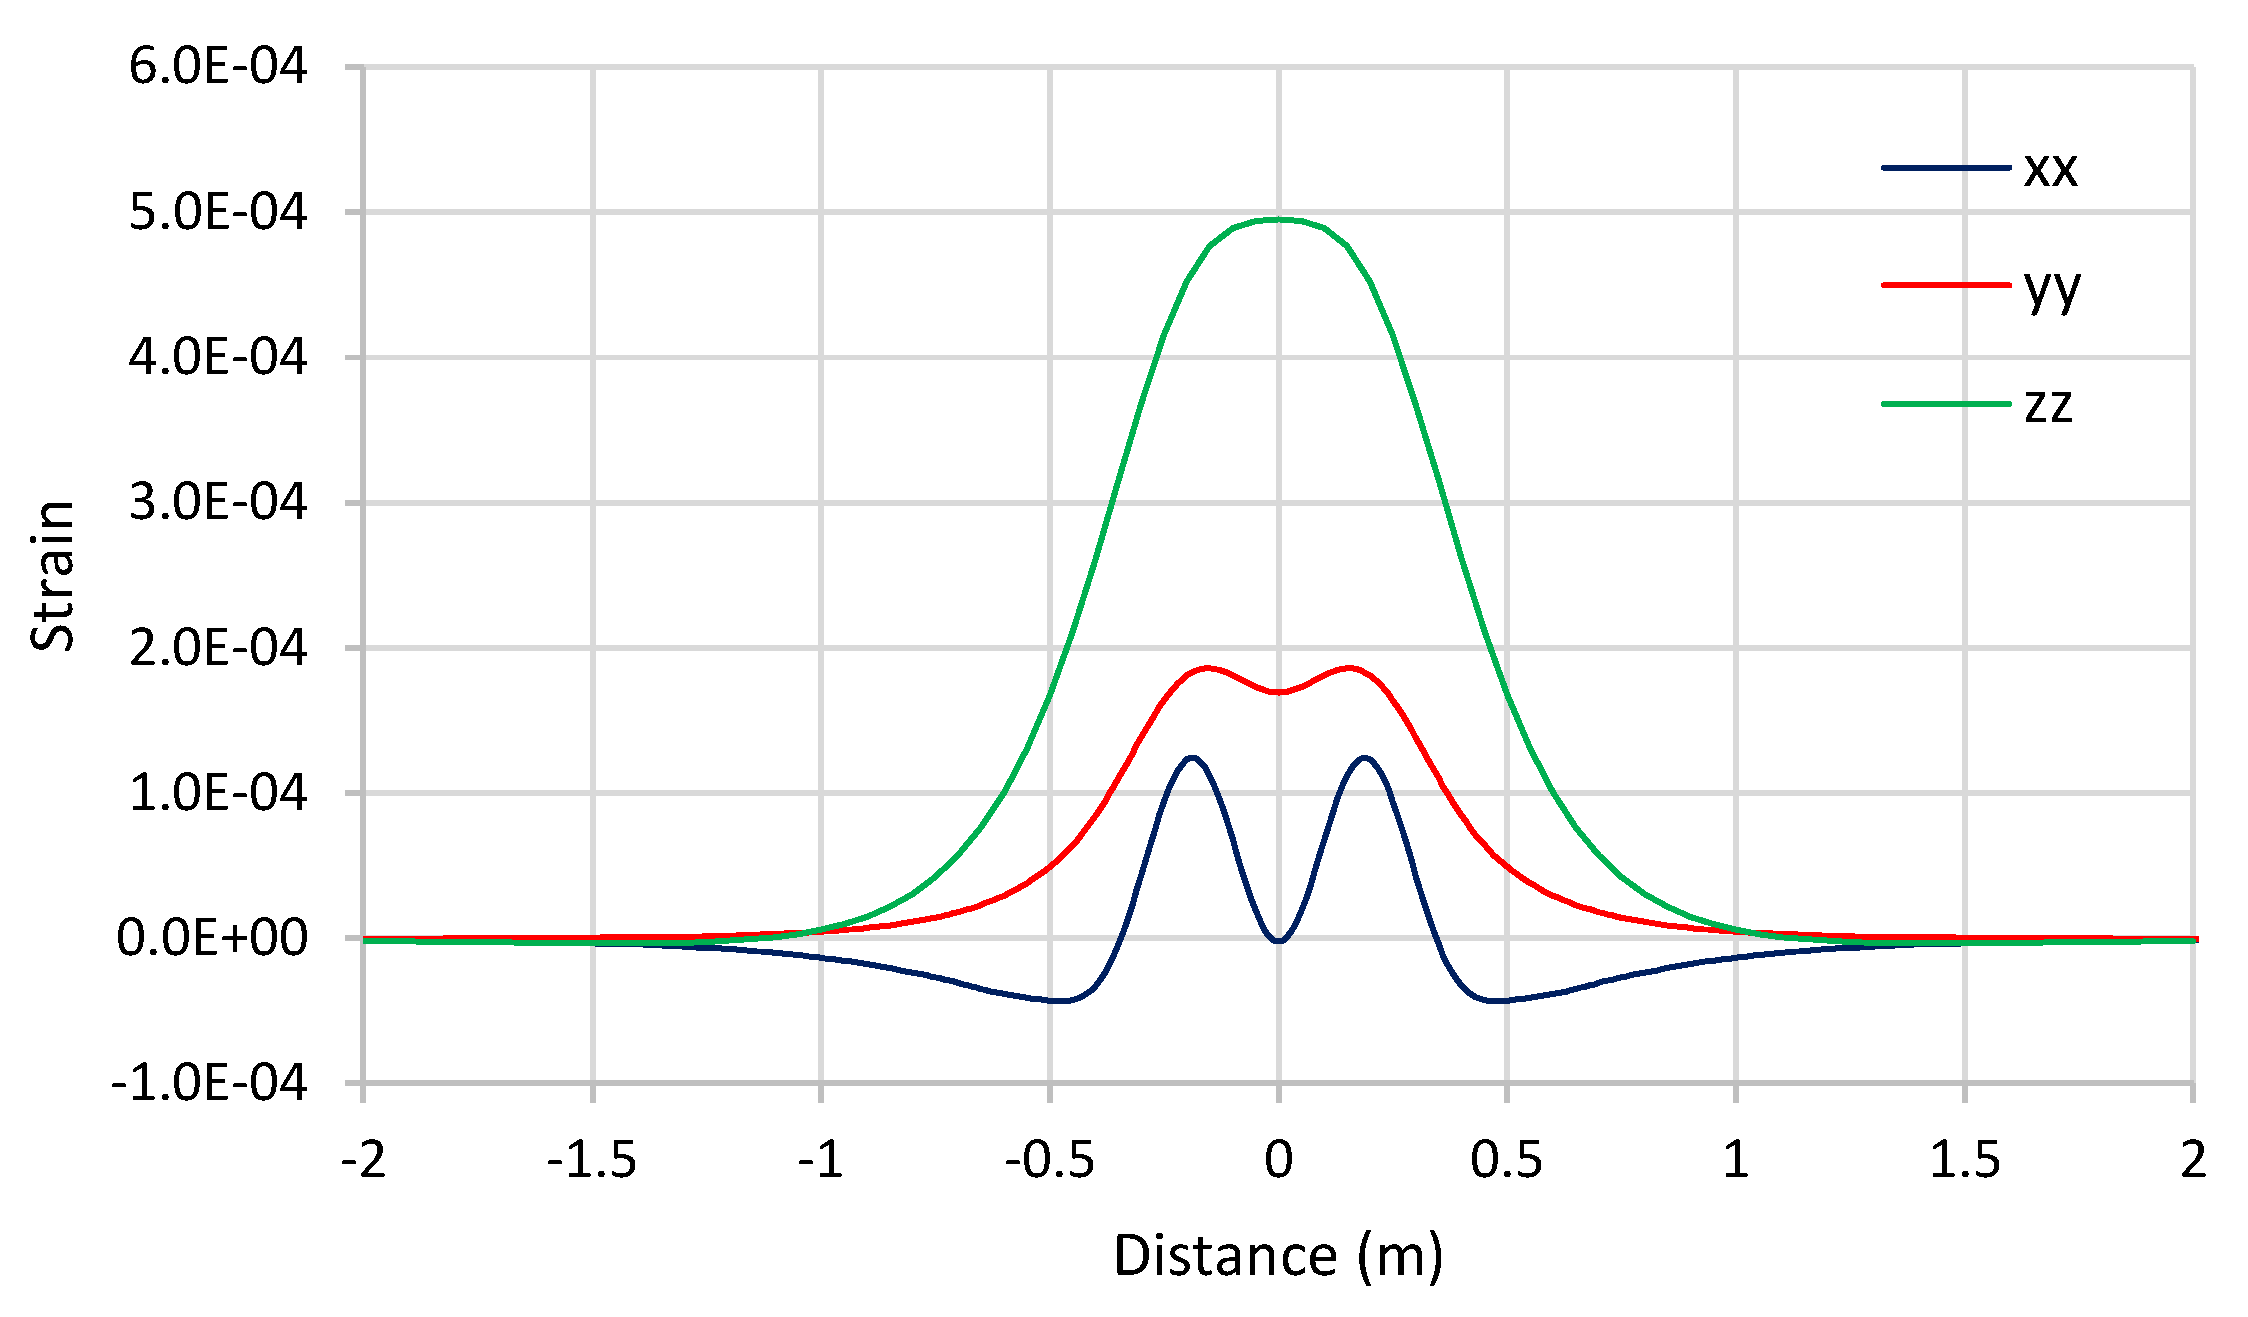
For the pavement studied in this work, the strain evolution with the transverse position was calculated using JPav software (a computer program for analysis and the design of road pavements using the layered elastic theory (LET)). Despite the lesser effect on pavement performance, the horizontal tensile strain at the bottom of the asphalt layer in the transverse direction (εxx) was also considered. Thus, two horizontal tensile strains at the bottom of the asphalt layer are considered, in the transverse direction (εxx) and the longitudinal direction (εyy), together with the vertical strain at the top of the subgrade (εzz).
Based on Gungor and Al-Qadi [
9], two studies in the literature propose analytical approaches to consider wheel wander in pavement design. The first approach, developed by the Mechanistic-Empirical Pavement Design Guide (MEPDG), is illustrated in
Figure 2 from MEPGD [
10], where the damage profile without wander (row B) is laterally shifted five times, each one representing 20% of the traffic. The sum of these shifted profiles will give the total damage accumulation considering the wandering effect. The second one uses the Monte Carlo simulation to generate a set of pavement responses for the empirical transfer functions to predict pavement damage.
This work used the first approach to predict the pavement response based on the wander but considered 0.05 m shifts instead of five based on the traffic. Damage was calculated by applying Shell fatigue (Equation (2)) and permanent deformation law (Equation (3)) on all strains’ transverse profiles.
where ε
fat = tensile strain at the bottom of asphalt layer; V
b = binder content (%); S
mix = dynamic modulus of the asphalt concrete (Pa); N
fat = fatigue life; εz = vertical strain at the top of subgrade; a = 1.8 × 10
−2 for 95% confidence; N
pd = permanent deformation resistance.
4. Pavement Behavior
Pavement response due to two-wheel loads, simulating dual tires, was calculated for the horizontal tensile strain at the bottom of the asphalt layer in the transverse direction (ε
xx) and longitudinal direction (ε
yy), and for the vertical strain at the top of the subgrade (ε
zz). The profiles of these strains are represented in
Figure 3.
Tensile strain at the bottom of the asphalt layer follows different configurations as the direction considered. The transverse strain is approximately 70% of the one obtained in the longitudinal direction. However, both are considered in the analysis because the peak-to-peak strain in the transverse direction is almost the same as in the longitudinal direction.
5. Wander Effect on Strain and Pavement Life
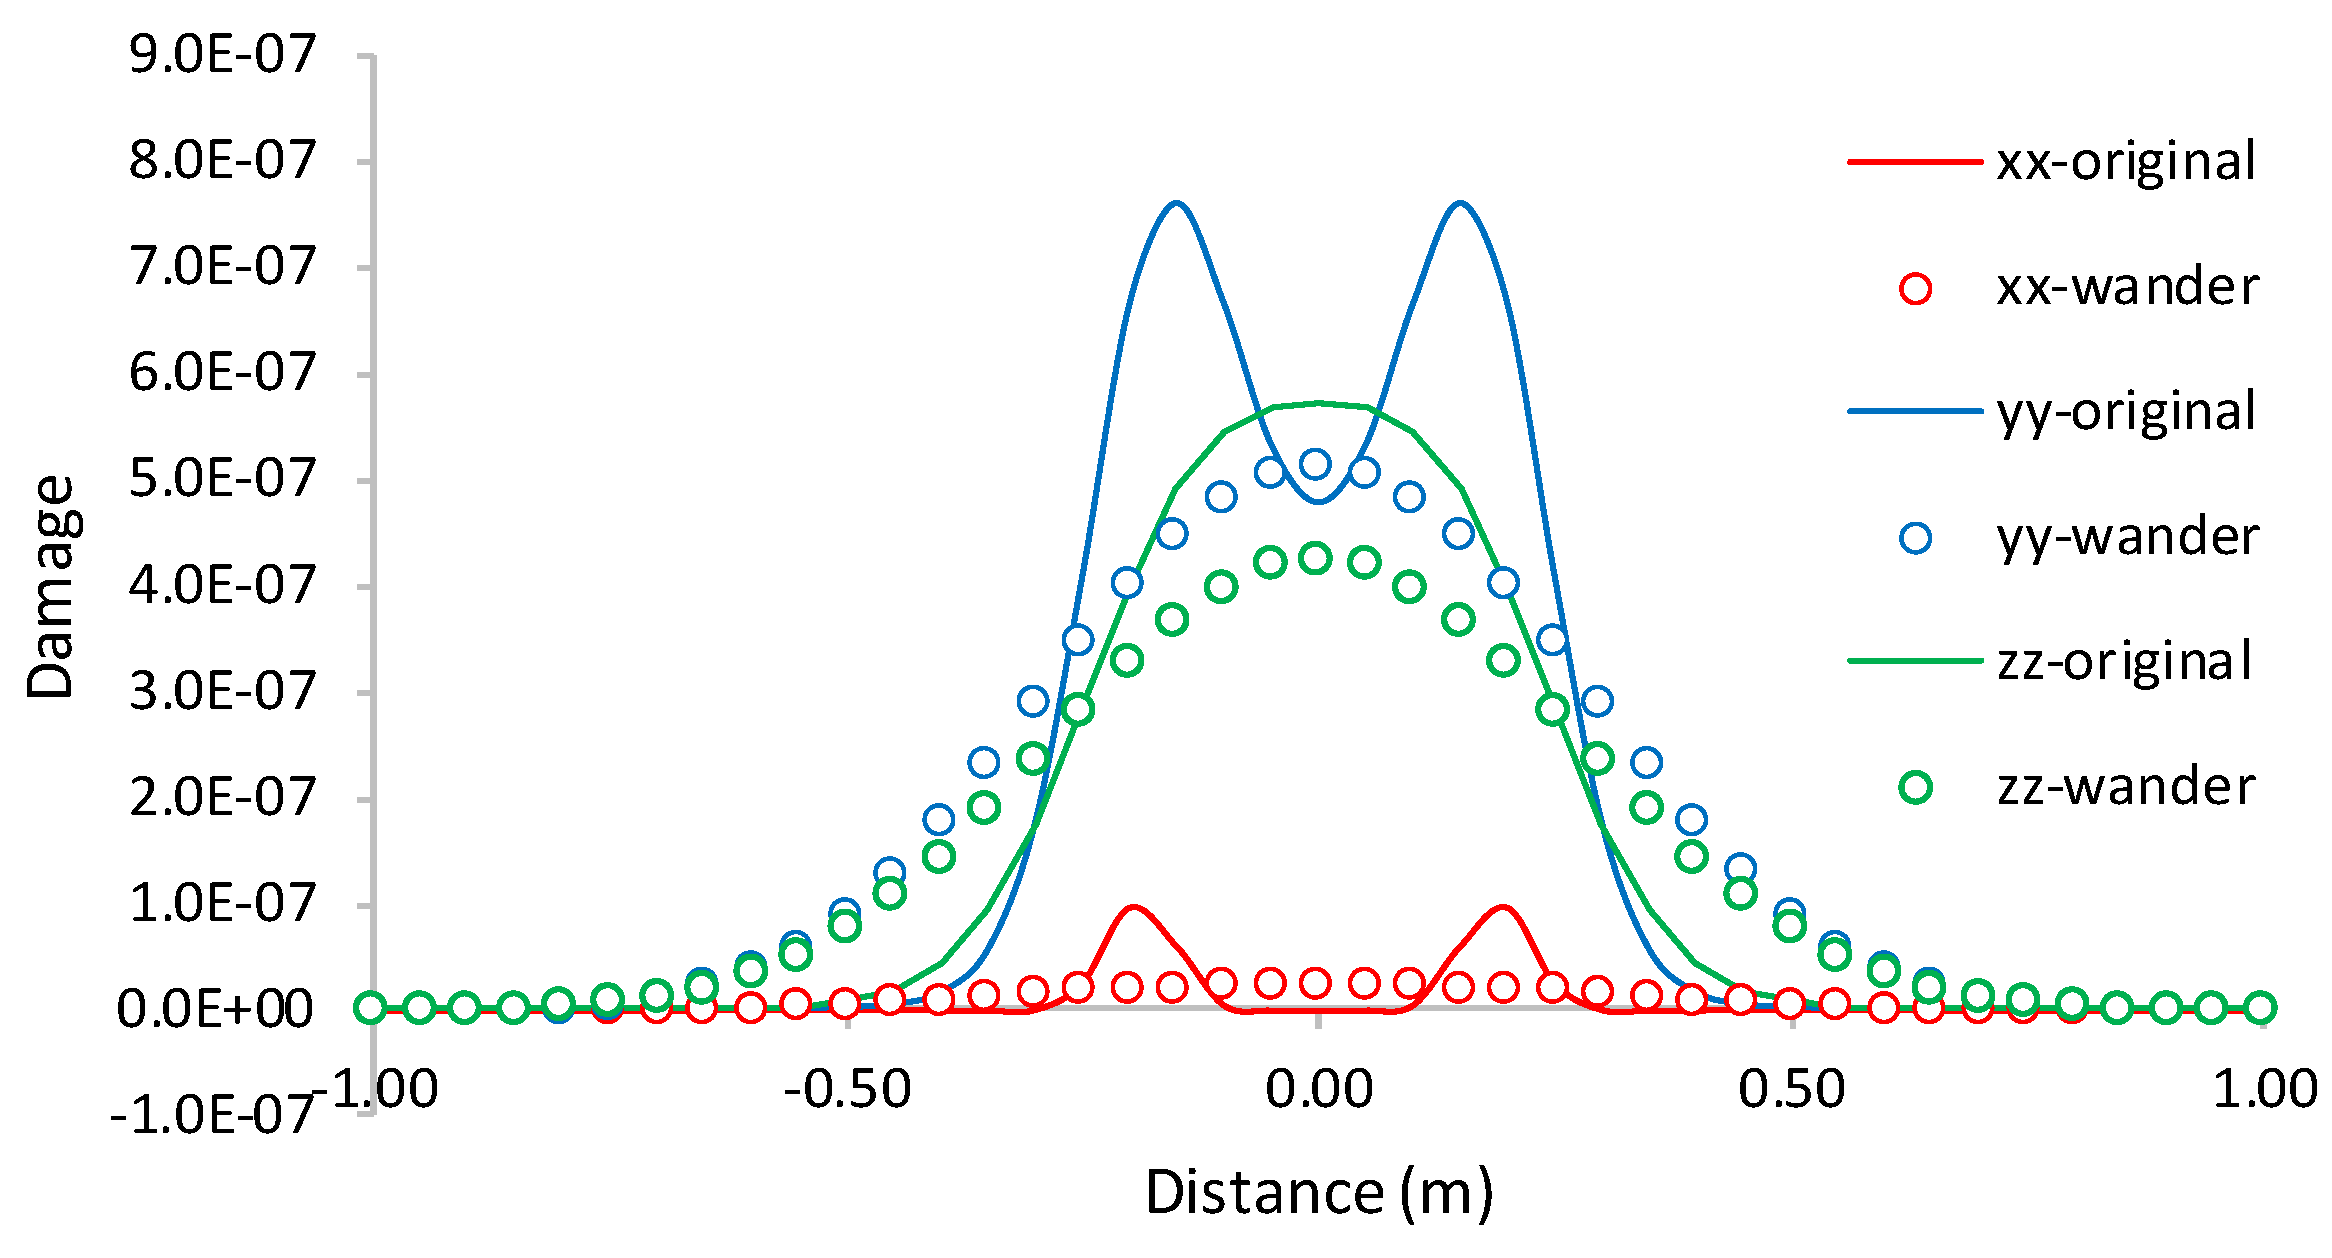
The wander application was carried out by shifting the damage profiles in 5 cm steps, each weighted by the probability associated with that shift. All analyses were made for 80 profile shifts, from −0.6 m up to 0.6 m, meaning that the wander profile is the sum of 25 profiles. For example, for a shift of 0.2 m, the original damage profile is multiplied by the probability of 0.2 m in the standard curve distribution. This process was carried out for all profile shifts; the final profile is the sum of all shifted profiles.
Examples of the damage profiles after applying the 0.6 m wander are presented in
Figure 4 for the three strains (damages) considered in this work. For this wander (0.6 m), a significant reduction of the damage due to the horizontal tensile strain at the bottom of the asphalt layer in the transverse direction (ε
xx) can be observed, mainly for the positive strain (tensile).
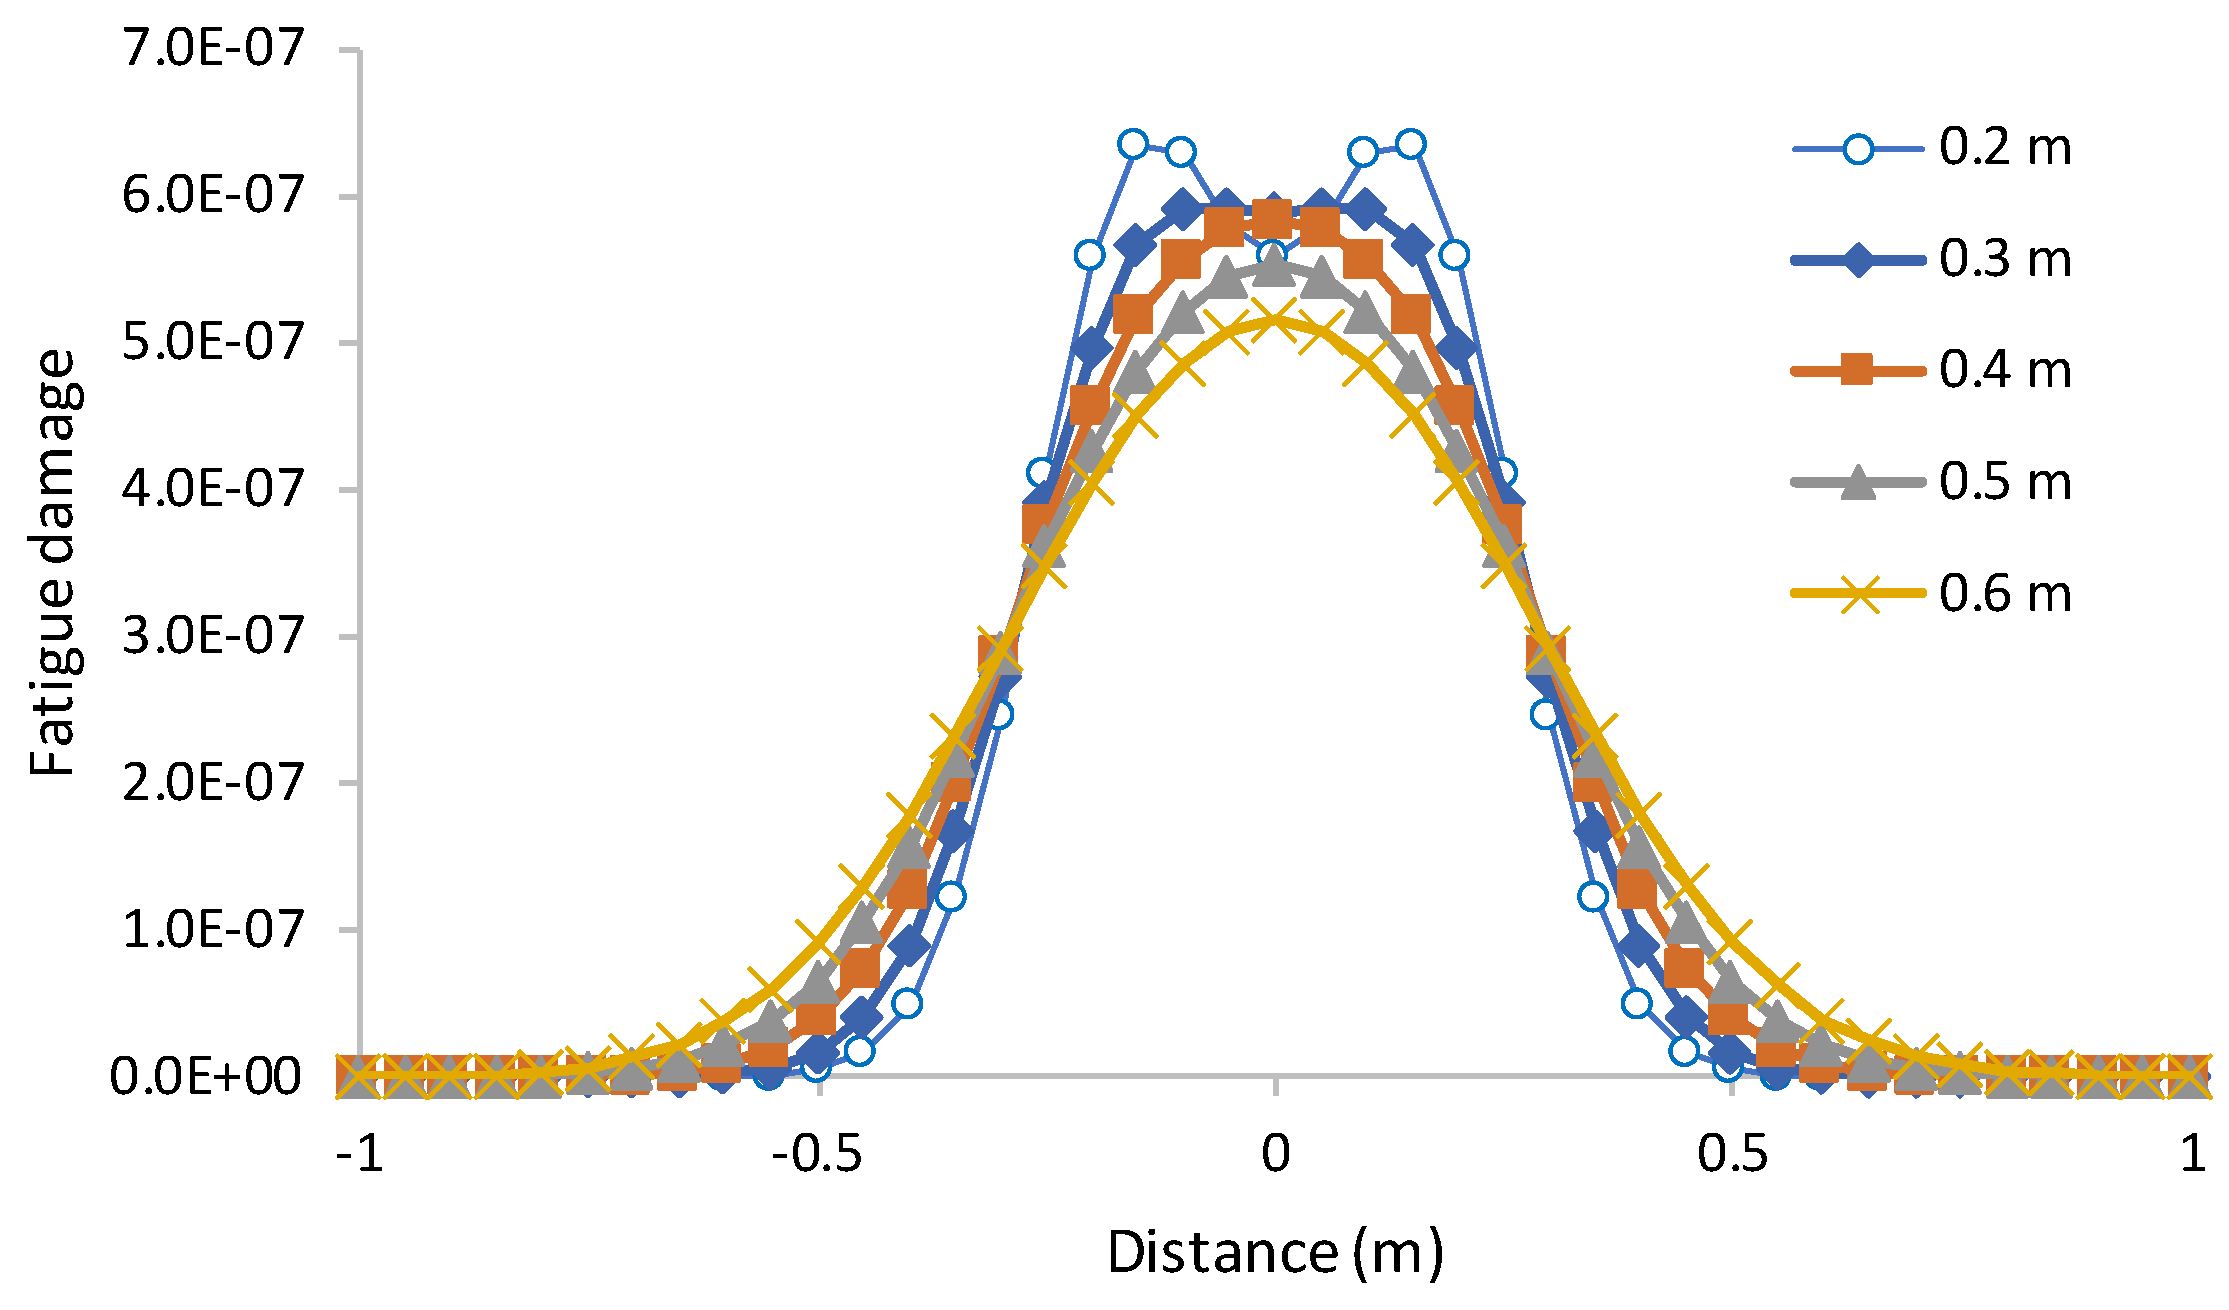
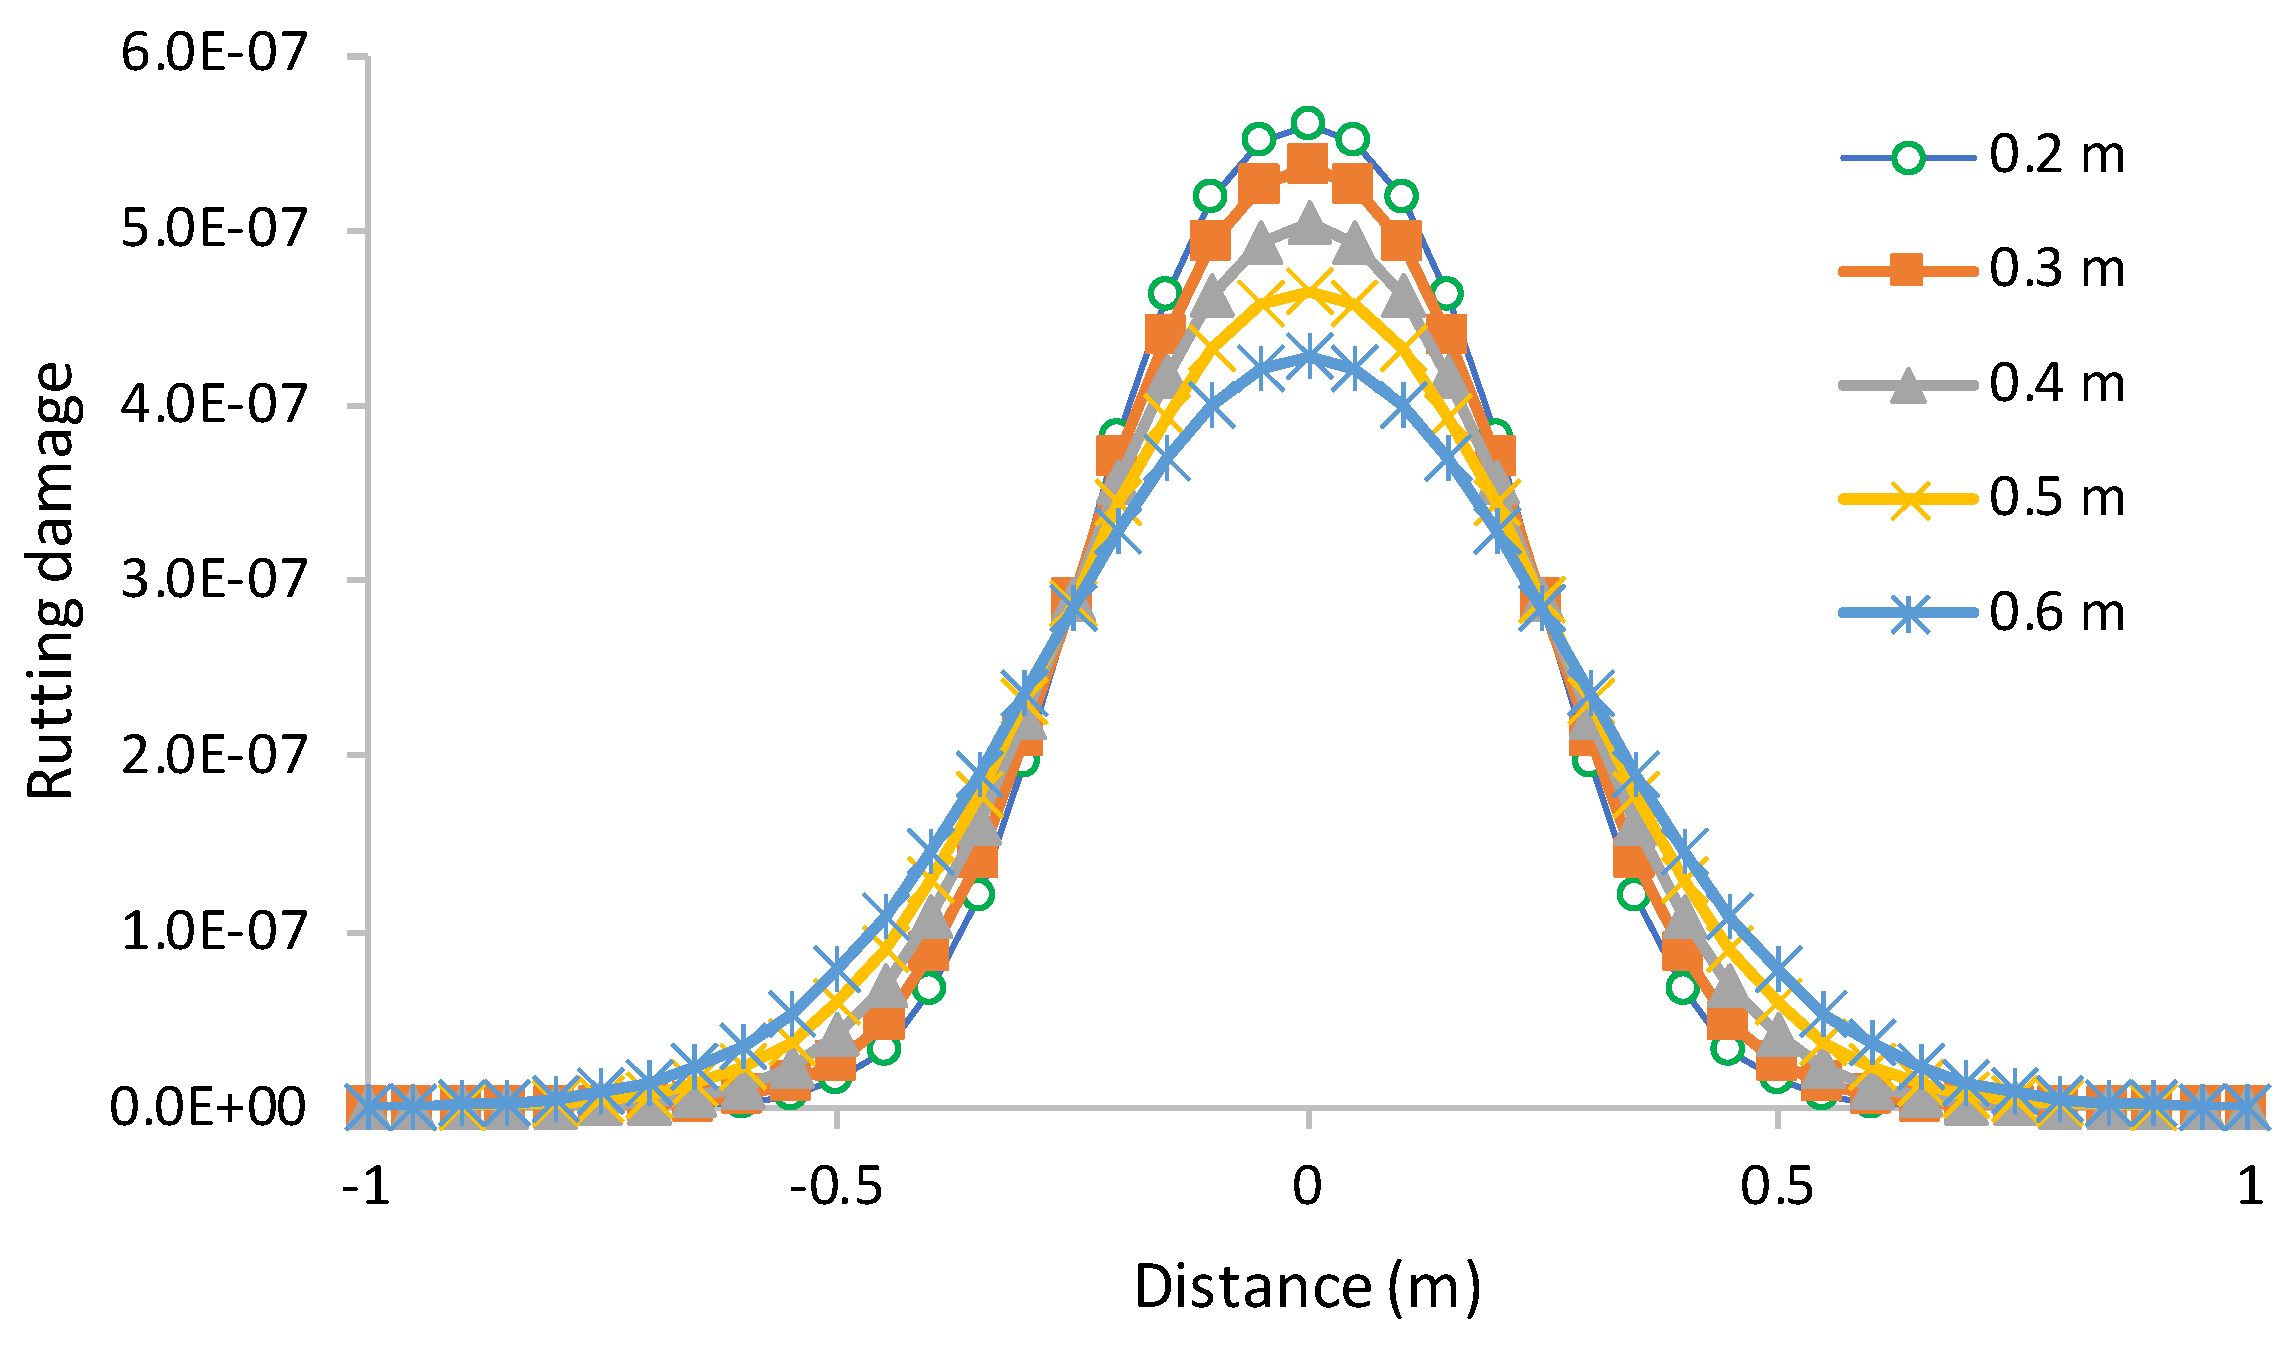
The enlargement of the profile in the wheels zone is visible. That enlargement is smaller for the other wanders, but it exists, as shown in
Figure 5 and
Figure 6 for the other wanders studied. These figures present the damages separated by distress modes, namely fatigue and permanent deformation. The main consequence of the wander application is reducing the maximum damage that significantly affects the pavement life. This reduction is similar both for fatigue as well as for permanent deformation (rutting).
After obtaining the damage profiles with the wandering application, it was possible to verify the wander effect for the distances considered, i.e., 0.2, 0.3, 0.4, 0.5 and 0.6 m. This effect was assessed for the damage and pavement life considering the fatigue cracking (Equation (2)) and permanent deformation/rutting (Equation (3)) laws. Both effects were calculated as the ratio between the case after the wander application and the case without wander. For this analysis, the transverse tensile strain/damage was not considered as it is lesser than the longitudinal one.
For the fatigue damage,
Figure 7 presents that effect for the maximum damage peaks where it is possible to verify that the damage is 83% of the initial for 0.2 m wander, and it reduces to 68% for 0.6 m wander.
For the rutting damage, it is possible to verify that the strain is 98% of the initial for 0.2 m wander and reduces to 75% for 0.6 m wander. These damage reductions are tiny in this case, mainly for low wanders.
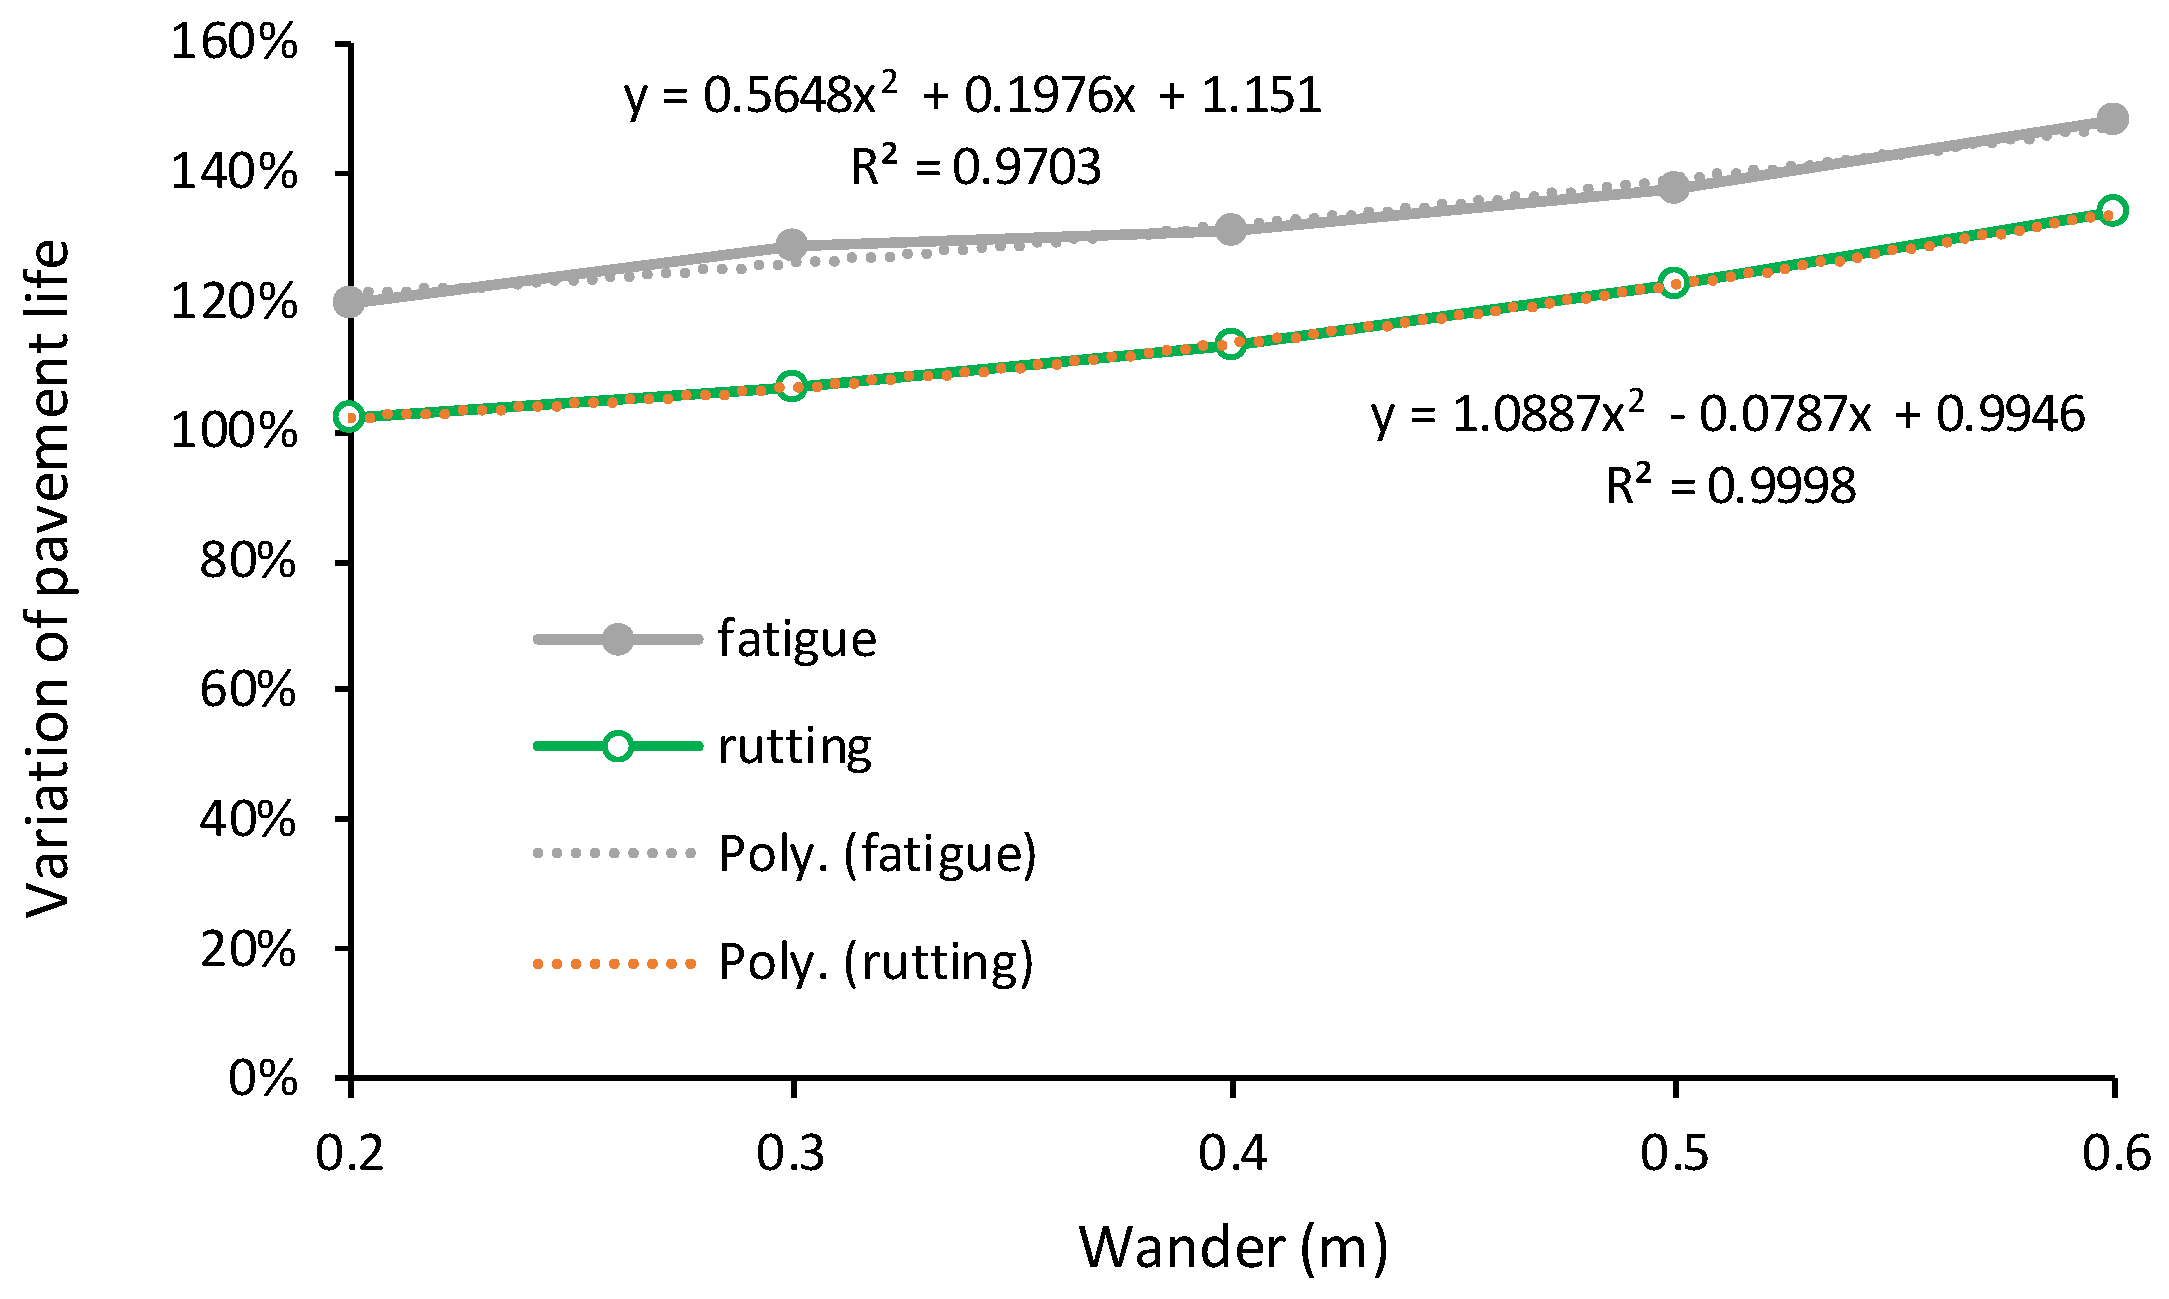
The effect of the wander on pavement life, for both fatigue and permanent deformation resistance, is presented in
Figure 8. These results are presented as life compared to the case without wander. It is possible to observe that both relative pavement lives increase as the wander increase, following a second-degree order polynomial law with an excellent correlation coefficient of 0.970 and 1.000.
The wander effect is greater for fatigue life, where an increase of 20% can be reached for 0.2 m wander, while for 0.6 m wander, the fatigue life is increased by 48%. For the permanent deformation, the wander effect rises by 2% in the pavement life for 0.2 m wander and 34% for 0.6 m wander.
The wander effect on pavement damage can be expressed by Equations (4) and (5), which can be used to predict the wander effect and to define policies for wander application on CAV.
where ε FW = pavement Fatigue life after Wander; PDW = pavement Permanent Deformation life after Wander; W = wander distance (m).
These results align with the conclusions of Noorvand et al. [
3], who concluded that a single pass of a heavy autonomous vehicle that followed a uniform distribution along the traffic lane was equivalent to 0.65 passes of a non-autonomous heavy vehicle. Also, Chen et al. [
11], using a finite element model, evaluated the effects of autonomous trucks’ lateral distribution in the lane to rutting depth and fatigue damage on a typical flexible pavement structure, concluding that the fatigue damage at the bottom of the asphalt layer increased by 146%.
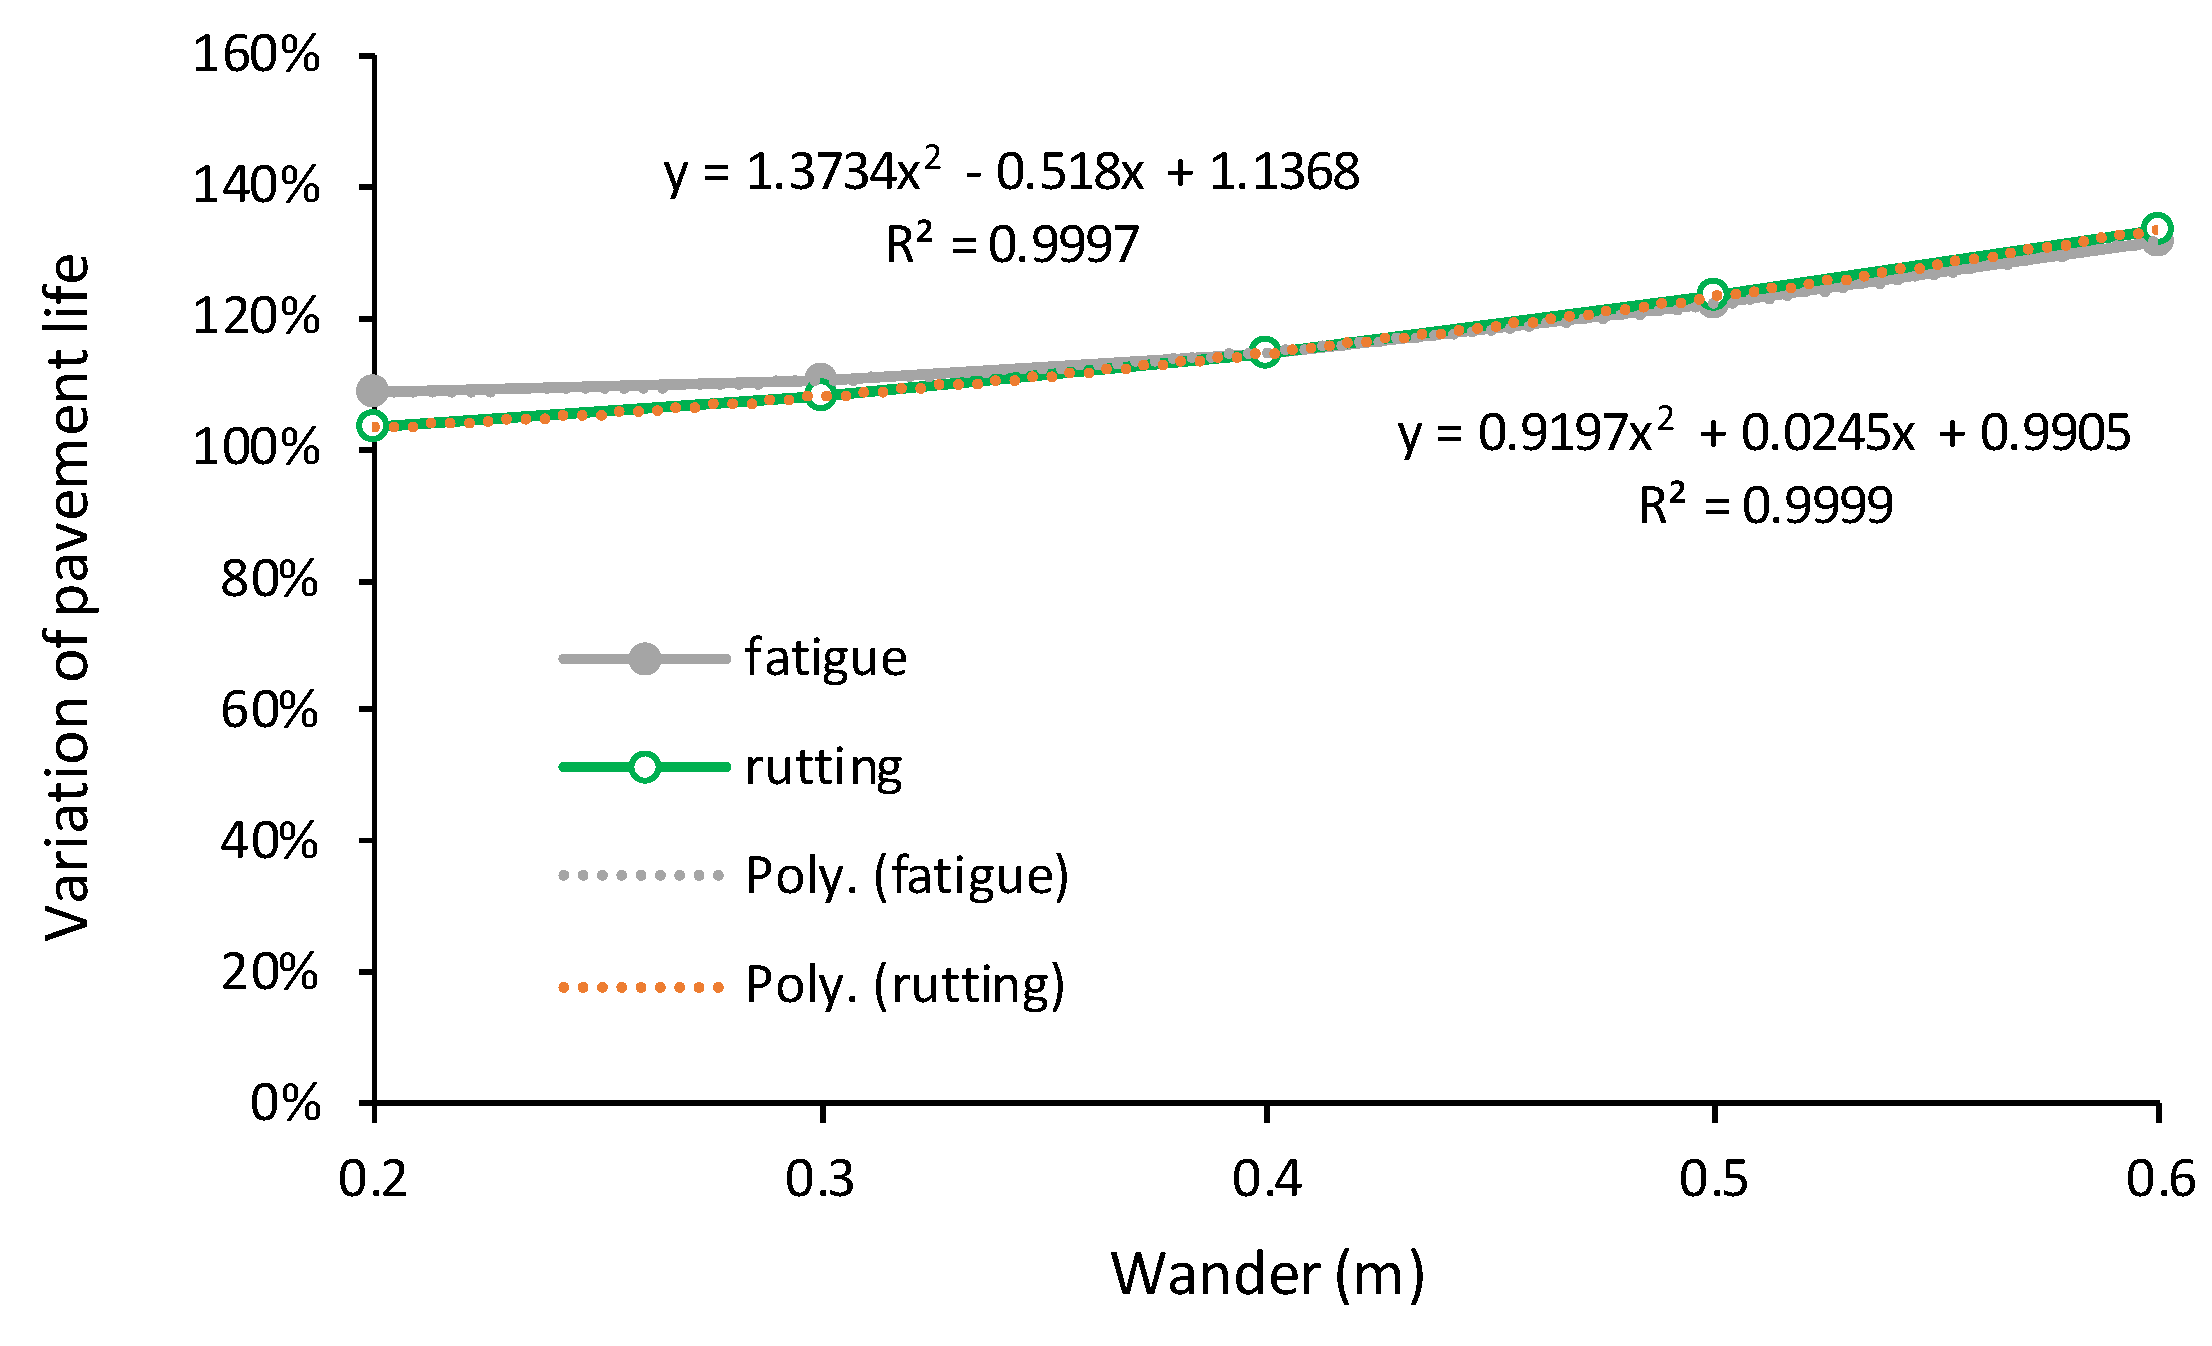
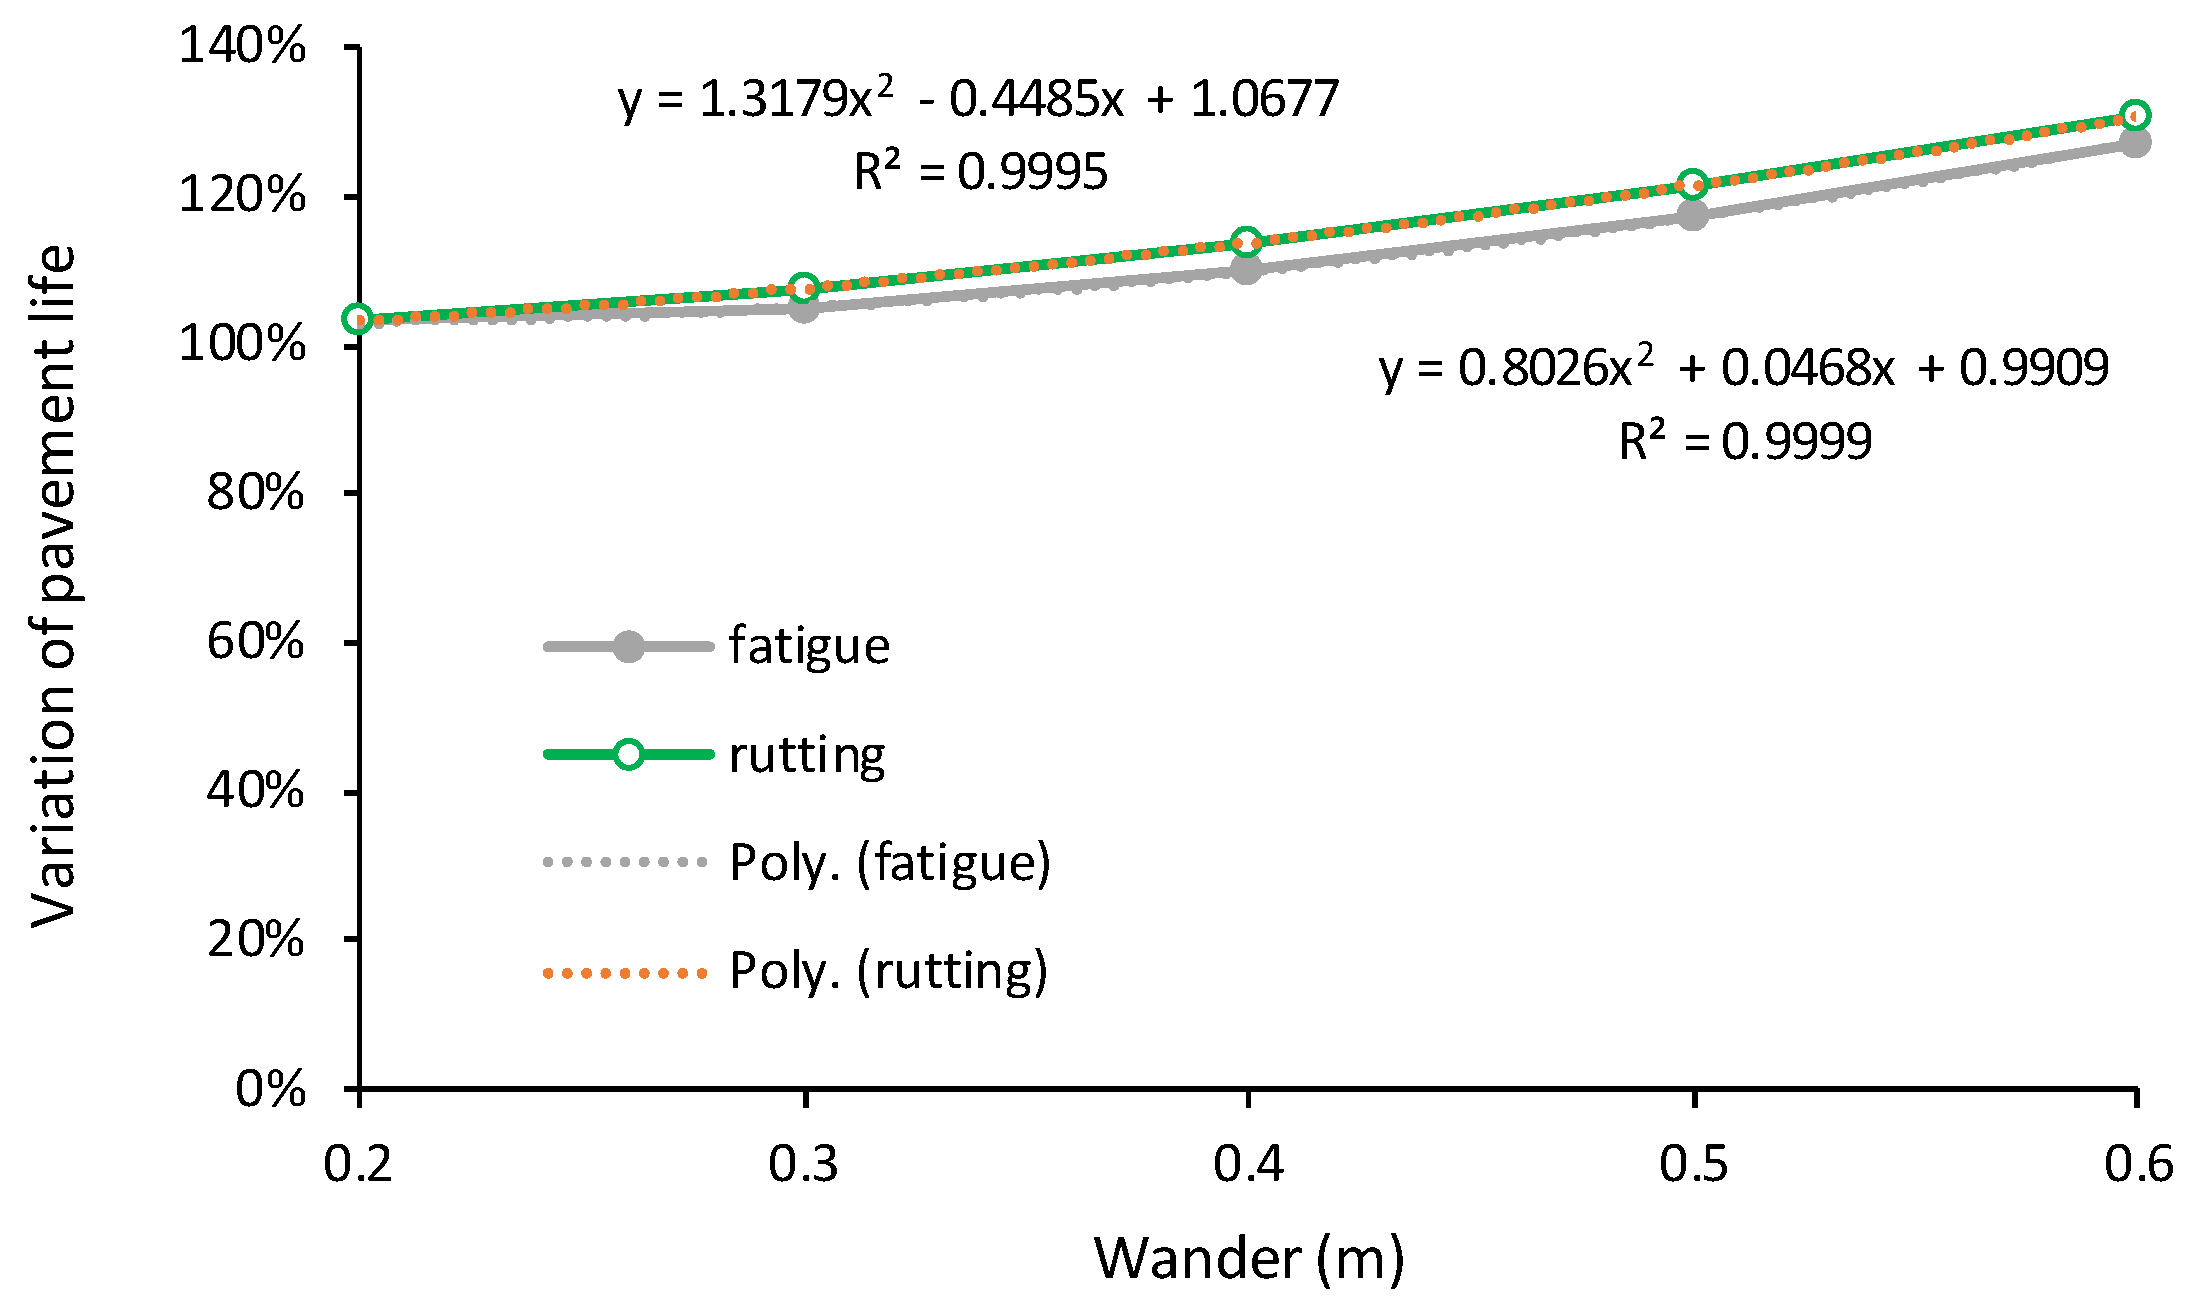
These conclusions only apply to this pavement configuration because as the thickness and stiffness of the pavement layers change, the different distresses (fatigue cracking and permanent deformation) assume different weights. For example, for a pavement with 15 cm of the asphalt layer, the variation of the pavement life for both distresses are similar and reach a value of 132 and 134%, respectively, for fatigue cracking and rutting, for a wander of 0.6 m. For a pavement with 20 cm of asphalt layer, the variation of the pavement life is respectively 127% and 131%, meaning as the pavement thickness increases. These conclusions can be obtained from
Figure 9 and
Figure 10.
6. Conclusions
This paper studied the effects of the wander of Connected and Autonomous Vehicles (CAV) on pavement performance by analyzing the evolution of the damage at the bottom of the asphalt layer and the due to the vertical strain at the top of the subgrade for a 10 cm asphalt layer pavement. These damages predicted the pavement life due to fatigue cracking and permanent deformation.
The analysis concluded that the damage in the pavement due to the wander follows a second-degree polynomial law with an excellent correlation coefficient. The pavement damage reduction is slight for wanders of 0.20 m but can reach 68% and 75% reduction by wanders up to 0.6 m, respectively, for rutting and fatigue cracking.
The pavement life increase with the wander also follows a second-degree order polynomial law with an excellent correlation coefficient. The increase of pavement life is slight for the permanent deformation, but it increases by 20% for fatigue resistance just for a small wander of 0.2 m. The effect of the wander on the pavement life is reduced as the pavement thickness increases.
Two equations were proposed for the evolution of the pavement life after wander compared to the pavement life without wander that can be used for CAV application.


