
Estimation of Year of Construction of Bridges in Cambodia by Analyzing the Landsat Normalized Difference Water Index

 ,
,  ,
,  and
and 
Abstract
1. Introduction
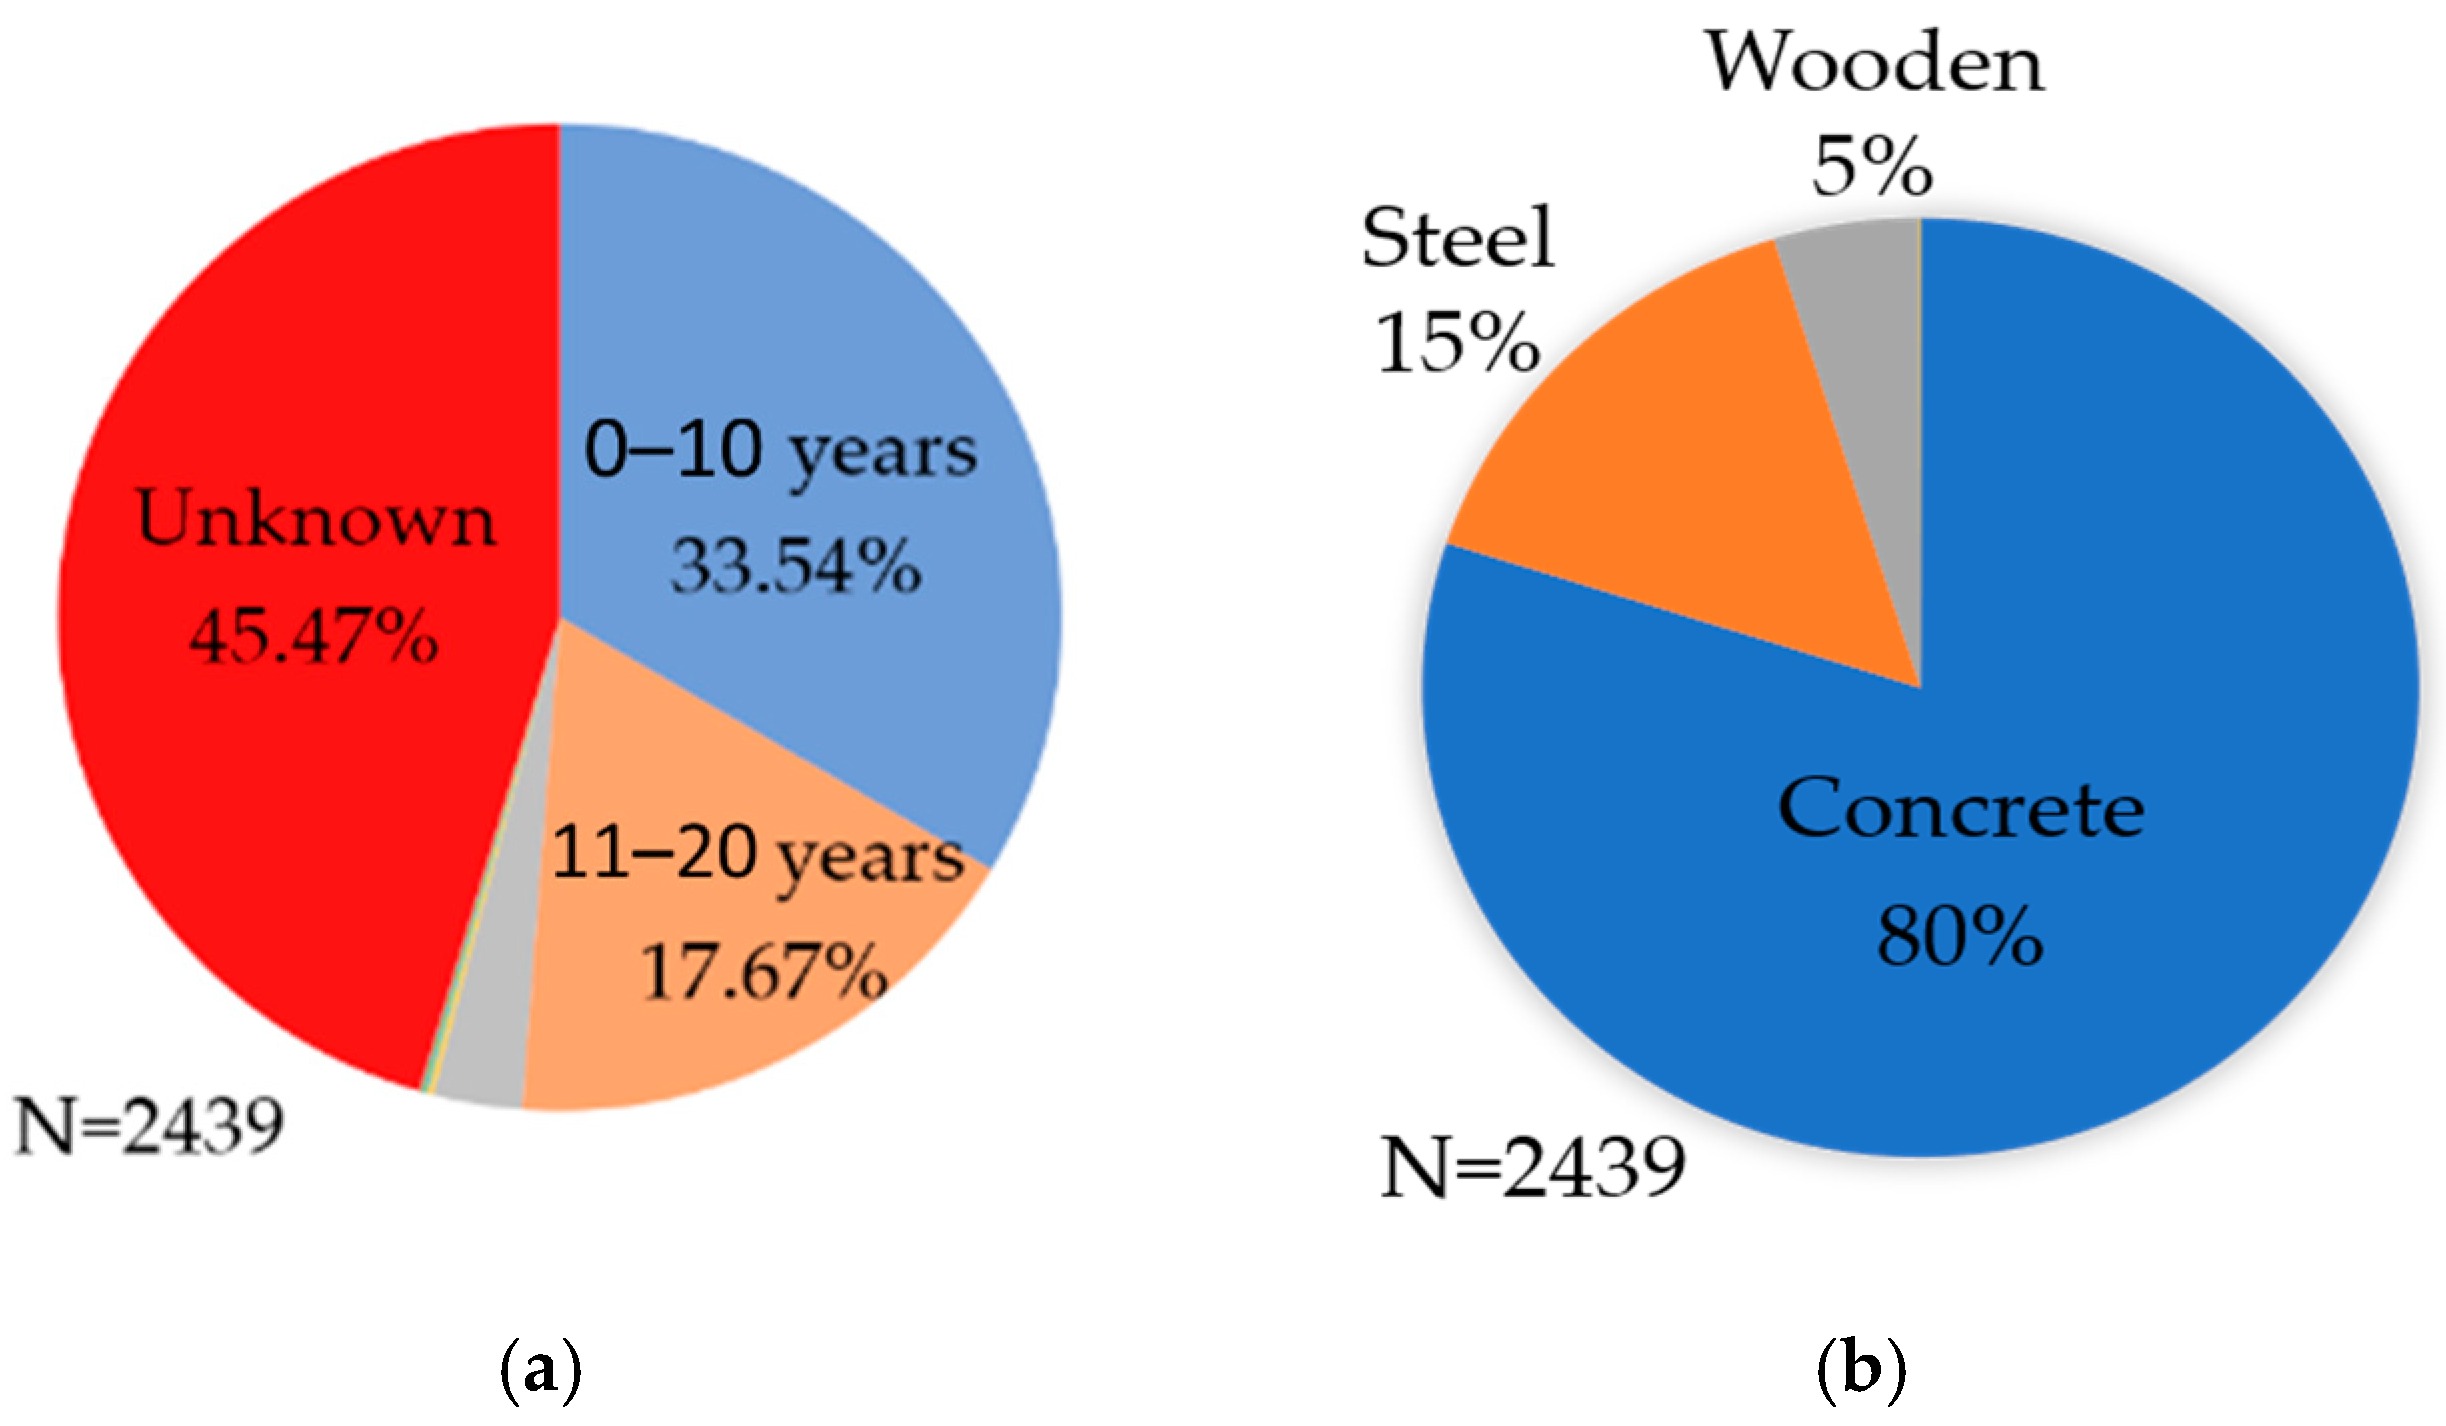
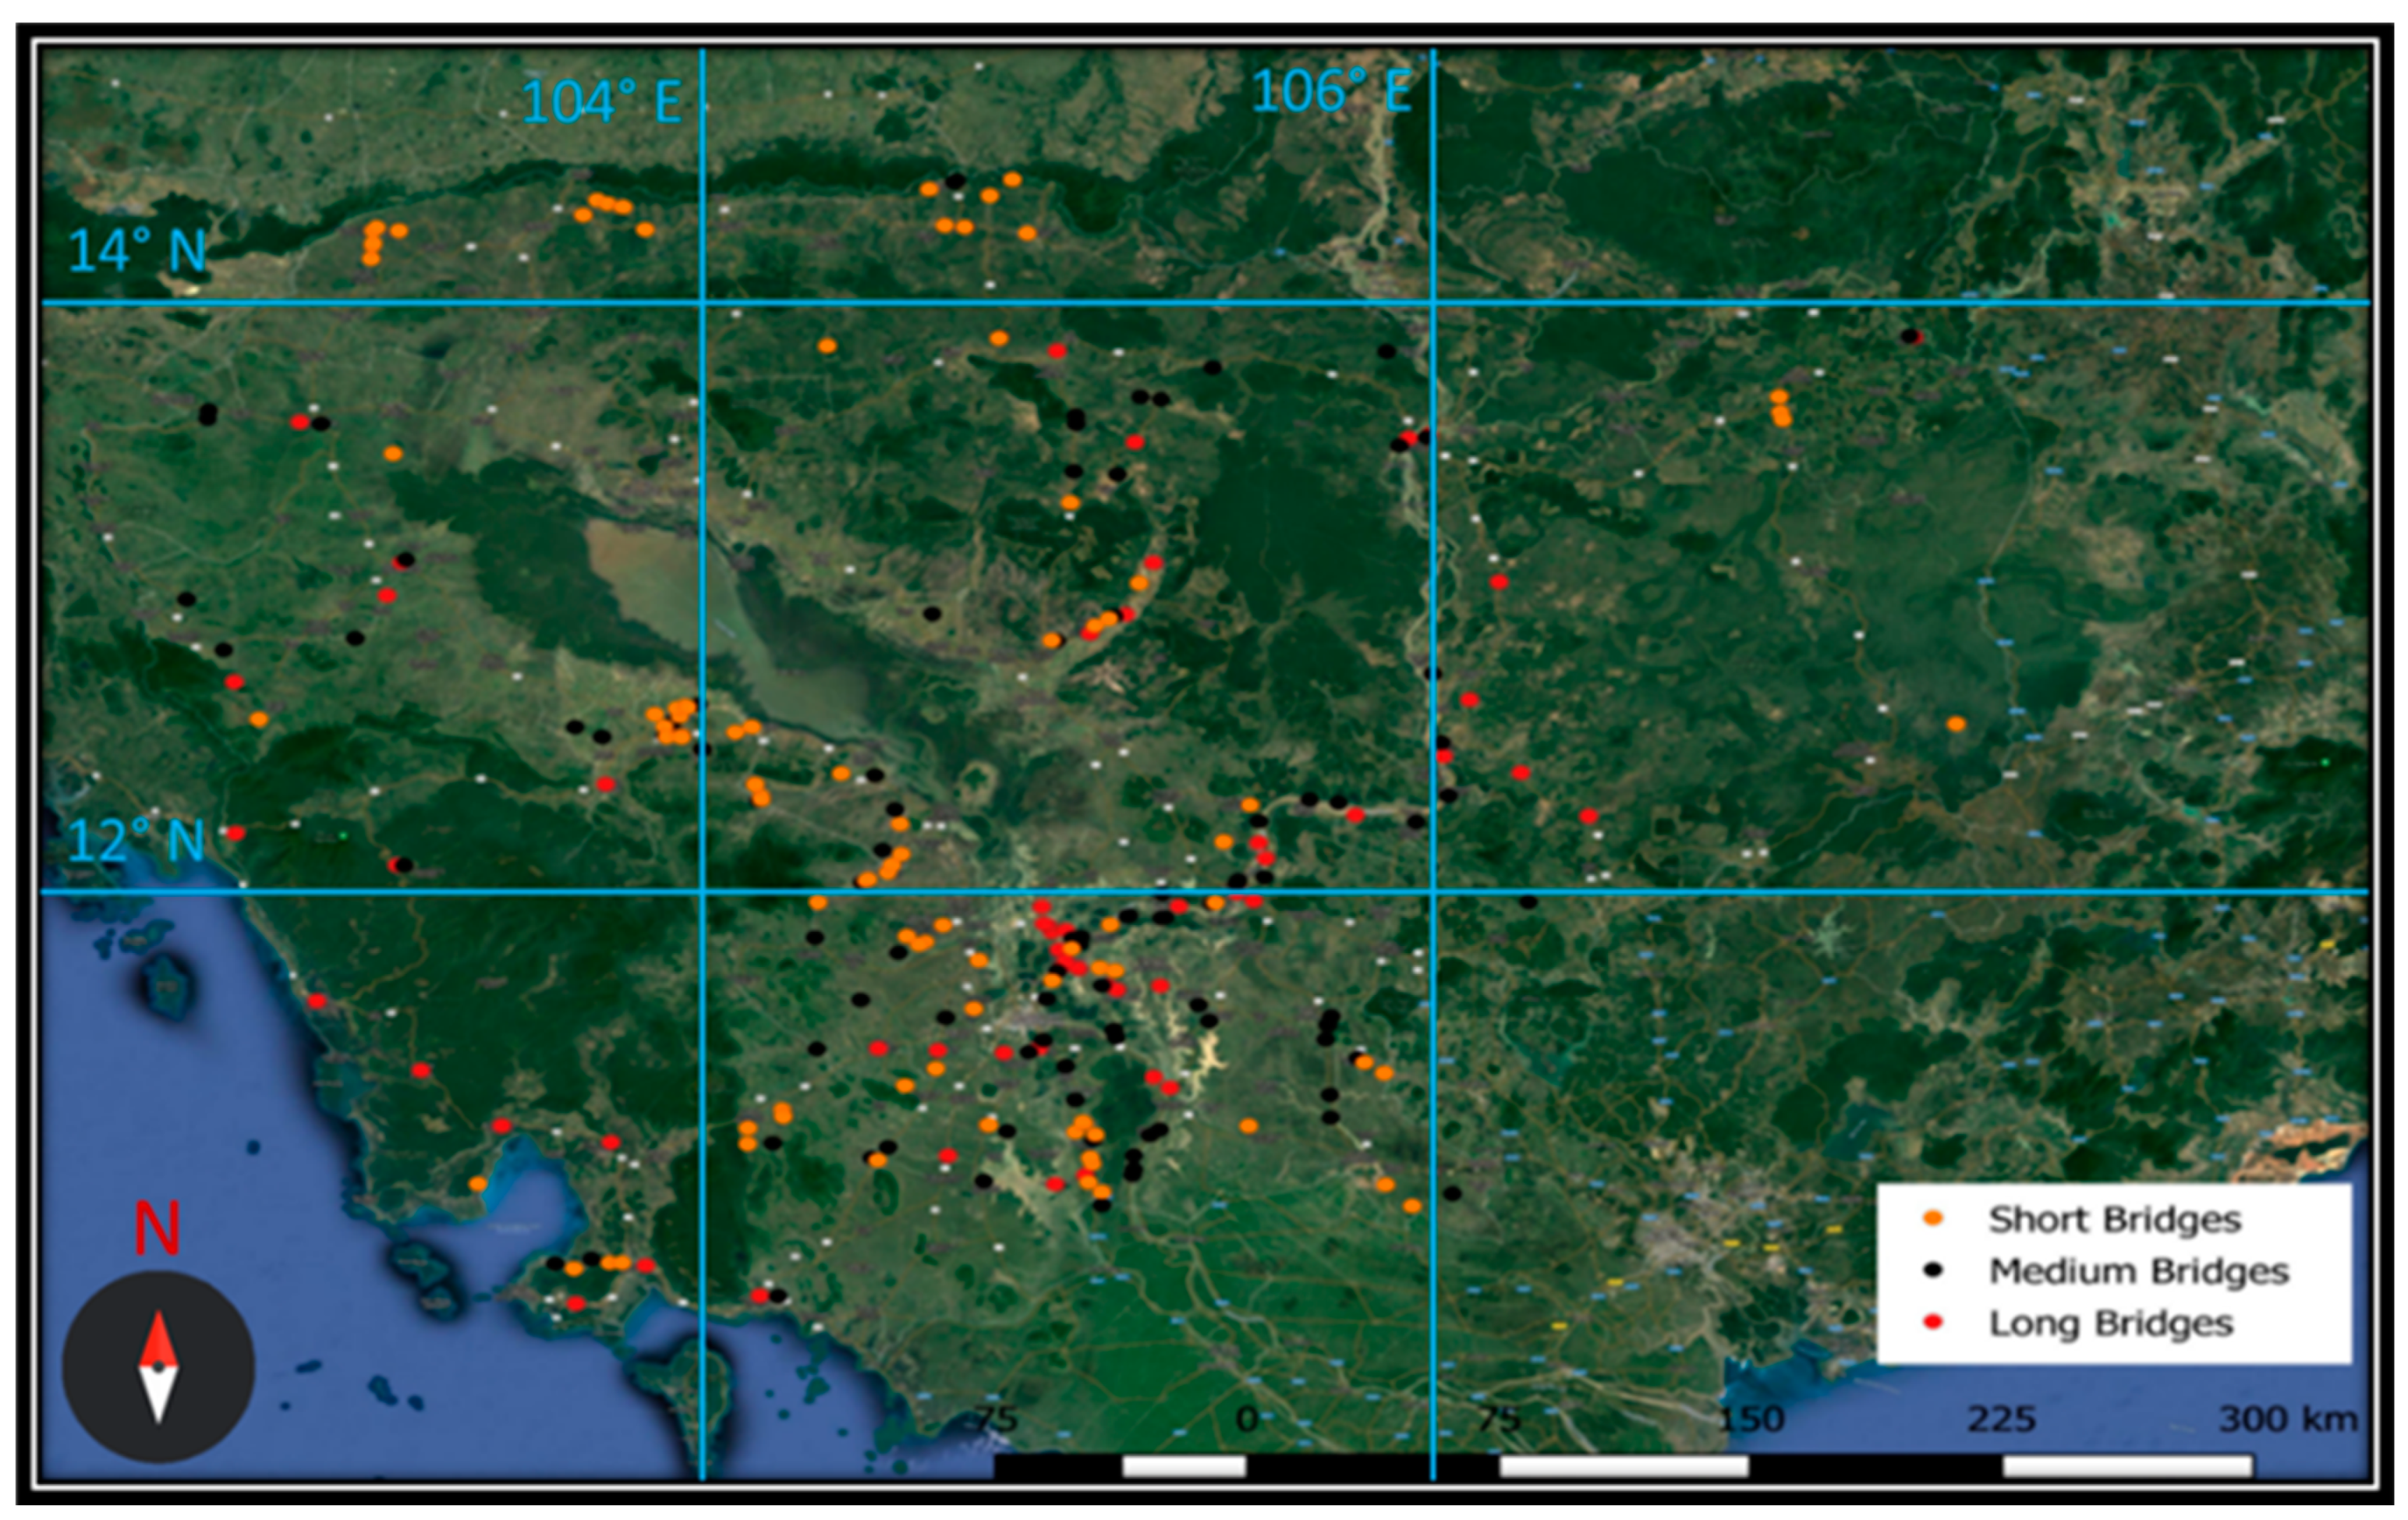
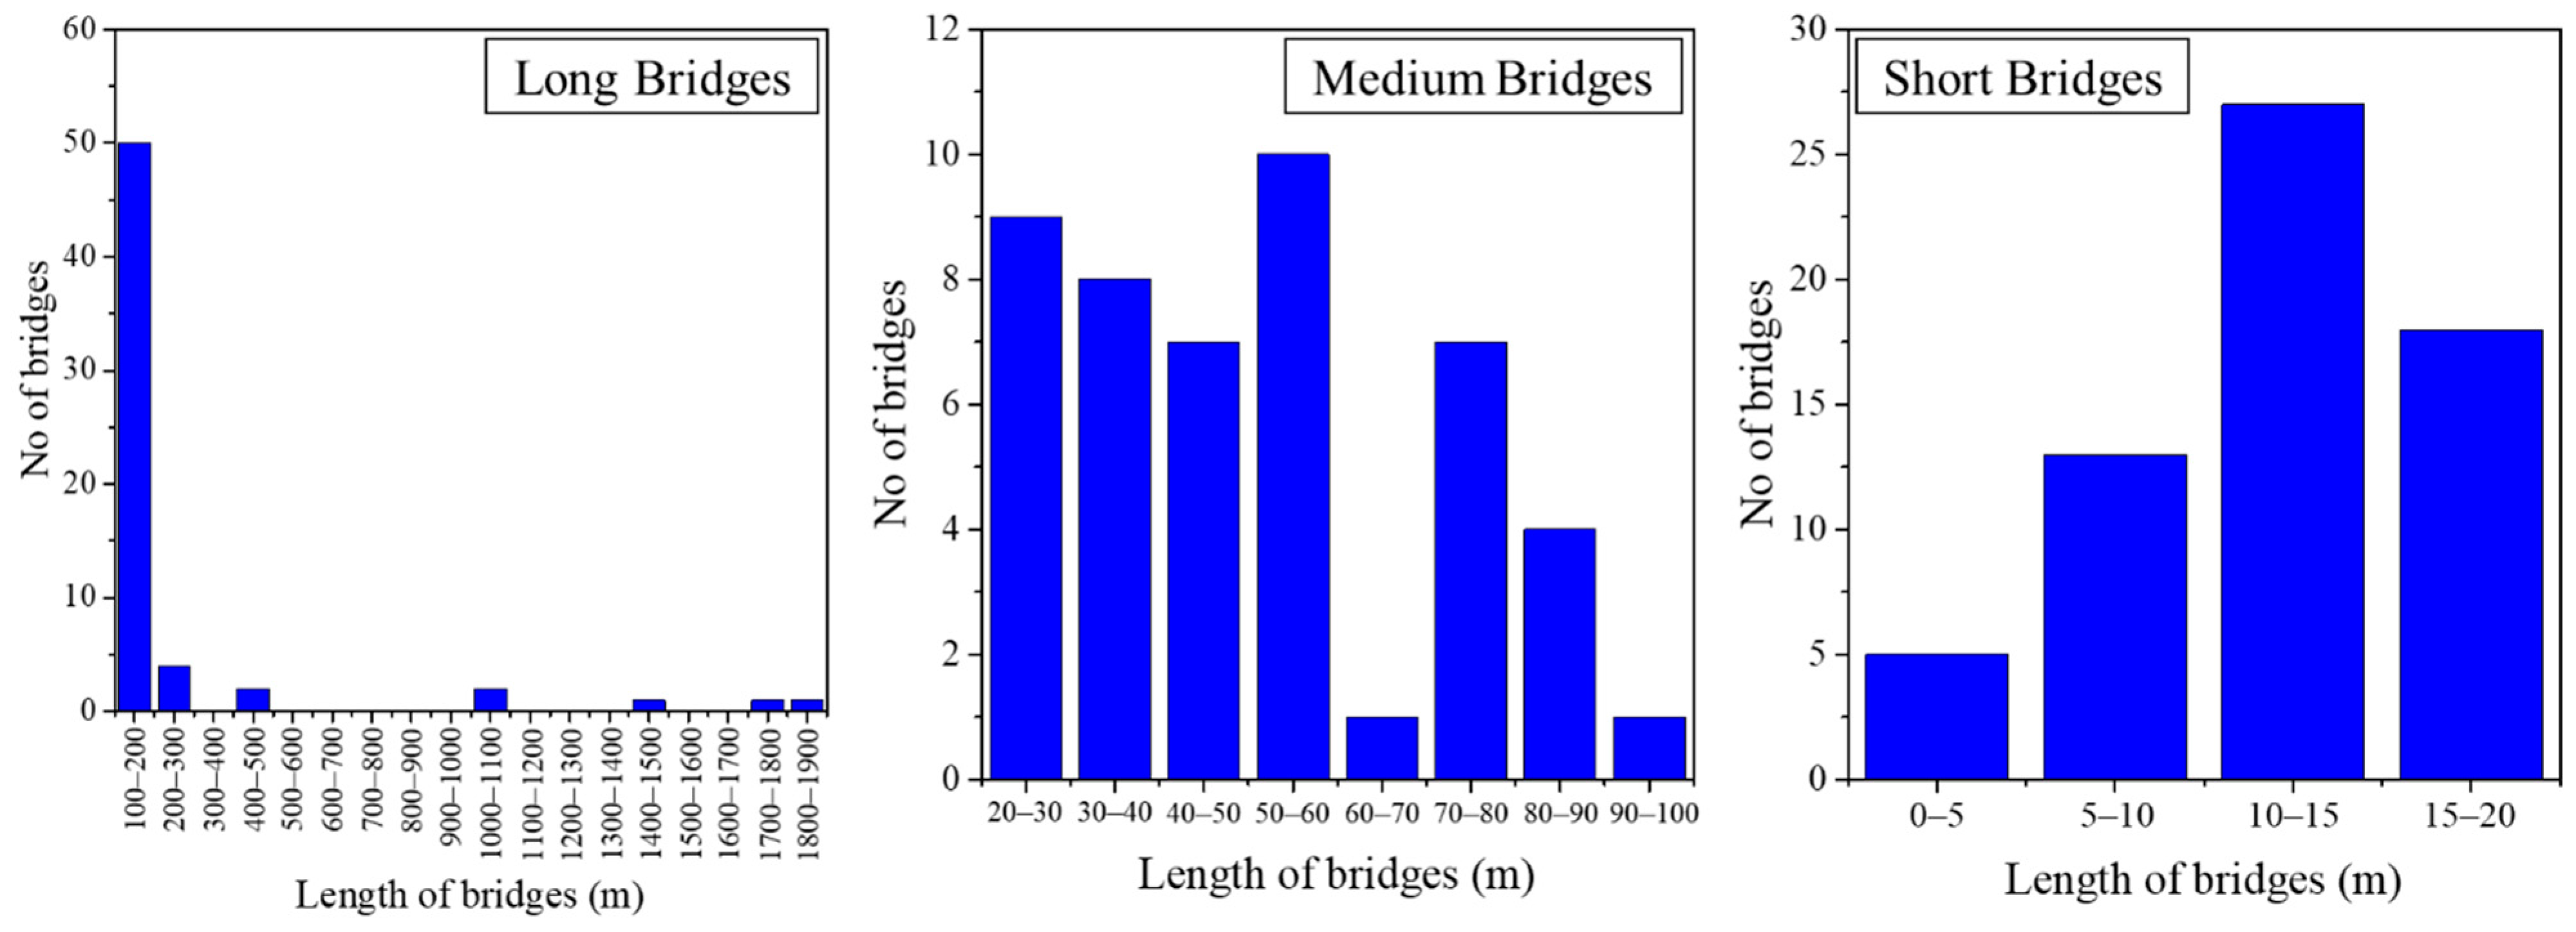
2. Bridges in Cambodia
3. Methodology
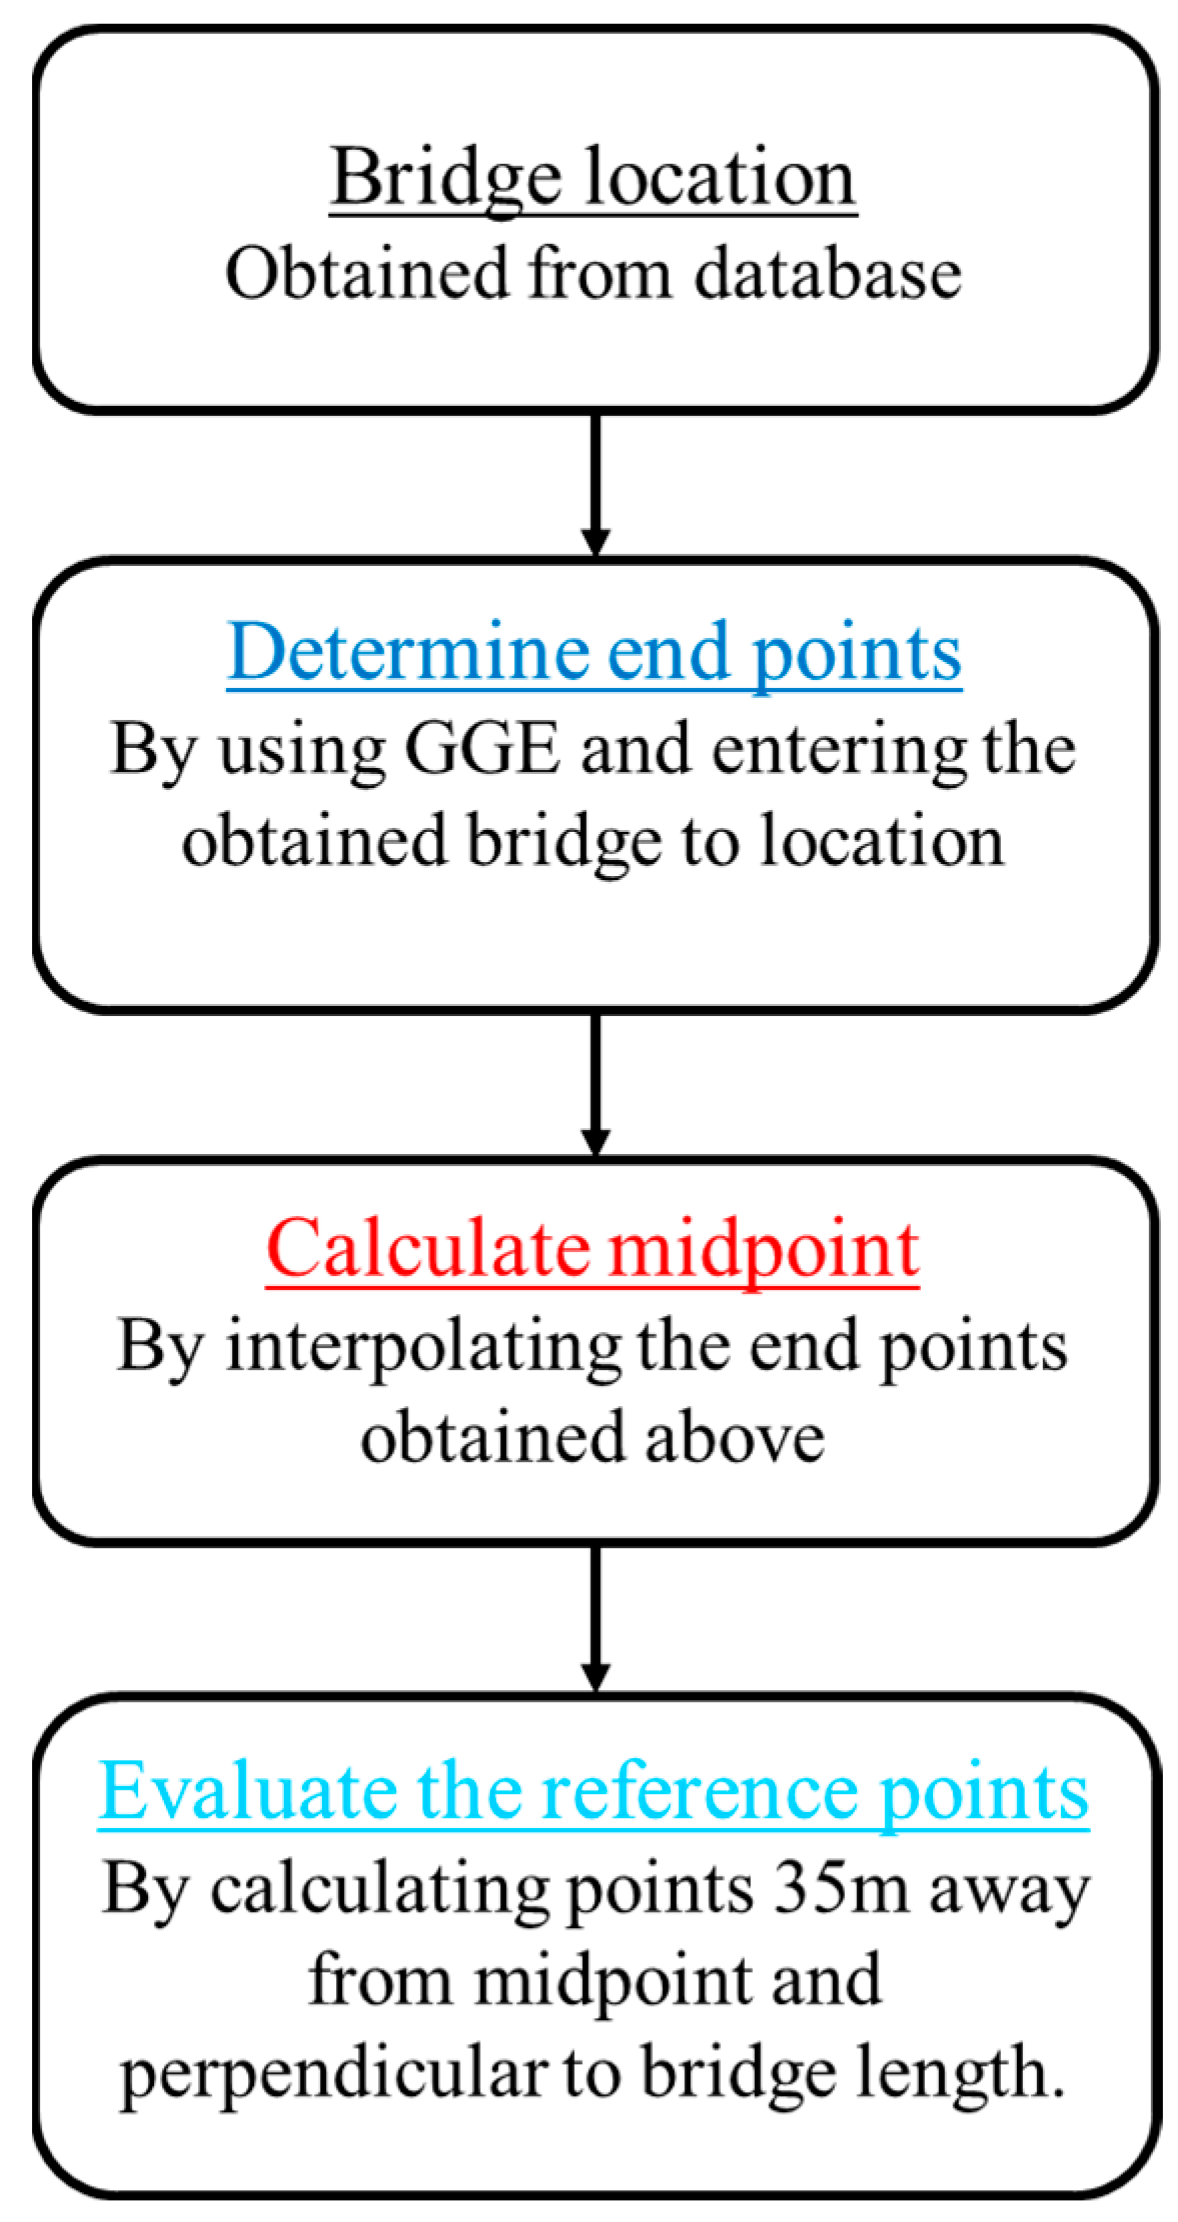
3.1. Setting up of Measurement Points
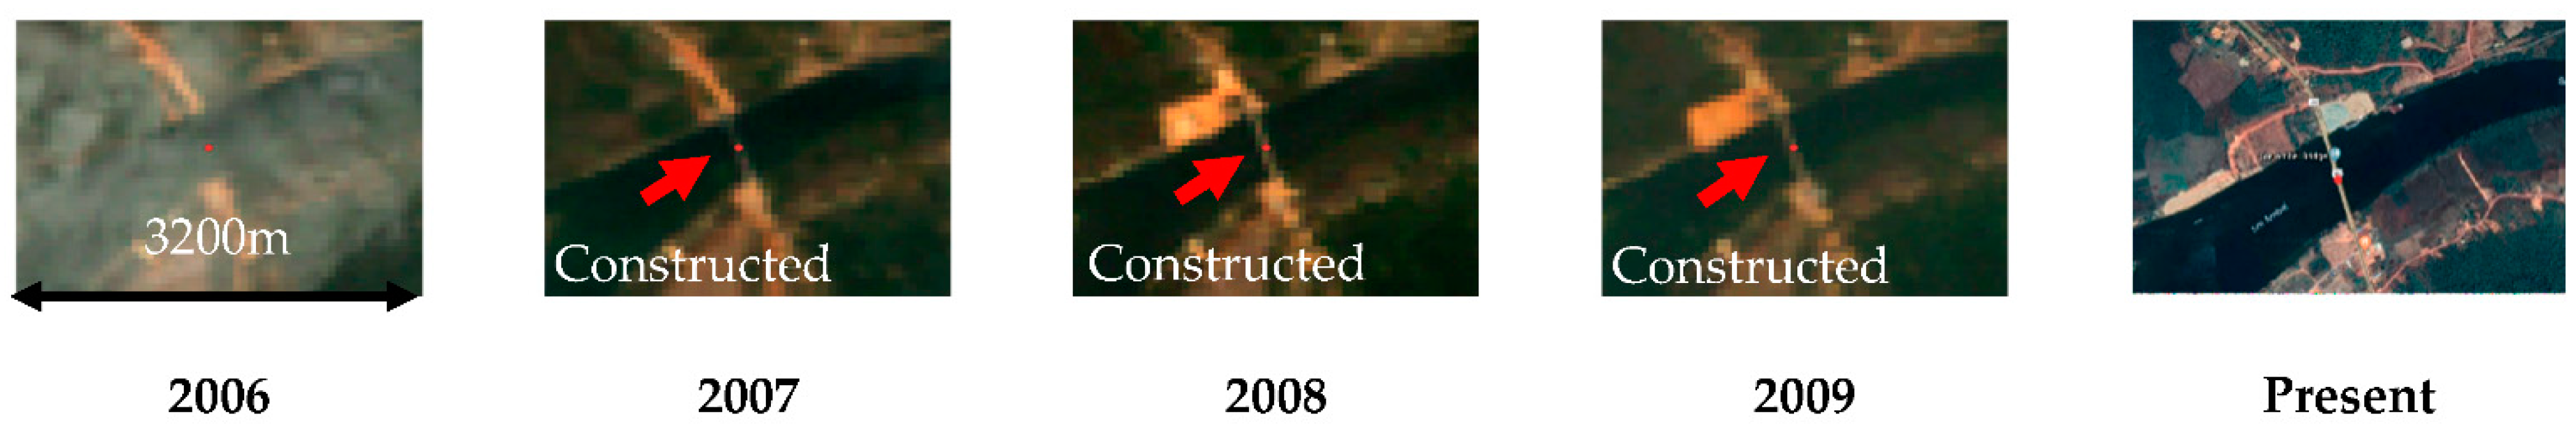
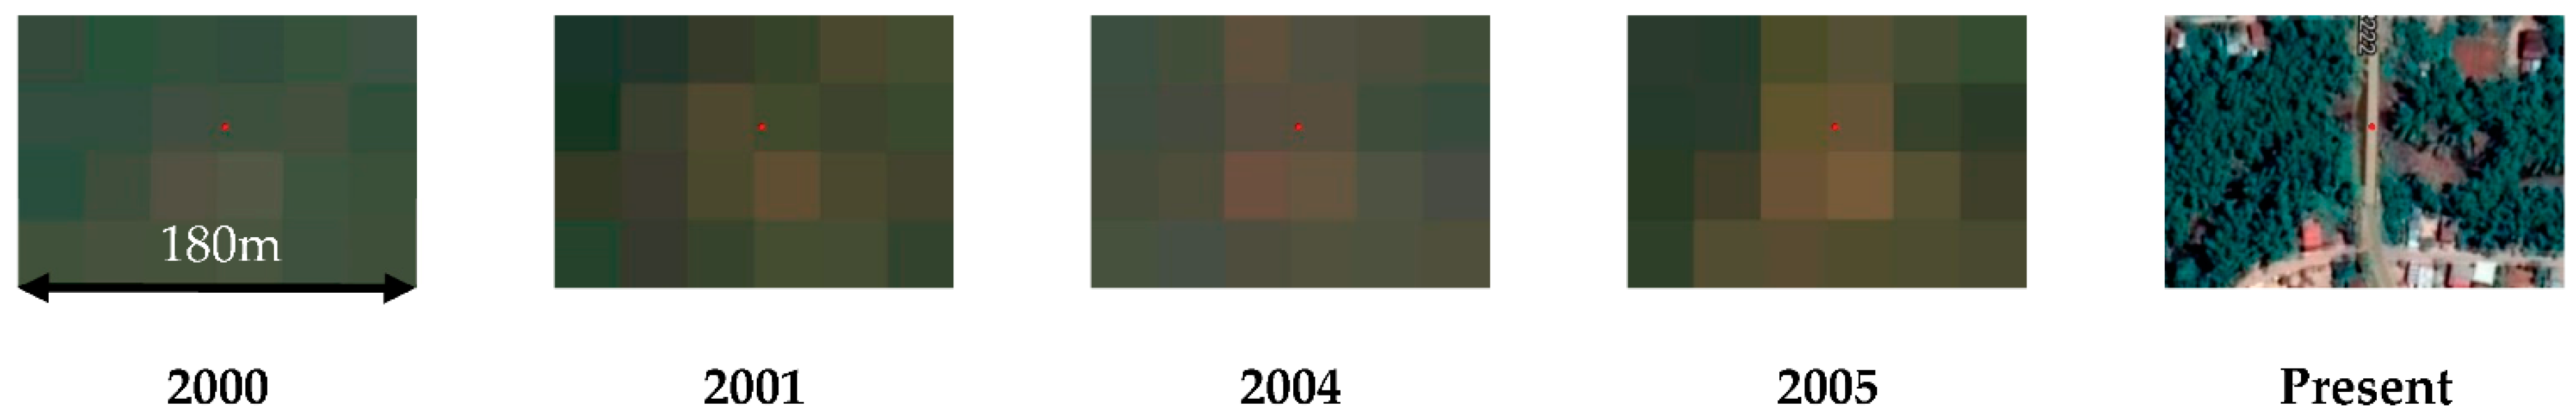
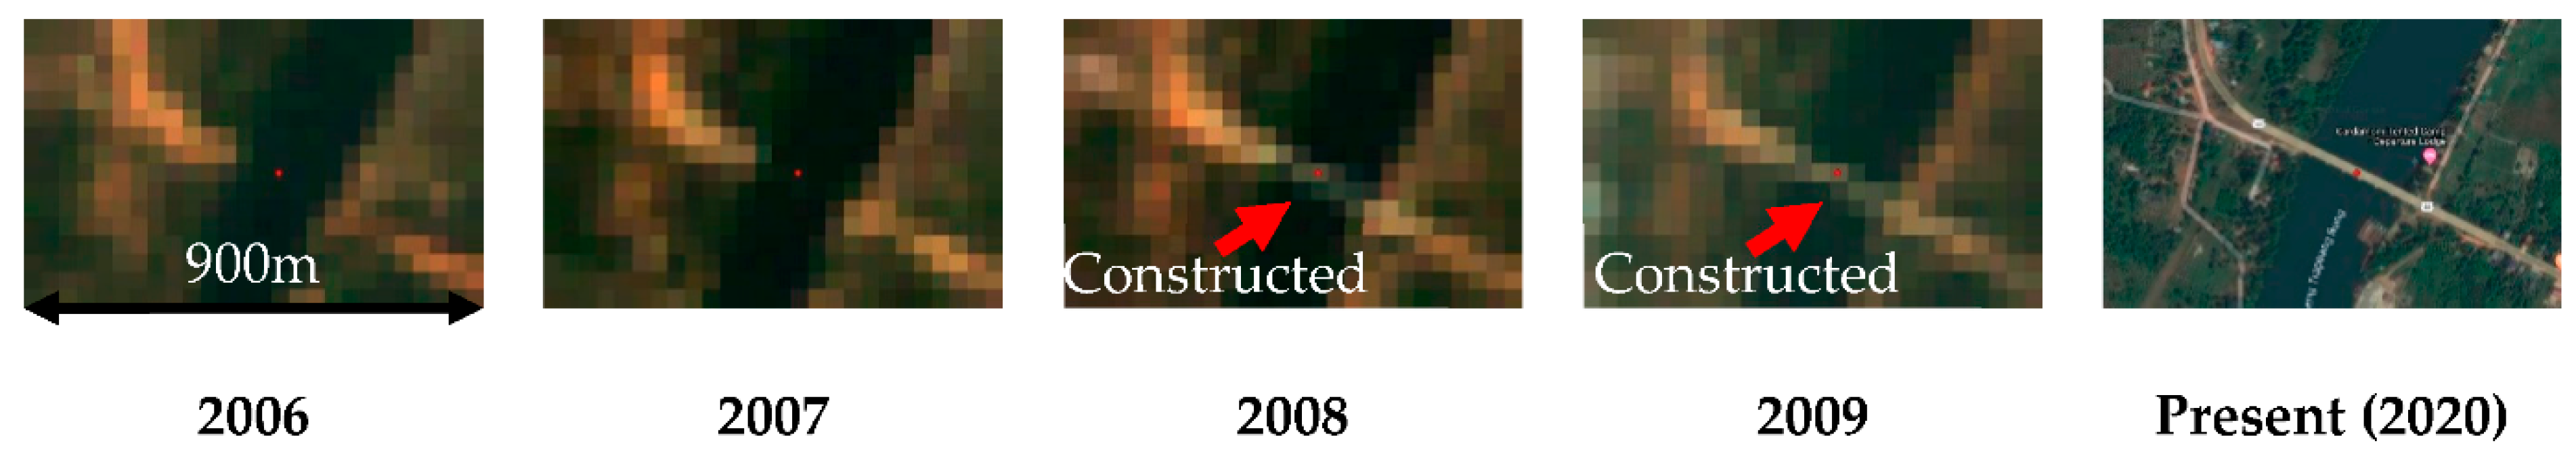
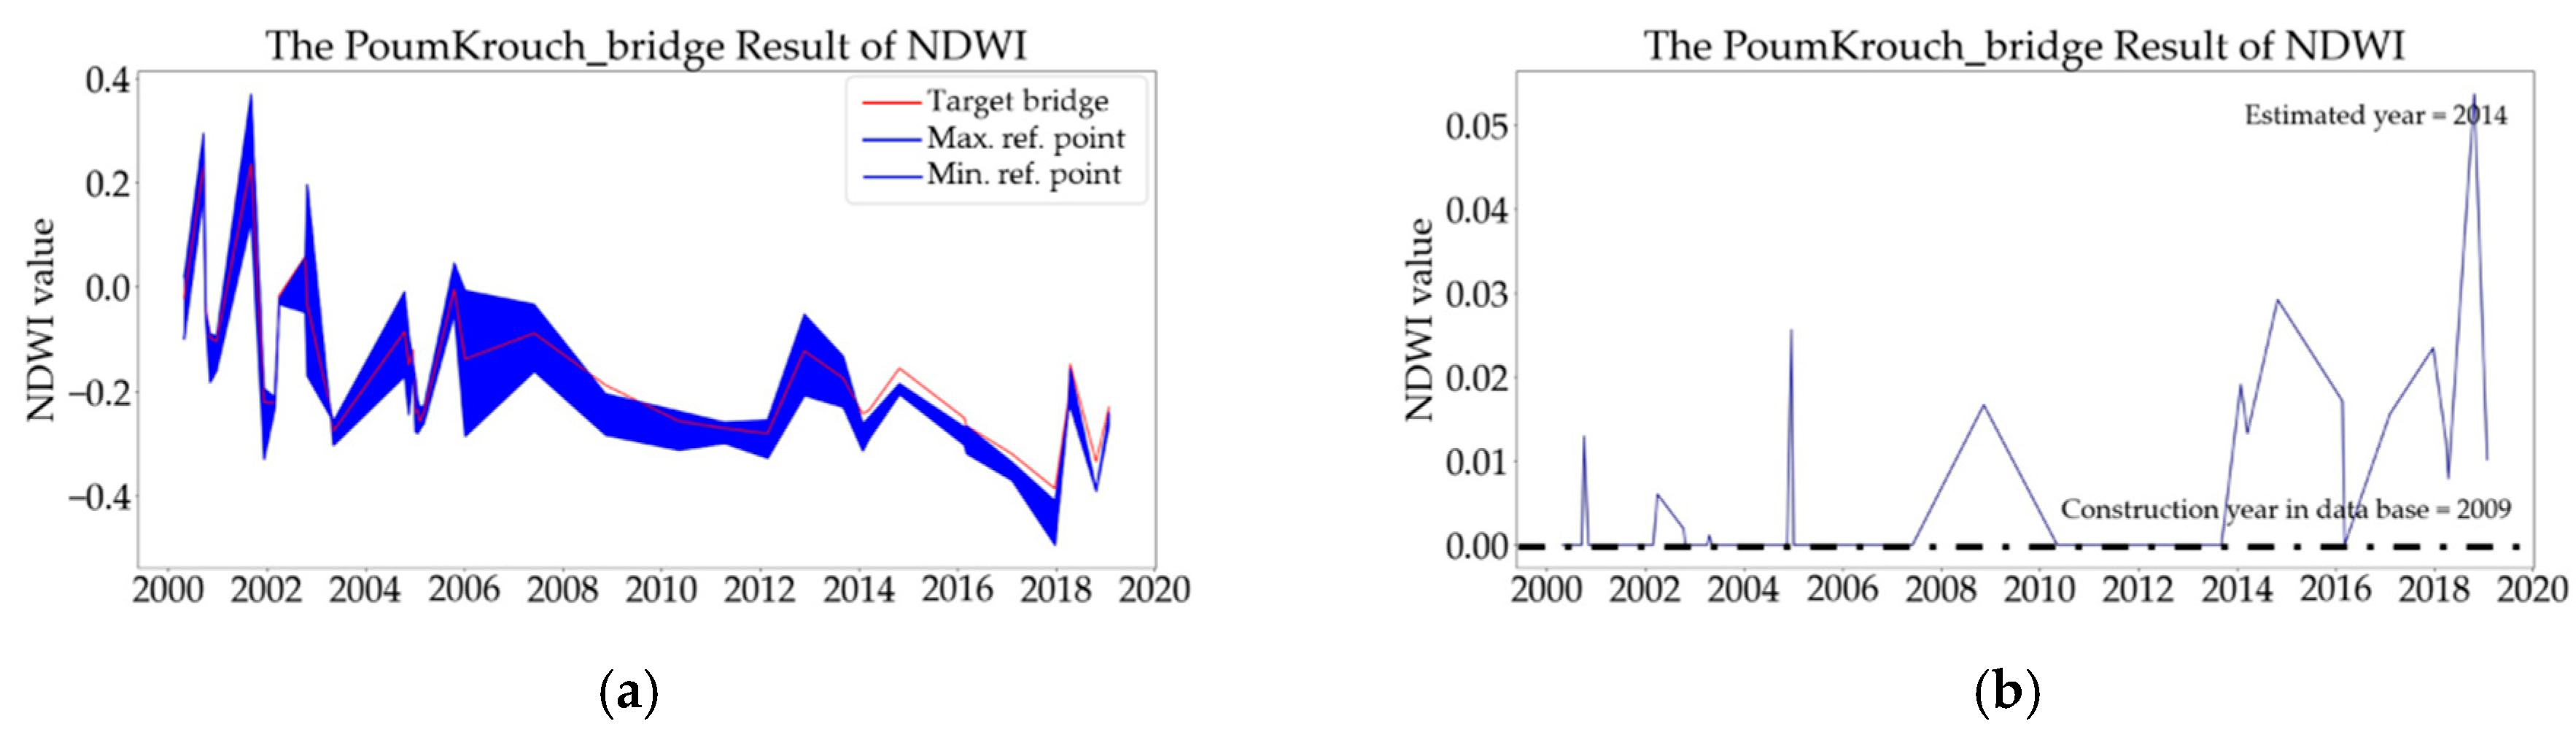
3.2. Judgment Criteria for Year of Construction
3.3. Limitations of the Proposed Methodology
3.4. Test Data
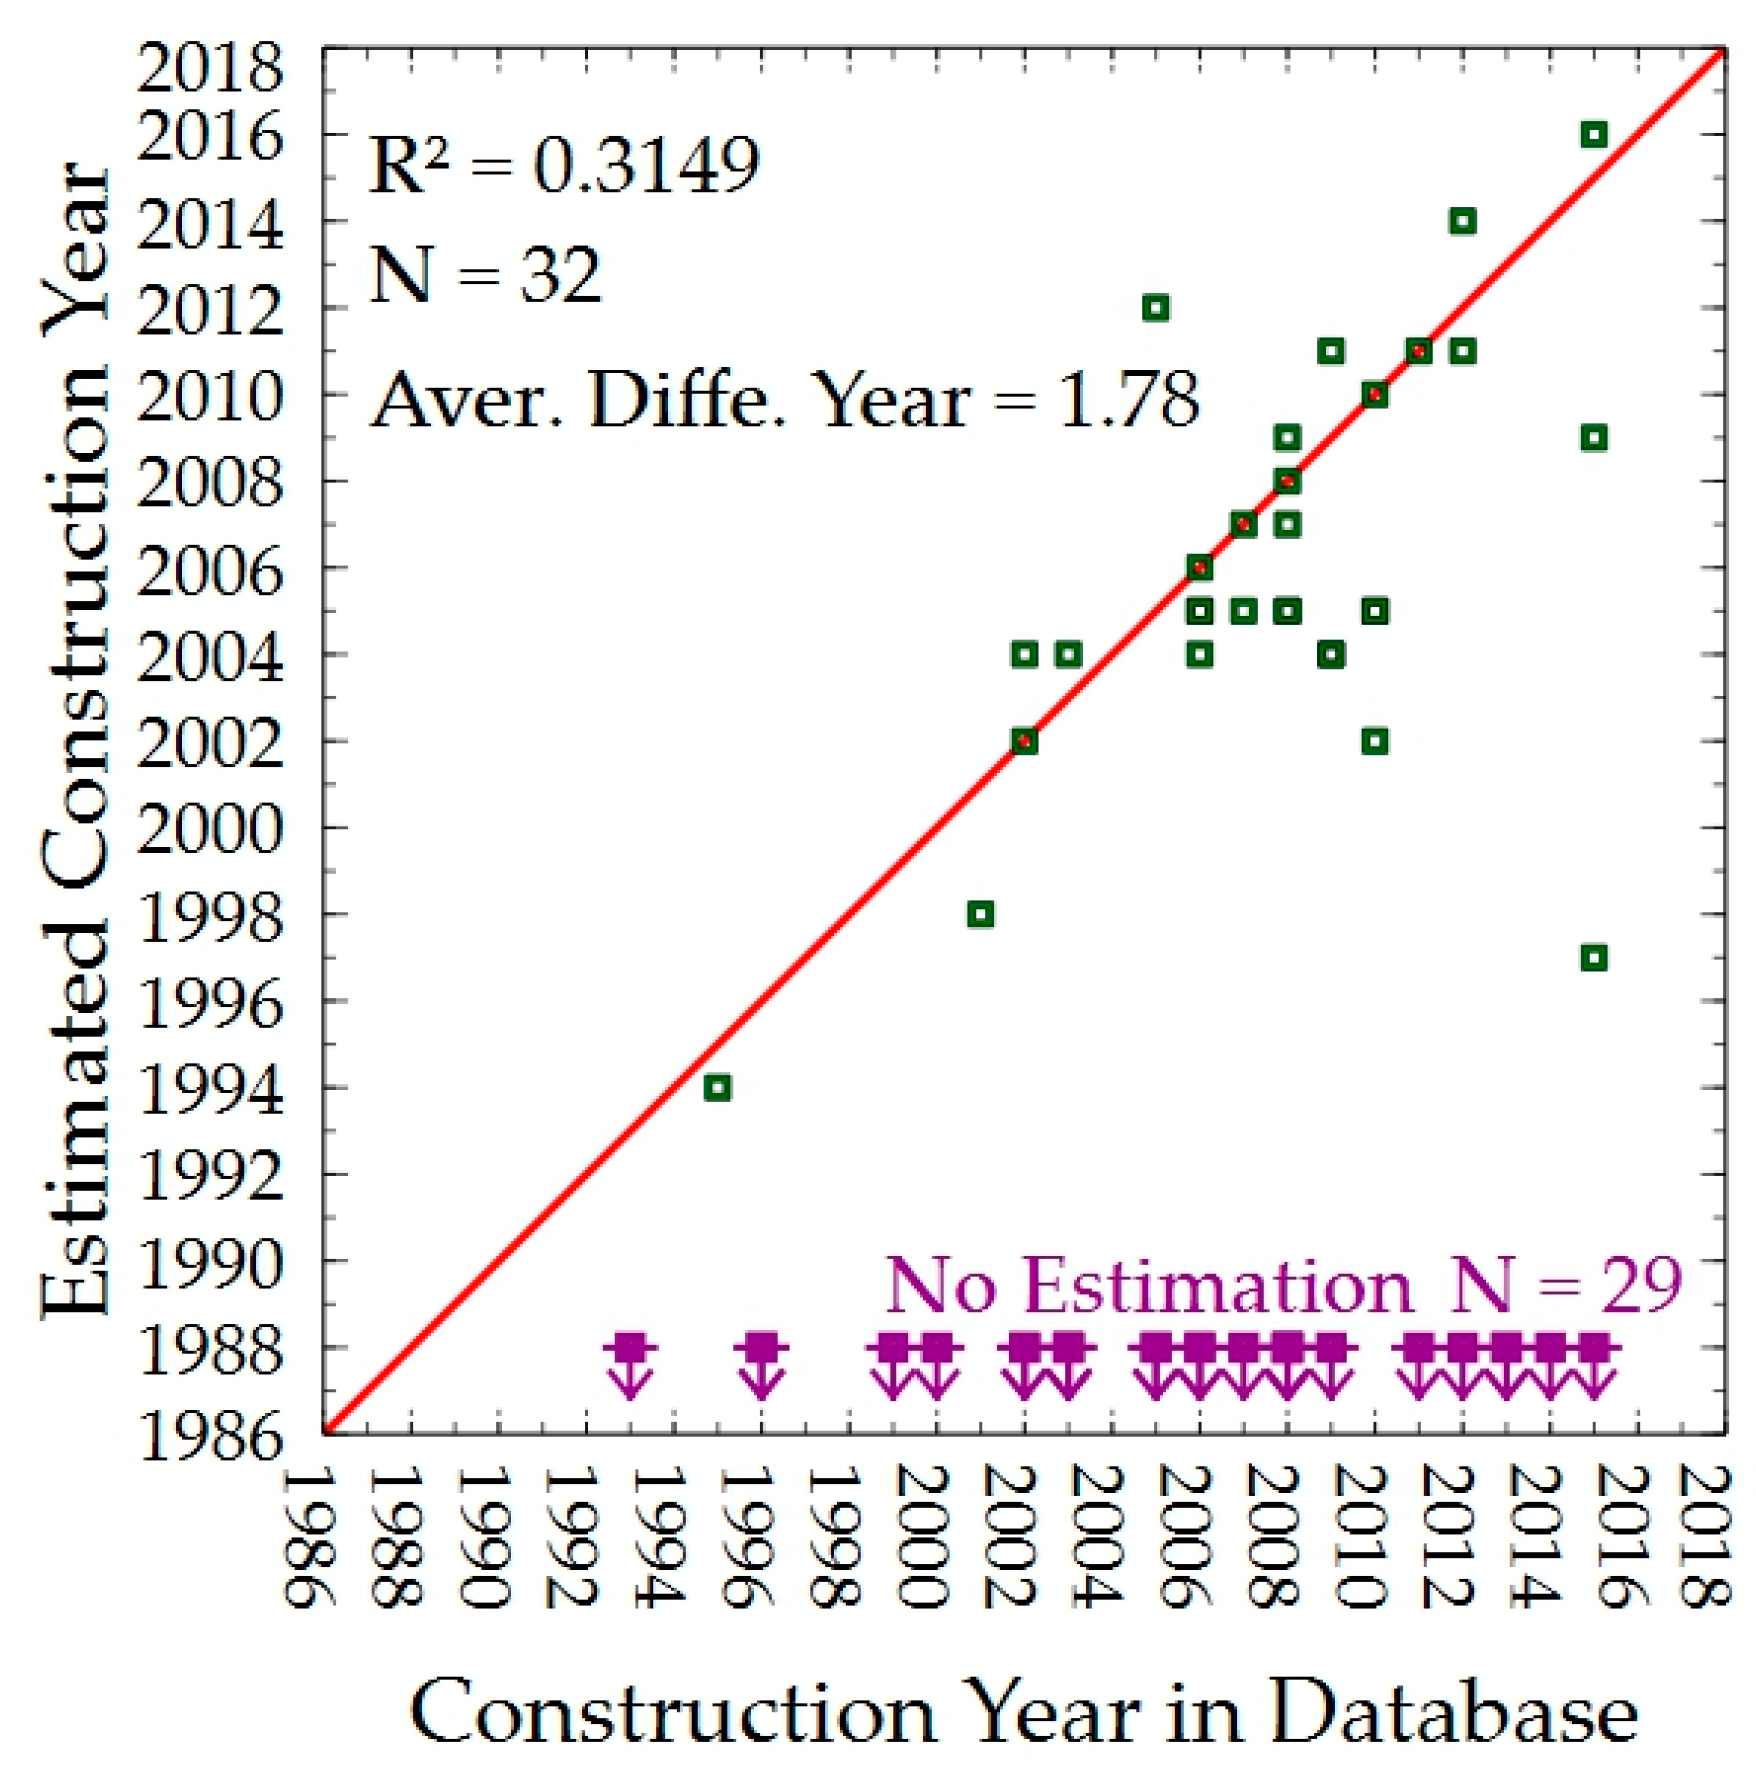
4. Results
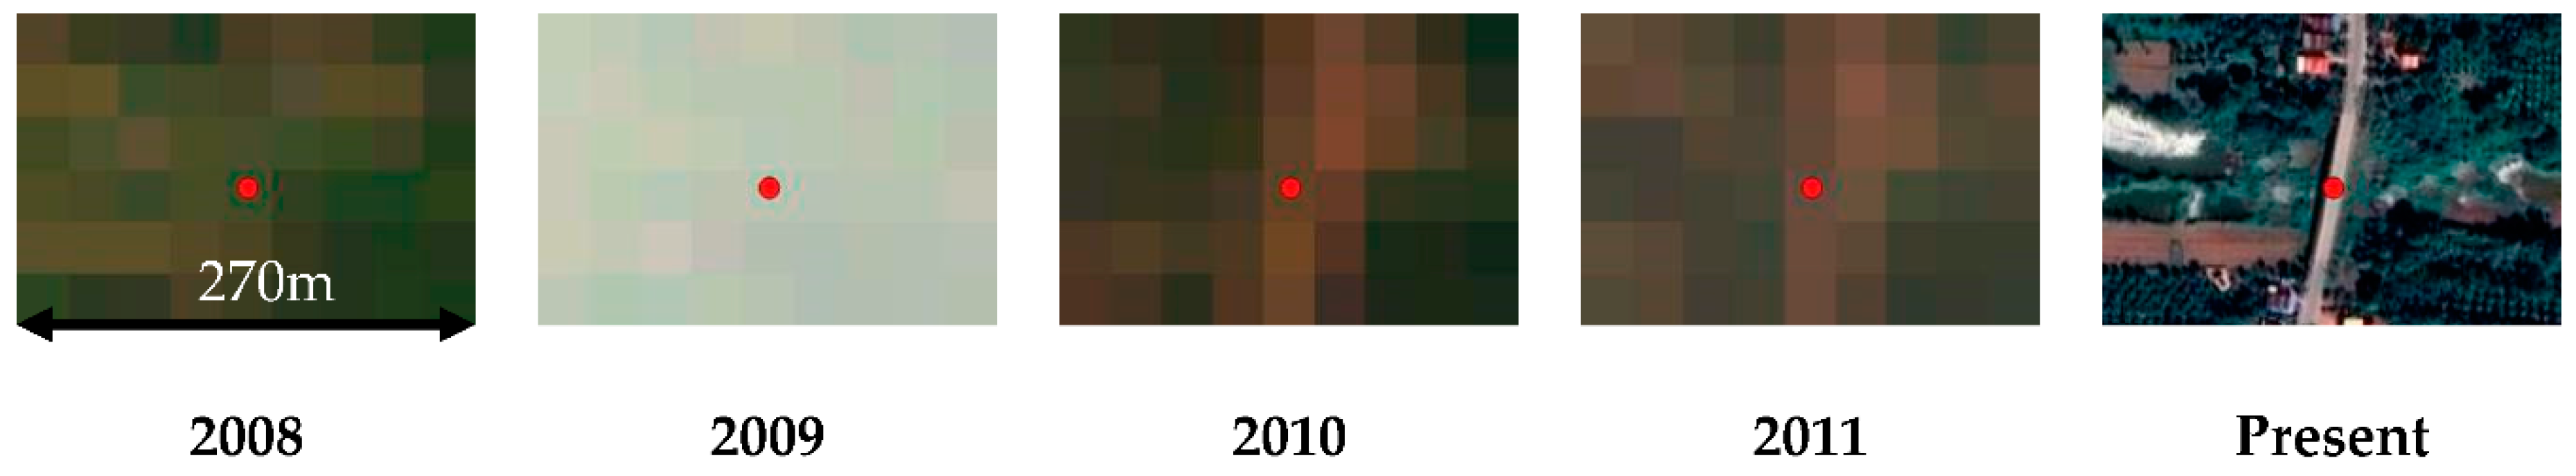
4.1. Long Bridges
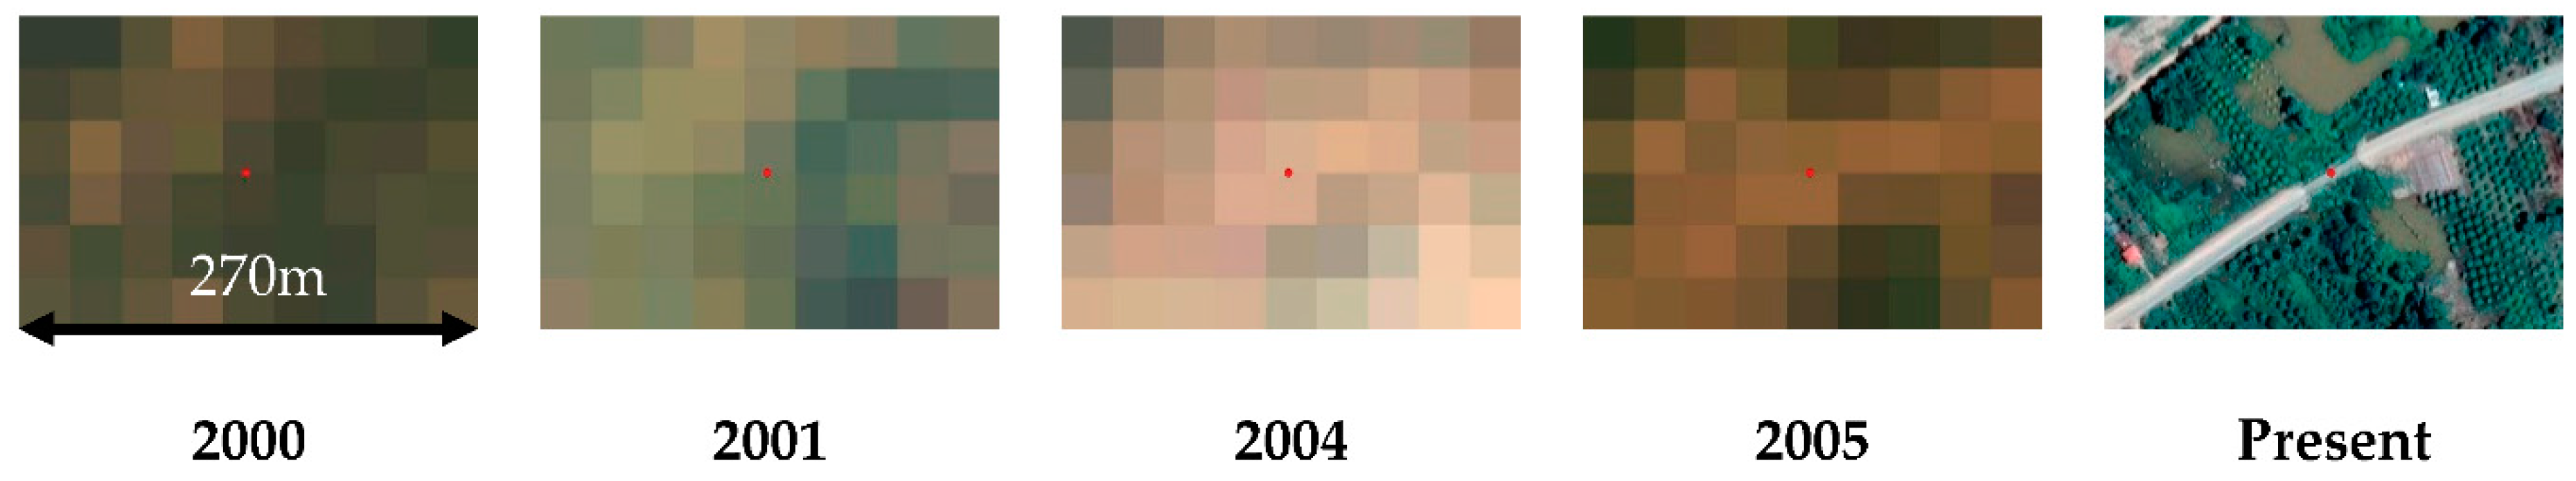
4.2. Medium Bridges
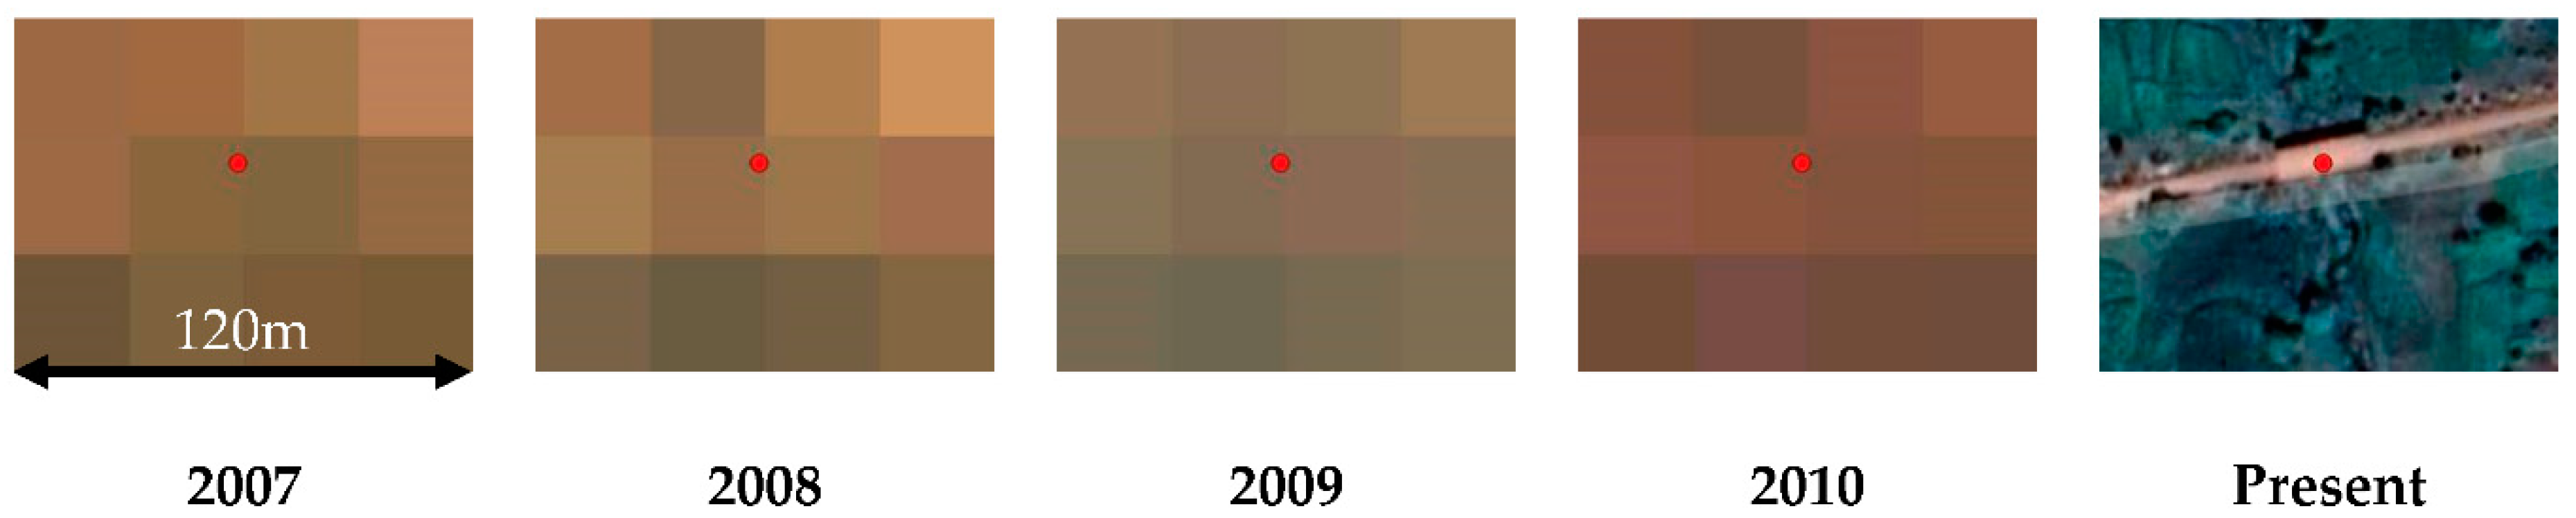
4.3. Short Bridges
5. Conclusions
Author Contributions
Funding
Data Availability Statement
Acknowledgments
Conflicts of Interest
References
- Pregnolato, M. Bridge safety is not for granted—A novel approach to bridge management. Eng. Struct. 2019, 196, 109193. [Google Scholar] [CrossRef]
- Jiang, Y. The Development of Performance Prediction and Optimization Models for Bridge Management Systems. Ph.D. Thesis, Purdue University, West Lafayette, Indiana, 1990. [Google Scholar]
- Jiang, Y.; Sinha, K.C. Bridge service life prediction model using the Markov chain. Transp. Res. Record 1989, 1223, 24–30. [Google Scholar]
- Agrawal, A.K.; Kawaguchi, A.; Chen, Z. Deterioration Rates of Typical Bridge Elements in New York. J. Bridg. Eng. 2010, 15, 419–429. [Google Scholar] [CrossRef]
- Bulusu, S.; Sinha, K.C. Comparison of Methodologies to Predict Bridge Deterioration. Transp. Res. Rec. J. Transp. Res. Board 1997, 1597, 34–42. [Google Scholar] [CrossRef]
- Jeong, Y.; Kim, W.; Lee, I.; Lee, J. Bridge service life estimation considering inspection reliability. KSCE J. Civ. Eng. 2016, 21, 1882–1893. [Google Scholar] [CrossRef]
- Soergel, U.; Thiele, A.; Gross, H.; Thoennessen, U. Extraction of Bridge Features from high-resolution InSAR Data and optical Images. In Proceedings of the 2007 Urban Remote Sensing Joint Event, Paris, France, 11–13 April 2007; pp. 1–6. [Google Scholar] [CrossRef]
- Abraham, L.; Sasikumar, M. Analysis of Satellite Images for the Extraction of Structural Features. IETE Tech. Rev. 2014, 31, 118–127. [Google Scholar] [CrossRef]
- Nettis, A.; Massimi, V.; Nutricato, R.; Nitti, D.O.; Samarelli, S.; Uva, G. Satellite-based interferometry for monitoring structural deformations of bridge portfolios. Autom. Constr. 2023, 147, 104707. [Google Scholar] [CrossRef]
- Macchiarulo, V.; Milillo, P.; Blenkinsopp, C.; Giardina, G. Monitoring deformations of infrastructure networks: A fully automated GIS integration and analysis of InSAR time-series. Struct. Health Monit. 2022, 21, 1849–1878. [Google Scholar] [CrossRef]
- Cusson, D.; Rossi, C.; Ozkan, I.F. Early warning system for the detection of unexpected bridge displacements from radar satellite data. J. Civ. Struct. Health Monit. 2020, 11, 189–204. [Google Scholar] [CrossRef]
- A Brief History of the Landsat Program; December 1997; USGS Fact Sheet 084-97. Available online: https://www.usgs.gov/ (accessed on 1 April 2023).
- Landsat Satellite Missions U.S Geological Survey Official Homepage. Available online: https://www.usgs.gov/land-resources/nli/landsat/landsat-satellite-missions?qt-science_support_page_related_con=2#qt-science_support_page_related_con (accessed on 19 November 2019).
- Landsat Acquisition Tool, U.S Geological Survey Official Homepage. Available online: https://landsat.usgs.gov/landsat_acq (accessed on 3 December 2019).
- Milillo, P.; Giardina, G.; Perissin, D.; Milillo, G.; Coletta, A.; Terranova, C. Pre-Collapse Space Geodetic Observations of Critical Infrastructure: The Morandi Bridge, Genoa, Italy. Remote Sens. 2019, 11, 1403. [Google Scholar] [CrossRef]
- Haack, B.; Messina, J. Monitoring wetland changes with remote sensing: An East African example. Environ. Manag. 1996, 20, 411–419. [Google Scholar] [CrossRef]
- Chang, L.; Dollevoet, R.; Hanssen, R. Railway Infrastructure Monitoring using Satellite Radar Data. Int. J. Railw. Technol. 2014, 3, 79–91. [Google Scholar] [CrossRef]
- Brekke, C.; Solberg, A.H. Oil spill detection by satellite remote sensing. Remote Sens. Environ. 2005, 95, 1–13. [Google Scholar] [CrossRef]
- Montillet, J.-P.; Szeliga, W.M.; Melbourne, T.I.; Flake, R.M.; Schrock, G. Critical Infrastructure Monitoring with Global Navigation Satellite Systems. J. Surv. Eng. 2016, 142, 04016014. [Google Scholar] [CrossRef]
- Zhang, G.; Wu, M.; Wei, J.; He, Y.; Niu, L.; Li, H.; Xu, G. Adaptive Threshold Model in Google Earth Engine: A Case Study of Ulva prolifera Extraction in the South Yellow Sea, China. Remote Sens. 2021, 13, 3240. [Google Scholar] [CrossRef]
- Yu, W.; Zhou, W.; Dawa, Z.; Wang, J.; Qian, Y.; Wang, W. Quantifying Urban Vegetation Dynamics from a Process Perspective Using Temporally Dense Landsat Imagery. Remote Sens. 2021, 13, 3217. [Google Scholar] [CrossRef]
- John, E.; Bunting, P.; Hardy, A.; Silayo, D.; Masunga, E. A Forest Monitoring System for Tanzania. Remote Sens. 2021, 13, 3081. [Google Scholar] [CrossRef]
- Chamberlain, D.; Phinn, S.; Possingham, H. Mangrove Forest Cover and Phenology with Landsat Dense Time Series in Central Queensland, Australia. Remote Sens. 2021, 13, 3032. [Google Scholar] [CrossRef]
- Landsat Surface Reflectance-Derived Spectral Indices, Landsat Normalized Difference Vegetation Index. U.S Geological Survey Official Homepage. Available online: https://www.usgs.gov/land-resources/nli/landsat/landsat-normalized-difference-vegetation-index?qt-science_support_page_related_con=0#qt-science_support_page_related_con (accessed on 3 December 2019).
- Gao, B.-C. NDWI—A normalized difference water index for remote sensing of vegetation liquid water from space. Remote Sens. Environ. 1996, 58, 257–266. [Google Scholar] [CrossRef]
- Xu, C.; Qu, J.J.; Hao, X.; Wu, D. Monitoring Surface Soil Moisture Content over the Vegetated Area by Integrating Optical and SAR Satellite Observations in the Permafrost Region of Tibetan Plateau. Remote Sens. 2020, 12, 183. [Google Scholar] [CrossRef]
- Chen, D.; Jackson, T.; Li, F.; Cosh, M.; Walthall, C.; Anderson, M. Estimation of vegetation water content for corn and soybeans with a normalized difference water index (NDWI) using Landsat Thematic Mapper data. In Proceedings of the 2003 IEEE International Geoscience and Remote Sensing Symposium, Toulouse, France, 21–25 July 2003; IEEE: New York, NY, USA, 2003; Volume 4, pp. 2853–2856. [Google Scholar] [CrossRef]
- McFeeters, S.K. Using the Normalized Difference Water Index (NDWI) within a Geographic Information System to Detect Swimming Pools for Mosquito Abatement: A Practical Approach. Remote Sens. 2013, 5, 3544–3561. [Google Scholar] [CrossRef]
- Du, Z.; Linghu, B.; Ling, F.; Li, W.; Tian, W.; Wang, H.; Gui, Y.; Sun, B.; Zhang, X. Estimating surface water area changes using time-series Landsat data in the Qingjiang River Basin, China. J. Appl. Remote Sens. 2012, 6, 063609. [Google Scholar] [CrossRef]
- Jain, S.K.; Singh, R.D.; Jain, M.; Lohani, A.K. Delineation of Flood-Prone Areas Using Remote Sensing Techniques. Water Resour. Manag. 2005, 19, 333–347. [Google Scholar] [CrossRef]
- Zhu, H.; Jia, G.; Zhang, Q.; Zhang, S.; Lin, X.; Shuai, Y. Detecting Offshore Drilling Rigs with Multitemporal NDWI: A Case Study in the Caspian Sea. Remote Sens. 2021, 13, 1576. [Google Scholar] [CrossRef]
- Khatancharoen, C.; Tsuyuki, S.; Bryanin, S.; Sugiura, K.; Seino, T.; Lisovsky, V.; Borisova, I.; Wada, N. Long-Time Interval Satellite Image Analysis on Forest-Cover Changes and Disturbances around Protected Area, Zeya State Nature Reserve, in the Russian Far East. Remote Sens. 2021, 13, 1285. [Google Scholar] [CrossRef]
- Titolo, A. Use of Time-Series NDWI to Monitor Emerging Archaeological Sites: Case Studies from Iraqi Artificial Reservoirs. Remote Sens. 2021, 13, 786. [Google Scholar] [CrossRef]
- Wieland, M.; Martinis, S. A Modular Processing Chain for Automated Flood Monitoring from Multi-Spectral Satellite Data. Remote Sens. 2019, 11, 2330. [Google Scholar] [CrossRef]
- Gorelick, N. Google Earth Engine. In Proceedings of the EGU General Assembly Conference Abstracts, Vienna, Austria, 7–12 April 2013; Volume 15, p. 11997. [Google Scholar]


| Bridge Category | No. of Bridges | Length (m) |
|---|---|---|
| Long Bridge | 61 | (Bridges ≥ 100) |
| Medium Bridge | 100 | (100 > Bridges ≥ 20) |
| Short Bridge | 100 | (Bridges < 20) |
Disclaimer/Publisher’s Note: The statements, opinions and data contained in all publications are solely those of the individual author(s) and contributor(s) and not of MDPI and/or the editor(s). MDPI and/or the editor(s) disclaim responsibility for any injury to people or property resulting from any ideas, methods, instructions or products referred to in the content. |
© 2023 by the authors. Licensee MDPI, Basel, Switzerland. This article is an open access article distributed under the terms and conditions of the Creative Commons Attribution (CC BY) license (https://creativecommons.org/licenses/by/4.0/).
Share and Cite
Sovisoth, E.; Kuntal, V.S.; Misra, P.; Takeuchi, W.; Nagai, K. Estimation of Year of Construction of Bridges in Cambodia by Analyzing the Landsat Normalized Difference Water Index. Infrastructures 2023, 8, 77. https://doi.org/10.3390/infrastructures8040077
Sovisoth E, Kuntal VS, Misra P, Takeuchi W, Nagai K. Estimation of Year of Construction of Bridges in Cambodia by Analyzing the Landsat Normalized Difference Water Index. Infrastructures. 2023; 8(4):77. https://doi.org/10.3390/infrastructures8040077
Chicago/Turabian StyleSovisoth, Eam, Vikas Singh Kuntal, Prakhar Misra, Wataru Takeuchi, and Kohei Nagai. 2023. "Estimation of Year of Construction of Bridges in Cambodia by Analyzing the Landsat Normalized Difference Water Index" Infrastructures 8, no. 4: 77. https://doi.org/10.3390/infrastructures8040077
APA StyleSovisoth, E., Kuntal, V. S., Misra, P., Takeuchi, W., & Nagai, K. (2023). Estimation of Year of Construction of Bridges in Cambodia by Analyzing the Landsat Normalized Difference Water Index. Infrastructures, 8(4), 77. https://doi.org/10.3390/infrastructures8040077