Abstract
This paper provides a discussion and thoughtful application on a large sample of the procedures for the classification of existing bridges recently adopted in Italy and defined within the Italian Guidelines for the classification, risk management, safety evaluation and monitoring of existing bridges and the early published Operating Instructions. Focusing on the classification at the territorial level, first the logic flows to the classification on the base of the structural risk are shown, resulting in the definition of the “structural warning class”, providing the motivations that support the criteria for the definition of such procedures. Then, a statistical analysis of the results obtained from the classification of 661 existing Italian bridges is performed, focusing on the vulnerability classification and on the influence of each parameter on its evaluation.
1. Introduction
Bridges are crucial elements in transportation networks that allow crossing natural and artificial obstacles. Indeed, being generally more complex and costly infrastructures than the roads themselves, they are less numerous and redundant, and often greatly reduce the resilience of the network. A failure or simply a loss of performance of a bridge generates important consequences on the whole road network and distribution of traffic.
Despite being such crucial elements, the attention of stakeholders to bridges has not always been sufficient in the last few decades. Most worldwide existing infrastructures are dated and are degrading due to ageing, environmental stressors, human-made hazards and natural hazards (e.g., earthquakes and hurricanes) [1]: in China, 418 reported bridge collapses occurred during the period of 2009–2019, mainly caused by flooding, scouring, collision, overload, design defects and earthquakes, wind or fire [2]; in the United States, in the years 1989–2000, a total of 503 bridge collapses were reported, mainly due to floods and scours [3]. Finally, in Italy, there have been at least 10 important bridge collapses from 2013, causing injuries, deaths and huge economic losses.
Many authors in the last few years have been interested in analyzing the causes of bridge failure [3,4,5,6]. Together with natural hazards, ageing, bad preservation conditions, and overloads [7] are the main causes of structural failures. Indeed, a great number of bridges, especially in Europe, have been built after the second world war in an emergency phase, favoring the loss of the original design documents and drawings. Zhang et al. [8] give a comprehensive review of the multiple causes and statistical characteristics of bridge failures, highlighting that the causes of bridge failures are related to the regional economy, structural type, type of use, material type, and service age, and providing a list of the leading causes of bridge failures.
Although the necessity of a structured approach for the management of existing buildings was already predicted some decades ago [9], the recent failures and the abovementioned considerations have highlighted the extreme vulnerability of the infrastructural assets and drawn social and technical attention to the need for evaluating bridges’ safety and defining proper management procedures [2,10,11]. In this regard, there are many well-established Bridge Management Systems (BMS) in the technical literature, aiming at supporting bridge asset management and optimizing the economical investment for preservation [12,13,14,15,16,17,18].
In the vast scenario of the several BMSs in use all over the world, it is however possible to identify some common aspects. First of all, most BMSs base the classification system on the quick evaluation of a Bridge Condition Index (BCI): this index represents the conservation status of the bridge structural elements and is used to define a priority order for a preliminary list of the most damaged structures [19]. The second common aspect is the execution of the visual inspections as the starting point for the determination of the BCI. The visual inspections are necessary for identifying the current conservation status of the bridge and the presence of any degradation phenomena, which must be defined by the inspector in intensity and extension using numerical coefficients.
In most cases, the BCI is obtained as a sum or product of factors only related to the bridge state of preservation, hence factors connected to different sources of risk are not involved. In these cases, the BCI surely gives information about the needs of maintenance activities, but not considering all the relevant sources of risk [20]. To consider them, some methods propose to adjust the BCI by considering coefficients related to other characteristics, such as the traffic volumes or factors related to seismic and hydrogeologic hazards. In these cases, the main issue can be that all these factors are gathered in a single numerical value. Indeed, it is not possible to distinguish the importance of each aspect in the evaluation of the intervention priority, and it does not consider that structural, seismic, and hydrogeologic risks depend on dissimilar sources and are related to events with different return periods. Moreover, the assignment of numerical indexes can lead to the false sensation of extreme accuracy in the performed elaborations, which cannot be obtained by post-processing data from quick visual surveys.
Finally, in most cases, the actions to be undertaken after the classification and the prioritization are limited to the structural assessment in the worst cases, or the periodical repetition of the quick surveys. This type of approach does not consider the difficulties of simultaneously executing the fully detailed analyses included in the structural assessment of a high number of bridges.
In this context, the Italian situation is particularly complicated by further specific issues:
- Italian bridges are usually managed by very different institutions, starting from the small provincial and regional realities up to larger management companies (highways). Each of them has its own system and has different amounts of economic resources to invest. This high fragmentation of administrative competencies limits the definition of standardized and shared management approaches.
- The high number of existing bridges, most of which in Italy are at the end of their design life and with a bad state of preservation, makes it difficult to assess all the structures with the same detail level in a context of a reasonable amount of economic and temporal resources.
- Especially the smaller administrative bodies do not have complete knowledge about their infrastructural heritage and their state of preservation, and they do not have a well-organized database with all information about the bridges that they manage.
- The processes of knowledge and management of existing bridges are made even more difficult by the great heterogeneity in terms of structural features, road traffic, and environmental conditions that characterize the Italian asset, also considering that there are some cases, such as prestressed concrete bridges and structures characterized by high intrinsic fragility, that must be properly considered and addressed.
All these aspects highlight the necessity of having a structured and unique approach for the classification of risk and deriving managing and monitoring activities. Without this, it is not possible having a comprehensive and comparable view of the status of the infrastructures in the countries, making the organization of the economic sources and the rationalization of possible financial assistance from the government also difficult. In light of this, in Italy, in 2019, the Italian Ministry of Sustainable Infrastructures and Mobility appointed a committee of experts in this field responsible for drawing up the unified guidelines for the classification, risk management, safety evaluation and monitoring of existing bridges [21], from here-on called the Guidelines. The main aim was to define a complete and well-structured management system of the Italian bridges to be equally adopted by all road operators. The Higher Council of Public Works approved the guidelines in April 2020. A trial period of the guidelines on about 1000 Italian existing bridges was also carried out to validate and refine the proposed criteria and assumptions. As a result of this intensive activity, in 2022, the Italian Superior Council approved a new product called “Operating Instructions” [22], which is a commented version of the Guidelines, with practical information and strategies suggested for a clearer and guided application of the method.
The present paper describes, critically analyzes and comments on the content of the first part of the ministerial guidelines, the multilevel approach, focusing on the proposed classification methodology related to the structural and foundational risk and supplying background information that leads and supports the choices of the Ministerial Committee. This dissertation includes all the operating instructions, highlighting their support in the application of the procedure of the Guidelines. Finally, the application of the method is shown on a sample of more than 650 existing bridges, and a statistical analysis of the results obtained is proposed. Particular attention is paid to the vulnerability class and the influence of the various parameters for its definition.
2. The Multilevel Approach Proposed by Italian Guidelines
The Guidelines are organized into three main parts: the multi-level approach aiming at classifying the bridges on the base of a simplified multi-risk approach, the detailed safety level evaluation and the monitoring of bridges. The core part of the Guidelines is the multilevel approach, which overcomes the impossibility of analytically determining the risks of the whole Italian asset with reasonable time and accuracy. In the following, a detailed analysis of the approach as well as of the main reasons at the base of the technical choices are presented.
The Multilevel Approach
The multilevel approach is structured following the philosophy of rational use of resources (both time and economical) based on real identified needs. Indeed, the method is organized into six different levels, from Level 0 to Level 5, that progressively require increasingly complex and onerous activities, depending on the real need and urgency, which are detected for each bridge (Figure 1). It foresees first—for the lower levels—expeditious activities to be performed for all the existing structures, which allow the definition of a “Warning Class” for each bridge. This warning class is not a numerical index, but it is identified by a qualitative judgement. This warning class is first defined for four different sources of risk—the structural–foundational, seismic, hydraulic risk and the risk for landslides—and then gathered in a unique final warning class. This approach allows obtaining a synthetic qualitative judgement without losing the relevance of the different risk sources and the motivations for the resulting final class. The lower the class, the lower the risk level associated with the bridge. Based on this classification, specific consequent actions are suggested, dedicating the most accurate and detailed analyses (safety assessment and/or continuous or periodic monitoring) to only a limited number of selected bridges—those characterized by the higher warning classes. The core of the approach is, therefore, the classification method, which allows for obtaining a risk estimation for all the bridges and calibrating the subsequent activities of surveillance, monitoring, assessment and intervention.
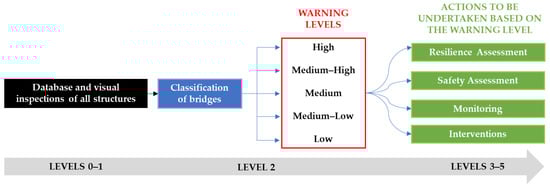
Figure 1.
Main steps of the multilevel approach.
According to the scheme in Figure 1, the lower levels (Levels 0, 1 and 2) are applied on a territorial macro-scale, and they do not require high economic and temporal efforts; the higher ones (Levels 3, 4 and 5) are applied on a reduced number of structures, selected through a classification method and which require a deeper effort and level of analysis.
The first activity foreseen by the multilevel approach is the creation of a database to collect as much information about the bridges as possible, to overcome the lack of knowledge and the progressive loss of information over time. Indeed, Level 0 foresees the census of all the bridges through the collection of the available documentation. Level 1 foresees the execution of visual inspections and expeditious surveys on all bridges to collect data about the conditions of the structure and its surrounding context. Exploiting the data collected in the first two levels, Level 2 allows classifying all the inspected bridges into the different warning classes, based on the parameters of hazard, vulnerability and exposure for different sources of risk (structural risk, seismic risk, hydraulic risk and risk of landslides). The choice of organizing the classification in “Warning classes” instead of “Risk Classes” reflects the intrinsic high uncertainties associated with the classification mostly due to the little information on which it is based. Indeed, the “Warning classes” are used to have a first, rational and global classification of the bridges mainly based on the state of damage at the moment of the inspection and on the base of other global characteristics of the bridges. The limits of such approach, especially evident for bridges in which the past experience has shown the possibility of sudden collapses or failures (e.g., post-tensioned decks, bridges with Gerber saddles, bridges in high landslide or hydraulic hazard zones, etc.), is considered by the Guidelines by requesting, for those bridges, “special inspections” aimed at better characterizing the vulnerability or hazard factors as better specified later.
On the base of the “Warning class” of the bridge, one of the subsequent levels of analyses shall be applied. Level 3 involves preliminary safety analyses to evaluate if more accurate analyses are necessary. Level 4 is focused on the accurate safety assessment according to the technical standards currently in force, but with specific indications for existing bridges, which are provided by the guidelines. Level 5 should be applied to bridges with significant importance in the road network, and it foresees sophisticated resilience analyses. This last level is not currently covered in detail by the guidelines.
From Level 0 to Level 5, the complexity, the detail level and the onerousness of investigations and analyses increase, but the number of bridges subjected to analysis and the involved uncertainties are reduced. All the levels are connected, according to the logic flow in Figure 2.
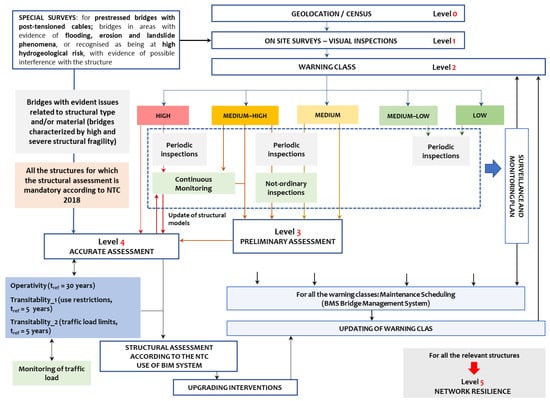
Figure 2.
Multilevel approach and connections between the different analysis levels [21].
As represented by the figure, the connection between the lower levels (Level 0 and Level 1), applied on a territorial macro-scale, and the more accurate and detailed higher levels (Level 3, Level 4 and Level 5) is Level 2, which is the core of the method and allows the organization of all the following activities, which go beyond the deeper analyses foreseen in Levels 3, 4 and 5, providing the strategies for the full management of the road system. Level 2 provides the classification of all bridges into five warning classes—high, medium-high, medium, medium-low, and low. Specific actions and measures are then identified for each warning class: for bridges with a high warning class, it is appropriate to immediately carry out continuous monitoring activities and accurate safety assessments as foreseen by Level 4; for bridges with a medium-high warning class, performing frequent inspections and preliminary safety evaluations of Level 3 are foreseen; this latter should be also applied for bridges with a medium warning class; finally, for bridges with medium-low and low warning classes, periodical investigations are foreseen. Periodic inspections and maintenance interventions, properly planned and performed, are recommended in any case, but their frequency and extent are calibrated based on the warning class resulting from the classification. Furthermore, these activities allow us to update the warning class over time.
3. The Classification Methodology
The high number of structures to manage and the need to optimize economic and temporal resources make the definition of a simple method of classification and the identification of bridges fundamental. The classification method should consider all the possible sources of risk with simple, rapid and low-cost procedures, to be applied to every structure and obtain a ranking of them. The ranking gives information about the urgency of the required controls and deeper—and more expensive—investigations. To overcome the limits of the already existing methodologies, the classification method foreseen by the Guidelines abandons numerical evaluations and numerical indices, and it uses a qualitative but objective approach.
The bases of the classification method are the results obtained from the activities of Levels 0 and 1, which shall be applied to all the structures, and the approach for the definition of the warning classes reflects the typical framework of the risk definition: it is based on the combination of hazard, vulnerability and exposure factors, which are defined differently for each different kind of assessed risk. These factors are defined by the combination of primary and secondary parameters, which are relevant for the definition of each specific risk, with the former considered to be more relevant than the latter, see Figure 3. In this way, not only the state of preservation is considered, but also other parameters, e.g., the ageing of the structure, the material of the structural elements, the static scheme, the design traffic loads, etc.
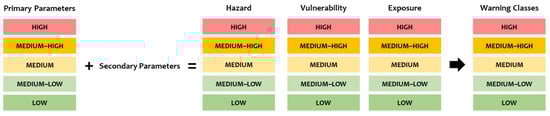
Figure 3.
Approach for the definition of warning classes.
The combination of the parameters and factors is performed through the use of easy logic flows. The choice of the guidelines of providing an intuitive methodology instead of calculating numerical indexes is based on the following main considerations:
- The classification methodology will be applied in everyday practice on a high number of structures. A methodology whose structure is simple to follow allows better control of the results and the individuation of the critical aspects that lead to that result.
- The graphical individuation of the level of hazard, vulnerability and exposure, as well as of the parameters that lead to that level, provides the management agency with relevant and clear information about the critical aspect characterizing the bridge.
- The evaluation of a numerical index could have given the false sensation of a high-precision method.
At the end of the procedure, four warning classes are determined for each inspected bridge: a structural and foundational warning class, a seismic warning class, a landscape warning class and a hydraulic warning class. These four classes are combined to obtain the final warning class of the bridges, useful to decide the subsequent steps of analysis, according to Figure 2. It should be pointed out that, although the final output of the method is a unique warning class, the structure of the method with the easy-to-apply flows allows us to better understand the relevant and critical parameters that affect the final obtained class and a better choice and calibration of the future actions. In this paper, a focus is made on the structural and foundational risk, providing a full explanation of the flow for the evaluation of the associated warning class, together with the main technical and scientific background referred to each step.
3.1. Structural and Foundational Risk
The structural and foundational risk is related to the service loads acting on bridges, especially the traffic loads, which stress bridges constantly during their daily service conditions. The associated warning class is defined by the combination of parameters of hazard, vulnerability and exposure related to the ordinary service conditions of the bridge, see Table 1.

Table 1.
Parameters for the definition of the structural and foundational warning class.
The parameters in Table 1 are selected based on the existing literature about the estimation of bridges’ structural risk and the professional experience of the ministerial committee members. All the identified parameters are easy to determine, exploiting only data provided by the original documentation (to be collected in Level 0) and the visual inspections (Level 1). Moreover, none of them requires numerical evaluations: qualitative criteria are established to define the class of each parameter and combine them to obtain a class of hazard, vulnerability and exposure for each bridge. This also allows us to easily evaluate all the parameters for all the types of bridges, despite the different materials, structural types, conservation statuses and locations. On the other hand, it should be noted that this method may be not conservative in case the structures are characterized by peculiarities or characteristics that make them not well represented in the classification procedure. The combination of these three classes, with a simple tabular approach, provides the structural and foundational warning class of the bridge (Table 4.10 of the Guidelines [21]). For each level of hazard, a slightly higher weight is given to the vulnerability class for the final definition of the warning class, the vulnerability class being the one closely related to the preservation state of the bridge. In this way, the critical situations related to a bad conservation status can be easily highlighted.
3.1.1. Hazard Factors
The hazard depends on the external actions (in terms of traffic load) that act on the structure. It is defined by the combination of the so-called “road class” and the frequency of transit of commercial vehicles with a mass exceeding a certain value—the “average daily traffic”.
The road class is based on any load limitation imposed on the bridge. This parameter is introduced due to the serious consequences of the transit of heavy-duty vehicles on the structural safety of bridges. Some of the most relevant bridge collapses—such as the collapse of the Italian bridge of “Annone Brianza”, Italy, which happened in 2016 [23]—were caused by the transit of overloaded vehicles. Obviously, the hazard induced by the transit of an overloaded vehicle depends on its frequency, which is easily obtainable knowing the average daily traffic of overloaded vehicles. This information is not always available to the road operators: traffic is easily monitored for motorways, but this hardly happens for lower category roads or roads managed by modest organizations. Thus, in case of not having this information, the Operating Instructions suggest proceeding with the classification by using the data from roads with the same category.
Table 2 defines the hazard class matching the road class with the average daily traffic. From this table, it can be noticed that in the case of Class A roads (meaning no load restrictions), even if the frequency of transit of commercial vehicles is not high, at least a medium-high vulnerability class is obtained. This happens frequently for motorway roads, which are usually also characterized by a high exposition class due to the high traffic level and the high medium-span length (Section 3.1.3).
Table 2.
Hazard class as a function of the road class and on the frequency of transit of commercial vehicles (Table 4.3 of the Guidelines [21]).
3.1.2. Vulnerability Factors
The parameters influencing the structural and foundational vulnerability are the typical ones that generally influence the vulnerability of structures and they are closely related to the structural characteristics of the bridge. They are the level of defectiveness, the degradation evolution rapidity, the standards adopted for the design and the structural scheme with the material and the highest span length. Figure 4 represents the correlation among these parameters and the logic flow for the evaluation of the vulnerability class.
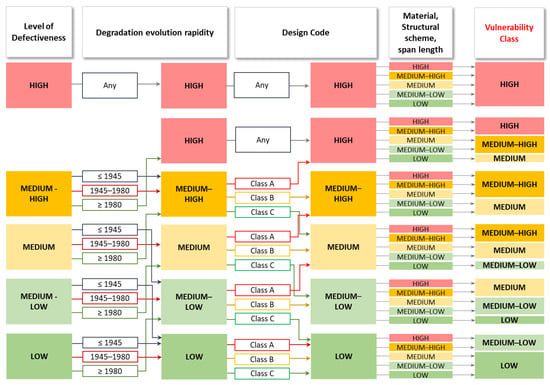
Figure 4.
Evaluation of the vulnerability class for the structural–foundational risk [21].
The most influencing parameter is the level of defectiveness (LD), which reflects the state of preservation of the structure. It is evaluated by the results of the visual inspections and the evaluation of the conservation status performed within Level 1. In this regard, the Guidelines provide some forms to be filled out by the inspector to facilitate the procedure of the visual inspections. There is a general form with the main characteristics of the bridge (location, structural type and scheme, material of the main components, representative views of the structure, main dimensions, etc.), and others dedicated to each structural component and containing all the possible defects. Each defect is defined by three indexes: the severity “G”, which is fixed and reflects the intrinsic criticality of the damage; the intensity “k1”, which has to be assessed by the inspector and describes the severity of the defect as observed in the bridge; the extension “k2”, which still has to be assessed by the inspector according to the dimensions of the defect compared to the element. Range values for both intensity and extension are provided.
Besides helping in pointing out all the defects, the forms also allow us to highlight the presence of critical elements or critical conditions: the former is a component characterized by a potential fragility and whose crisis may lead to the crisis of the entire structure or of a portion of it, or to the loss of functionality of the structure (i.e., dapped-ends, high carbon steel cables, etc.); the latter is a condition of possible collapse due to the presence of numerous or dangerously located defects with high or medium-high severity (G = 5 or G = 4) and high intensity and extension. The individuation of the presence of critical elements together with the detected damages and/or critical conditions is fundamental to immediately distinguish the most critical structures, thus they should be properly highlighted by the inspector.
In this way, the inspection procedure, identification and evaluation of defects are standardized and allow us to have a fully objective view of the degradation phenomena of the structure for a better evaluation of the LD. The defectiveness is not evaluated through a numerical index, as the BCI mentioned in Section 1, but it is classified into five classes—high, medium-high, medium, medium-low, and low—depending on the detected defects with the associated gravity, intensity and extent, and their position in the structural element. Together with the general indications for the definition of the LD, which are given in Table 4.5 of the Guidelines [21], the Operating Instructions suggest a detailed procedure for its evaluation: (i) evaluation of the LD for each structural component; (ii) grouping the elements in sub-structures and assignment of the respective LD; and (iii) definition of the global LD—for the whole structure. In step (i), the LD is defined for each structural component, based on the number and type of defects, their gravity, intensity and extension. In this regard, the Operating Instructions associate to each LD (low to high) the relative combination of defects and characteristics. As an example, an element has a high LD if its defects are characterized by severity, intensity, extent and position such that they lead to possible and potential incipient failure of the element itself and/or the entire structure. In this category, there are also critical elements with high severity (G = 5 or G = 4) and whatever intensity and extension defects, or the detection of critical conditions such as to jeopardize the statics of the structure. The second step (ii) consists in grouping the elements in the relevant sub-structures (e.g., beams and slab belonging to the same span are grouped in “span 1 elements”, “span 2 elements”, etc., pillars and supporting devices located on those pillars are “pillar 1 elements”, “pillar 2 elements”, etc.), and associate to each sub-structure a LD, based on the LDs of the belonging structural elements. In particular, if at least one of elements has a medium-high or high LD, the sub-group has, respectively, a medium-high or high LD, while if all the elements are characterized by medium to low LDs, it depends on the number of elements having medium, medium-low or low LD. Finally, the third step is the evaluation of the global LD, which corresponds to the highest LD among the sub-structures.
In the case of a high level of defectiveness, the class of vulnerability is automatically high, regardless of the other parameters. Examples of these kinds of defects are presented in Figure 5. This approach allows us to immediately recognize the critical situations and avoids giving too much importance to bridges with numerous but much less serious degradation phenomena. The medium-high LD is associated with the presence of defects with severity, intensity and extension that may compromise the static functioning and structural behavior of the structure, but that can still be controlled through monitoring systems, pending the implementation of any remedial measures. In the lower LDs, there are structures with defects characterized by severity, intensity and extension such that the static behavior of the components and the structure is not compromised. In general, the lower the level, the lower the gravity/intensity/extension of the majority of the defects individuated.
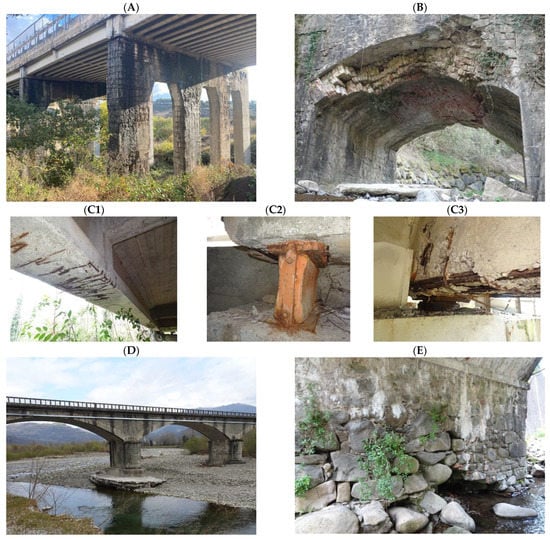
Figure 5.
Defects on bridges that may imply a high level of defectiveness. (A) Prestressed RC simply supported deck on RC frames: detachment of concrete cover from pillars along the whole height, with reduction of the cross section; corrosion of the rebars; Reduction of the support area of the beams due to detachment of concrete cover, both in beams and pillars. (B) Masonry arch: Rotation of the right abutment of the bridge, inducing compression on the arch, and resulting on extreme damage in its central part. (C) RC simply supported decks on RC pillars: (C1) Reduced concrete cover, with exposure of rebars; (C2) Corrosion of rebars, with reduction of section of the longitudinal ones and breaking of the transversal ones; (C3) Complete oxidation and blocking of the supporting devices. (D) Masonry arches: erosion of the basement of the pillar. (E) Masonry arches with abutments made of irregular stone: erosion of the base of the abutment.
The Operating Instructions suggest to proceed with the evaluation of the LD for each component, and then grouping all the components belonging to a span (distinguishing the elements of the substructure and those of the deck) and associating a unique LD: if only one component has a high or medium-high LD, the LD of the group is high or medium-high, respectively. On the other hand, for lower levels, it depends on the numerousness of components: if more than 50% of the components are characterized by the medium level, the LD of the group is medium; otherwise, it is medium-low or low based on the majority of elements belonging in one of the two classes. The LD of the whole structure is the highest among the ones obtained for all the groups of elements.
The procedure for the evaluation of the LD of the whole structure suggested by the Operating Instruction succeeds in providing objectivity and standardization to the procedure for the assessment of the level of defectiveness. Besides, the resulting LDs are fully comparable among all the structures, although the approach is qualitative and not summarized in a single coefficient.
After the evaluation of the LD, it is firstly corrected with the parameter related to the degradation evolution rapidity. It is determined considering the building period of the bridge, known or supposed, which can be before 1945, between 1945–1980, and after 1980. The class resulting from matching the LD with the building period is defined by presuming that, for the same LD, more recently built bridges are more worrying than less recently built ones because it means that the evolution of the degradation was faster. This assumption is schematically described in Figure 6. This procedure, which is reasonable for recent structures with poor conservation status, risks penalizing the new ones with good conservation status, instead. In this regard, the Operating Instructions provide that the recently built structures designed with standards in force from 2005, with low or medium-low LD and with some technical documentation at disposal (the original design, the report on the complete structure with the relevant checks, the static acceptance certificate and, if necessary, the technical–administrative acceptance certificate) can be directly associated to a low vulnerability class.
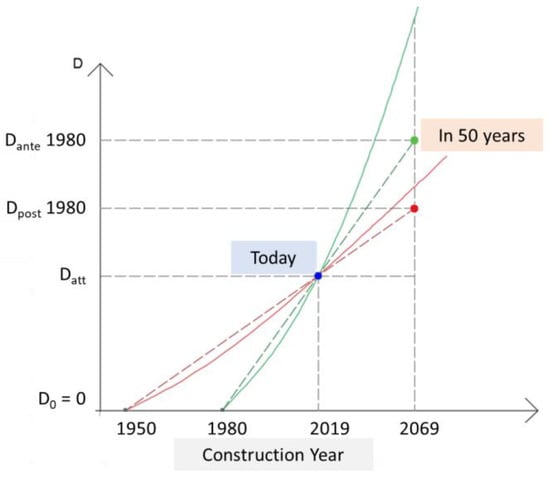
Figure 6.
The degradation D evolution over the years.
After the degradation evolution rapidity, the design standards are considered. They are classified into three classes, considering the changes in standards over time and, in particular, of the traffic loads. Indeed, if the Italian standards in force over the years are analyzed starting from the first one—i.e., Normale n. 8 issued in 1933—the values and the schemes of the design traffic loads have been modified, following also the change of vehicles passing on the roads, with an increasing caution in the definition of values and safety factors. The ratio between the maximum bending moment due to the traffic loads currently provided by the Italian technical standards [24] and the maximum bending moment due to the traffic loads foreseen by the standards in force over the years evaluated for a simply supported beam is shown in Figure 7. This figure shows one of the outcomes of a parametric study [25], where the values of the bending moment due to the traffic load defined accordingly to various standards and acting on an isostatic system (a simply supported beam) are compared to the value of the effect due to the traffic load calculated by adopting the currently in force Italian Standards [24]. In this study, four span lengths (from 5, 10, 15, 20 m) structures with 9 m wide decks (meaning a driveway width of 7 m and two one-meter-large sideways) are investigated; these parameters are selected based on the most recurrent and representative configurations for the Italian existent reinforced concrete bridges. The figure, in particular, represents the ratios obtained for the 5 m-long ones. The ratio is close to 1 only for the standards in force from 1980 until now, whereas it is higher than 1 for the less recent standards. It means that, at least before 1980, the new bridges were designed with traffic loads lower than those foreseen now; therefore, bridges built less recently have a lower safety level with respect to the actual traffic loads. Similar considerations can be performed for the other bridge configurations investigated.
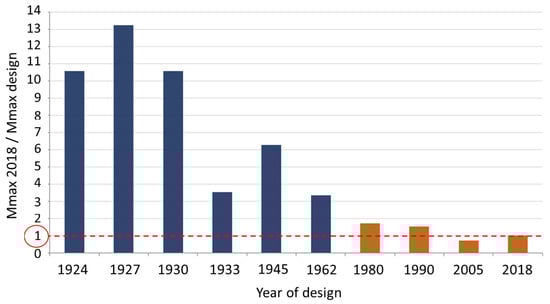
Figure 7.
Ratio between the maximum bending moment due to the traffic loads, currently provided by the Italian technical standards, and the maximum bending moment due to the traffic loads foreseen by the standards in force over the years, evaluated for a simply supported beam.
Finally, the final factors to be taken into consideration for the evaluation of the vulnerability class are the material, the static scheme, and the maximum span length, meaning that the final class of vulnerability is affected by the redundancy of the structural typology, the susceptibility to brittle crises and the sensitivity of the structural materials to degradation phenomena. The last modification of the vulnerability class can be performed if the number of spans involved in a possible collapse mechanism is higher than 3. In this case, an increase of the class by one is suggested to consider the increment of vulnerability when multiple substructures can be irreparably damaged by a unique event.
3.1.3. Exposure Factors
The last factor for the definition of the structural and foundational class is exposure, which is related to the other elements besides the bridge that are exposed to the risk of being damaged in case of structural failure or damage of the bridge. The logic flow to the definition of the exposure class is shown in Figure 8.
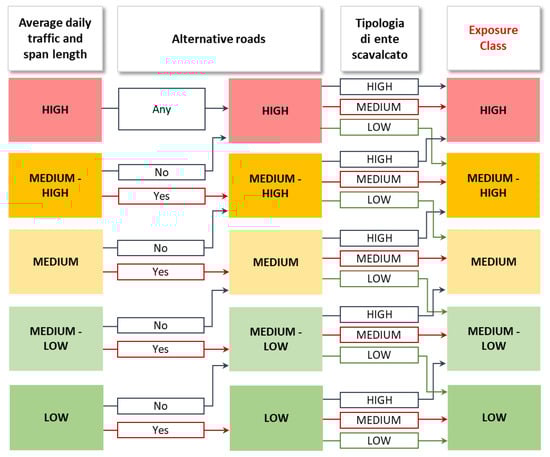
Figure 8.
Logic flow for the evaluation of the exposure class [21].
The main influencing parameters, which are considered in the first step of the procedure, are related to the traffic flows passing on the bridge, in terms of vehicles number per day (the average daily traffic, considering all the vehicles), and the bridge span length, considering that as the span length increases, the exposure time for the road users increases, too. Table 3 shows how to match these two parameters.
Table 3.
Exposure class: matching the average daily traffic with the medium span length of the bridge.
The class obtained by this first step then becomes higher if there are no proper alternative routes in case of failure or closure of the bridge (step 2 of Figure 8), and is then adjusted according to the typology of the crossed obstacle (final step of Figure 8). The presence of proper alternative routes provides preliminary information about the resilience of the road network and the ability of the management agency to address an unforeseen situation. The typology of the crossed obstacle is introduced to consider the economic and social consequences of a possible collapse of the bridge on the obstacle itself. In case of collapses, different scenarios can be easily imagined if there is an untouched valley or an urbanized area under the bridge (the Polcevera bridge collapse is an example).
The obtained exposure class should also consider the high frequency of transit of vehicles carrying dangerous goods, if any. It should be taken into consideration only if such vehicles routinely pass over the structure, for example because of the proximity of production facilities of the carried substances or because the structure is on an inter-route between production facilities. It does not directly influence the class of exposure, but it allows us to determine an order of priority between bridges with the same structural warning class.
3.1.4. Evaluation of Structural-Foundational Warning Class
The evaluation of the structural–foundational warning class is made by combining the vulnerability, hazard and exposure factors previously determined. The Guidelines provide five tables for the different levels of hazard, and in each table exposure and vulnerability are combined (Table 4.10 of the Guidelines [21], and in this paper Table 4 represents the case of high hazard). In particular, 53 combinations have been considered, even if the final effective number is reduced due to the different weights of the factors in the definition of the final warning class. In particular, the most relevant factor is the vulnerability class of the bridge: if it is high, the warning class is high despite the value of the other two factors. This is because vulnerability is strictly connected to the level of defectiveness of the structure, and so, all else being equal, a bridge with a critical conservation status should have high priority.
Table 4.
Evaluation of the structural–foundational warning class in case of high hazard.
Another comment should be made about the influence of the hazard parameter in the final structural–foundational warning class. In the Section 3.1.1 and Table 2, it was highlighted that in the case of Class A roads (meaning no load restrictions), even if the frequency of transit of commercial vehicles is not high, at least a medium-high vulnerability class is obtained. This is often the case for motorway roads, which are usually also characterized by a high exposition class due to the high traffic level and the high medium-span length (Section 3.1.3). In this case, looking at Table 4.10 of the Guidelines [21] about the final evaluation of the structural–foundational warning class, it may be easy for such roads to obtain a medium to a high structural–foundational warning class, depending on the vulnerability class. Starting from these considerations, in the process of classification it is relevant to highlight the root of the final warning class to better and rationally establish a priority of intervention, especially for structures with the same warning class. For example, if there are two bridges with a high structural–foundational warning class, but the former is characterized by a high vulnerability and a medium hazard, while the latter by a medium vulnerability and a high hazard, priority could be given to the former since vulnerability can be considered more critical, being directly connected to a critical level of damage. In general, as suggested by the Operating Instructions, the vulnerability class can be used to weigh the scales in cases of structures with equal structural–foundational warning classes, and this is helpful given the high number of structures to be handled by only one road manager and the high possibility of having many bridges with the same warning class.
4. Applications and Critical Analysis of the Classification Method
The method for the definition of structural warning classes is currently being applied to many bridges all over Italy. The authors themselves are using this method, as proposed by the Guidelines and the Operating Instructions, for the classification of many bridges belonging both to the Italian provincial roads and highways, now with a data sample of 661 bridges. The analyzed bridges are mostly located in the Tuscany region (96.0%), and the rest are mostly equally distributed in Liguria (1.5%), Sardinia (1.0%) and Calabria (1.5%). Although they are mostly concentrated in one region, they are well-distributed in the Tuscany territory, which is characterized by a varied orography, going from the coast to the mountains, which makes them rather representative from the point of view of the environmental conditions to which they are subjected. For a matter of confidentiality, it is not possible to insert a more precise location of the structures.
The structural warning class of a bridge is strongly affected by two main aspects: (1) the classification process described by the Guidelines and the Operating Instructions, and (2) the initial specific characteristics and condition of the bridge at the time of the survey.
Indeed, the classification process, as depicted in Table 2, and Figure 4 and Figure 7, defines the “path” that relates the characteristics and condition of the bridge at the time of the survey to the hazard, vulnerability, exposure and, finally, structural warning classes, strongly biasing the final results. The vulnerability class definition process, in particular, is influenced by several factors (Level of Defectiveness, Degradation Evolution, Design Standard, and Material together with Structural scheme and the maximum Span length—MSS), which do not have the same weight in the final vulnerability class. Just to give an example, all the bridges with a high level of defectiveness obtain a high vulnerability class independently by all the other factors. On the other hand, not all the possible combinations of the abovementioned factors are likely to be found in real bridges and, therefore, the initial specific characteristics of the bridge and condition at the time of the survey also have a strong influence. To understand this point, it is sufficient to think about masonry bridges: it is very uncommon to find this type of bridge built after 1945 or concrete bridges built before the same year.
To highlight the influence of these two aspects, in the following, the vulnerability class of two sets of bridges is analyzed: the first set, called the “uniform” sample, is obtained, assumed to have one bridge for each possible combination of the logic flows to the vulnerability class; the second set, called the “real” sample, consists of the 661 bridges inspected by the authors.
The “uniform” sample is composed of 225 items (corresponding to all the possible combinations for the vulnerability class), distributed uniformly among the three construction periods (33% for each one). For each construction period, they still are distributed uniformly among the MSS classification (for each construction period, 20% for each MSS class). The “real” sample is composed of 661 structures, among which 45% were built before 1945, 42% between 1945 and 1980, and 13% after 1980. For each construction period, the MSS class is not uniformly distributed due to the different use in years of material and structural schemes thanks to the development of new structural and constructive technologies. This is confirmed by the analysis of the distribution of the structures in terms of deck material and structural scheme in the three construction periods. Figure 9 represents the “real” sample, distinguishing for each construction period the number of structures for the different deck materials. For each group of deck material, the amount of structures characterized by different levels of vulnerability due to material, structural scheme and span length (step 4 to the evaluation of vulnerability class, Figure 4) are highlighted. Figure 10 is a detailed version of Figure 9, since for each deck material, the structures are grouped in the different structural types. In Figure 9, it can be noticed that most of the structures of the sample were realized before 1980, and only 13% were indeed built after 1980. Despite this, masonry bridges were widely used before 1945, while afterward (1945–1980) concrete technology became relevant. After 1980, with the spreading of new construction techniques (e.g., prestresses RC decks), simple RC structures became less adopted.
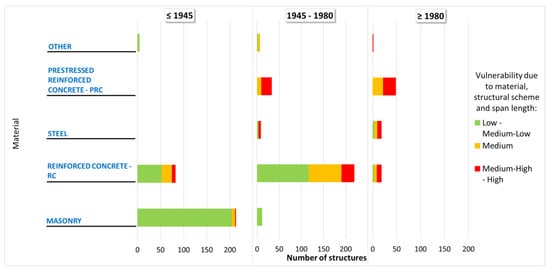
Figure 9.
Deck material of the bridges for each construction period for the “real” sample. Vulnerability of the MSS (Material, Structural scheme, and Span length) is highlighted.
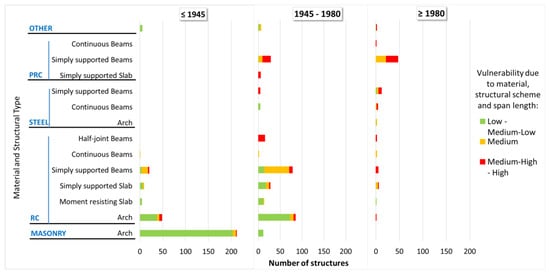
Figure 10.
Deck material and structural scheme of the bridges for each construction period. Vulnerability of the MSS (Material, Structural scheme, and Span length) is highlighted (PRC—Prestressed Reinforced Concrete; RC—Reinforced Concrete).
In the construction periods, and for each material, the percentage of bridges characterized by more vulnerable MSS classes increases with time, thanks to the upgrade of the already-in-use technologies (RC structures) and the development of others (prestressed RC decks), which allow reaching longer spans (meaning more vulnerable bridges, if referring only to the MSS classification), as shown in Figure 10.
The “real” and “ideal” sample data are then processed following the same approach, which considers and attempts to make explicit the influence of the main parameters that determine the vulnerability class: (1) the Level of Defectiveness (LD); (2) the construction period (related to the Degradation Evolution); and (3) the material together with the structural scheme and the maximum span length (MSS). In this analysis and for the sake of simplicity, the influence of the design normative codes has not been made explicit, since it is usually coherent to the construction period. The strategy for the analysis of all the data (both the “real” and uniform sample) is the following:
- First output: the percentage of bridges characterized by the low to high vulnerability classes, separating the sample in the function of the construction period (≤1945, 1945–1980, ≥1980). For each class, the level of defectiveness of the bridges is highlighted.
- Second output: for each construction period, the percentage of bridges characterized by the low to high vulnerability classes, separating the sample in the function of the vulnerability of the material together with the structural scheme and maximum span length (3 groups: low and medium-low, medium, medium-high and high). For each class, the level of defectiveness of the bridges is highlighted.
Figure 11 represents the first output of the analysis; indeed, the sample is analyzed by separating the structures by different construction periods. For each group, the percentages of structures characterized by different vulnerability classes are given, highlighting for each class the percentages of structures with different levels of defectiveness. Looking at the first output on the uniform “ideal” sample (Figure 11a), it can be noticed that:
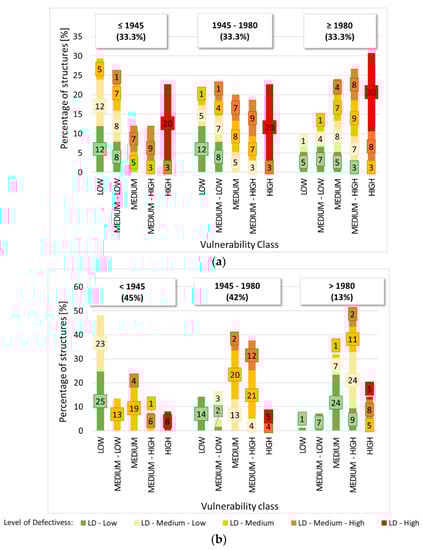
Figure 11.
First output: (a) Uniform sample and (b) “real sample”. For each construction period, the percentage of structures characterized by low to high vulnerability classes. The level of defectiveness is highlighted.
- For all the construction periods, the LD is the unique significant parameter for the vulnerability class in case of high defectiveness. This reflects the idea that if a structure is highly damaged (ongoing mechanism that may induce the collapse of the structure), the necessity of intervention is urgent and that structure becomes primary, independently from other parameters.
- For the construction periods <1980, the medium-high LD bridges tend to belong to the medium and medium-high vulnerability classes, while for the ≥1980 one they tend to the medium-high and high ones. This may be related to the influence of the speed of degradation, which reasonably tends to penalize the recently designed and built structures characterized by relevant damage.
- For all the construction periods, the medium LD bridges are widely distributed among the vulnerability classes. This variability is related to the vulnerability induced by the material, structural scheme and span length. In addition to this, for the construction period ≥1980, the high vulnerability class can be reached due to the influence of the speed of degradation.
- For the construction periods <1980, low to medium-low LD bridges are characterized by low or medium-low vulnerabilities, with a very limited influence of the vulnerability due to the MSS parameters. The classification process is indeed more controlled by the vulnerability induced by the speed of degradation, which do not penalize less recent bridges with not relevant damage. For the construction period ≥1980, a wider distribution can be noticed among the vulnerability classes, and this is also due to the influence of the speed of degradation, which in this case negatively affects the judgement of the vulnerability class.
All these considerations can be highlighted also by Figure 12a, Figure 13a and Figure 14a, which represent the previously introduced second output of the analysis and provide a deeper representation of the sample with respect of Figure 11. Indeed, each figure analyses the structures belonging to the different construction period, and in each one, the structures are again separated for the different value of the parameter “vulnerability class induced by material, structural scheme and span length”. For each group, the percentages of structures characterized by the different vulnerability classes are provided, also highlighting the level of defectiveness of the structures.
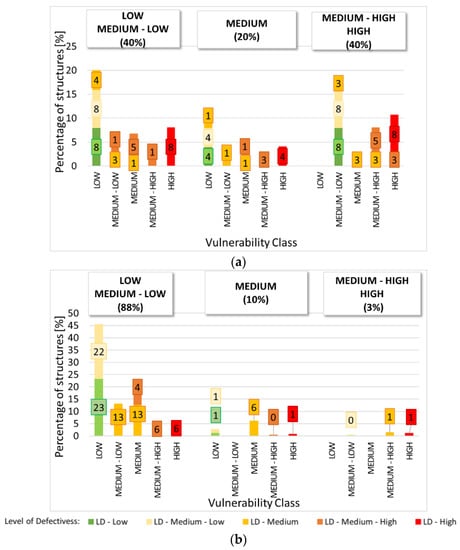
Figure 12.
Second output: (a) Uniform sample and (b) “real” sample. For the ≤1945 construction period and for each class for the MSS, the percentage of structures characterized by low to high vulnerability classes. The level of defectiveness is highlighted.
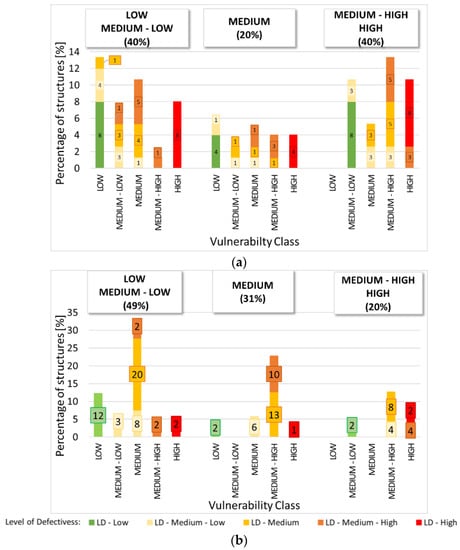
Figure 13.
Second output: (a) Uniform sample and (b) “real” sample. For the 1945–1980 construction period and for each class for the MSS, the percentage of structures characterized by low to high vulnerability classes. The level of defectiveness is highlighted.
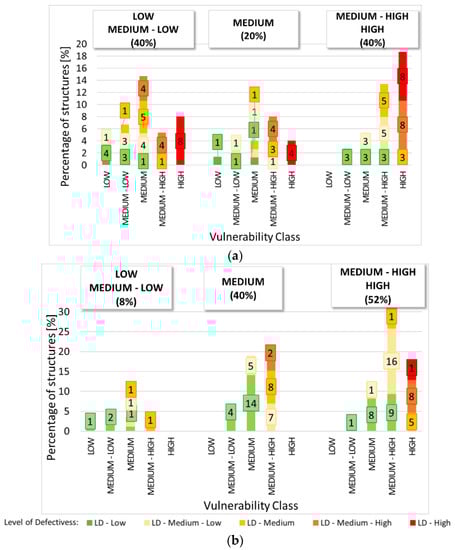
Figure 14.
Second output: (a) Uniform sample and (b) “real” sample. For the ≥1980 construction period and for each class for the MSS, percentage of structures characterized by low to high vulnerability classes. Level of defectiveness is highlighted.
Looking at the “real” sample (Figure 11b), it can be noticed that the structures built before 1945 are mostly characterized by a low vulnerability class, while those after 1945 mostly belong to the medium and medium-high ones. In particular, for those realized after 1980, the effects of the vulnerability from the MSS and due to the speed of degradation are evident. This is highlighted even more in the second output shown in Figure 12, Figure 13 and Figure 14.
In these figures, for each construction period, bridges characterized by different levels of vulnerability due to the MSS factors are separated into three groups: low and medium-low; medium; medium-high and high. For each class, the level of defectiveness of the bridges is highlighted. For each MSS group, the percentages are calculated with respect to the number of structures belonging to that group.
Looking at the post-process of the “uniform” sample, Figure 12a, Figure 13a and Figure 14a make clearer and confirm the deductions made from the first output.
Referring to the post-process of the “real” sample, it can be noticed a clear correlation between Figure 12b, Figure 13b and Figure 14b, and between Figure 9 and Figure 10, which represent decks materials and structural schemes within the construction periods:
- The bridges built ≤1945 (Figure 12b) are mainly characterized by low and medium-low MSS class, with a higher percentage of structures with low to medium vulnerability classes. Looking at Figure 10, most bridges belonging to this construction period are masonry arches, which fall mainly in the low MSS. Moreover, for the same group of bridges, Figure 12a,b show a similar distribution of the uniform “ideal” and the “real” sample, with some difference only for the high vulnerability, highlighting that this real sample well characterizes and represents this construction period.
- The bridges built within the 1945—1980 period are mainly constituted of structures with a low to medium MSS class. Most of these structures are indeed made of RC decks, and the vulnerability of such structures can vary significantly with the structural schemes and maximum span length, which is highlighted in Figure 10.
- The bridges built after 1980 are mainly characterized by prestressed RC bridges, with structural schemes and span lengths that make them belong to the medium-high and high MSS class. Although this part of the sample is not as numerous as those of the other periods, it can be noticed again that the “real” sample bridges with the medium-high and high SMM class share a similar distribution with the same category of the “ideal” sample, with some difference only for the high vulnerability due to a high LD, suggesting that this real sample may characterize and represent this construction period well.
5. Conclusions
This paper gathers a critical analysis first on the definition and then on the application of the multilevel approach for the management of the existing bridges, as proposed by the Italian “Guidelines for the classification and management of risk, for the structural assessment and monitoring of existing bridges” [21] and the early published “Operating Instructions” [22]. Focus is made specifically on the classification process (from Level 0 to Level 2 activities), and so on the parameters for the evaluation of the Structural Warning Class.
In the first part of this paper, the motivations and the criteria that receive the bases to the logic flows for the definition of the hazard, the vulnerability and the exposure classes are shown and discussed. Additional comments are made on the suggestions made by the Operating Instructions, which support the classification activities and the decision-making process of the operators that use the method.
In the second part of the paper, a statistical study of a real sample of more than 650 classified existing bridges is performed, focusing in particular on the vulnerability class. This analysis is compared to the same statistical post-process of a uniform sample of bridges, assuming to have one bridge for each possible combination of the logic flows to the vulnerability class. The uniform sample provides a visual acknowledgement of the influence of the parameters on the vulnerability class and has some correlations with the “real” sample, confirming that this one, for some categories and some construction periods, may be significative and representative. This is connected to use in the years of different deck materials and to the development of new construction techniques, which allow reaching longer spans, which are intrinsically more vulnerable if compared to those built before.
Author Contributions
Conceptualization, W.S. and F.M.; methodology, W.S. and F.M.; data curation, A.N. and A.C.; writing—original draft preparation, A.N. and A.C.; writing—review and editing, F.M.; supervision, F.M.; funding acquisition, F.M. All authors have read and agreed to the published version of the manuscript.
Funding
This work is supported by the University of Pisa under the “PRA—Progetti di Ricerca di Ateneo” (Institutional Research Grants)—Project no. PRA_2020_2021_41 “Resilience of small historical urban centers and transportation networks”.
Data Availability Statement
The data presented and included in the last part of the paper have been collected in several collaborations with Public Institutions or Road Managers. The clean version of the data is so unavailable due to privacy restrictions.
Acknowledgments
The authors are also grateful for the efforts and for the detailed work made by the two anonymous reviewers that helped in significantly improving the quality of the paper.
Conflicts of Interest
The authors declare no conflict of interest.
References
- Frangopol, D.M.; Dong, Y.; Sabatino, S. Bridge Life-Cycle Performance and Cost: Analysis, Prediction, Optimisation and Decision-Making. Struct. Infrastruct. Eng. 2017, 13, 1239–1257. [Google Scholar] [CrossRef]
- Tan, J.-S.; Elbaz, K.; Wang, Z.-F.; Shen, J.S.; Chen, J. Lessons Learnt from Bridge Collapse: A View of Sustainable Management. Sustainability 2020, 12, 1205. [Google Scholar] [CrossRef]
- Deng, L.; Wang, W.; Yu, Y. State-of-the-Art Review on the Causes and Mechanisms of Bridge Collapse. J. Perform. Constr. Facil. 2016, 30, 04015005. [Google Scholar] [CrossRef]
- Diaz, E.E.M.; Moreno, F.N.; Mohammadi, J. Investigation of Common Causes of Bridge Collapse in Colombia. Pract. Period. Struct. Des. Constr. 2009, 14, 194–200. [Google Scholar] [CrossRef]
- Lee, G.C.; Mohan, S.; Huang, C.; Fard, B.N. A Study of US Bridge Failures (1980–2012); MCEER: Buffalo, NY, USA, 2013. [Google Scholar]
- Cook, W.; Barr, P.J.; Halling, M.W. Bridge Failure Rate. J. Perform. Constr. Facil. 2015, 29, 04014080. [Google Scholar] [CrossRef]
- Cao, R.; Agrawal, A.K.; El-Tawil, S. Overheight Impact on Bridges: A Computational Case Study of the Skagit River Bridge Collapse. Eng. Struct. 2021, 237, 112215. [Google Scholar] [CrossRef]
- Zhang, G.; Liu, Y.; Liu, J.; Lan, S.; Yang, J. Causes and Statistical Characteristics of Bridge Failures: A Review. J. Traffic Transp. Eng. (Engl. Ed.) 2022, 9, 388–406. [Google Scholar] [CrossRef]
- Hawk, H.; Small, E.P. The BRIDGIT Bridge Management System. Struct. Eng. Int. 1998, 8, 309–314. [Google Scholar] [CrossRef]
- Estes, A.C.; Frangopol, D.M. Updating Bridge Reliability Based on Bridge Management Systems Visual Inspection Results. J. Bridge Eng. 2003, 8, 374–382. [Google Scholar] [CrossRef]
- Bao, C.; Lu, Y.; Shang, J.-C. Framework and Operational Procedure for Implementing Strategic Environmental Assessment in China. Environ. Impact Assess. Rev. 2004, 24, 27–46. [Google Scholar] [CrossRef]
- American Association of State Highway and Transportation Officials. The Manual for Bridge Evaluation; American Association of State Highway and Transportation Officials: Washington, DC, USA, 2019. [Google Scholar]
- Woodward, R.; Cullington, D.W.; Daly, A.F.; Vassie, P.R.; Haardt, P.; Kashner, R.; Astudillo, R.; Velando, C.; Godart, B.; Cremona, C. Bridge Management in Europe—Final Report; BRIME PL97-2220; European Commission under the Transport RTD, 4th Framework Program: Brussels, Belgium, 2001. [Google Scholar]
- Stipanovic, I.; Chatzi, E.; Limongelli, M.; Gavin, K.; Bukhsh, A.Z.; Palic, S.S.; Xenidis, Y.; Imam, B.; Anzlin, A.; Zanini, M.; et al. Performance Goals for Roadway Bridges; Taylor & Francis: Abingdon, UK, 2017. [Google Scholar]
- Ceccotti, A.; Giangreco, E.; Jurina, L.; Martinello, S.; Siviero, E.; Tattoni, S.; Bruson, R.; Bruson, M.; Caramel, G.; Malisardi, L.; et al. Manuale Valutazione dello stato dei Ponti, 2011th ed.; Centro Internazionale di Aggiornamento Sperimentale-Scientifico: Bolzano, Italy, 2011. [Google Scholar]
- Montepara, A.; Merusi, F.; Giuliani, F. Sviluppo di una Nuova Metodologia per la Valutazione delle Priorità di Intervento di Manutenzione di Ponti e Viadotti. In Proceedings of the 17° Convegno Nazionale della Società Italiana Infrastrutture Viarie, Udine, Italy, 23–24 November 2011. [Google Scholar]
- Franchetti, P.; Pellegrino, C.; Soffiato, A.; Modena, C. La manutenzione programmata di ponti e viadotti: Criteri per la valutazione dell’efficienza in servizio. In Proceedings of the XII CONVEGNO NAZIONALE S.I.I.V., Padova, Italy, 30–31 October 2003. [Google Scholar]
- ANAS Gruppo FS Italiane. Relazione di Sintesi sulle Attività di Vigilanza di Ponti e Viadotti; ANAS: Rome Italy, 2018. [Google Scholar]
- Strategies for Testing and Assessment of Concrete Structures; CEB Bulletin No. 243; Comite Euro-International du Beton (CEB): Lausanne, Switzerland, 1998.
- Tarighat, A.; Miyamoto, A. Fuzzy Concrete Bridge Deck Condition Rating Method for Practical Bridge Management System. Expert Syst. Appl. 2009, 36, 12077–12085. [Google Scholar] [CrossRef]
- Linee Guida per la Classificazione e Gestione del Rischio, la Valutazione della Sicurezza ed il Monitoraggio dei Ponti Esistenti; Ministero delle Infrastrutture e dei Trasporti: Rome, Italy, 2020.
- Istruzioni Operative per L’applicazione delle Linee Guida per la Classificazione e Gestione del Rischio, la Valutazione della Sicurezza ed il Monitoraggio dei Ponti Esistenti; ANSFISA: Rome, Italy, 2022.
- Bazzucchi, F.; Restuccia, L.; Ferro, G. Considerations over the Italian Road Bridge Infrastructure Safety after the Polcevera Viaduct Collapse: Past Errors and Future Perspectives. Frat. Integrità Strutt. 2018, 12, 400–421. [Google Scholar] [CrossRef]
- Norme Tecniche per le Costruzioni; Ministero delle Infrastrutture e dei Trasporti, Gazzetta Ufficiale della Repubblica Italiana: Rome, Italy, 2018.
- Buratti, G.; Cosentino, A.; Morelli, F.; Salvatore, W.; Bencivenga, P.; Zizi, M.; Matteis, G.D. Alcune considerazioni sull’evoluzione normativa dei carichi da traffico nella progettazione dei ponti stradali in Italia. In Proceedings of the XVIII CONVEGNO ANIDIS “L’Ingegneria Sismica in Italia”—Associazione Nazionale Italiana di Ingegneria Sismica, Ascoli Piceno, Italy, 15–19 September 2019. [Google Scholar]
Disclaimer/Publisher’s Note: The statements, opinions and data contained in all publications are solely those of the individual author(s) and contributor(s) and not of MDPI and/or the editor(s). MDPI and/or the editor(s) disclaim responsibility for any injury to people or property resulting from any ideas, methods, instructions or products referred to in the content. |
© 2023 by the authors. Licensee MDPI, Basel, Switzerland. This article is an open access article distributed under the terms and conditions of the Creative Commons Attribution (CC BY) license (https://creativecommons.org/licenses/by/4.0/).